コスモエネルギーホールディングス株式会社 証券コード【5021】 2026.8.6 2026年度第1四半期決算 2 2026 1Q ©︎COSMO ENERGY HOLDINGS 目次 P. 3 –5 2026年度第1四半期決算ハイライト 代表取締役常務執行役員 松岡泰助 1 P. 6 –12 2026年度第1四半期決算概要…
コスモエネルギーホールディングス株式会社
証券コード【5021】
2026.8.6
2026年度第1四半期決算
2
2026 1Q
©︎COSMO ENERGY HOLDINGS
目次
P. 3 –5
2026年度第1四半期決算ハイライト
代表取締役常務執行役員
松岡泰助
1
P. 6 –12
2026年度第1四半期決算概要
常務執行役員
岩井智樹
©︎COSMO ENERGY HOLDINGS
2026 1Q
3
2026年度第1四半期決算ハイライト
4
2026 1Q
©︎COSMO ENERGY HOLDINGS
中東情勢緊迫化後の当社の取り組み
⚫石油事業では、国家備蓄、代替原油および製品の調達を着実に進め、安定供給を継続。
⚫石油開発事業では、人的・物的被害はなし。産油国とも連携し通常操業に向けた取り組みを推進。
石油事業
原油調達ルートの多様化を通じて安定供給を継続通常操業に向けた取り組みを推進
石油開発事業
メキシコ産原油の調達
米国産原油の調達
中東産原油の調達
人員の
現地復帰
産油国との
連携
通常操業へ
5
2026 1Q
©︎COSMO ENERGY HOLDINGS
2026年度第1四半期決算 ハイライト
⚫経常利益は1,330億円、在庫影響を除く経常利益は1,221億円。当期純利益は840億円、在庫影響を除く当期純利益は763億円。
⚫中東情勢の緊迫化に伴い、原油調達から受入までの期間が平時より長期化し、タイムラグ影響の現れ方が変化。
⚫第1四半期は、油価高騰前の原油を受け入れたことによる正のタイムラグ影響に加え、四品外の海外市況が高水準で推移したことにより
収益が拡大。
⚫第2四半期以降は中東情勢緊迫化後の原油の受入により負のタイムラグが発生することで、第1四半期のプラス影響は縮小していく想定。
5月公表の通期計画は据え置く。
単位:億円単位:億円
2026年度2025年度2026年度
第1四半期第1四半期通期計画
1
経常利益
1,330421,2881,150
2
当期純利益
840▲ 20860440
3
(在庫影響)
109▲ 16927850
4
在庫影響除き経常利益
1,2212111,0101,100
5
在庫影響除き当期純利益
76398665400
6
ドバイ原油価格($/B)(4-6月)
96672989
7
為替レート(/$)(4-6月)
16014515155
2026年度2025年度2026年度
第1四半期通期実績通期計画
8
自己資本
6,7696,0627076,230
9
自己資本比率
26.5%27.6%▲ 1.1%26.7%
10
ネットD/Eレシオ (倍)
0.620.71▲ 0.090.88
前年差
前期末差
©︎COSMO ENERGY HOLDINGS
2026 1Q
6
2026年度第1四半期決算 概要
7
2026 1Q
©︎COSMO ENERGY HOLDINGS
2026年度第1四半期決算レビュー
⚫経常利益は1,330億円、在庫影響を除く経常利益は1,221億円
⚫セグメント別の経常利益は下に記載の通り
在庫影響除き経常利益
1,071億円
(前年差+ 967億円)
正のタイムラグ影響に加え、四品外の海外市況が高水準で推移したことにより収益が拡大。
経常利益
76億円
(前年差▲13億円)
経常利益
72億円
(前年差+ 101億円)
経常利益
3億円
(前年差+ 1億円)
新規サイトの運転開始により改善。
石油事業
石油開発事業
石油化学事業
再生可能エネルギー事業
中東情勢緊迫化に伴う生産数量への影響により減益。
期初在庫の影響により増益。
8
2026 1Q
©︎COSMO ENERGY HOLDINGS
2026年度第1四半期決算 連結損益の概要(前年差)
単位:億円
2026年度2025年度2026年度
第1四半期第1四半期通期計画
17,6166,4851,13128,700
21,269801,1891,020
361▲ 3899130
41,330421,2881,150
5▲ 7▲ 2▲ 5▲ 250
645350403390
730102070
8840▲ 20860440
9109▲ 16927850
101,2212111,0101,100
1176398665400
12
原油価格(ドバイ)($/B)(4-6月)
96672989
13
為替レート(/$)(4-6月)
16014515155
14
原油価格(ドバイ)($/B)(1-3月)
※1
6375▲ 1289
15
為替レート(/$)(1-3月)
1571534155
16
トッパー稼働率(CDベース) ※2
88.1%92.9%▲ 4.8%93.7%
17
トッパー稼働率(SDベース) ※2,3
92.0%92.9%▲ 0.9%95.1%
在庫影響除き当期純利益
前年差
非支配株主に帰属する当期純利益
親会社株主に帰属する当期純利益
在庫影響
在庫影響除き経常利益
法人税等
売上高
営業利益
営業外損益
経常利益
特別損益
【ご参考】
(※1)石油開発事業の指標価格となるICEマーバン原油価格は2ヶ月前のドバイ価格を参照してアセスされるため、2ヶ月前のドバイ原油価格を参考として記載
例)通期決算(1-12月)の場合、前年11月-当年10月のドバイ原油価格平均を記載
(※2)当社(3製油所合計)の稼働率 (※3)SD:定期整備等の影響を除いた稼働率
9
2026 1Q
©︎COSMO ENERGY HOLDINGS
2026年度第1四半期決算 連結経常利益の概要(前年差)
1
2
石油事業
3
石油化学事業
4
石油開発事業 (※1)
5
再生可能エネルギー事業
6
その他 (※2)
(※1) 操業会社(アブダビ石油・カタール石油開発・合同石油開発)は12月決算 (※2) 連結処理値を含む
76
3
▲ 1
前年差
経常利益
在庫影響除き
経常利益
1,010
967
89
2
45
101
▲ 13
1
▲ 46
▲ 29
2025年度 第1四半期
在庫影響除き
経常利益
経常利益
42
72
単位:億円
連結
セ
グ
メ
ン
ト
別
1,330
1,180
1,221
1,071
2026年度 第1四半期
経常利益
在庫影響除き
経常利益
1,288
1,245
211
▲ 65104
10
2026 1Q
©︎COSMO ENERGY HOLDINGS
前年差+ 1,010億円
2025年度
第1四半期
在庫影響除き
経常利益
石油事業石油化学事業石油開発事業
再生可能
エネルギー事業
その他
在庫影響除き
経常利益
104▲ 29 89 2 45
1,071 72 76 3▲ 1
2026年度 第1四半期
211 1,221
211
+967
+101
▲13
+1
▲46
1,221
=++++
++++=
在庫影響除き連結経常利益
単位:億円
価格
数量
経費他
- 92
+12
▲3
価格
数量
経費他
▲27
▲82
+96
マージン・数量
・四品マージン
・四品外マージン
・四品数量
・四品外数量
・輸購入・輸出
経費他
+1,019
+650
+546
▲58
+19
▲138
▲52
2026年度第1四半期決算 連結経常利益(在庫影響除き)前年差
11
2026 1Q
©︎COSMO ENERGY HOLDINGS
単位:億円
1
25,51521,9663,549
2
8,1007,358742
3
6,7696,062707
4
26.5%27.6%▲ 1.1%
5
4,2084,309▲ 101
6
0.620.71▲ 0.09
(※1)有利子負債総額から現預金等を控除したもの
ネットD/Eレシオ(倍)(※1)
増減
総資産
純資産
自己資本
自己資本比率
ネット有利子負債(※1)
実績
(2026年6月末)
実績
(2026年3月末)
2026年度第1四半期決算 連結貸借対照表の概要
連結貸借対照表
12
2026 1Q
©︎COSMO ENERGY HOLDINGS
2026年度第1四半期決算 連結設備投資の概要
単位:億円
2026年度
第1四半期
1設備投資
244122
2減価償却費
141▲ 1
前年差
単位:億円
2026年度2025年度
第1四半期第1四半期
1石油事業
72648
2石油化学事業
511437
3石油開発事業
901377
4再生可能エネルギー事業
1838▲ 20
5その他・調整額
13▲ 720
6合計
244122122
7投資有価証券等
02▲ 2
前年差
設備投資・減価償却費設備投資・減価償却費
13
2026 1Q
©︎COSMO ENERGY HOLDINGS
補足情報目次
P. 14 –21
2026年度第1四半期決算 関連データ
⚫
セグメント別実績 (前年差)
⚫
各事業の主要データ
⚫
販売数量、トッパー稼働率
⚫
原油生産数量、確認埋蔵量・推定埋蔵量
⚫
原油価格・為替市況
⚫
ガソリン・軽油 国内/海外マージンの推移
⚫
石油化学市況
1
P. 22 –26
2026年度通期計画の概要(2026年5月既公表)
⚫2026年度通期計画 概要
⚫2026年度通期計画 前提条件、感応度
⚫2026年度通期計画 在庫影響除き連結経常利益(前年差)
P. 27 –34
コスモエネルギーグループの概要
⚫石油事業、石油化学事業、石油開発事業、再生可能エネルギー事業
©︎COSMO ENERGY HOLDINGS
2026 1Q
14
2026年度第1四半期決算 関連データ
15
2026 1Q
©︎COSMO ENERGY HOLDINGS
2026年度第1四半期決算 セグメント別実績(前年差)
単位:億円
実績前年差実績前年差実績前年差実績前年差
1石油事業6,8861,1291,1431,2331,1801,2451,071967
2石油化学事業93911467977210172101
3石油開発事業161▲ 13650▲ 9776▲ 1376▲ 13
4再生可能エネルギー事業395313131
5その他・調整額▲ 409196▲ 45▲ 1▲ 46▲ 1▲ 46
6合計7,6161,1311,2691,1891,3301,2881,2211,010
コスモ松山石油、CMアロマ、丸善石油化学 ほか
コスモエコパワー 、CSDソーラー ほか
コスモエンジニアリング、コスモトレードアンドサービス ほかその他
石油化学事業
営業利益経常利益
経常利益
(在庫影響除き)
売上高
石油事業
コスモ石油、コスモ石油マーケティング、コスモ石油販売、コスモ石油ルブリカンツ、コスモエネルギーソリューションズ、
ジクシス(持分法適用会社)、キグナス石油(持分法適用会社)ほか
石油開発事業
再生可能エネルギー事業
コスモエネルギー開発、アブダビ石油、Cosmo E&P Albahriya 、カタール石油開発、
合同石油開発(持分法適用会社)ほか
2026年度第1四半期実績(前年差)
グループ会社
16
2026 1Q
©︎COSMO ENERGY HOLDINGS
2026年度第1四半期決算 各事業の主要データ
21年度22年度23年度24年度25年度26年度1Q
(1) 製油所 稼働率
トッパー(CDベース)(※1)
95.4%97.8%87.9%88.4%91.2%88.1%
販社(※2)
872880867867861860
特約店
1,8231,7691,7351,6791,6431,624
SS計(※3)
2,6952,6492,6022,5462,5042,484
うちセルフSS数(※3)
1,1121,1211,1281,1331,1481,149
コスモ・ザ・カード有効会員数
コスモ・ザ・カード(万枚)(※3)
403384362359366365
コスモMyカーリース累計契約台数
コスモMyカーリース(台)(※3)
96,214108,104119,737131,891144,063146,640
【コスモの公式】アプリ総DL数 【コスモの公式】アプリ(万件)(※3)4725957269291,2161,291
2
石油開発事業コスモエネルギー開発株式会社(B/D)(※4,5)45,15742,43036,71839,47443,33033,330
設備容量(MW)(※3)
300247295320353348
売電量(百万kWh)
595553643590716162
(※1)各年度 4-3月実績 (※2)当社100%出資子会社における直営SSならびに販売店SS (※3)各年度 3月末時点 (※4)各年度 1-12月実績
(※5)22年度まではアブダビ石油、カタール石油開発、合同石油開発の合計、23年度以降はアブダビ石油、合同石油開発の合計
原油生産数量
風力発電設備容量
3
再生可能
エネルギー事業
SS数
1
石油事業
(3)
(2)
17
2026 1Q
©︎COSMO ENERGY HOLDINGS
2026年度第1四半期決算 販売数量、トッパー稼働率
単位:千KL
2026年度2025年度2026年度
第1四半期第1四半期通期計画
1
1,723 1,797 95.9%7,273 99.2%
2
188 216 86.9%1,753 99.1%
3
1,334 1,367 97.6%5,488 98.9%
4
338 363 92.9%1,476 97.4%
5
3,583 3,744 95.7%15,990 98.9%
6
857 1,242 69.0%4,900 106.1%
7
115 128 89.9%436 85.2%
8
115 143 80.2%504 91.0%
9
4,669 5,256 88.8%21,830 99.9%
10
11
724 700 103.4%2,396 79.3%
12
549 511 107.4%2,075 98.9%
13
724 700 103.4%2,846 89.9%
14
合計5,394 5,956 90.6%24,676 98.6%
2026年度2025年度
第1四半期第1四半期
15
88.1%92.9%▲ 4.8%
16
92.0%92.9%▲ 0.9%
(※1)当社(3製油所合計)の稼働率、(※2)SD:定期整備等の影響を除いた稼働率
前年比
保税販売他
計
外需燃料油
中間留分輸出
ジェット
C重油
計
(内 ジェット)
トッパー稼働率
(CD) (※1)
(SD) (※1、2)
前年比前年比
ガソリン
内需燃料油
灯油
軽油
四品計
ナフサ
A重油
18
2026 1Q
©︎COSMO ENERGY HOLDINGS
2026年度2025年度
第1四半期第1四半期
1 原油生産数量コスモエネルギー開発株式会社(B/D)
33,33044,769▲ 11,43974.4%
※生産数量は、アブダビ石油・合同石油開発の生産数量合計。
※各社12月決算会社(例:通期決算の場合、1-12月の合計生産量)
※コスモエネルギーグループの出資比率 ... アブダビ石油64.4%、合同石油開発50.0%
百万BBL
確認埋蔵量(*2)と推定埋蔵量(*3)の合計
137.3
(参考 : 確認+推定埋蔵量の可採年数)
約16年
前年差
原油埋蔵量評価
(当社権益分)(*1)
(2025年12月31日現在)
2
2026年度第1四半期決算 原油生産数量、確認埋蔵量・推定埋蔵量
(*1)原油埋蔵量評価の結果について
当社の将来の収益へ及ぼす影響が大きいと考えられるアブダビ石油の埋蔵量につきましては、原油埋蔵量に関する独立評価会社としては世界有数の会社であるGaffney, Cline & Associates(以下、GCA)に
よる第三者評価を受けております。同評価は、当社関連会社が独自に実施した埋蔵量の自社内部評価をGCAが確認する形で実施されております。この評価は、SPE(Society of Petroleum Engineers 石油
技術者協会)のOil and Gas Reserves Committee(原油・ガス埋蔵量委員会)が作成し、WPC(World Petroleum Congress 世界石油会議)、AAPG (American Association of Petroleum
Geologists 米国石油地質技術者協会)及びSPEE (Society of Petroleum Evaluation Engineers 石油評価技術協会)により検討・共同策定された基準(2007 PRMS(Petroleum Resources
Management System))に従い、実施されております。 合同石油開発の埋蔵量評価に関しては、独自に実施した自社評価となります。なお、原油埋蔵量評価は、当社が埋蔵量又は原油回収量を保証する
ものではありません。
(*2)確認埋蔵量とは
確認埋蔵量とは、地質学的、工学的データの解析により、ある時点以降に既知の貯留層から現状の経済条件、操業方法と規制の下で商業的に回収されることが合理的確実さをもって予想される石油の量をいいま
す。また、確率論的手法が用いられるならば、確認埋蔵量が回収できる確率が、90%以上なければならない、とされています。(SPE PRMS 2007年3月定義)
(*3)推定埋蔵量とは
地質学的、工学的データの解析により、おそらく回収できると考えられる未確認埋蔵量をいいます。また、確率論的手法が用いられるならば、確認+推定埋蔵量が回収できる確率が、50%以上なければならない、と
されています(SPE PRMS 2007年3月定義)
19
2026 1Q
©︎COSMO ENERGY HOLDINGS
原油価格・為替市況
ドバイ原油市況
為替市況
¥$
50
60
70
80
90
100
110
120
130
20222023202420252026
ドバイ原油
年平均(1-12月)
年度平均(4-3月)
[$/B]
26年平均
(1-6月)
26年度平均
(4-6月)
100
110
120
130
140
150
160
170
20222023202420252026
円/$
年平均(1-12月)
年度平均(4-3月)
[円/$]
26年平均
(1-6月)
26年度平均
(4-6月)
20
2026 1Q
©︎COSMO ENERGY HOLDINGS
-5.0
5.0
15.0
25.0
35.0
45.0
55.0
65.0
75.0
0
100
200
300
400
500
600
700
800
900
1,000
20222023202420252026
全国軽油輸出量(左軸)
軽油 国内スポットDB比(右軸)
軽油 シンガポール市場DB比(右軸)
[¥/L]
[千KL]
-20.0
-10.0
0.0
10.0
20.0
30.0
40.0
0
100
200
300
400
500
600
700
800
20222023202420252026
全国ガソリン 輸出量(左軸)
ガソリン 国内スポットDB比(右軸)
ガソリン シンガポール市場DB比(右軸)
[¥/L]
[千KL]
ガソリン・軽油 国内/海外マージンの推移
ガソリン国内/海外マージンの推移軽油国内/海外マージンの推移
21
2026 1Q
©︎COSMO ENERGY HOLDINGS
エチレンーナフサ スプレッド
ベンゼンーナフサ スプレッド
石油化学市況
0
100
200
300
400
500
600
700
20222023202420252026
[$/ton]
※ 横線は各年(4-3月)の平均値
0
100
200
300
400
500
600
20222023202420252026
[$/ton]
※ 横線は各年(4-3月)の平均値
©︎COSMO ENERGY HOLDINGS
2026 1Q
22
2026年度通期計画
23
2026 1Q
©︎COSMO ENERGY HOLDINGS
2026年度通期計画 概要
⚫経常利益は1,150億円、在庫影響を除く経常利益は1,100億円
⚫セグメント別の影響利益は下記の通り
在庫影響除き経常利益
560億円
(前年差▲ 368億円)
経常利益
380億円
(前年差▲273億円)
経常利益
10億円
(前年差+ 41億円)
海外市況は低調な環境が継続する見通しであるものの、
輸出数量の減少により収益の改善を見込む。
経常利益
30億円
(前年差+ 2億円)
インフレ影響を織り込みつつ、陸上風力を中心に安定収益を見込む。
石油事業
石油開発事業
石油化学事業
再生可能エネルギー事業
高水準の原油価格が収益下支え要因となる一方、
ホルムズ海峡封鎖に伴う生産制約で販売数量が減少し、
前年差で減益を見込む。
負のタイムラグ影響を主因に減益を見込む。
国内市況は保守的な想定とするが、安定供給の取り組みによる
追加コストは販売価格への反映を進める。
24
2026 1Q
©︎COSMO ENERGY HOLDINGS
2026年度通期計画 連結経常利益の概要(前年差)
単位:億円
1
2
石油事業
3
石油化学事業
4
石油開発事業(※1)
5
再生可能エネルギー事業
6
その他(※2)
7
8
9
(※1)操業会社(アブダビ石油・カタール石油開発・合同石油開発)は12月決算、(※2)連結処理値を含む、(※3)在庫影響は税額相当として30%を控除のうえ計算
10
(※4)2025年10月1日(水)を効力発生日として、株式分割(2分割)を実施。年間の1株当たり配当金予想については、株式分割の実施により単純計算ができないため、
「―」で表示。但し、1株あたりの年間配当は株式分割後換算で165円と実質的な変更はない。
2026年度 通期計画2025年度 通期実績前年差
一株あたり年間配当(予定)
165円
(株式分割後換算 165円)
(株式分割後換算 ±0円)
親会社株主に帰属する当期純利益
440740▲ 300
在庫影響除き当期純利益(※3)
400855▲ 455
7941
在庫影響
50▲ 165215
セ
グ
メ
ン
ト
別
30282
120
380653▲ 273
610560
10▲ 3141
連結
1,1501,1001,4921,657
763928▲ 153
▲ 342▲ 557
▲ 368
2026年度 通期計画2025年度 通期実績前年差
経常利益
在庫影響除き
経常利益
経常利益
在庫影響除き
経常利益
経常利益
在庫影響除き
経常利益
※4
25
2026 1Q
©︎COSMO ENERGY HOLDINGS
2026年度通期計画 前提条件、感応度
前提条件・感応度
通期計画におけるドバイ原油価格 想定
2026年度2025年度
通期計画通期実績
1
897217
2
1551514
3
897118
4
1551505
石油開発事業の指標価格となるICEマーバン原油価格は2ヶ月前のドバイ価格を参照してアセスされるため、
2ヶ月前のドバイ原油価格を参考として記載
例)通期決算(1-12月)の場合、前年11月-当年10月のドバイ原油価格平均を記載
ドバイ原油価格
($/B)(4-3月)
為替レート
(/$)(4-3月)
(参考)ドバイ原油価格
($/B)(1-12月)(※)
(参考)為替レート
(/$)(1-12月)
■ 前提条件
前年差
■ 経常利益 感応度(通期)
5石油事業
+30億円+17億円
6
▲ 8億円▲ 6億円
7計
+22億円+11億円
8
+8億円+10億円
原油価格
(ドバイ)
為替
石油開発事業
在庫影響
精製用燃料費他
※感応度は原油価格+1$/Bあたりの影響額および為替+1円/$あたりの影響額。
但し、石油開発事業は生産正常化後の感応度。
第1四半期第2四半期第3四半期第4四半期
2026年度
通期計画
11090807589
0
25
50
75
100
125
($/B)
ドバイ原油価格計画
(4-3月)
89$/B
26
2026 1Q
©︎COSMO ENERGY HOLDINGS
2026年度通期計画 在庫影響除き連結経常利益(前年差)
前年差▲ 557億円
2025年
通期実績
在庫影響除き
経常利益
石油事業石油化学事業石油開発事業
再生可能
エネルギー事業
その他
在庫影響除き
経常利益
928▲ 31 653 28 79
560 10 380 30 120
2026年度 通期計画
1,657 1,100
1,657
▲368
+41
▲273
+2
+41
1,100
=++++
++++=
在庫影響除き連結経常利益
単位:億円
価格
数量
経費他
+8
+2
+31
価格
数量
経費他
+203
▲398
▲78
マージン・数量
・四品マージン
・四品外マージン
・四品数量
・四品外数量
・輸購入・輸出
経費他
製油所トラブル解消
▲386
▲X850
+267
▲31
▲56
+284
▲81
+99
©︎COSMO ENERGY HOLDINGS
2026 1Q
27
コスモエネルギーグループの概要
28
2026 1Q
©︎COSMO ENERGY HOLDINGS
コスモエネルギーグループの概要
セグメント石油事業石油開発事業
再生可能エネルギー
事業
その他事業・
連結処理含む
連結
※2
売上高
※1
23,856 億円1,304 億円165 億円▲ 1,877 億円26,776 億円
経常利益
※1
763 億円653 億円28 億円79 億円1,492 億円
経常利益
※1
(在庫影響除き)
928 億円653 億円28 億円79 億円1,657 億円
●原油処理能力
※5
●パートナーシップ
●風力発電設備容量
※4
40万バレル/日エチレン129万t/年約50年にわたる産油国との348MW●企業認知率
(国内シェア 12.9%)強固な信頼関係
(国内第3位/国内シェア6%
※3
)
94%
●アロマ製品 生産能力
※4
●国内販売量
※1
ベンゼン48.5万t/年●オペレーターシップ(自社操業)
●太陽光発電能力
※4
内需燃料油 21,848千KLミックスキシレン61.8万t/年中東地域において日系企業の24MW
オペレーター会社としては最大規模
●国内SS数
※4
2,484 ヶ所
●原油生産量
※1
約4.3万バレル/日
●コスモ・ザ・カード会員数
※4
(原油処理能力比 約11%)
365万枚
●【コスモの公式】アプリ
※4
●原油埋蔵量(確認・推定)
※3
総DL数 1,291万件137.3百万バレル
●コスモMyカーリース
※4
(約16年分の供給量相当)
累計契約台数 146,640台
●コスモ石油●丸善石油化学(千葉/四日市)●コスモエネルギー開発●コスモエコパワー(風力発電)●コスモエンジニアリング
●コスモ石油マーケティング●コスモ松山石油●アブダビ石油 (UAE)●CSDソーラー(太陽光)●コスモトレードアンドサービス
●コスモ石油販売●CMアロマ(千葉)●カタール石油開発(カタール)ほかほか
●コスモ石油ルブリカンツ●合同石油開発(UAE/カタール)
●コスモエネルギーソリューションズ●Cosmo E&P Albahriya (UAE)
●ジクシス(持分法適用会社)
ほか
●キグナス石油(持分法適用会社)
ほか
グループ会社
ほか
石油化学事業
3,328 億円
▲ 31 億円
▲ 31 億円
主な資産
●オレフィン製品 生産能力
※4
(※1)2025年度実績(※2)連結処理を含む(※3)2025年12月31日時点(※4)2026年6月30日時点(※5)2026年4月1日時点
※外部調査会社による全国一般
生活者 16~69歳の男女2,000
名への調査(2025年9月時点)
石油事業
29
2026 1Q
©︎COSMO ENERGY HOLDINGS
13,340
14,806
15,769
16,472
16,648
16,567
16,511
16,166
110,028
106,643
101,826
100,23799,154
97,345
95,154
94,528
18 19 20 21 22 23 24 25
当社 内キグナス 国内販売数量合計(千KL)
概要
⚫大都市圏に立地する3製油所体制にて安全操業・安定供給を実施
⚫坂出製油所の閉鎖(2013年度)、キグナス石油への供給開始(2019年度)により、販売に対して生産が少ない 「ショートポジション」を確立
⚫製油所高稼働の維持により、石油事業を中心とした稼ぐ力が格段に向上
製油所概要
86.1
87.9
84.3
95.4
97.8
87.9
88.4
91.2
86.4
84.8
68.7
73.4
79.2
75.8
74.1
77.1
60
70
80
90
100
FY18FY19FY20FY21FY22FY23FY24FY25
(%)
製油所高稼働の維持
当社
(CD)
業界平均
(CD)
石油製品需要とコスモ販売数量の推移
四日市製油所
8.6万バレル/日
ENEOS千葉製油所と
コスモ石油千葉製油所を
結ぶパイプライン完成
(2018年~)
千葉製油所
21.4万バレル/日
堺製油所
10.0万バレル/日
2次装置投資による競争力強化
⚫2010年コーカー稼働開始
⚫製品付加価値向上
IMO対応に伴いコーカー能力を増強
(2019年10月)
29,000→31,000バレル/日
原油処理能力
40.0万バレル/日
石油事業
30
2026 1Q
©︎COSMO ENERGY HOLDINGS
データサイエンスを用いたマーケティングの高度化
⚫自社の豊富な顧客データに加え、異業種パートナーとデータを連携
⚫充実した顧客基盤をもとに広範な顧客ニーズに応える
⚫公式アプリケーションの大幅リニューアルを2025年4月実施し、顧客の利便性を向上
⚫燃料油、電力やモビリティサービスなど包括的に
顧客体験を提供するアプリとしてリニューアル
⚫各種サービスをホーム画面に集約し利便性を向上
異業種パートナーのデータ
豊富な顧客データ
アプリ会員数
1,291万DL
(※)
コスモ・ザ・カード会員数
365万枚
(※)
自社で蓄積してきた基本データに加え異業種パートナーの外部データを連携
顧客データのマーケティング活用
【コスモの公式】アプリのリニューアル
(※)2026年6月末時点
⚫マーケティングサイエンスを用いて、顧客の行動(シナリオ)を可視化
⚫シナリオに沿って自動かつ顧客個人単位で、最適なタイミング・チャネルでの訴求を実現
⚫燃料油だけでなく、コスモMy カーリースやコミっと車検、コスモでんき等多岐にわたり顧客体験と
購買率を向上
石油化学事業
31
2026 1Q
©︎COSMO ENERGY HOLDINGS
基礎化学品概要
⚫首都圏近接のコンビナート立地と国内最大規模のエチレン生産能力を基盤としたコスト競争力
⚫千葉地区でエチレン生産最適化のため生産設備の集約を決定。稼働率向上と固定費削減で収益最大化を追求
当社グループの生産体制・特徴
CMアロマ
⚫ミックスキシレンを製造
四日市製油所
丸善石油化学(四日市工場)
丸善石油化学(千葉工場)
⚫世界最大級の京葉コンビナート内に立地
⚫国内最大規模のエチレン生産能力
⚫競争力の高い装置を高稼働させる
⚫石油精製(コスモ石油)とのシナジー追求
コスモ松山石油
⚫ベンゼン・トルエン・キシレンなどを製造
生産体制の最適化
エチレン生産能力 (年間)
(※)出資比率-丸善石油化学55%
-住友化学45%
稼働調整により
低稼働の状況
装置構成
生産量
千葉地区の立地を
活かした
生産体制最適化により
高稼働を実現
生産量装置構成
最適化後
装置構成
稼働調整
丸善石油
化学
丸善石油化学
住友化学
稼働調整
丸善石油
化学
52.5万t
京葉
エチレン
76.8万t
(※)
丸善石油
化学
住友化学
丸善石油化
学
停止
京葉
エチレン
76.8万t
京葉
エチレン
76.8万t
2026年度中の実行を予定
最適化後の生産体制
生産能力
オレフィン系エチレン※129万t/年
39.5万t/年
9万t/年
計48.5万t/年
30万t/年
27万t/年
4.8万t/年
計61.8万t/年
110万t/年
アロマ合計
※京葉エチレン(丸善石油化学が55%を出資する連結子会社)の生産能力を含む
CMアロマ
コスモ松山石油
アロマ系
ベンゼン
丸善石油化学
コスモ松山石油
(2026年3月31日時点)
ミックス
キシレン
コスモ石油
生産会社
丸善石油化学
石油化学事業
32
2026 1Q
©︎COSMO ENERGY HOLDINGS
化成品、機能化学品概要
⚫世界トップクラスのMEK生産能力(17万t/年)を保有。コスト競争力が高く、国内メーカーへの供給のみならず世界各国への輸出を展開
⚫半導体の製造工程で使用するフォトレジスト用樹脂において、丸善石油化学は世界トップクラスのシェアを誇る
⚫フォトレジスト用樹脂は開発型受注生産かつ生産難易度が高いため代替商品がなく参入障壁が高い
⚫塗料溶剤
⚫印刷インキ
⚫接着剤
ブチレン
ナフサ
MEK
⚫Ar 製造装置の能力増強、Kr 製造装置の能力増強
⚫将来的な高付加価値製品の強化を見据え、次世代EUV向けポリマーの試作品製造
装置を新設 (2026年度中の完成予定)
化成品機能化学品の事業拡大(半導体向けフォトレジスト用樹脂の拡大)
⚫ナフサ分解から、あらゆる産業の基礎となる各種化学品を製造・販売
⚫塗料・接着剤の原料となるMEK(メチルエチルケトン)の生産能力は
世界トップクラス
(※1) Kr (フッ化クリプトン)
露光用光源であるエキシマレーザー。光源波長248nm
(※2) Ar (フッ化アルゴン)
露光用光源であるエキシマレーザー。光源波長193nm
(※3) EUV(Extreme Ultra Violet)
極端紫外線もしくは極紫外線。半導体製造の露光技術に
使われる次世代の光源。
0
50
100
150
200
202020212022202320242025
(年度)
(億円)
更なる売上拡大へ
Kr
※1
用ポリマー
世界シェア
(当社推定)
KrF用ポリマー
世界シェア(推定)
ArF用ポリマー
世界シェア(推定)
EUV用ポリマー
世界シェア(推定)
Ar
※2
用ポリマー
世界シェア
(当社推定)
KrF用ポリマー
世界シェア(推定)
ArF用ポリマー
世界シェア(推定)
EUV用ポリマー
世界シェア(推定)
KrF用ポリマー
世界シェア(推定)
ArF用ポリマー
世界シェア(推定)
EUV用ポリマー
世界シェア(推定)
EUV
※3
用ポリマー
世界シェア
(当社推定)
最新技術
■丸善石油化学
フォトレジスト用樹脂シェア
半導体向けフォトレジスト用樹脂の売上推移
石油開発事業
33
2026 1Q
©︎COSMO ENERGY HOLDINGS
概要
⚫50年の安定生産を基盤としたアブダビとの信頼関係をベースに、低リスク・低コスト開発を実現
⚫アブダビ石油は2012年の権益延長(30年)と共に、既存3油田と同規模のヘイル鉱区を取得
ADOCQPDUPD
所在国
(UAE)(カタール)(UAE) (カタール)
当社保有割合
64.4%100%50%
設立年
196819971970
コスモエネルギーグループの石油開発部門コスモエネルギーグループの原油生産量
(※)2022年度までは、3社合計(アブダビ石油、合同石油開発、カタール石油開発)
2023年度以降は2社合計(アブダビ石油、合同石油開発)
アラビア
半島
0
20
40
60
80
100
120
140
0
20,000
40,000
60,000
19731977198119851989199319972001200520092013201720212025
(バレル/日)
($/バレル)
開発会社合計
原油価格
再生可能エネルギー事業
34
2026 1Q
©︎COSMO ENERGY HOLDINGS
概要
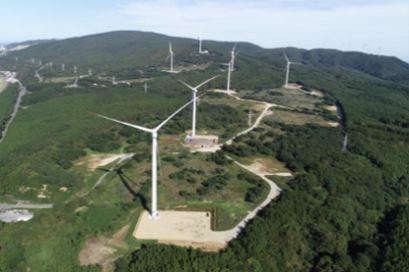
⚫風力発電事業(1997年創業) のパイオニアであるエコ・パワー(現コスモエコパワー)を2010年にグループ化
⚫開発、建設、運営、メンテナンスをグループ内で実施する事で高いレベルの利用可能率(90%以上)を実現
⚫風力発電のみならず、蓄電ビジネスの実証など、発電から販売までの電力サプライチェーン構築へ
売電量推移コスモエコパワー社概要
資本金71億円
設備容量348MW
※1
業界シェア
約6%
※2
※1 2026年6月末時点※2 2025年12月末時点
開発
設計
調達建設
O&M
第7次中期経営計画期間中に運転開始した風力サイト
運転中(陸上)
青森県・新むつ小川原
(約33MW)
2025年7月 運転開始
運転中(陸上)
青森県・新岩屋
(約27MW)
2025年3月運転開始
35
2026 1Q
©︎COSMO ENERGY HOLDINGS
将来の見通しに関する記述についての注意事項
本書の記述及び記載された情報は、「将来の見通しに関する情報」(準拠する日本の証券法における意義の範囲内で)にあたります。かかる記述や情報(以下、合わせ
て「将来の見通しに関する記述」)は、将来の出来事や当社の将来の業績、事業見通しあるいは事業機会に関連するものです。将来の見通しに関する記述は、将来の
業績予想、未確定の推定量及び経営者がおいた前提に基づく、埋蔵量・資源量の評価、将来の生産水準、将来の設備投資や探査・開発活動への設備投資配分、将
来の掘削・その他探査・開発活動、最終的な埋蔵量・資源量の回収、特定鉱区の探査・開発・予想生産能力への到達時期などに関する記述を含みますが、これらに限
定されるものではありません。
過去の事実以外のあらゆる記述が将来の見通しに関する記述になる可能性があります。確認及び推定埋蔵量・資源量の評価に関する記述も将来の見通しに関する記述
の対象となり、その埋蔵量・資源量について経済的に開発が可能であるという特定の前提に基づく結論を反映しているとみなされる可能性があります。予想、期待、考え、計
画、予測、目標、前提、将来の出来事や業績に関する議論について示す・関するあらゆる記述( 「目指す」、「想定する」、「計画する」、「継続する」、「予測する」、「期待
する」、「可能性がある」、「するだろう」、「予想する」、「予見する」、「潜在的な」、「狙う」、「意図する」、「ありうる」、「しかねない」、「するはずだ」、「思う」等の言葉や言い回
し、その他類似する表現が使われることが多いですが、必ず使われるわけではありません) は、過去の事実の記述ではなく、「将来の見通しに関する記述」である可能性があり
ます。将来の見通しに関する記述には、かかる将来の見通しに関する記述で予想されたものとは大きく異なる実際の結果や出来事を引き起こす可能性がある既知及び未
知のリスク、不確実性並びにその他要因を伴います。
これらの将来の見通しに関する記述に反映された期待は合理的なものであると当社は考えますが、これらの期待が正しいとの保証はなく、このような将来の見通しに関する記
述に過度に依拠すべきではありません。適用法令により義務付けられている場合を除き、当社はこれらの将来の見通しに関する記述を更新するつもりはなく、またその義務を
一切負いません。
これらの将来の見通しに関する記述は、とりわけ、原油価格の変動、探査・開発活動の結果、付保されていないリスク、規制の変更、権原上の瑕疵、資材や設備の有無、
政府その他の規制承認等の適時性、設備の実際の稼動、合理的な条件での資金調達の有無、仕様や期待に関連する外部サービス提供者、設備及びプロセスの有無、
並びに操業における予期せぬ環境的な影響を含む様々な事項に関するリスクと不確実性を伴います。実際の結果は、かかる将来の見通しに関する記述に明示あるいは黙
示された内容と大きく異なる場合があります。
COSMOはコスモエネルギーホールディングス株式会社の登録商標または商標です。
各コスモ製品の商品名・サービス名はコスモエネルギーホールディングス株式会社またはグループ各社の登録商標または商標です。
その他の製品および会社名は、各社の商号、登録商標または商標です。