October 23, 2026 To Whom It May Concern: Company name: ENEOS Holdings, Inc. Name of representative: Tomohide Miyata Representative Director, CEO Securities code: 5020; TSE Prime Market / NSE Prime Market Inquiries: Yuji Sugano Group Manager, Investor…
October 23, 2026
To Whom It May Concern:
Company name:
ENEOS Holdings, Inc.
Name of representative:
Tomohide Miyata
Representative Director, CEO
Securities code:
5020;
TSE Prime Market /
NSE Prime Market
Inquiries:
Yuji Sugano
Group Manager,
Investor Relations Group
Investor Relations Department
(Telephone:+81-3-6257-7075)
Notice Concerning the Full Ownership of NIPPO CORPORATION
through Additional Acquisition of Shares in Our Subsidiary (Roadmap Holdings Co., Ltd.)
ENEOS Holdings, Inc. (“the Company") hereby announces that, pursuant to a resolution adopted at the meeting
of its Board of Directors held on October 23, 2026, it has resolved to acquire 65% of the issued shares of
Roadmap Holdings Co., Ltd. ("RMH"), a consolidated subsidiary of the Company, from Aether Holdings GK
and JLQ LLC, special purpose companies held by The Goldman Sachs Group, Inc. (collectively, "Goldman
Sachs").
As a result of making RMH a wholly owned subsidiary, NIPPO CORPORATION ("NIPPO"), which is a wholly
owned subsidiary of RMH, will also become a wholly owned subsidiary of the ENEOS Group.
Reason for acquisition of shares
In 2021, the Company dissolved the parent-subsidiary listing structure with NIPPO for the purpose of
strengthening governance, took NIPPO private, and since then has worked to enhance NIPPO's corporate value
under a joint ownership structure with Goldman Sachs. At that time, the basic policy was for NIPPO to grow as
an independent company by utilizing the expertise and network of an external partner, with a view toward a future
relisting.
However, since NIPPO was taken private, the business environment surrounding the ENEOS Group and its growth
strategy have changed. At present, considering the possibility that progress toward decarbonization may proceed
more slowly than initially expected, the Company places greater importance on improving the profitability of our
base businesses and acquiring businesses that are expected to generate profits at an early stage. In this process,
opportunities to create synergies with NIPPO, which had not necessarily been sufficiently concretized at the time,
have also become clearer.
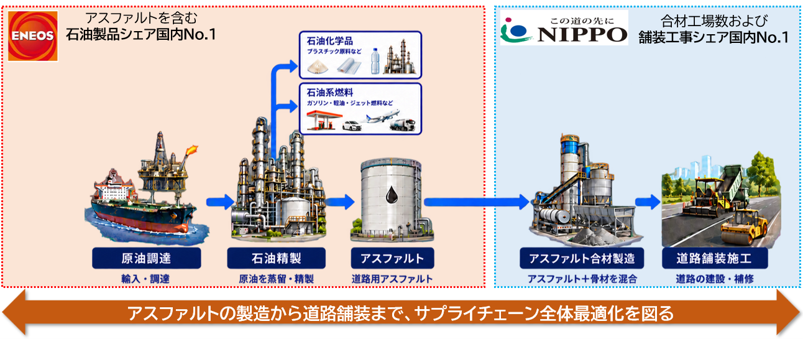
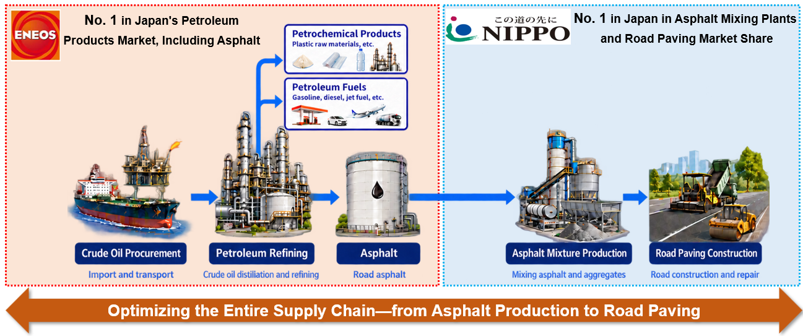
The first area of synergy is the overall optimization of the domestic asphalt supply chain. ENEOS Corporation
("ENEOS"), which is responsible for the petroleum refining and marketing business of the ENEOS Group,
produces asphalt as a co-product in the manufacturing process of fuel oil, basic chemicals and other products,
while NIPPO uses asphalt as a raw material for manufacturing asphalt mixtures and operating its road paving
business. In this way, the two companies are closely connected within the supply chain from asphalt production
to road paving.
For ENEOS, securing stable sales channels for asphalt, a co-product, is important for supporting a stable energy
supply and stable refinery operations. For NIPPO, the stable and competitive procurement of raw materials is a
source of business competitiveness. Meanwhile, competition with imported asphalt has intensified in recent years,
and under such circumstances, the importance of the two companies managing their businesses from the
perspective of the entire supply chain has increased further.
By making RMH a wholly owned subsidiary, the Company will be able to achieve both stable sales of asphalt at
ENEOS and enhanced procurement competitiveness at NIPPO, while enabling the ENEOS Group as a whole to
enjoy the value created across the entire supply chain. In addition, by utilizing the management resources of both
companies, including research and development functions, in an integrated manner under prompt decision-making,
the Company expects to further strengthen competitiveness through initiatives such as joint development of
asphalt materials and expansion into new business areas.
In addition, in the initiatives to utilize idle land and enhance asset value, which are being promoted across the
ENEOS Group, there is growing potential to utilize NIPPO's expertise in areas such as soil improvement and
construction. By deepening collaboration in these fields, the Company expects to create new business
opportunities and enhance the value of ENEOS Group assets.
Furthermore, opportunities for collaboration are also expanding in the ENEOS Group's global strategy. Our
petroleum refining and marketing business is expanding its global presence, mainly in Southeast Asia. In the
region, where demand for road infrastructure is expected to continue growing, an environment is being established
for the pursuit of new growth opportunities through collaboration with NIPPO's overseas business platform.
In light of these changes in the business environment and our growth strategy, as well as a clearer understanding
of the potential synergies, the ENEOS Group has determined that making NIPPO a wholly owned subsidiary and
utilizing the management resources of both companies in a more agile and integrated manner will contribute to
enhancing the medium- to long-term corporate value of the ENEOS Group as a whole. Accordingly, the ENEOS
Group has decided to proceed with the share acquisition.
Overview of the subsidiary subject to change
(1) Roadmap Holdings Co., Ltd.
(1)
Name
Roadmap Holdings Co., Ltd
(2)
Location
1-19-11, Kyobashi, Chuo-ku, Tokyo
(3)
Job title and name of
Representative Director: Norimitsu Niwa
representative
Exercising control or management over the business activities of
(4)
NIPPO and other companies or legal entities through the ownership
Description of business
of shares, equity interests, or other investments in such companies or
legal entities.
(5)
Share capital
0.3 billion yen
(6)
Date of establishment
August 6, 2021
(7)
Net assets
164,111 million yen
(8)
Total assets
502,455 million yen
(9)
Major
shareholders
and
ownership ratios
Company
and
company
JLQ LLC
said
59.5%
5.5%
ENEOS Holdings, Inc.
Relationship between the
(10)
Aether Holdings GK
35%
Capital
The Company owns 35% of the total number of
relationship
shares issued of said company.
Personnel
relationship
Business
relationship
Related
party
relationship
Not applicable
Not applicable
Said company is a consolidated subsidiary of the
Company and constitutes a related party.
Note: Net assets and Total assets are as of the end of the fiscal year ended March 31, 2026.
(2) NIPPO CORPORATION
(1)
Name
NIPPO CORPORATION
(2)
Location
1-19-11, Kyobashi, Chuo-ku, Tokyo
(3)
Job title and name of
representative
President and Representative Director, Chihiro Wada
Contracting, surveying, design, supervision and consulting services
for construction works (roads, test courses, airports, distribution
(4)
Description of business
facilities, sports facilities, water supply facilities, general civil
engineering and general building construction), manufacture and sale
of asphalt mixtures and other products, and other businesses
(including industrial waste treatment).
(5)
Share capital
15,324 million yen
(6)
Date of establishment
February 2, 1934
(7)
Net assets
312,060 million yen
(8)
Total assets
501,438 million yen
(9)
Major shareholders and
Roadmap Holdings Co., Ltd.
ownership ratios
Capital
relationship
(10)
100%
The Company holds 35% of the total number of
issued shares of said company through Roadmap
Holdings Co., Ltd.
Relationship between the
Personnel
Company and said
relationship
company
Business
There are transactions between the Company and
relationship
said company with respect to products.
Related party
Said company is a consolidated subsidiary of the
relationship
Company and constitutes a related party.
Not applicable
Note: Net assets and Total assets are as of the end of the fiscal year ended March 31, 2026.
Overview of the counterparty to the acquisition of shares
(1) Aether Holdings GK
(1)
Name
(2)
Location
(3)
(4)
Aether Holdings GK
Toranomon Hills Station Tower, 2-6-1 Toranomon, Minato-ku,
Tokyo
Job title and name of
Representative Member, Broad Street Investments Japan GK
representative
Managing Officer: Yu Itoki
Description of business
(1) Acquisition and holding of securities
(2) Any and all business incidental or related to the preceding item
(5)
Share capital
1 million yen
(6)
Date of establishment
July 19, 2021
(7)
Net assets
586 million yen
(8)
Total assets
37,422 million yen
(9)
Major
shareholders
and
ownership ratios
Broad Street Investments Japan GK
Capital
Relationship between the
(10)
Company
company
and
said
relationship
Personnel
relationship
Business
relationship
Not applicable
Not applicable
Not applicable
100.0%
Related party
relationship
Not applicable
Note: Net assets and Total assets are as of the end of the fiscal year ended December 31, 2025.
(2) JLQ LLC
(1)
Name
JLQ LLC
Maples and Calder, Ugland House, South Church Street, P.O. Box
(2)
Location
309, George Town, Grand Cayman, Cayman Islands, British West
Indies
(3)
Job title and name of
representative
Representative in Japan: Yuji Murata
(1) Purchase of receivables
(2) Buying, selling, leasing, and brokerage of real estate
(3) Management and appraisal of real estate
(4)
(4) Collection and provision of information regarding real estate
Description of business
(5) Buying, selling, leasing, and brokerage of fixtures, furniture,
fittings, and interior furnishings
(6) Money lending business and related consulting services
(7) Any and all business activities incidental or related to the
foregoing items
(5)
Share capital
15 million yen
(6)
Date of establishment
March 6, 1998
(7)
Net assets
2,490 million yen
(8)
Total assets
33,973 million yen
(9)
Major
shareholders
and
ownership ratios
GS Strategic Investments Japan LLC 100.0%
Capital
relationship
Relationship between the
(10)
Company
company
and
said
Personnel
relationship
Business
relationship
Related party
relationship
Not applicable
Not applicable
Not applicable
Not applicable
Note: Net assets and Total assets are as of the end of the fiscal year ended December 31, 2025.
Number of shares acquired, and shareholding before and after acquisition
The combined issued shares of the following two classes represent
(1)
Ownership interest before
35.0%:
the change
・Common shares: 50.1% — 150,300,000 shares
・Non-voting shares: 19.9% — 59,700,000 shares
The combined issued shares of the following two classes represent
(2)
Ownership interest to be
65.0%:
acquired
・Common shares: 49.9% — 149,700,000 shares
・Non-voting shares: 80.1% — 240,300,000 shares
The combined issued shares of the following two classes represent
(3)
Ownership interest after the
100%:
change
・Common shares: 300,000,000 shares
・Non-voting shares: 300,000,000 shares
Schedule
(1)
(2)
(3)
Date of Board of Directors
resolution
Date of execution of the
agreement
Date of commencement of
share transfer
October 23, 2026
October 23, 2026
November 2026 (plan)
Impact on the Company’s financial results
The impact of this transaction on the Company's financial results for fiscal year ending March 2027 is expected
to be immaterial. If any matters requiring disclosure arise in the future, we will promptly make an
announcement.
(End of Document)
0
Acquisition of Full Ownership of NIPPO: Project Overview
Acquisition
Target
Seller
65% equity interest in Roadmap Holdings Co., Ltd.,
which owns all shares of NIPPO CORPORATION
(See “Structure” at right)
Structure
Before Acquisition
ENEOS Holdings
Special purpose companies owned by The Goldman Sachs
Group, Inc. (GS SPC)
GS SPC
35 %(50.1 % 3)
65 %(49.9 % 3)
Roadmap Holdings
100%
Buyer
Annual
Earnings
Impact
NIPPO CORPORATION
ENEOS Holdings
NIPPO’s
1
Consolidated Profit Contribution Before
Operating Profit
Profit
attributable to owners of the parent
After2
No impact
¥41.2 bn (consolidated subsidiary) ¥41.2bn
After Acquisition
ENEOS Holdings
100%
¥10.7 bn
+¥17.2 bn
¥27.9bn
Roadmap Holdings
100%
Schedule
Share acquisition (closing) scheduled for November 2026
1 FY2025 actual results 2 Reference figures assuming 100% ownership of NIPPO, based on FY2025 full-year (12-month) actual results
NIPPO CORPORATION
3 Voting rights percentages are shown in parentheses
Copyright © ENEOS Holdings, Inc. All Rights Reserved.
Acquisition of Full Ownership of NIPPO: Rationale (Changes Since Privatization)
1
● In 2021, we ended the parent-subsidiary listing structure, with a basic policy of relisting NIPPO in the future.
However, we decided to make NIPPO a wholly owned subsidiary to enhance overall group value, reflecting
evolving growth strategies and realized synergy opportunities.
2021
NIPPO
Ownership
Policy
Our Growth
Strategy
Synergies
● Ended the parent-subsidiary listing
structure and took NIPPO private
to strengthen governance
● Future relisting is a basic policy
Current
● Acquire full ownership to enhance the corporate value
of the entire Group, reflecting changes in growth
strategy and the expansion and realization of synergy
opportunities
Joint ownership with GS aimed at
enhancing NIPPO’s corporate value
● Optimize operations across the Group and accelerate
decision-making to maximize value creation across the
entire Group
● Focus on next-generation energy and
environmental businesses, assuming
continued and accelerating decarbonization
● Focus on strengthening base business profitability and
acquiring businesses with near-term earnings
contributions, reflecting changes in the pace of
decarbonization
● Potential synergies existed, but were limited
● Clearer synergy opportunities in Japan and overseas
to strengthen base business profitability
(details on the next page)
Copyright © ENEOS Holdings, Inc. All Rights Reserved.
2
Acquisition of Full Ownership of NIPPO: Integration Benefits
● Changes in the business environment and progress in our growth strategies have made synergy
opportunities clearer. Full ownership will enable us to create synergies and enhance value across NIPPO’s
businesses through Group-wide optimization of operations and faster decision-making.
Asphalt
Supply Chain
Oil Refining / Asphalt Production
Refinery
(Current)
Japan
Southeast Asia
Fuel oil,
basic chemicals,
etc.
Stable production of asphalt, a co-product,
supports reliable energy supply and
stable refinery operations
Road Paving
Asphalt from
other companies
Co-products
Asphalt
ENEOS
Other companies
NIPPO
NIPPO / Third-party Joint Ventures
Optimizing Japan’s entire supply chain
Changes in the
Business
Environment, etc.
and
Synergy
Opportunities
Asphalt Mixture
Production
● As competition from imported asphalt intensifies,
NIPPO is becoming more important
as a customer for ENEOS’s asphalt.
Closer coordination to enhance Group asset value
● New opportunities have emerged to unlock
value from idle land and other underutilized assets
Including use
for data centers
Maximize the use of NIPPO's soil remediation and
construction capabilities
NIPPO
● Maximize profit across the supply chain through stable asphalt
production by ENEOS and enhanced procurement stability and
competitiveness at NIPPO.
● Leverage ENEOS’s R&D capabilities to jointly develop asphalt
materials and expand their applications
Expanding growth through overseas operations
Mainly in
● Increasingly global oil refining and sales businesses Southeast Asia
Capture growth opportunities in Southeast Asia through NIPPO's
overseas business platform, where demand for road infrastructure
continues to grow
Copyright © ENEOS Holdings, Inc. All Rights Reserved.
 **