2026年12月期第3四半期決算短信〔日本基準〕(連結)
Bull 1
Bear 0
Results
4979
|
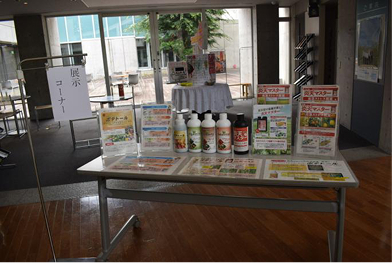
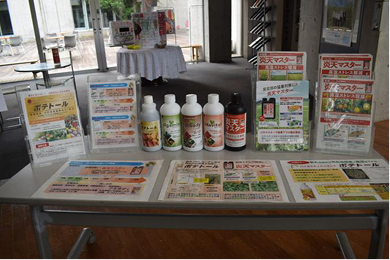
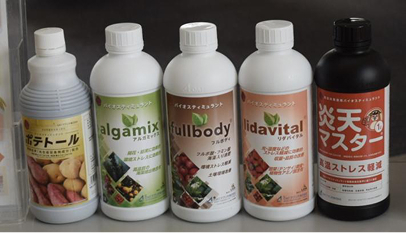
OAT Agrio Co., Ltd. is an agricultural technology company that researches, develops, manufactures, and sells pesticides, fertilizers, and biostimulants. The company operates in a single agri-tech segment, offering three core service areas: pest and disease control, fertilization and irrigation, and plant growth regulation. Key products include the insecticide Benfluralcarb, the fungicide Oxipocconazole, and the plant growth regulator Attonic. The company also supplies hydroponic soil cultivation systems and the Agrio Ichigo Master smart agriculture service for strawberry farming. Through its subsidiary Blue Wave Holding B.V., it distributes the Chrysal cut flower preservative series globally. Other notable products include the Living Garden hydroponic kit, Vegetable Life A fertilizer, and the OAT Farm A agricultural material. The company serves agricultural producers, trading companies, and general consumers in Japan, Asia, Latin America, Africa, and Europe. It maintains research and development facilities in Japan, India, and Spain, and collaborates with Insecticides (India) Limited and LIDA Plant Research, S.L. for product development. OAT Agrio also operates the AGRIO direct-to-consumer web platform and partners with Maruzen Pharmaceutical Industry for sales activities. Summarised from the annual report, fiscal year ended Dec 2025 |
Industry Agricultural Inputs | Homepage oat-agrio.co.jp |
| Sector Basic Materials | IR page oat-agrio.co.jp | |
|
Tags
pesticides, fertilizers, biostimulants, hydroponic systems, smart agriculture, cut flower preservatives, plant growth regulators, agricultural technology, Benfluralcarb, Oxonate, Alanicarb, Tolfenpyrad, Cyflumetofen, Toarow, Akaritouch, Safu Oil, Fluothianil, Oxipocconazole, Kali Green, Cyanate, Cyclosulfamuron, Contact, Attonic, OAT House Fertilizer Series, Phosphoric Acid Granular Fertilizer, Phos Plus, Root Beads, Hydroponic Soil Cultivation System, TT Series, Misa, Chrysal, Agrio Ichigo Master, Living Garden, Vegetable Life A, OAT Farm A, Lidavital, Algamix, Full Body, Protect, Potato-R, Enten Master, Asahi Chemical Industry, Junhe (Zhoushan) Plant Technology, OAT&IIL India Laboratories, Asahi Chemical Europe, PT. OAT MITOKU AGRIO, LIDA Plant Research, Inplant Innovations, Blue Wave Holding, Maruzen Pharmaceutical Industry
|
Press page oat-agrio.co.jp/news |
Metrics
| Valuation | |
|---|---|
| Market cap | ¥ 30.647B |
| Market cap (USD) | $ 191.548M |
| P/E | 11.62 |
| PEG | 12.05 |
| P/BV | 1.44 |
| P/S | 0.89 |
| P/OCF | 6.25 |
| P/FCF | 7.04 |
| Dividend yield | 2.2% |
| Turnover / mcap | — |
| Returns | |
|---|---|
| ROE | 12.6% |
| ROI | 8.0% |
| ROIC | 8.3% |
| Profit margin | 7.3% |
| Growth | |
|---|---|
| Revenue growing | Yes |
| Profits growing | No |
| Revenue up 3y | Yes |
| Revenue up 5y | Yes |
| Earnings growth 3y (net profit CAGR) | 0.96% |
| Quality | |
|---|---|
| Profitable | Yes |
| Margin expanding | No |
| Buying back stock | No |
| Diluting (TTM) | No |
| Debt/Equity | — |
| Podcast bulls (TTM) | Sign up |
| Podcast bears (TTM) | Sign up |
| Podcast sentiment (TTM) | Sign up |
| Podcast sentiment % (TTM) | Sign up |
| News sentiment (TTM) | 12 |
| Quality score | 42.1% |
| Insiders | |
|---|---|
| Buys, 1w | Sign up |
| Buys, 1m | Sign up |
| Buys, 1y | Sign up |
| Sells, 1w | Sign up |
| Sells, 1m | Sign up |
| Sells, 1y | Sign up |
Sign up to see this company's insider trades
| Figure | FY 2025 | FY 2024 | FY 2023 | FY 2022 | FY 2021 | FY 2020 | FY 2019 | FY 2018 | FY 2017 | FY 2016 | FY 2015 | FY 2014 | FY 2013 | FY 2012 |
|---|---|---|---|---|---|---|---|---|---|---|---|---|---|---|
| Revenue | 31.95B | 29.773B | 28.988B | 26.96B | 22.657B | 20.288B | 21.909B | 15.278B | 14.118B | 12.938B | 12.129B | 11.405B | 10.856B | 10.253B |
| Net profit | 2.327B | 2.077B | 2.488B | 2.261B | 1.443B | 837M | 4M | 1.257B | 1.298B | 942M | 678M | 348M | 466M | 201M |
| Free cash flow | 4.351B | 3.221B | 1.27B | 1.008B | 3.198B | 1.645B | 1.966B | -739M | 234M | 1.484B | 638M | — | — | — |
| Figure | FY 2025 | FY 2024 | FY 2023 | FY 2022 | FY 2021 | FY 2020 | FY 2019 | FY 2018 | FY 2017 | FY 2016 | FY 2015 | FY 2014 | FY 2013 | FY 2012 |
|---|---|---|---|---|---|---|---|---|---|---|---|---|---|---|
| Share price | 2.158K | 1.997K | 1.727K | 1.489K | 1.035K | 1.38K | 1.65K | 1.892K | 2.785K | 1.334K | 1.61K | 1.08K | — | — |
| Price performance 12m | 0.08 | 0.16 | 0.16 | 0.44 | -0.25 | -0.16 | -0.13 | -0.32 | 1.09 | -0.17 | 0.49 | — | — | — |
Filed figures
Lines the statements and their notes report beside the headline figures, read from the filings' XBRL as filed (no restatement applied), with figures computed from one filing's own lines. Cash-flow lines carry their cash direction: an outflow is negative. Each period links to its filing; a figure's period, report date and tag are in its tooltip.
| Figure | Dec 2016 | Dec 2017 | Dec 2018 | Dec 2019 | Dec 2020 | Dec 2021 | Dec 2022 | Dec 2023 | Dec 2024 | Dec 2025 |
|---|---|---|---|---|---|---|---|---|---|---|
| Balance sheet detail | ||||||||||
| Trade receivables (JPY) | 3.06B | 3.58B | 5.14B | 5.08B | 5.42B | 5.28B | 5.75B | 7.42B | 8.04B | 8.78B |
| ↳ YoY growth | +12.6% | +16.8% | +43.4% | -1.0% | +6.6% | -2.5% | +8.9% | +28.9% | +8.4% | +9.1% |
| ↳ 5y CAGR | +14.8% | +11.5% | +10.0% | +7.6% | +9.6% | +10.1% | ||||
| Borrowings, current (JPY) | 1.98B | 777M | 13.8B | 6.99B | 6.56B | 4.73B | 5.87B | 9.95B | 8.53B | 7.78B |
| Borrowings, non-current (JPY) | 1.03B | 1B | 2.86B | 9.15B | 8.67B | 7.4B | 5.95B | 2.36B | 2.45B | 1.39B |
| Cash and deposits (JPY) | 2.77B | 1.96B | 2.47B | 3.41B | 3.74B | 3.65B | 3.61B | 4.06B | 4.85B | 5.28B |
| Intangible assets (JPY) | 239M | 192M | 11.4B | 10.1B | 9.67B | 9.19B | 9.18B | 9.23B | 8.6B | 8.88B |
| Net debt (borrowings + leases - cash) (JPY) | 237M | -181M | 14.2B | 12.7B | 11.5B | 8.48B | 8.2B | 8.25B | 6.12B | 3.89B |
| Cash flow detail | ||||||||||
| Operating cash flow (JPY) | 1.89B | 457M | -487M | 2.39B | 1.94B | 3.6B | 1.42B | 1.79B | 3.76B | 4.9B |
| Purchases of property, plant and equipment (JPY) | -390M | -211M | -243M | -426M | -217M | -259M | -288M | -397M | -485M | -389M |
| Purchases of intangible assets (JPY) | -20M | -12M | -9M | -74M | -75M | -146M | -120M | -122M | -56M | -160M |
| Change in receivables (cash effect) (JPY) | -119M | -484M | -110M | -11M | -307M | 209M | -306M | -1.41B | -462M | -352M |
| Change in inventories (cash effect) (JPY) | 171M | -636M | -1.11B | 906M | 736M | -429M | -1.7B | -75M | 811M | 95M |
| Change in payables (cash effect) (JPY) | 437M | 45M | -347M | -41M | -391M | 996M | -216M | -895M | -18M | 622M |
| Dividends paid (cash effect) (JPY) | -161M | -147M | -194M | -216M | -216M | -215M | -237M | -474M | -565M | -862M |
| Share buybacks (cash effect) (JPY) | -735M | 0.00 | 0.00 | 0.00 | 0.00 | -299M | 0.00 | -600M | -252M | -197M |
| Interest paid (cash effect) (JPY) | -28M | -27M | -42M | -234M | -176M | -173M | -153M | -213M | -188M | -183M |
| Income taxes paid (cash effect) (JPY) | -355M | -476M | -644M | -725M | -601M | -570M | -1.05B | -1.57B | -1.37B | -1.02B |
| Share-based compensation (JPY) | — | — | — | — | — | 22M | 32M | 49M | 55M | 56M |
| Operating cash flow before change in receivables (JPY) | 2.01B | 941M | -377M | 2.4B | 2.24B | 3.39B | 1.72B | 3.2B | 4.22B | 5.25B |
| Free cash flow (OCF - PPE - intangibles) (JPY) | 1.48B | 234M | -739M | 1.89B | 1.65B | 3.2B | 1.01B | 1.27B | 3.22B | 4.35B |
| Income detail | ||||||||||
| Research and development expense (JPY) | 1.21B | 1.23B | 1.3B | 1.45B | 1.73B | 2.01B | 1.96B | 2.04B | 2.73B | 2.66B |
| ↳ 5y CAGR | +3.6% | +10.6% | +9.7% | +9.4% | +13.5% | +9.0% | ||||
| Total comprehensive income (JPY) | 957M | 1.39B | 1.02B | -446M | 1.04B | 2.04B | 3.13B | 4.04B | 3.03B | 4.12B |
| Comprehensive income to owners (JPY) | 943M | 1.39B | 1.05B | -439M | 995M | 1.91B | 2.97B | 3.88B | 2.83B | 3.94B |
| Provision for credit losses (JPY) | -9M | 2M | 3M | 1M | 38M | -1M | 7M | 93M | 99M | 8M |
| Credit cost ratio (credit losses / average receivables) (%) | 0.3% | 0.1% | 0.1% | 0.0% | 0.7% | 0.0% | 0.1% | 1.4% | 1.3% | 0.1% |
| Reported | Mar 23, 2017 | Mar 22, 2018 | Mar 22, 2019 | Mar 30, 2020 | Mar 31, 2021 | Mar 31, 2022 | Mar 29, 2023 | Mar 26, 2024 | Mar 25, 2025 | Mar 24, 2026 |
Sign up to see institutional holdings
Sign UpPodcast Mentions
Sign up to see podcast mentions and sentiment
Sign UpTimely disclosures published on TDnet, newest first, titles as filed in Japanese. The link opens the disclosure on TDnet. Filings with EDINET (periodic reports, extraordinary reports, offerings, holding and buy-back reports), newest first, titles as filed in Japanese. The link opens the filing on EDINET. Press releases from the company's own website, newest first.
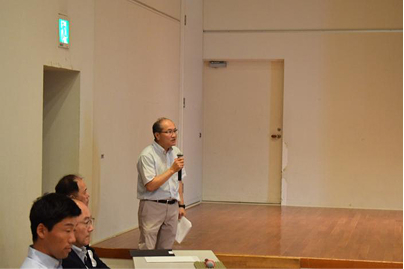
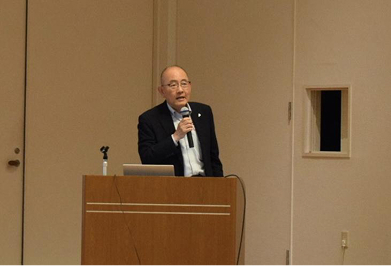
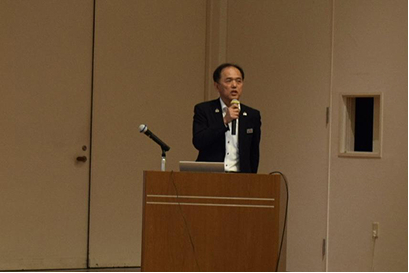
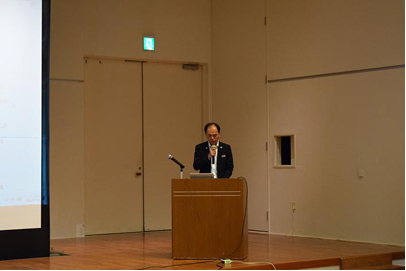
イベント開催のご報告「全国高校生花いけバトル近畿大会 2026」 | OATアグリオ株式会社
Bull 0
Bear 0
Routine

-
製品案内
-
事業案内
-
企業情報
-
IR情報
-
株主様へ
-
イベント開催のご報告「全国高校生花いけバトル近畿大会 2026」
イベント開催のご報告「全国高校生花いけバトル近畿大会 2026」
PICK UP
—


製品案内
事業案内
企業情報
Copyright © 2021 OAT Agrio Co., Ltd. All rights reserved.


変更報告書(光通信株式会社)
Bull 0
Bear 0
Routine
Prompts
Click prompts to add them under the company line, click again to take one out, then copy the result into your AI chat. Shared by Asian Century Stocks and Uncovered Thai Stocks. Thank you.
OAT Agrio Co., Ltd. (ticker 4979), listed in Japan.
Copied
ETFs Holding OAT Agrio Co., Ltd.
Exchange-traded funds whose newest published daily portfolio holds one of the company's listings, largest weight first.
| ETF | Weight in ETF | Shares | Market value | As of |
|---|---|---|---|---|
| DFIS | 0.00% | 7,400 | $ 116.253K | Nov 12, 2026 |
| DFSI | 0.00% | 1,200 | $ 18.852K | Nov 12, 2026 |
| DFIC | 0.00% | 8,900 | $ 139.817K | Nov 12, 2026 |
| DFAX | 0.00% | 4,400 | $ 69.123K | Nov 12, 2026 |
| DFAI | 0.00% | 2,100 | $ 32.991K | Nov 12, 2026 |
| AVDV | 0.00% | 16,800 | $ 261.45K | Nov 16, 2026 |
| AVSD | 0.00% | 700 | $ 10.894K | Nov 16, 2026 |
| AVDS | 0.00% | 700 | $ 10.894K | Nov 16, 2026 |