|
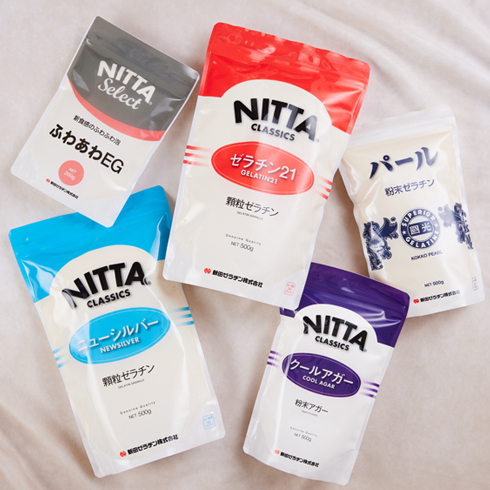
Nitta Gelatin Inc. is a global provider of collagen-based products, operating through a group structure that includes nine consolidated subsidiaries and three affiliates. The company's core business is the manufacturing and sale of gelatin, collagen peptides, food ingredients, and biomaterials. Key product lines include food, capsule, and photographic gelatin, as well as collagen peptides for health and beauty applications. The group also produces food materials such as stabilizers for meat processing and gelling agents for desserts, alongside medical-grade collagen and gelatin for biomedicine. Major subsidiaries involved in these operations include Nitta Gelatin Co., Ltd., Hikoji Gelatin Co., Ltd., Nitta Gelatin NA Inc., Weiss Gelatin LLC, Nitta Gelatin Canada Inc., Nitta Gelatin India Ltd., Bamni Proteins Ltd., Shanghai Nitta Gelatin Co., Ltd., Guangdong Mingyang Gelatin Co., Ltd., Guangdong Baiwei Biotechnology Co., Ltd., and Nitta Gelatin Vietnam Co., Ltd. The company serves global markets by coordinating manufacturing and sales activities across its international network of affiliates. Summarised from the annual report, fiscal year ended Mar 2026 |
Industry Specialty Chemicals | Homepage nitta-gelatin.co.jp |
| Sector Basic Materials | IR page nitta-gelatin.co.jp/ja/index.html | |
|
Tags
collagen, gelatin, collagen peptides, food ingredients, biomedical materials, capsule gelatin, photographic gelatin, meat processing stabilizers, gelling agents, health supplements, beauty supplements, Nitta Gelatin Co. Ltd., Hikoji Gelatin Co. Ltd., Nitta Gelatin NA Inc., Weiss Gelatin LLC, Nitta Gelatin Canada Inc., Nitta Gelatin India Ltd., Bamni Proteins Ltd., Shanghai Nitta Gelatin Co. Ltd., Guangdong Mingyang Gelatin Co. Ltd., Guangdong Baiwei Biotechnology Co. Ltd., Nitta Gelatin Vietnam Co. Ltd.
|
Press page nitta-gelatin.co.jp/ja/news |
Metrics
| Valuation | |
|---|---|
| Market cap | ¥ 21.718B |
| Market cap (USD) | $ 135.739M |
| P/E | 16.52 |
| PEG | 0.59 |
| P/BV | 0.72 |
| P/S | 0.56 |
| P/OCF | 3.79 |
| P/FCF | 5.86 |
| Dividend yield | 2.5% |
| Turnover / mcap | — |
| Returns | |
|---|---|
| ROE | 11.9% |
| ROI | 9.9% |
| ROIC | 12.5% |
| Profit margin | 8.6% |
| Growth | |
|---|---|
| Revenue growing | No |
| Profits growing | Yes |
| Revenue up 3y | No |
| Revenue up 5y | No |
| Earnings growth 3y (net profit CAGR) | 28.2% |
| Quality | |
|---|---|
| Profitable | Yes |
| Margin expanding | Yes |
| Buying back stock | No |
| Diluting (TTM) | No |
| Debt/Equity | — |
| Podcast bulls (TTM) | Sign up |
| Podcast bears (TTM) | Sign up |
| Podcast sentiment (TTM) | Sign up |
| Podcast sentiment % (TTM) | Sign up |
| News sentiment (TTM) | 1 |
| Quality score | 42.1% |
| Insiders | |
|---|---|
| Buys, 1w | Sign up |
| Buys, 1m | Sign up |
| Buys, 1y | Sign up |
| Sells, 1w | Sign up |
| Sells, 1m | Sign up |
| Sells, 1y | Sign up |
Sign up to see this company's insider trades
| Figure | FY 2026 | FY 2025 | FY 2024 | FY 2023 | FY 2022 | FY 2021 | FY 2020 | FY 2019 | FY 2018 | FY 2017 | FY 2016 | FY 2015 | FY 2014 | FY 2013 |
|---|---|---|---|---|---|---|---|---|---|---|---|---|---|---|
| Revenue | 38.048B | 38.745B | 40.42B | 39.186B | 31.783B | 30.55B | 34.543B | 36.464B | 37.777B | 36.575B | 36.885B | 31.914B | 32.814B | 28.772B |
| Net profit | 3.282B | 3.159B | -1.85B | 1.558B | 726M | 742M | -694M | 989M | -615M | 693M | 477M | 610M | 665M | 1.525B |
| Free cash flow | 4.508B | 3.721B | 2.642B | -2.699B | -174M | 2.235B | 1.069B | 265M | 72M | 294M | 837M | — | — | — |
| Figure | FY 2026 | FY 2025 | FY 2024 | FY 2023 | FY 2022 | FY 2021 | FY 2020 | FY 2019 | FY 2018 | FY 2017 | FY 2016 | FY 2015 | FY 2014 | FY 2013 |
|---|---|---|---|---|---|---|---|---|---|---|---|---|---|---|
| Share price | 1.209K | 824.37 | 863.17 | 863.17 | 665.97 | 670.97 | 590.99 | 685.03 | 753.96 | 753.96 | 735.02 | 815.04 | 1.047K | 1.253K |
| Price performance 12m | 0.47 | -0.04 | 0 | 0.3 | -0.01 | 0.14 | -0.14 | -0.09 | 0 | 0.03 | -0.1 | -0.22 | -0.16 | — |
Filed figures
Lines the statements and their notes report beside the headline figures, read from the filings' XBRL as filed (no restatement applied), with figures computed from one filing's own lines. Cash-flow lines carry their cash direction: an outflow is negative. Each period links to its filing; a figure's period, report date and tag are in its tooltip.
| Figure | Mar 2017 | Mar 2018 | Mar 2019 | Mar 2020 | Mar 2021 | Mar 2022 | Mar 2023 | Mar 2024 | Mar 2025 | Mar 2026 |
|---|---|---|---|---|---|---|---|---|---|---|
| Balance sheet detail | ||||||||||
| Trade receivables (JPY) | 8.92B | 8.97B | 8.59B | 7.68B | 6.94B | 7.39B | 8.74B | 8.37B | 8.01B | 13.9B |
| ↳ YoY growth | +21.0% | +0.5% | -4.2% | -10.6% | -9.5% | +6.4% | +18.3% | -4.2% | -4.3% | +72.8% |
| ↳ 5y CAGR | -1.2% | -3.7% | -0.5% | -0.5% | +0.9% | +14.8% | ||||
| Borrowings, current (JPY) | 5.3B | 5B | 5.04B | 4.2B | 4.04B | 4.18B | 5.99B | 5.14B | 3.08B | 2.07B |
| Borrowings, non-current (JPY) | 5.43B | 4.68B | 4B | 3.23B | 3.93B | 3.57B | 4.12B | 4.08B | 4.1B | 3.38B |
| Lease liabilities (JPY) | 618M | 541M | 539M | 614M | 604M | 570M | 685M | 582M | 554M | 504M |
| Cash and deposits (JPY) | 2.66B | 1.63B | 2.09B | 1.41B | 4.02B | 3.05B | 2.86B | 4.08B | 5.01B | 6.38B |
| Intangible assets (JPY) | 859M | 780M | 585M | 521M | 502M | 507M | 504M | 463M | 391M | 286M |
| Net debt (borrowings + leases - cash) (JPY) | 8.68B | 8.6B | 7.49B | 6.63B | 4.55B | 5.28B | 7.94B | 5.72B | 2.73B | -421M |
| Cash flow detail | ||||||||||
| Operating cash flow (JPY) | 1.91B | 1.42B | 2.23B | 1.97B | 3.51B | 1.04B | -540M | 4.91B | 5.18B | 6.48B |
| Purchases of property, plant and equipment (JPY) | -1.55B | -1.35B | -1.97B | -900M | -1.22B | -1.22B | -2.08B | -2.17B | -1.41B | -1.95B |
| Purchases of intangible assets (JPY) | -69M | -35M | -19M | -38M | -54M | -64M | -82M | -99M | -54M | -25M |
| Change in receivables (cash effect) (JPY) | -1.48B | -181M | 412M | 270M | 893M | -90M | -1.19B | 869M | 241M | 1.14B |
| Change in inventories (cash effect) (JPY) | 156M | -296M | -753M | -627M | 575M | -1.2B | -2.27B | 1.25B | 920M | -161M |
| Change in payables (cash effect) (JPY) | 63M | -6M | 567M | -633M | -738M | -490M | -206M | -469M | 177M | 93M |
| Dividends paid (cash effect) (JPY) | -220M | -220M | -220M | -293M | -218M | -235M | -253M | -308M | -308M | -508M |
| Share buybacks (cash effect) (JPY) | — | — | 0.00 | 0.00 | -199M | 0.00 | — | -3M | — | — |
| Interest paid (cash effect) (JPY) | -234M | -235M | -237M | -189M | -110M | -97M | -158M | -203M | -106M | -75M |
| Income taxes paid (cash effect) (JPY) | -333M | -871M | -252M | -204M | -37M | -302M | -581M | -785M | -908M | -830M |
| Operating cash flow before change in receivables (JPY) | 3.39B | 1.6B | 1.82B | 1.7B | 2.62B | 1.13B | 650M | 4.04B | 4.94B | 5.35B |
| Free cash flow (OCF - PPE - intangibles) (JPY) | 294M | 37M | 246M | 1.03B | 2.24B | -238M | -2.7B | 2.64B | 3.72B | 4.51B |
| Income detail | ||||||||||
| Research and development expense (JPY) | 1.06B | 1.11B | 1.07B | 965M | 819M | 934M | 1.08B | 1.33B | 1.21B | 1.21B |
| ↳ 5y CAGR | -5.0% | -2.6% | -0.5% | +4.4% | +4.6% | +8.0% | ||||
| Total comprehensive income (JPY) | 1.11B | -291M | 495M | 60M | 1.85B | 1.94B | 1.98B | 377M | 3.58B | 4.82B |
| Comprehensive income to owners (JPY) | 975M | -317M | 687M | 117M | 1.55B | 1.5B | 1.25B | -620M | 2.81B | 4.02B |
| Provision for credit losses (JPY) | 18M | 64M | 127M | 17M | 0.00 | 0.00 | -1M | 0.00 | 12M | 2M |
| Credit cost ratio (credit losses / average receivables) (%) | 0.2% | 0.7% | 1.4% | 0.2% | 0.0% | 0.0% | 0.0% | 0.0% | 0.1% | 0.0% |
| Reported | Jun 27, 2017 | Jun 27, 2018 | Jun 26, 2019 | Jul 31, 2020 | Jun 29, 2021 | Jun 28, 2022 | Jun 29, 2023 | Jun 26, 2024 | Jun 23, 2025 | Jun 23, 2026 |
Sign up to see institutional holdings
Sign UpPodcast Mentions
Sign up to see podcast mentions and sentiment
Sign UpFilings with EDINET (periodic reports, extraordinary reports, offerings, holding and buy-back reports), newest first, titles as filed in Japanese. The link opens the filing on EDINET. Press releases from the company's own website, newest first.
弊社は、断裂したイヌの前十字靱帯を再建するための「コラーゲン人工靱帯」の製品化を目指し、日本大学生物資源科学部獣医学学科の研究チームと共同研究を行っています。この度、同人工靱帯を用いた再建術が天然の靱帯と同等の張力と膝関節安定性を示すことが実証され、本研究成果が2026年9月に開催された世界獣医整形外科会議(WVOC:World Veterinary Orthopedic Congress)にて、日本大学生物資源科学部により発表されました。
| 学会名 | 第7回 世界獣医整形外科会議(開催地: イタリア・ローマ) |
| 発表者名 | 日本大学 生物資源科学部 獣医学科 獣医外科学研究室 枝村一弥、種子島隼、種子島貢司ら 新田ゼラチン株式会社 総合研究所 柚木俊二、平岡陽介 |
| 題 名 | イヌの前十字靱帯断裂に対する合成コラーゲン繊維束を用いた解剖学的再建術 |
本研究成果により、CMFを骨格材料として応用することで優れた機械的特性の獲得が可能となり、イヌの前十字靱帯断裂に対する新たな治療アプローチとして高い応用可能性を有していると結論付けられました。今後は、前臨床段階としての生体内における中長期的な靱帯化プロセスおよび生体適合性の詳細な検証に取り組んでまいります。
※ 実験方法や評価結果に関する詳細なデータにつきましては、『PR TIMES』によるリリースをご覧ください。
『PR TIMES』はこちら


ニュース一覧
ニュースリリース
IRニュース
会社情報
基本理念
社長メッセージ
コーポレートガバナンス
事業内容
経営戦略
会社概要
国内事業所(アクセス)
グループ会社
100年の歩み
サステナビリティ
環境への取り組み
調達への取り組み
ダイバーシティへの取り組み
コミュニティへの取り組み
人権への取り組み
環境レポート
サステナビリティ推進体制
事業紹介
製品別
市場・用途別
IR情報
コーポレートガバナンス
財務情報
IRライブラリ
IRカレンダー
株主優待
株式情報
ディスクロージャーポリシー
IRよくあるご質問
IRお問い合わせ
電子公告
免責事項
採用情報
新田ゼラチンを知る
フィールドを知る
社員紹介
研修・福利厚生
採用情報
ページの先頭へ
ニュース一覧
ニュースリリース
IRニュース
会社情報
基本理念
社長メッセージ
コーポレートガバナンス
事業内容
経営戦略
会社概要
国内事業所(アクセス)
グループ会社
100年の歩み
サステナビリティ
環境への取り組み
調達への取り組み
ダイバーシティへの取り組み
コミュニティへの取り組み
人権への取り組み
環境レポート
サステナビリティ推進体制
事業紹介
製品別
市場・用途別
IR情報
コーポレートガバナンス
財務情報
IRライブラリ
IRカレンダー
株主優待
株式情報
ディスクロージャーポリシー
IRよくあるご質問
IRお問い合わせ
電子公告
免責事項
採用情報
新田ゼラチンを知る
フィールドを知る
社員紹介
研修・福利厚生
採用情報


© Nitta Gelatin Inc. All rights reserved






 (166KB)




Prompts
Click prompts to add them under the company line, click again to take one out, then copy the result into your AI chat. Shared by Asian Century Stocks and Uncovered Thai Stocks. Thank you.
ETFs Holding Nitta Gelatin Inc.
Exchange-traded funds whose newest published daily portfolio holds one of the company's listings, largest weight first.