2026年12月期 第3四半期決算短信〔日本基準〕(連結)
Bull 1
Bear 4
Guidance
|
KOSE Holdings Corporation is a cosmetics manufacturer and distributor operating through a group of subsidiaries. The company produces and sells skincare, makeup, and hair care products under brands including Kose, Suisai, Esprique, Liscia, ONE BY KOSÉ, Decorte, Predia, Infinity, Jill Stuart, and Addiction. It also manages the Albion, Elegance, Ignes, Anasui, and Paul & Joe brands through its subsidiary Albion, as well as the Tarte brand via Tarte, Inc. and the Purì brand via PURI CO., LTD. The group engages in manufacturing, wholesale distribution, and direct-to-consumer sales, with operations spanning Japan, China, Taiwan, Korea, Singapore, Thailand, Malaysia, India, Indonesia, and the United States. Additional business activities include the sale of amenity products for travel retail, real estate leasing, and the export of raw materials and OEM products. Summarised from the annual report, fiscal year ended Dec 2025 |
Industry Household & Personal Products | Homepage kose.co.jp |
| Sector Consumer Defensive | IR page koseholdings.co.jp/ja | |
|
Tags
cosmetics, skincare, makeup, hair care, beauty, wholesale distribution, travel retail, oem manufacturing, Kose, Suisai, Esprique, Liscia, ONE BY KOSÉ, Decorte, Predia, Infinity, Jill Stuart, Addiction, Albion, Elegance, Ignes, Anasui, Paul & Joe, Tarte, Purì, Make Keep, Curl Keep Magic, Nail Holic, Fasio, Visée, Stephen Norl New York, Softymo, Jureme, Salon Style, Clear Turn, Suncut, Kose Cosmetics Sales, Kose Cosmenience, Kose Cosmepot, Kose Professional, Doctor Phil Cosmetics, Kose Provision, Kose Travel Retail, Kose Insurance Service, Cosme Lab, Kose Marufarma, Kose Hong Kong, Kose Cosmetics Sales (China), KOSÉ SINGAPORE PTE.LTD., KOSÉ KOREA CO. LTD., KOSÉ (THAILAND) CO. LTD., KOSÉ (MALAYSIA) SDN. BHD., KOSÉ Corporation India Pvt. Ltd., PT. INDONESIA KOSÉ, KOSÉ AMERICA INC., Tarte Inc., ALBION Cosmetics (America) Inc., ALBION Cosmetics (HK) Limited., ALBION Cosmetics (Shanghai)Co. Ltd., PURI CO. LTD., Luxury Wellness CO. LTD., Kose Industries, Advance, Taiwan Kose
|
Press page corp.kose.co.jp/ja/news |
Metrics
| Valuation | |
|---|---|
| Market cap | ¥ 334.895B |
| Market cap (USD) | $ 2.093B |
| P/E | 24.77 |
| PEG | — |
| P/BV | 1.11 |
| P/S | 0.99 |
| P/OCF | 30.07 |
| P/FCF | -32.66 |
| Dividend yield | 2.5% |
| Turnover / mcap | — |
| Returns | |
|---|---|
| ROE | 5.1% |
| ROI | 4.9% |
| ROIC | 4.2% |
| Profit margin | 4.6% |
| Growth | |
|---|---|
| Revenue growing | Yes |
| Profits growing | Yes |
| Revenue up 3y | Yes |
| Revenue up 5y | No |
| Earnings growth 3y (net profit CAGR) | -7.0% |
| Quality | |
|---|---|
| Profitable | Yes |
| Margin expanding | Yes |
| Buying back stock | No |
| Diluting (TTM) | No |
| Debt/Equity | — |
| Podcast bulls (TTM) | Sign up |
| Podcast bears (TTM) | Sign up |
| Podcast sentiment (TTM) | Sign up |
| Podcast sentiment % (TTM) | Sign up |
| News sentiment (TTM) | 13 |
| Quality score | 0% |
| Insiders | |
|---|---|
| Buys, 1w | Sign up |
| Buys, 1m | Sign up |
| Buys, 1y | Sign up |
| Sells, 1w | Sign up |
| Sells, 1m | Sign up |
| Sells, 1y | Sign up |
Sign up to see this company's insider trades
| Figure | FY 2025 | FY 2024 | FY 2023 | FY 2022 | FY 2021 | FY 2020 | FY 2019 | FY 2018 | FY 2017 | FY 2016 | FY 2015 | FY 2014 | FY 2013 |
|---|---|---|---|---|---|---|---|---|---|---|---|---|---|
| Revenue | 330.193B | 322.758B | 300.406B | 289.136B | 224.983B | 327.724B | 332.995B | 303.399B | 266.762B | 243.39B | 207.821B | 190.049B | 170.685B |
| Net profit | 15.114B | 7.51B | 11.663B | 18.771B | 13.341B | 26.682B | 37.004B | 30.611B | 21.657B | 18.655B | 12.057B | 11.132B | 6.72B |
| Free cash flow | -10.253B | -2.668B | 24.917B | 13.159B | 13.213B | 17.216B | 15.888B | 23.978B | 5.801B | 18.861B | — | — | — |
| Figure | FY 2025 | FY 2024 | FY 2023 | FY 2022 | FY 2021 | FY 2020 | FY 2019 | FY 2018 | FY 2017 | FY 2016 | FY 2015 | FY 2014 | FY 2013 |
|---|---|---|---|---|---|---|---|---|---|---|---|---|---|
| Share price | 5.24K | 7.179K | 10.575K | 14.421K | 13.05K | 13.331K | 20.331K | 22.271K | 10.069K | 10.95K | 6.631K | 3.39K | 2.179K |
| Price performance 12m | -0.27 | -0.32 | -0.27 | 0.11 | -0.17 | -0.34 | -0.09 | 1.21 | -0.08 | 0.65 | 0.96 | 0.56 | — |
Filed figures
Lines the statements and their notes report beside the headline figures, read from the filings' XBRL as filed (no restatement applied), with figures computed from one filing's own lines. Cash-flow lines carry their cash direction: an outflow is negative. Each period links to its filing; a figure's period, report date and tag are in its tooltip.
| Figure | Mar 2019 | Dec 2019 | Mar 2020 | Dec 2020 | Mar 2021 | Dec 2021 | Dec 2022 | Dec 2023 | Dec 2024 | Dec 2025 |
|---|---|---|---|---|---|---|---|---|---|---|
| Balance sheet detail | ||||||||||
| Trade receivables (JPY) | 44.8B | 41.7B | 38.4B | 40B | 39.4B | 88.4B | 105B | 88.8B | 100B | 112B |
| ↳ YoY growth | +8.1% | -14.3% | -4.1% | +2.7% | +121.2% | +18.6% | -15.3% | +12.6% | +12.1% | |
| ↳ 5y CAGR | +3.7% | +19.1% | +22.9% | |||||||
| Borrowings, current (JPY) | 600M | 721M | 727M | 7.6B | 7.6B | 600M | 1.36B | 500M | 831M | 799M |
| Lease liabilities (JPY) | 1.07B | 934M | 926M | 979M | 933M | 816M | 8.62B | 9.71B | 10.4B | 9.86B |
| Cash and deposits (JPY) | 94.4B | 87.2B | 97.6B | 83.8B | 103B | 105B | 117B | 133B | 114B | 92.5B |
| Intangible assets (JPY) | 15.7B | 14.6B | 14.8B | 14.4B | 14.2B | 14.3B | 14.5B | 14.1B | 23.3B | 25.5B |
| Net debt (borrowings + leases - cash) (JPY) | -92.7B | -85.6B | -95.9B | -75.3B | -94.9B | -104B | -107B | -123B | -103B | -81.8B |
| Cash flow detail | ||||||||||
| Operating cash flow (JPY) | 33B | — | 37.1B | — | 23.3B | 17.8B | 20.3B | 30.4B | 18.4B | 11.1B |
| Purchases of property, plant and equipment (JPY) | -15.2B | — | -18B | — | -8.66B | -2.94B | -4.25B | -3.38B | -18.8B | -17.1B |
| Purchases of intangible assets (JPY) | -1.91B | — | -1.89B | — | -2.08B | -1.64B | -2.85B | -2.14B | -2.29B | -4.33B |
| Change in receivables (cash effect) (JPY) | -3.8B | — | 6.25B | — | -1.2B | -4.01B | -7.44B | 8.71B | -3.78B | -5.98B |
| Change in inventories (cash effect) (JPY) | -10.4B | — | -822M | — | 3.75B | -4.54B | -3.01B | -329M | 1.31B | -3.28B |
| Change in payables (cash effect) (JPY) | 2.67B | — | -6.12B | — | -522M | 2.87B | 2.08B | 1.59B | -7.15B | 1.87B |
| Dividends paid (cash effect) (JPY) | -9.7B | — | -10.8B | — | -8.84B | -6.85B | -7.42B | -7.99B | -7.99B | -7.99B |
| Interest paid (cash effect) (JPY) | -2M | — | -13M | — | -15M | -10M | -67M | -16M | -13M | -62M |
| Income taxes paid (cash effect) (JPY) | -17.5B | — | -17.2B | — | -5.43B | -8.36B | -5.65B | -7.87B | -6.55B | -8.84B |
| Operating cash flow before change in receivables (JPY) | 36.8B | — | 30.8B | — | 24.5B | 21.8B | 27.7B | 21.7B | 22.2B | 17.1B |
| Free cash flow (OCF - PPE - intangibles) (JPY) | 15.9B | — | 17.2B | — | 12.5B | 13.2B | 13.2B | 24.9B | -2.67B | -10.3B |
| Income detail | ||||||||||
| Research and development expense (JPY) | 5.4B | — | 6.3B | — | 6B | 4.36B | 6.09B | 6.46B | 6.38B | 6.93B |
| ↳ 5y CAGR | +4.3% | |||||||||
| Total comprehensive income (JPY) | 36.4B | — | 26.7B | — | 15.2B | 20.2B | 28.9B | 16B | 15.6B | 21.3B |
| Comprehensive income to owners (JPY) | 34.4B | — | 25.6B | — | 15.2B | 19.7B | 28B | 15.1B | 14.1B | 19.8B |
| Provision for credit losses (JPY) | — | — | 0.00 | — | 201M | 180M | 105M | 108M | 6M | — |
| Credit cost ratio (credit losses / average receivables) (%) | — | — | 0.0% | — | 0.5% | 0.3% | 0.1% | 0.1% | 0.0% | — |
| Segments | ||||||||||
| Cosmetaries Business · Segment revenue (JPY) | — | — | — | — | — | 34.4B | 52.2B | 57.7B | 64.7B | 64.5B |
| ↳ YoY growth | +52.1% | +10.4% | +12.3% | -0.3% | ||||||
| Cosmetaries Business · Segment operating income (JPY) | — | — | — | — | — | -752M | 1.1B | 2.94B | 6.98B | 6.25B |
| Cosmetics Business · Segment revenue (JPY) | — | — | — | — | — | 189B | 235B | 240B | 255B | 262B |
| ↳ YoY growth | +24.3% | +2.3% | +6.2% | +2.7% | ||||||
| Cosmetics Business · Segment operating income (JPY) | — | — | — | — | — | 22.7B | 25.4B | 17.9B | 15.1B | 16.8B |
| Reported | Jun 27, 2019 | Feb 12, 2020 | Jun 29, 2021 | Feb 10, 2021 | Jun 29, 2021 | Mar 30, 2023 | Mar 30, 2023 | Mar 28, 2024 | Mar 28, 2025 | Mar 24, 2026 |
Sign up to see institutional holdings
Sign UpPodcast Mentions
Sign up to see podcast mentions and sentiment
Sign UpTimely disclosures published on TDnet, newest first, titles as filed in Japanese. The link opens the disclosure on TDnet. Filings with EDINET (periodic reports, extraordinary reports, offerings, holding and buy-back reports), newest first, titles as filed in Japanese. The link opens the filing on EDINET. Press releases from the company's own website, newest first.
通期連結業績予想の修正に関するお知らせ
Bull 0
Bear 4
Guidance
変更報告書(特例対象株券等)(三井住友トラスト・アセットマネジメント株式会社)
Bull 0
Bear 0
Routine
 (アダプタビリティ エイト)
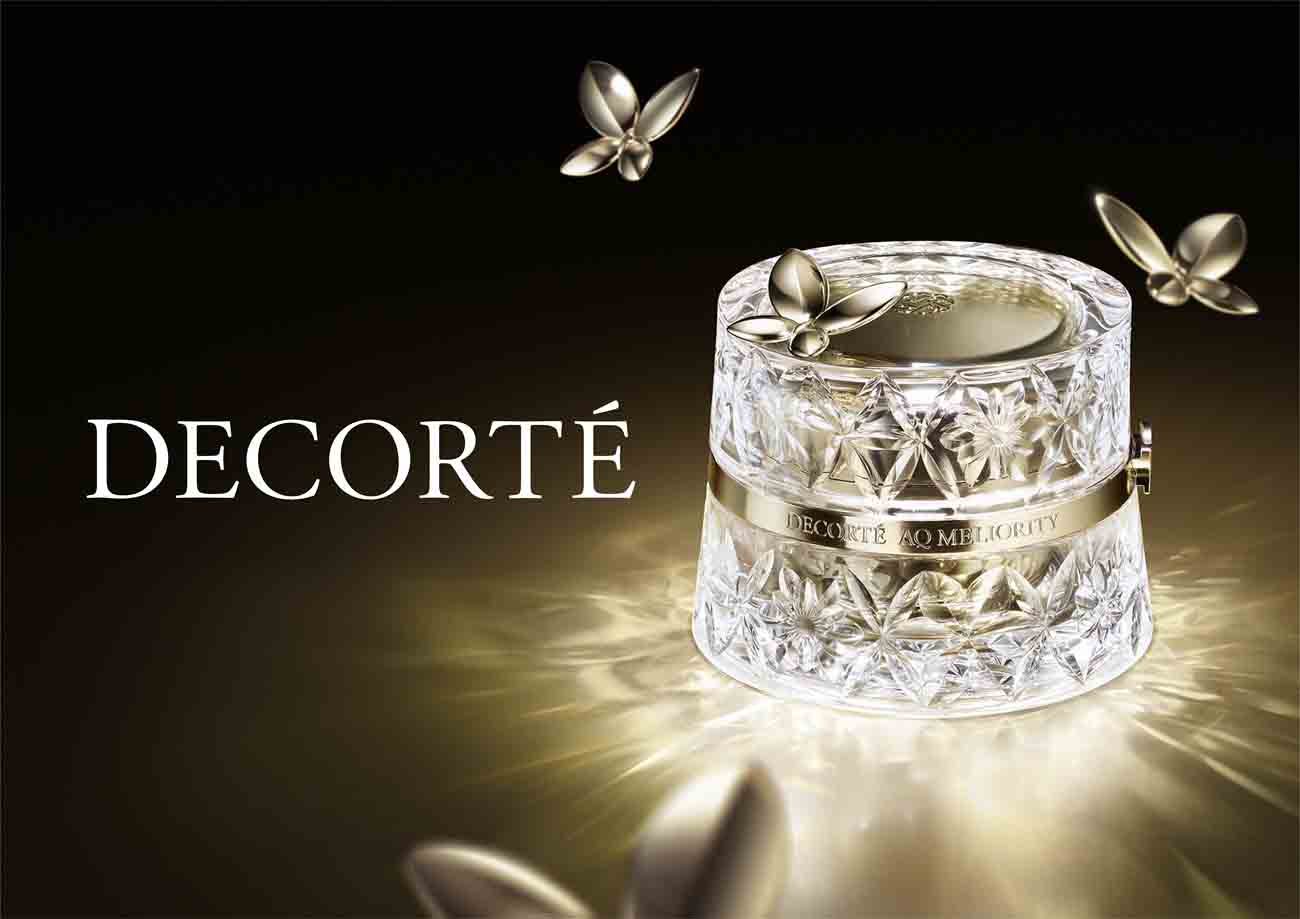

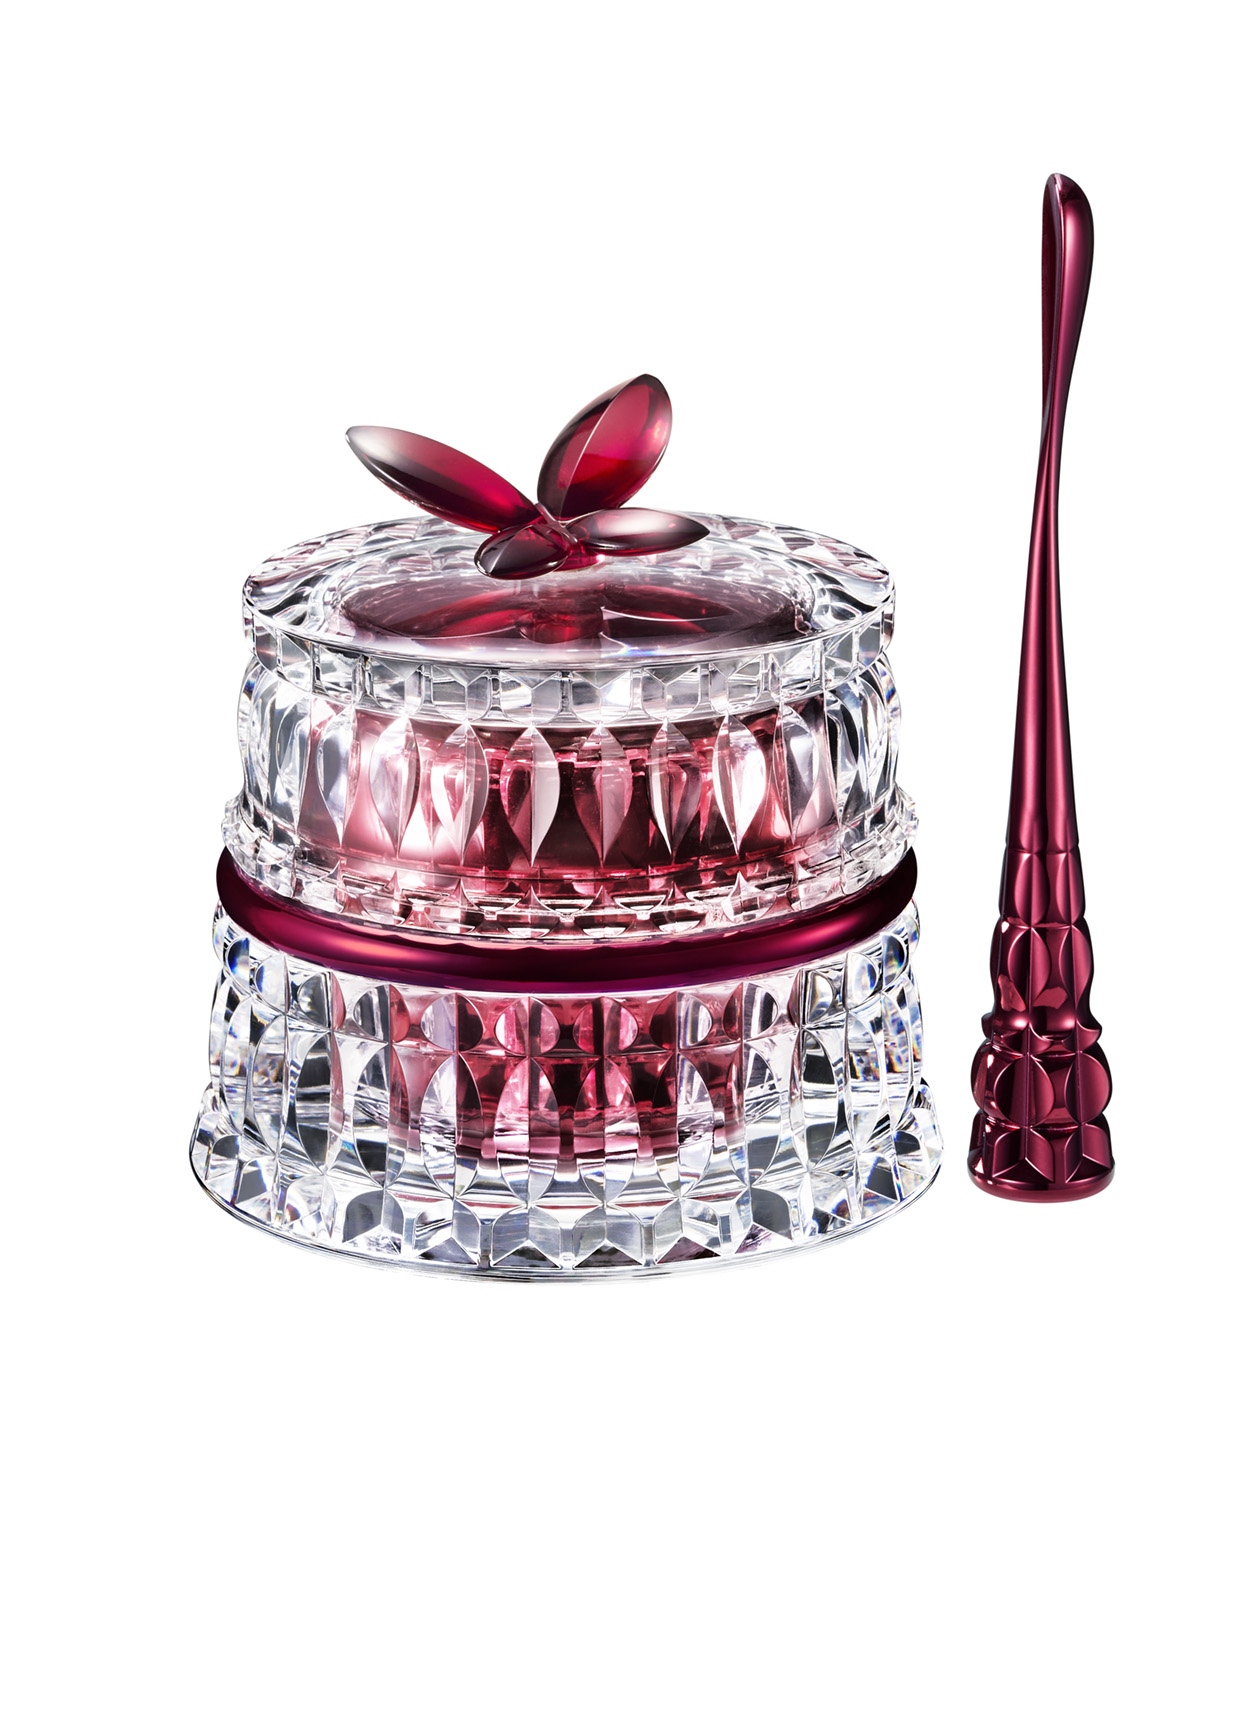
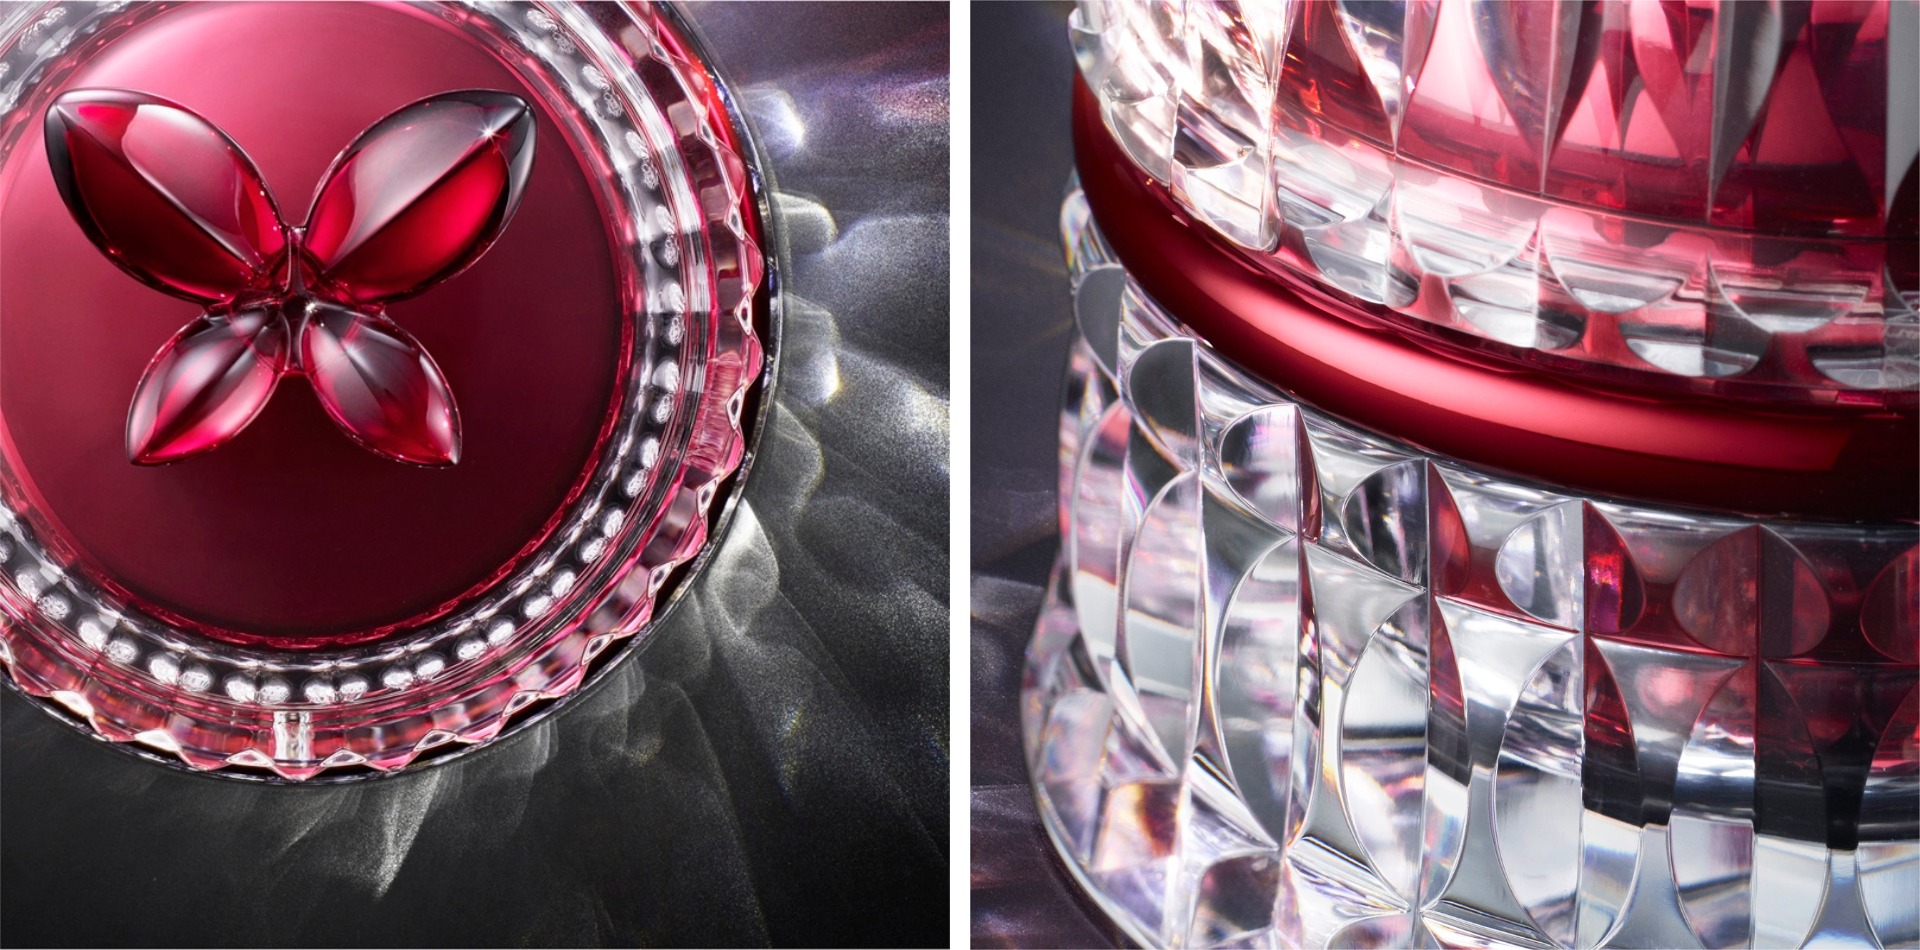 なお、2021 年 2 月 16 日にブランド50 周年を記念して、バカラ社のクリスタルガラスを用いた「コスメデコルテ AQミリオリティ インテンシブクリームn Baccarat Edition」を限定発売していますが、この度発売する商品は、数量限定ではなく、確実にお客さまへお届けする受注販売※3として展開します。
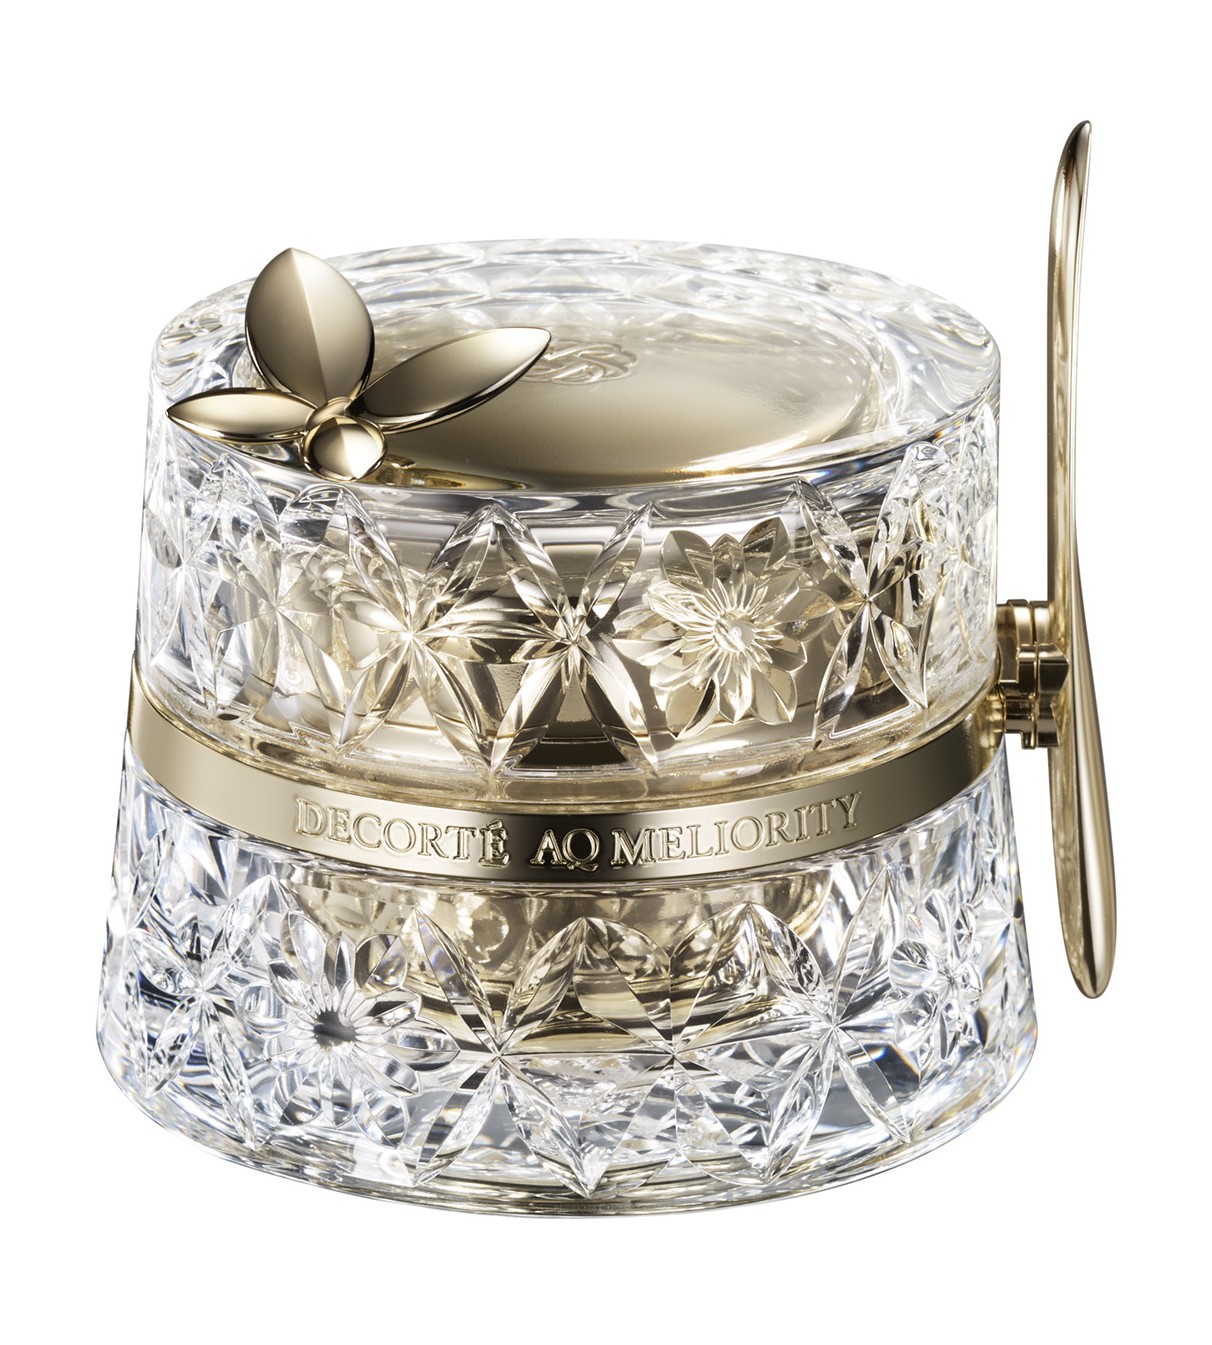 独自研究により新しく編み出した、うるおいによって肌の未来を美の連鎖にみちびく成分「ロンジェネクス※8」や、これまで発売してきたエイジングケア商品のキー成分などを含む、40種の美容成分を網羅的に配合。湧き上がるようなハリ・弾力感のあふれる、明るくしなやかでキメの整った肌を叶えます。
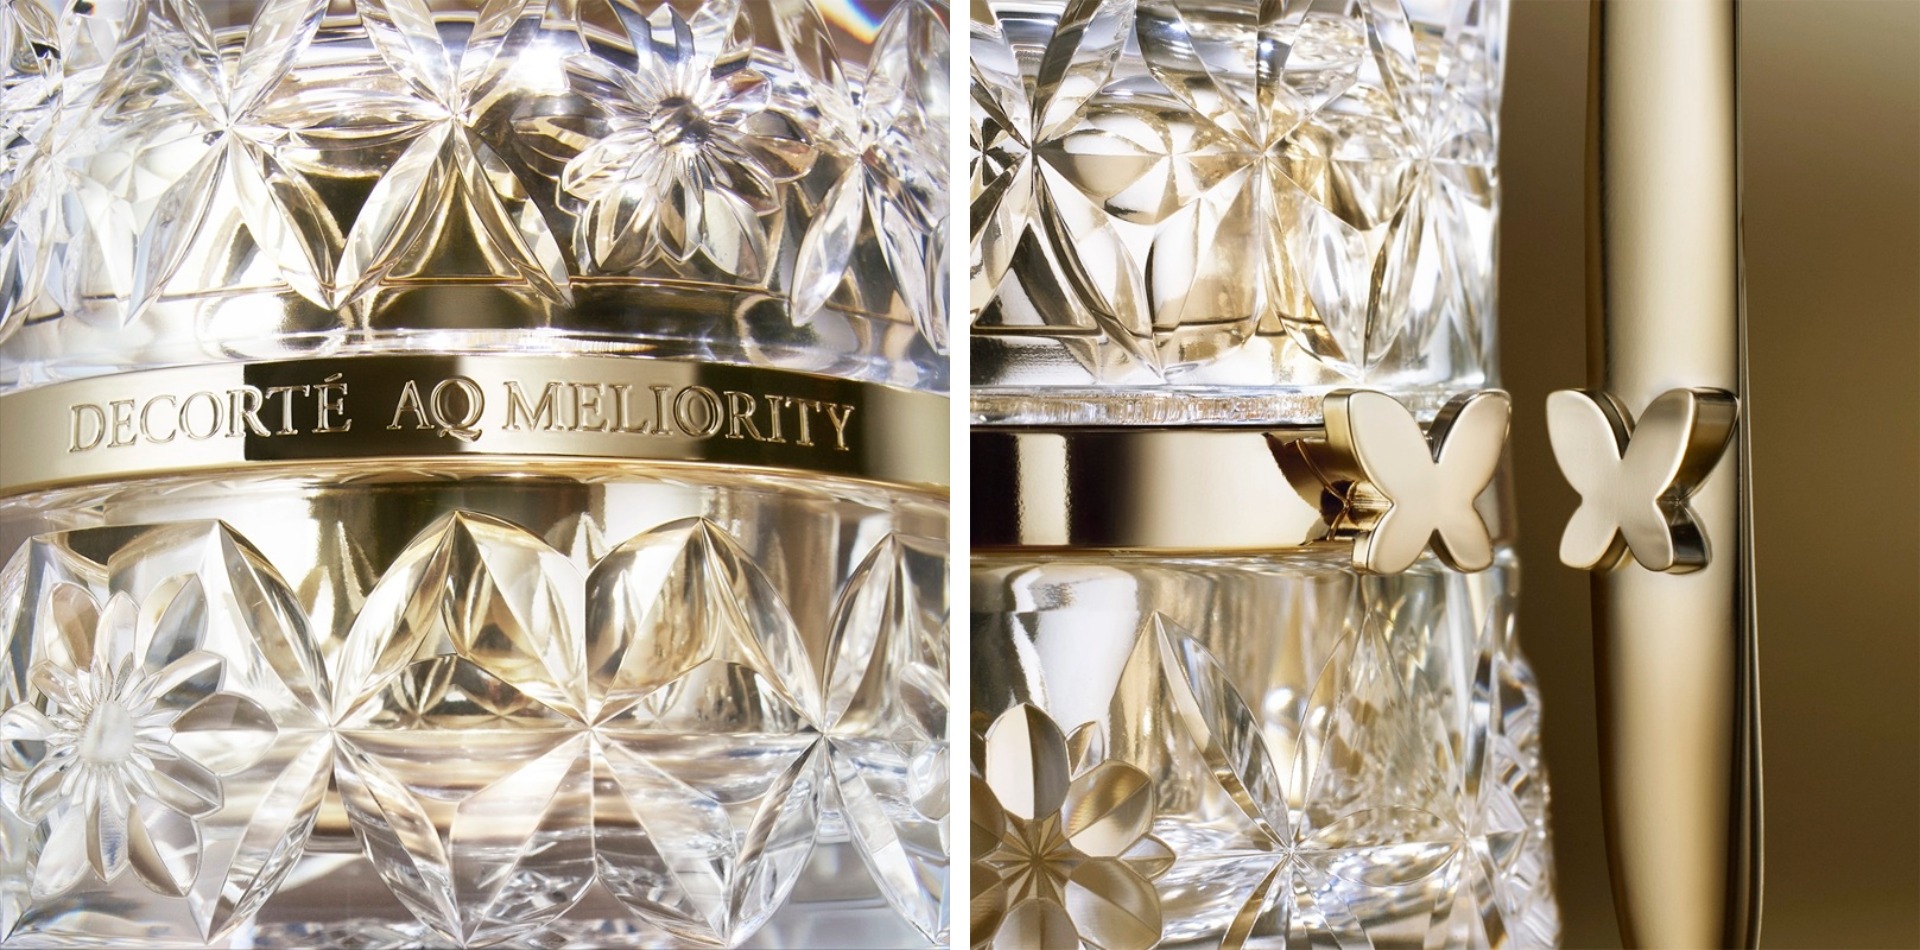 「ザ クリーム デコラシオン」では、ガラス容器全体に、2つの花をイメージしたオリジナルパターン「Blooming Skin Pattern」を精緻な彫刻で施し、美しく咲き誇る花のように輝きを放つ、再生を繰り返す肌を表現しました。上品なシャンパンゴールドのパーツが、より洗練された印象へ昇華させます。手指になじむ形状、マグネットでスパチュラを装着できる仕様など、使用性にも配慮した設計です。レフィル式を採用したことで、ガラス容器はお手元で長くご愛用いただけます。
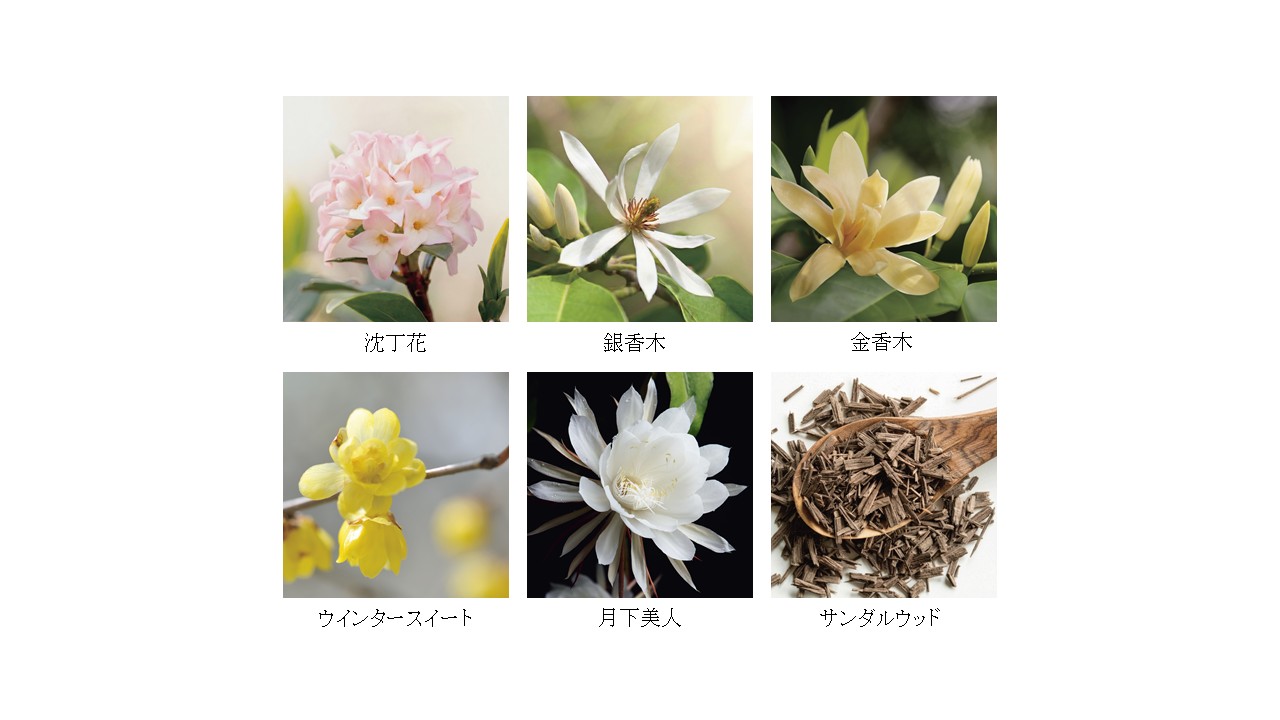 高級感あふれる濃厚な甘さと爽やかさが上品に溶け合い、心まで美しく整える「リュクスフローラルムスキー」。“不死”を花言葉に持つ爽やかな沈丁花(じんちょうげ)と、甘く濃厚なホワイトフローラル調の香りの銀香木、金香木、ウインタースイート、月下美人、サンダルウッドを中心とした、みずみずしくも高級感のある香りを開発しました。
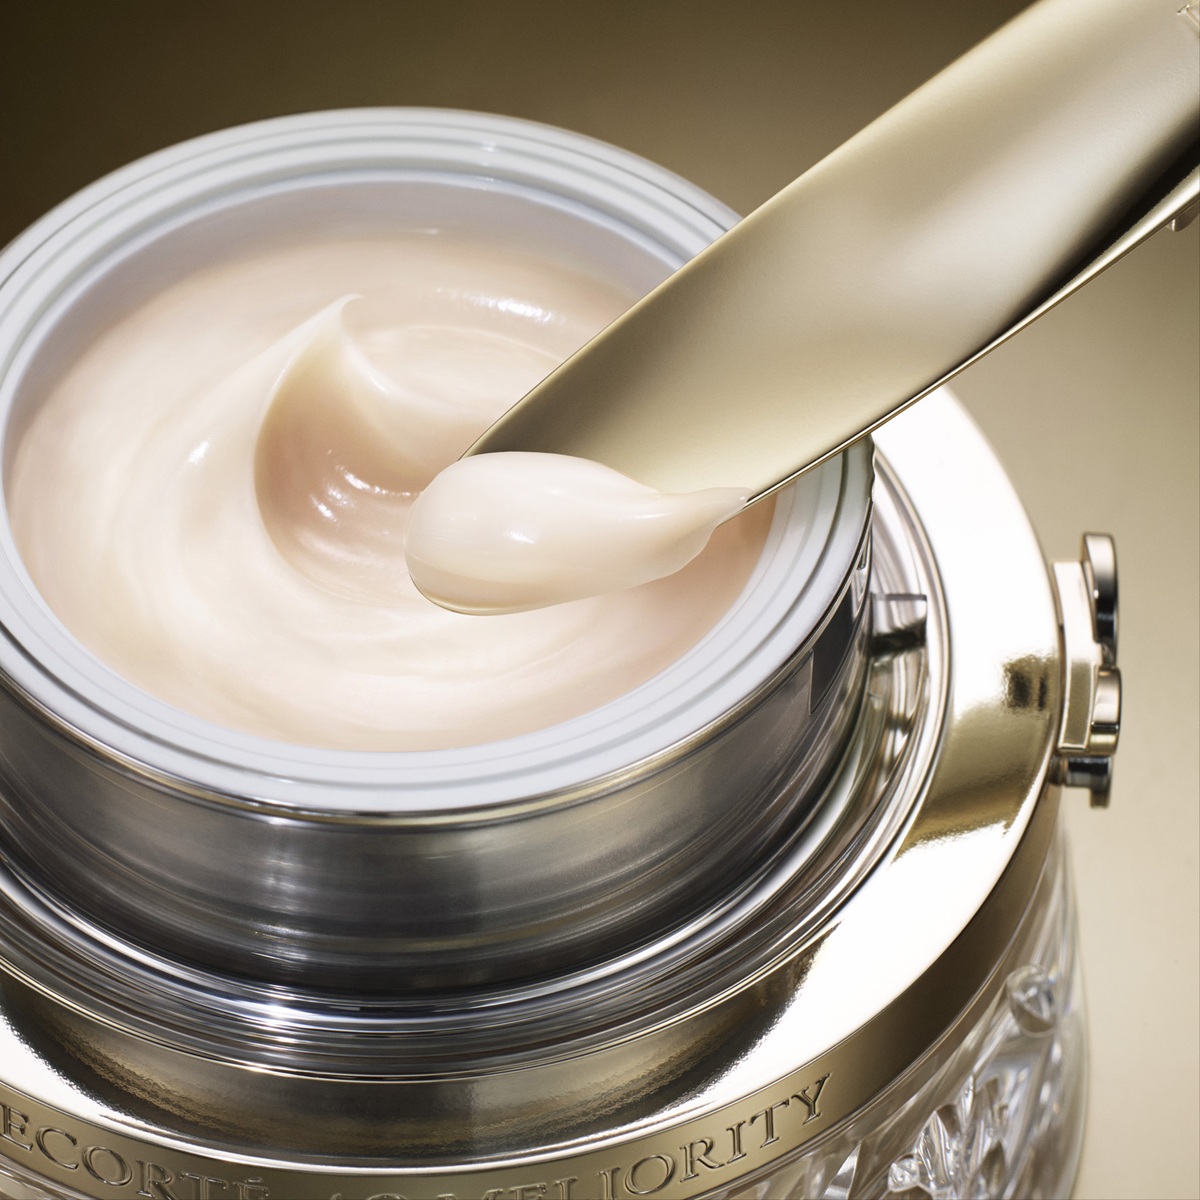 クリームに求めるテクスチャーの嗜好性が異なることから、日本向けとグローバル向けで異なる処方を設計しました。日本向けは、ベタつきや重さを残さず肌と一体化するようになじみ、うるおいによって湧き上がるようなハリ・ツヤを感じるエッセンスタッチを極めました。グローバル向けは、海外で支持される“リフトアップ感”を重視したテクスチャー。朝使用することも多いことを想定し、すぐにメイクアップできるようななじみの良さとべたつきのない上質なあと肌感を実現しました。
 「AQ」スキンケア商品などに配合している、世界有数の植物研究施設との共同研究により開発された金香木の花のエキス。幸福感と肌の関係から着目した成分で、ハリ・弾力感のある肌を叶えます。
 モクレン科の植物で、花は婚礼時の花輪として使われることもあり、「祝いの木」とも呼ばれています。うるおいに満ちた透明感あふれる肌へ整えます。
 「AQ」スキンケア商品などに配合している、心を満たすいやしに着目した成分。限られた環境下でしか生育できない貴重な白檀の木から抽出したエキスが、みずみずしいうるおいを叶えます。
 「屋久島」の潤沢な水と肥沃な土壌で育まれた茶葉から抽出したエキス。農薬、科学肥料を一切使わない有機栽培により育てられた茶葉を、一枚一枚丁寧に摘み取ります。メチル化カテキンとポリフェノールを多く含んでいます。
 茶葉の中でも最も希少な部位である「一芯二葉」を丁寧に手摘みして抽出したエキス。赤道直下、標高約2,000mの高地で栽培される紫茶は、強い紫外線のもとで成長するため、ポリフェノールの含有量が高く、アントシアニンも含んでいます。
 古来より伝わる植物から選び抜かれた恵み。「甦る力」を秘めた肌と、美しさを呼び覚ます「心」のメカニズムに着目した「肌・感度」を磨くための根幹をなす成分です。
 天然ミネラル・アミノ酸等を豊富に含み、雪どけを迎えるわずか4週間しか採取できない希少な白樺の樹液と、白樺の樹皮の効果を凝縮したエキスの複合成分です。
 高級品質の丹波産黒大豆から抽出。アントシアニンを多く含有しています。
 最先端の皮膚科学、厳選素材、卓越した技術のすべてを結集し、徹底的に肌への効果にこだわりぬくことを哲学とした、『コスメデコルテ』最高峰のクオリティを誇るライン。その名には、“AQ(Absolute Quality):最高の品質”を、“MELIORITY:卓越した技術で届ける”という意味が込められています。
 1963年オランダ生まれ。アムステルダムを拠点に世界で活躍するプロダクト&インテリアデザイナー。個人のクライアントから、Alessi、Baccarat、bisazza、Christofle、KLMオランダ航空、Hyatt Hotels corporationなど、世界をリードするトップブランドのデザインを手掛ける。


 (アダプタビリティ エイト)

Prompts
Click prompts to add them under the company line, click again to take one out, then copy the result into your AI chat. Shared by Asian Century Stocks and Uncovered Thai Stocks. Thank you.
KOSE Holdings Corporation (ticker 4922), listed in Japan.
Copied
ETFs Holding KOSE Holdings Corporation
Exchange-traded funds whose newest published daily portfolio holds one of the company's listings, largest weight first.
| ETF | Weight in ETF | Shares | Market value | As of |
|---|---|---|---|---|
| DFIS | 0.05% | 71,800 | $ 2.639M | Nov 12, 2026 |
| DFIC | 0.02% | 69,300 | $ 2.547M | Nov 12, 2026 |
| DFSI | 0.02% | 5,300 | $ 194.764K | Nov 12, 2026 |
| DXIV | 0.02% | 1,000 | $ 36.748K | Nov 12, 2026 |
| DFAX | 0.01% | 24,300 | $ 892.976K | Nov 12, 2026 |
| DFAI | 0.01% | 25,236 | $ 927.372K | Nov 12, 2026 |
| AVDS | 0.00% | 200 | $ 7,731.71 | Nov 16, 2026 |