EDINET提出書類 ライオン株式会社(E00991) 半期報告書 【表紙】 【提出書類】 半期報告書 【根拠条文】 金融商品取引法第24条の5第1項の表の第1号 【提出先】 関東財務局長 【提出日】 2026年8月10日 【中間会計期間】 第166期中(自 【会社名】 ライオン株式会社…
EDINET提出書類
ライオン株式会社(E00991)
半期報告書
【表紙】
【提出書類】
半期報告書
【根拠条文】
金融商品取引法第24条の5第1項の表の第1号
【提出先】
関東財務局長
【提出日】
2026年8月10日
【中間会計期間】
第166期中(自
【会社名】
ライオン株式会社
【英訳名】
Lion Corporation
【代表者の役職氏名】
代表取締役兼社長執行役員
【本店の所在の場所】
東京都台東区蔵前一丁目3番28号
【電話番号】
03‐6739‐3711
【事務連絡者氏名】
執行役員
【最寄りの連絡場所】
東京都台東区蔵前一丁目3番28号
【電話番号】
03‐6739‐3711
【事務連絡者氏名】
執行役員
【縦覧に供する場所】
株式会社東京証券取引所
2026年1月1日
経理部長
竹
経理部長
竹
至
2026年6月30日)
竹
森
生
征
彦
昭
彦
生
昭
之
(東京都中央区日本橋兜町2番1号)
ライオン株式会社
大阪オフィス
(大阪市中央区北久宝寺町三丁目6番1号本町南ガーデンシティ)
ライオン株式会社
名古屋オフィス
(名古屋市中区錦二丁目3番4号名古屋錦フロントタワー)
1/40
EDINET提出書類
ライオン株式会社(E00991)
半期報告書
第一部【企業情報】
第1 【企業の概況】
1 【主要な経営指標等の推移】
第165期
中間連結会計期間
回次
自
2025年
1月 1日
至 2025年
6月30日
会計期間
第166期
中間連結会計期間
自
2026年
1月 1日
至 2026年
6月30日
第165期
自
2025年
1月 1日
至 2025年
12月31日
売上高
(百万円)
199,459
216,836
422,092
税引前中間(当期)利益
(百万円)
14,650
22,504
39,433
中間(当期)利益
(百万円)
11,137
12,702
31,049
(百万円)
9,609
10,844
27,587
(百万円)
6,075
14,133
36,831
親会社の所有者に帰属する持分
(百万円)
295,973
332,760
322,726
資産合計
(百万円)
468,808
532,799
528,596
(円)
34.75
39.20
99.74
(円)
34.71
39.16
99.64
(%)
63.1
62.5
61.1
親会社の所有者に帰属する
中間(当期)利益
親会社の所有者に帰属する
中間(当期)包括利益
基本的1株当たり
中間(当期)利益
希薄化後1株当たり
中間(当期)利益
親会社所有者帰属持分比率
営業活動による
(百万円)
1,848
9,539
40,648
キャッシュ・フロー
投資活動による
(百万円)
△15,107
△3,674
△43,460
キャッシュ・フロー
財務活動による
(百万円)
△6,374
△11,209
△12,406
キャッシュ・フロー
現金及び現金同等物の
(百万円)
80,777
83,401
88,092
中間期末(期末)残高
(注) 1 当社は要約中間連結財務諸表を作成しておりますので、提出会社の主要な経営指標等の推移については記載
しておりません。
2 上記指標は、国際財務報告基準(IFRS)により作成した要約中間連結財務諸表および連結財務諸表に基づいて
おります。
2 【事業の内容】
当中間連結会計期間において、当社および当社の関係会社が営む事業の内容について、重要な変更はありません。
2/40
EDINET提出書類
ライオン株式会社(E00991)
半期報告書
第2 【事業の状況】
1 【事業等のリスク】
当中間連結会計期間において、新たに発生した事業等のリスクはありません。
また、前事業年度の有価証券報告書に記載した事業等のリスクについて重要な変更はありません。
2 【経営者による財政状態、経営成績及びキャッシュ・フローの状況の分析】
文中の将来に関する事項は、当中間連結会計期間の末日現在において当社グループ(当社および連結子会社)が判
断したものであります。
(1) 経営成績の状況
当中間期の連結業績は、売上高2,168億3千6百万円(前年同期比8.7%増、為替変動の影響を除いた実質前年同期
比4.5%増)、事業利益153億3千4百万円(前年同期比21.3%増)、営業利益207億3百万円(同54.7%増)、親会社
の所有者に帰属する中間利益108億4千4百万円(同12.9%増)となりました。
当社グループは、「収益力の強靭化」をテーマに、昨年よりスタートした中期経営計画「Vision(ビジョ
ン)2030 2nd(セカンド) STAGE(ステージ)」において掲げる3つの基本方針「事業ポートフォリオマネ
ジメントの強化」、「経営基盤の強化」、「ダイナミズムの創出」にもとづく施策を、事業環境の変化に対応しな
がらスピーディに推進しています。
最重点事業であるオーラルヘルスケアについては、国内外において主力ブランドのハミガキを改良新発売するな
ど、高付加価値品の育成に注力し、事業の拡大に努めました。チャレンジ事業に位置付けるビューティケアでは、
オーストラリアでナチュラルビューティケア製品を製造・販売する、PNB Consolidated Pty Ltdを1月に100%子会
社とするとともに、薬品においては、ベトナムで医薬品新工場の建設を決定するなど、持続的な成長に向けた取組
みを進めました。なお、構造改革事業に位置付けていた化学品子会社2社の株式譲渡を6月末に完了しました。
また、当中間期は、中東情勢の緊迫化を背景とした原材料価格の高騰やサプライチェーンの混乱など、経営環境
の厳しさが増す中、当社グループにおいても一部の原材料で調達コスト上昇等の影響を受けましたが、製品の安定
供給を最優先に様々な追加施策を速やかに実行するなど、影響の最小化に全社一丸となって努めたこともあり、冒
頭の業績となりました。
[経営成績の概況]
当中間期(百万円)
前中間期(百万円)
増減率
売上高
216,836
199,459
8.7%
事業利益
15,334
12,639
21.3%
営業利益
20,703
13,379
54.7%
親会社の所有者に帰属する中間利益
10,844
9,609
12.9%
(注)事業利益は、売上総利益から販売費及び一般管理費を控除したもので、恒常的な事業の業績を測る当社の利益指標です。
[セグメントごとの経営成績]
売上高
当中間期
(百万円)
前中間期
(百万円)
一般用消費財事業
123,646
121,739
産業用品事業
27,579
海外事業
事業利益
当中間期
(百万円)
前中間期
(百万円)
増減率
1.6%
9,787
9,136
7.1%
28,698
△3.9%
1,459
1,462
△0.2%
100,859
84,237
19.7%
5,276
3,176
66.1%
その他
3,832
5,261
△27.2%
△77
△33
―
小計
255,918
239,936
6.7%
16,445
13,742
19.7%
調整額
△39,081
△40,476
―
△1,111
△1,102
―
合計
216,836
199,459
8.7%
15,334
12,639
21.3%
増減率
3/40
EDINET提出書類
ライオン株式会社(E00991)
半期報告書
セグメントごとの経営成績は、次のとおりであります。
なお、セグメントごとの経営成績については、セグメント内およびセグメント間の内部売上高を含んでおりま
す。
① 一般用消費財事業
当事業は、「オーラルヘルスケア分野」、「ビューティケア分野」、「ファブリックケア分野」、「リビングケ
ア分野」、「薬品分野」、「その他の分野」で構成されています。全体の売上高は、前年同期比1.6%の増加とな
りました。事業利益は、前年同期比7.1%の増加となりました。
当中間期(百万円)
前中間期(百万円)
増減率
売上高
123,646
121,739
1.6%
事業利益
9,787
9,136
7.1%
[売上高の分野別状況]
当中間期(百万円)
前中間期(百万円)
増減率
オーラルヘルスケア分野
40,535
36,971
9.6%
ビューティケア分野
13,111
13,089
0.2%
ファブリックケア分野
28,280
28,921
△2.2%
リビングケア分野
10,001
12,052
△17.0%
薬品分野
11,392
10,950
4.0%
その他の分野
20,324
19,753
2.9%
(注)本年1月の組織体制の変更にもとづく業績管理区分の見直しに伴い、当中間連結会計期間より、従来、一般用消費財事業の
「その他の分野」に含まれていたギフト・ノベルティ関連取引およびグループ内の一部内部取引を、商品カテゴリーごとに
「オーラルヘルスケア分野」「ビューティケア分野」「ファブリックケア分野」「リビングケア分野」「薬品分野」に組み
替えて表示しております。なお、前中間連結会計期間についても、当該変更を反映したものに組み替えて開示しております。
(オーラルヘルスケア分野)
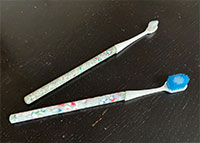
当分野は、「ハミガキ」、「ハブラシ」、「デンタルリンス」等で構成されています。
ハミガキは、「クリニカアドバンテージ ハミガキ」が前年同期を大幅に上回るとともに、4月に改良新発売した
高付加価値品「システマ ハグキプラス プレミアム ハミガキ」がお客様のご好評をいただいたことから、全体の
売上も前年同期を上回りました。
ハブラシは、「システマ ハブラシ」や「クリニカアドバンテージ ハブラシ」がともに好調に推移し、全体の売
上も前年同期を上回りました。
デンタルリンスは、「NONIO(ノニオ)プラスホワイトニング デンタルリンス」が好調に推移し、全体の売上も前
年同期を上回りました。
以上に加え、歯科ルート向け製品の売上が伸長したことから、分野全体の売上は、前年同期比9.6%の増加とな
りました。
(ビューティケア分野)
当分野は、「ハンドソープ」、「ボディソープ」等で構成されています。
ハンドソープは、「キレイキレイ薬用泡ハンドソープ」が前年同期を上回り、全体の売上も前年同期を上回りま
した。
ボディソープは、4月のブランドリステージに伴い発売した高付加価値新製品「hadakara(ハダカラ) 美肌プレミ
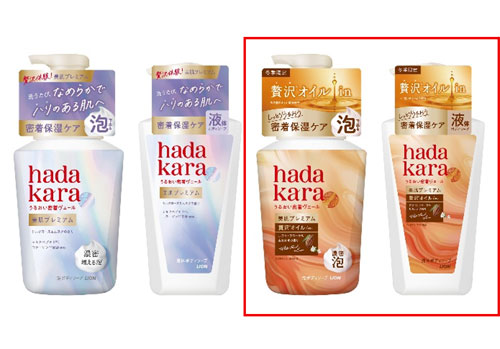
アム モイストボディケアソープ」がご好評をいただき、全体の売上は前年同期を上回りました。
以上により、分野全体の売上は、前年同期比0.2%の増加となりました。
4/40
EDINET提出書類
ライオン株式会社(E00991)
半期報告書
(ファブリックケア分野)
当分野は、「柔軟剤」、「洗濯用洗剤」等で構成されています。
洗濯用洗剤は、「トップ クリアリキッド抗菌」が好調に推移し、全体の売上も前年同期を上回りましたが、柔
軟剤で「ソフラン アロマリッチ」が前年同期を下回ったことから、分野全体の売上は、前年同期比2.2%の減少と
なりました。
※
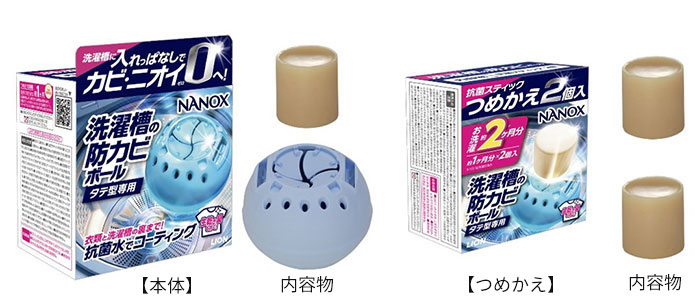
なお、洗濯がすすぎ0回・15分 で完了し、高い抗菌効果でニオイを抑制する衣料用洗剤「NANOX one(ナノック
スワン) 抗菌×時短」に加え、洗濯機にボールを入れるだけで、洗濯槽のカビ・ニオイ、衣類のしつこい生乾き臭
を防ぐ「NANOX(ナノックス) 洗濯槽の防カビボール タテ型専用」を一部販売店にて発売し、新たな洗濯習慣の提
案を行いました。
※国内洗濯機メーカーの代表機種ですすぎ0回の場合
(リビングケア分野)
当分野は、「住居用洗剤」、「台所用洗剤」等で構成されています。
住居用洗剤は、浴室用洗剤「ルックプラス バスタブクレンジング」が堅調に推移しましたが、昨年発売した
「ルックプラス トイレのまるごと除菌消臭くん煙剤」の反動減により、全体の売上は前年同期を下回りました。
台所用洗剤は、「CHARMY(チャーミー) Magica(マジカ)」が前年同期を下回り、全体の売上も前年同期を下回り
ました。
以上に加え、昨年10月に調理関連品ブランド「リード」を他社に譲渡した影響もあり、分野全体の売上は、前年
同期比17.0%の減少となりました。
(薬品分野)
当分野は、「解熱鎮痛薬」、「点眼剤」、「ニキビ薬」等で構成されています。
解熱鎮痛薬は、「バファリン プレミアム」が前年同期を上回りましたが、スタンダード品の「バファリンA」
が前年同期を下回り、全体の売上も前年同期を下回りました。
点眼剤は、「スマイル40 EX(イーエックス)」シリーズが前年同期を上回り、全体の売上も前年同期を上回りま
した。
ニキビ薬は「ペアアクネクリームW」が、足用冷却シートは「休足時間足すっきりシート」が、前年同期を大
幅に上回り、それぞれ全体の売上は前年同期を上回りました。
以上により、分野全体の売上は、前年同期比4.0%の増加となりました。
(その他の分野)
当分野は、ペット用品等で構成されています。
ペット用品は、猫用トイレの砂「ニオイをとる砂」が前年同期を上回るとともに、オーラルおやつ「PETKISS
(ペットキッス)」が順調に推移し、全体の売上も前年同期を上回りました。
以上により、分野全体の売上は、前年同期比2.9%の増加となりました。
5/40
EDINET提出書類
ライオン株式会社(E00991)
半期報告書
② 産業用品事業
当事業は、タイヤ用ゴムの防着剤等の「モビリティ分野」、二次電池用導電性カーボン等の「エレクトロニクス
分野」、油脂活性剤等の「ライフケミカル分野」、施設・厨房向け洗浄剤等の「業務用洗浄剤分野」等で構成され
ており、全体の売上高は、前年同期比3.9%の減少となりました。事業利益は、前年同期比0.2%の減少となりまし
た。
当中間期(百万円)
前中間期(百万円)
増減率
売上高
27,579
28,698
△3.9%
事業利益
1,459
1,462
△0.2%
モビリティ分野では、タイヤ用ゴムの防着剤が前年同期を上回ったことに加えて、車体等の塗料向け導電性カー
ボンが好調に推移し、全体の売上は前年同期を上回りました。
エレクトロニクス分野では、市場の回復を受け、二次電池用導電性カーボンが前年同期を大幅に上回り、全体の
売上も前年同期を上回りました。
ライフケミカル分野では、界面活性剤原料向けの油脂誘導体が前年同期を上回り、全体の売上は前年同期を上回
りました。
業務用洗浄剤分野では、衣料用洗剤が前年同期を大幅に上回りましたが、調理関連品ブランド「リード」を他社
に譲渡した影響により、全体の売上は前年同期を下回りました。
6/40
EDINET提出書類
ライオン株式会社(E00991)
半期報告書
③ 海外事業
海外は、タイ、マレーシア、オーストラリア等の東南・南アジア/オセアニア、中国、韓国等の北東アジアにお
いて事業を展開しております。全体の売上高は、前年同期比19.7%の増加(為替変動の影響を除いた実質前年同期
比は9.0%の増加)となりました。事業利益は、前年同期比66.1%の増加となりました。
当中間期(百万円)
前中間期(百万円)
増減率
売上高
100,859
84,237
19.7%
事業利益
5,276
3,176
66.1%
[地域別の状況]
当中間期(百万円)
東南・南アジア/
オセアニア
前中間期(百万円)
増減率
売上高
64,871
51,540
25.9%
事業利益
4,023
2,754
46.0%
売上高
35,987
32,697
10.1%
事業利益
1,253
422
196.8%
北東アジア
(注)本年1月にオーストラリアが加わったことから、従来の「東南・南アジア」の表記を「東南・南アジア/オセアニア」に変更し
ております。
東南・南アジア/オセアニア全体の売上高は、前年同期比25.9%の増加(為替変動の影響を除いた実質前年同期
比は13.4%の増加)、事業利益は46.0%の増加となりました。
北東アジア全体の売上高は、前年同期比10.1%の増加(為替変動の影響を除いた実質前年同期比は2.1%の増
加)、事業利益は196.8%の増加となりました。
[主要国の売上高]
当中間期(百万円)
前中間期(百万円)
増減率
タイ
35,733
33,367
7.1%
マレーシア
15,525
12,109
28.2%
中国
15,896
14,661
8.4%
韓国
10,449
9,831
6.3%
(タイ)
洗濯用洗剤は、地政学的な影響を受け近隣国への輸出が減少し、全体の売上は前年同期を下回りました。
ハミガキは、配荷拡大に取り組んだ「システマ」が前年同期を上回り、全体の売上は前年同期を上回りまし
た。
タイ全体の円貨換算後の売上は、為替変動の影響により、前年同期比7.1%の増加(為替変動の影響を除いた実
質前年同期比は3.6%の減少)となりました。
(マレーシア)
洗濯用洗剤は、「トップ」が液体洗剤を中心に好調に推移し、全体の売上は前年同期を上回りました。
ボディソープは、店頭での積極的なプロモーションにより「植物物語」が好調に推移し、全体の売上は前年同
期を大幅に上回りました。
以上により、マレーシア全体の売上は、前年同期比28.2%の増加(為替変動の影響を除いた実質前年同期比は
9.2%の増加)となりました。
7/40
EDINET提出書類
ライオン株式会社(E00991)
半期報告書
(中国)
ハミガキ、ハブラシは、主力ブランドで高付加価値の新製品を発売するなど拡売に注力し、第2四半期の全体の
売上は前年同期を上回りましたが、第1四半期に中間流通における在庫水準の適正化を推進したこともあり、当中
間期での全体の売上はともに前年同期を下回りました。
中国全体の円貨換算後の売上は、為替変動の影響により、前年同期比8.4%の増加(為替変動の影響を除いた実
質前年同期比は4.6%の減少)となりました。
(韓国)
洗濯用洗剤は、主力ブランド「BEAT(ビート)」のカプセル洗剤が前年同期を大幅に上回り、全体の売上も前年
同期を上回りました。
足用冷却シートは、「休足時間」が好調に推移し、全体の売上は前年同期を大幅に上回りました。
以上により、韓国全体の売上は、前年同期比6.3%の増加(為替変動の影響を除いた実質前年同期比は3.5%の増
加)となりました。
④ その他
建設請負事業等を含むその他では、全体の売上高は、前年同期比27.2%の減少となりました。
当中間期(百万円)
前中間期(百万円)
増減率
売上高
3,832
5,261
△27.2%
事業利益
△77
△33
―
8/40
EDINET提出書類
ライオン株式会社(E00991)
半期報告書
(2) 財政状態の状況
資産合計は、のれんの増加等により、前連結会計年度末と比較して42億3百万円増加し、5,327億9千9百万円とな
りました。資本合計は、101億4千5百万円増加し、3,585億6千5百万円となり、親会社所有者帰属持分比率は62.5%
となりました。
(3) キャッシュ・フローの状況
営業活動によるキャッシュ・フローは、税引前中間利益等により、95億3千9百万円の資金の増加となりました。
(前年同期は18億4千8百万円の資金の増加)
投資活動によるキャッシュ・フローは、連結範囲の変更を伴う子会社株式の取得による支出等により、36億7千4
百万円の資金の減少となりました。(前年同期は151億7百万円の資金の減少)
財務活動によるキャッシュ・フローは、長期借入金の返済による支出等により、112億9百万円の資金の減少とな
りました。(前年同期は63億7千4百万円の資金の減少)
以上の結果、当中間連結会計期間末の現金及び現金同等物の期末残高は、前連結会計年度末に比べ46億9千万円減
少し、834億1百万円となりました。また、前中間連結会計期間末に比べて26億2千4百万円増加しました。
(4) 事業上および財務上の対処すべき課題
当中間連結会計期間において、事業上および財務上の対処すべき課題について重要な変更はありません。
(5) 研究開発活動
当中間連結会計期間の研究開発費の総額は58億2千1百万円であります。
3 【重要な契約等】
当中間連結会計期間において、重要な契約等の決定又は締結等はありません。
9/40
EDINET提出書類
ライオン株式会社(E00991)
半期報告書
第3 【提出会社の状況】
1 【株式等の状況】
(1) 【株式の総数等】
① 【株式の総数】
種類
発行可能株式総数(株)
普通株式
1,185,600,000
計
1,185,600,000
② 【発行済株式】
種類
中間会計期間末
現在発行数(株)
(2026年6月30日)
提出日現在
発行数(株)
(2026年8月10日)
上場金融商品取引所
名又は登録認可金融
商品取引業協会名
内容
普通株式
279,782,746
279,782,746
東京証券取引所
プライム市場
株主としての権利内容に制限
のない、標準となる株式
単元株式数 100株
計
279,782,746
279,782,746
―
―
(2) 【新株予約権等の状況】
① 【ストックオプション制度の内容】
該当事項はありません。
② 【その他の新株予約権等の状況】
該当事項はありません。
(3) 【行使価額修正条項付新株予約権付社債券等の行使状況等】
該当事項はありません。
(4) 【発行済株式総数、資本金等の推移】
年月日
発行済株式
総数増減数
(千株)
発行済株式
総数残高
(千株)
資本金増減額
(百万円)
資本金残高
(百万円)
資本準備金
増減額
(百万円)
資本準備金
残高
(百万円)
2026年1月1日〜
2026年6月30日
─
279,782
─
34,433
─
31,499
10/40
EDINET提出書類
ライオン株式会社(E00991)
半期報告書
(5) 【大株主の状況】
氏名又は名称
住所
2026年6月30日現在
発行済株式
(自己株式を除
所有株式数
く。)の総数に対
(千株)
する所有株式数
の割合(%)
日本マスタートラスト信託銀行株
式会社(信託口)
東京都港区赤坂1丁目8番1号
赤坂インターシティAIR
36,537
13.17
株式会社日本カストディ銀行(信
託口)
東京都中央区晴海1丁目8-12
29,124
10.50
JAPAN ACTIVATION CAPITAL I
L.P.
(常任代理人株式会社三菱UFJ銀
行)
C/O WALKERS CORPORATE LIMITED, 190 ELGIN
AVENUE, GEORGE TOWN, GRAND CAYMAN, KY19008, CAYMAN ISLANDS
(東京都千代田区丸の内1丁目4番5号)
12,450
4.48
みずほ信託銀行株式会社退職給
付信託 みずほ銀行口再信託受託
者株式会社日本カストディ銀行
東京都中央区晴海1丁目8番12号
8,282
2.98
STATE STREET BANK AND TRUST
COMPANY 505001
(常任代理人株式会社みずほ銀行
決済営業部)
ONE CONGRESS STREET, SUITE 1, BOSTON,
MASSACHUSETTS
( 東京都港区港南 2 丁目 15-1 品川 イ ン タ ー シ
ティA棟)
7,709
2.77
明治安田生命保険相互会社
(常任代理人株式会社日本カスト
ディ銀行)
東京都千代田区丸の内2丁目1-1
(東京都中央区晴海1丁目8番12号)
3,690
1.33
JP MORGAN CHASE BANK 385781
(常任代理人株式会社みずほ銀行
決済営業部)
25 BANK STREET, CANARY WHARF, LONDON, E14
5JP, UNITED KINGDOM
( 東京都港区港南 2 丁目 15-1 品川 イ ン タ ー シ
ティA棟)
3,590
1.29
STATE STREET BANK AND TRUST
COMPANY 505103
(常任代理人株式会社みずほ銀行
決済営業部)
ONE CONGRESS STREET, SUITE 1, BOSTON,
MASSACHUSETTS
( 東京都港区港南 2 丁目 15-1 品川 イ ン タ ー シ
ティA棟)
3,571
1.28
BNY GCM CLIENT ACCOUNT JPRD AC
ISG (FE-AC)
(常任代理人株式会社三菱UFJ銀
行)
PETERBOROUGH COURT 133 FLEET STREET LONDON
EC4A 2BB UNITED KINGDOM
(東京都千代田区丸の内1丁目4番5号)
3,140
1.13
大日本印刷株式会社
東京都新宿区市谷加賀町1丁目1番1号
3,140
1.13
111,236
40.11
計
―
(注) 上記のほか、当社が所有している自己株式2,466千株があります。なお、当該自己株式には役員報酬BIP信託が保
有する当社株式は含まれておりません。
11/40
EDINET提出書類
ライオン株式会社(E00991)
半期報告書
(6) 【議決権の状況】
① 【発行済株式】
2026年6月30日現在
区分
株式数(株)
議決権の数(個)
内容
無議決権株式
―
―
―
議決権制限株式(自己株式等)
―
―
―
議決権制限株式(その他)
―
―
―
―
─
2,769,820
─
―
─
―
―
2,769,820
―
完全議決権株式(自己株式等)
完全議決権株式(その他)
単元未満株式
(自己保有株式)
普通株式
2,466,800
普通株式
276,982,000
普通株式
333,946
発行済株式総数
279,782,746
総株主の議決権
―
(注) 1 「単元未満株式」の株式数の欄には当社所有の自己株式10株が含まれております。
2 「完全議決権株式(その他)」および「単元未満株式」の株式数の欄には、株式会社証券保管振替機構名義の株
式が、それぞれ3,500株および50株含まれております。
3 「完全議決権株式(その他)」および「単元未満株式」の株式数の欄には、役員報酬BIP信託が保有する当社株
式が、それぞれ615,400株および77株含まれております。
② 【自己株式等】
所有者の氏名
又は名称
(自己保有株式)
ライオン株式会社
所有者の住所
台東区蔵前一丁目3番28号
計
―
2026年6月30日現在
発行済株式
所有株式数
総数に対する
の合計
所有株式数
(株)
の割合(%)
自己名義
所有株式数
(株)
他人名義
所有株式数
(株)
2,466,800
―
2,466,800
0.88
2,466,800
―
2,466,800
0.88
(注) 役員報酬BIP信託が保有する当社株式は、上記自己保有株式には含まれておりません。
2 【役員の状況】
役員の異動の状況
該当事項はありません。
12/40
EDINET提出書類
ライオン株式会社(E00991)
半期報告書
第4 【経理の状況】
1.要約中間連結財務諸表の作成方法について
当社の要約中間連結財務諸表は、「連結財務諸表の用語、様式及び作成方法に関する規則」(1976年大蔵省令第28
号。以下「連結財務諸表規則」という。)第312条の規定により、国際会計基準第34号「期中財務報告」(以下「IAS
第34号」という。)に準拠して作成しております。
また、当社は、金融商品取引法第24条の5第1項の表の第1号の上欄に掲げる会社に該当し、連結財務諸表規則第1編
及び第5編の規定により第1種中間連結財務諸表を作成しております。
2.監査証明について
当社は、金融商品取引法第193条の2第1項の規定に基づき、中間連結会計期間(2026年1月1日から2026年6月30日ま
で)に係る要約中間連結財務諸表について、EY新日本有限責任監査法人による期中レビューを受けております。
13/40
EDINET提出書類
ライオン株式会社(E00991)
半期報告書
1 【要約中間連結財務諸表】
(1) 【要約中間連結財政状態計算書】
(単位:百万円)
注記
番号
前連結会計年度
(2025年12月31日)
当中間連結会計期間
(2026年6月30日)
資産
流動資産
現金及び現金同等物
6
88,092
83,401
営業債権及びその他の債権
6
80,876
71,617
54,133
55,795
25,322
25,270
5,539
4,998
253,964
241,083
有形固定資産
125,239
118,195
のれん
19,580
38,569
無形資産
31,509
31,311
使用権資産
持分法で会計処理されている
投資
繰延税金資産
28,839
30,594
13,966
15,866
4,568
4,407
21,008
22,843
29,153
29,135
棚卸資産
その他の金融資産
6
その他の流動資産
流動資産合計
非流動資産
退職給付に係る資産
その他の金融資産
6
その他の非流動資産
非流動資産合計
資産合計
14/40
766
791
274,632
291,716
528,596
532,799
EDINET提出書類
ライオン株式会社(E00991)
半期報告書
(単位:百万円)
注記
番号
前連結会計年度
(2025年12月31日)
当中間連結会計期間
(2026年6月30日)
負債及び資本
負債
流動負債
営業債務及びその他の債務
6
借入金
6
114,139
103,406
―
1,115
未払法人所得税等
6,583
8,970
引当金
2,724
3,295
リース負債
2,061
2,543
1,317
1,438
9,369
6,560
136,196
127,331
繰延税金負債
6,618
8,407
退職給付に係る負債
4,755
4,193
引当金
2,224
2,229
リース負債
26,189
28,169
2,354
2,092
1,838
1,811
その他の金融負債
6
その他の流動負債
流動負債合計
非流動負債
その他の金融負債
6
その他の非流動負債
非流動負債合計
43,980
46,903
180,176
174,234
資本金
34,433
34,433
資本剰余金
31,419
31,452
負債合計
資本
自己株式
△3,304
△3,287
その他の資本の構成要素
7
27,987
29,621
利益剰余金
親会社の所有者に帰属する
持分合計
非支配持分
232,190
240,539
322,726
332,760
25,692
25,804
資本合計
348,419
358,565
528,596
532,799
負債及び資本合計
15/40
EDINET提出書類
ライオン株式会社(E00991)
半期報告書
(2) 【要約中間連結損益計算書及び要約中間連結包括利益計算書】
【要約中間連結損益計算書】
【中間連結会計期間】
(単位:百万円)
注記
番号
売上高
前中間連結会計期間
(自 2025年 1月 1日
至 2025年 6月30日)
4,5
売上原価
売上総利益
販売費及び一般管理費
当中間連結会計期間
(自 2026年 1月 1日
至 2026年 6月30日)
199,459
216,836
△108,920
△115,133
90,539
101,703
△77,899
△86,369
その他の収益
9
1,034
7,975
その他の費用
10
△294
△2,606
営業利益
4
13,379
20,703
金融収益
730
1,332
金融費用
△966
△540
持分法による投資利益
1,506
1,009
税引前中間利益
14,650
22,504
法人所得税費用
△3,513
△9,802
中間利益
11,137
12,702
9,609
10,844
中間利益の帰属
親会社の所有者
非支配持分
1,527
1,857
中間利益
11,137
12,702
1株当たり中間利益
基本的1株当たり中間利益(円)
12
34.75
39.20
希薄化後1株当たり中間利益(円)
12
34.71
39.16
16/40
EDINET提出書類
ライオン株式会社(E00991)
半期報告書
【要約中間連結包括利益計算書】
【中間連結会計期間】
(単位:百万円)
注記
番号
前中間連結会計期間
(自 2025年 1月 1日
至 2025年 6月30日)
中間利益
当中間連結会計期間
(自 2026年 1月 1日
至 2026年 6月30日)
11,137
12,702
△394
302
905
1,579
2
△42
512
1,839
△1
―
△5,024
1,396
△5,025
1,396
△4,512
3,235
6,624
15,937
6,075
14,133
その他の包括利益
純損益に振り替えられることのない項目
その他の包括利益を通じて公正価値で
測定される金融資産の純変動
確定給付型退職給付制度の再測定額
持分法適用会社におけるその他の
包括利益に対する持分
純損益に振り替えられることのない項目
合計
純損益に振り替えられる可能性のある
項目
キャッシュ・フロー・ヘッジの
公正価値の純変動
在外営業活動体の換算差額
純損益に振り替えられる可能性のある
項目合計
税引後その他の包括利益合計
中間包括利益
中間包括利益の帰属
親会社の所有者
非支配持分
549
1,804
中間包括利益
6,624
15,937
17/40
EDINET提出書類
ライオン株式会社(E00991)
半期報告書
(3) 【要約中間連結持分変動計算書】
前中間連結会計期間(自
2025年1月1日
至
2025年6月30日)
(単位:百万円)
親会社の所有者に帰属する持分
その他の資本の構成要素
注記
番号
2025年 1月 1日残高
資本金
資本剰余金
34,433
自己株式
31,327
新株予約権
△8,730
50
その他の包括
利益を通じて 確定給付型退
公正価値で測職給付制度の
定される金融
再測定額
資産の純変動
10,687
―
△399
905
△399
905
△407
△905
中間利益
その他の包括利益
中間包括利益合計
配当金
―
―
―
自己株式の取得
△1
自己株式の処分
194
自己株式の消却
―
8
7
△47
5,234
株式報酬取引
△55
支配継続子会社に
対する持分変動
その他の資本の
構成要素から
利益剰余金への
振替
所有者との取引額等
合計
2025年 6月30日残高
―
△55
5,427
△47
△407
△905
34,433
31,271
△3,303
2
9,880
―
親会社の所有者に帰属する持分
その他の資本の構成要素
注記
番号
2025年 1月 1日残高
キャッシュ・
フロー・ヘッ 在外営業活動
ジの公正価値体の換算差額
の純変動
1
13,009
中間利益
その他の包括利益
中間包括利益合計
配当金
23,749
212,938
293,717
21,976
315,694
―
9,609
9,609
1,527
11,137
△4,038
△3,534
△3,534
△978
△4,512
△4,038
△3,534
9,609
6,075
549
6,624
―
△3,869
△3,869
△1,261
△5,131
8
―
7
株式報酬取引
支配継続子会社に
対する持分変動
その他の資本の
構成要素から
利益剰余金への
振替
2025年 6月30日残高
資本合計
△1
自己株式の処分
所有者との取引額等
合計
合計
非支配持分
合計
△1
自己株式の取得
自己株式の消却
利益剰余金
△1
△1
△47
△39
106
106
―
△5,234
―
―
―
△55
△55
―
―
△1,312
1,312
―
45
45
―
―
―
△1,360
△7,831
△3,819
△1,216
△5,035
―
8,971
18,854
214,716
295,973
21,309
317,282
18/40
EDINET提出書類
ライオン株式会社(E00991)
半期報告書
当中間連結会計期間(自
2026年1月1日
至
2026年6月30日)
(単位:百万円)
親会社の所有者に帰属する持分
その他の資本の構成要素
注記
番号
2026年 1月 1日残高
資本金
資本剰余金
34,433
自己株式
31,419
新株予約権
△3,304
2
その他の包括
利益を通じて 確定給付型退
公正価値で測職給付制度の
定される金融
再測定額
資産の純変動
11,047
―
125
1,579
125
1,579
△75
△1,579
中間利益
その他の包括利益
中間包括利益合計
配当金
―
―
―
―
8
自己株式の取得
△1
自己株式の処分
18
株式報酬取引
33
その他の資本の
構成要素から
利益剰余金への
振替
所有者との取引額等
合計
2026年 6月30日残高
―
33
16
―
△75
△1,579
34,433
31,452
△3,287
2
11,097
―
親会社の所有者に帰属する持分
その他の資本の構成要素
注記
番号
2026年 1月 1日残高
キャッシュ・
フロー・ヘッ 在外営業活動
ジの公正価値体の換算差額
の純変動
―
中間包括利益合計
配当金
―
非支配持分
合計
資本合計
16,937
27,987
232,190
322,726
25,692
348,419
―
10,844
10,844
1,857
12,702
1,584
3,288
3,288
△53
3,235
1,584
3,288
10,844
14,133
1,804
15,937
―
△4,149
△4,149
△1,692
△5,841
中間利益
その他の包括利益
利益剰余金
合計
8
自己株式の取得
―
△1
△1
自己株式の処分
―
18
18
株式報酬取引
―
33
33
―
その他の資本の
構成要素から
利益剰余金への
振替
所有者との取引額等
合計
2026年 6月30日残高
△1,654
1,654
―
―
―
△1,654
△2,495
△4,099
△1,692
△5,791
―
18,521
29,621
240,539
332,760
25,804
358,565
19/40
EDINET提出書類
ライオン株式会社(E00991)
半期報告書
(4) 【要約中間連結キャッシュ・フロー計算書】
(単位:百万円)
注記
番号
前中間連結会計期間
(自 2025年 1月 1日
至 2025年 6月30日)
当中間連結会計期間
(自 2026年 1月 1日
至 2026年 6月30日)
営業活動によるキャッシュ・フロー
税引前中間利益
14,650
22,504
減価償却費及び償却費
10,058
11,520
減損損失
受取利息及び受取配当金
支払利息
持分法による投資損益(△は益)
固定資産処分損益(△は益)
27
122
△664
△728
386
507
△1,506
△1,009
106
175
―
△7,016
5,470
3,414
△3,790
△4,913
△10,792
△9,846
583
398
その他
△4,266
△2,908
小計
10,262
12,220
利息及び配当金の受取額
860
1,274
利息の支払額
法人所得税の支払額又は還付額(△は支
払)
営業活動によるキャッシュ・フロー
△19
△147
△9,254
△3,807
1,848
9,539
定期預金の純増減額(△は増加)
△2,274
△656
有形固定資産の取得による支出
△12,730
△4,582
関係会社株式売却益
営業債権及びその他の債権の増減額
(△は増加)
棚卸資産の増減額(△は増加)
営業債務及びその他の債務の増減額
(△は減少)
退職給付に係る資産及び負債の増減額
9
投資活動によるキャッシュ・フロー
有形固定資産の売却による収入
6
1
無形資産の取得による支出
△698
△395
その他の金融資産の取得による支出
△299
△106
843
164
13
―
△13,664
9,14
―
15,341
その他の金融資産の売却による収入
連結範囲の変更を伴う子会社株式の取得
による支出
連結範囲の変更を伴う子会社株式の売却
による収入
その他
投資活動によるキャッシュ・フロー
20/40
44
223
△15,107
△3,674
EDINET提出書類
ライオン株式会社(E00991)
半期報告書
(単位:百万円)
注記
番号
前中間連結会計期間
(自 2025年 1月 1日
至 2025年 6月30日)
当中間連結会計期間
(自 2026年 1月 1日
至 2026年 6月30日)
財務活動によるキャッシュ・フロー
短期借入金の純増減額(△は減少)
81
1,623
長期借入金の返済による支出
―
△5,537
配当金の支払額
△3,863
△4,148
非支配持分への配当金の支払額
△1,261
△1,692
リース負債の返済による支出
△1,375
△1,457
自己株式の取得による支出
△1
△1
非支配株主からの払込による収入
45
―
その他
1
4
△6,374
△11,209
現金及び現金同等物に係る換算差額
△1,829
653
現金及び現金同等物の増減額(△は減少)
△21,463
△4,690
現金及び現金同等物の期首残高
102,240
88,092
現金及び現金同等物の中間期末残高
80,777
83,401
財務活動によるキャッシュ・フロー
21/40
EDINET提出書類
ライオン株式会社(E00991)
半期報告書
【要約中間連結財務諸表注記】
1.報告企業
ライオン株式会社(以下、「当社」という。)は、日本の会社法に基づいた日本に所在する企業であります。当社お
よびその子会社(以下、「当社グループ」という。)の要約中間連結財務諸表は、2026年6月30日を末日とし、当社お
よび子会社、ならびに関連会社に対する当社グループの持分等により構成されております。
当社グループの主な事業内容および主要な活動につきましては、注記「4.セグメント情報」に記載しております。
2.作成の基礎
(1) IFRSに準拠している旨
当社グループの要約中間連結財務諸表は、連結財務諸表規則第1条の2第2号に規定する「指定国際会計基準特定会
社」の要件を満たすことから、同第312条の規定により、IAS第34号「期中財務報告」に準拠して作成しておりま
す。
(2) 要約中間連結財務諸表の承認
当社グループの要約中間連結財務諸表は、2026年8月7日に代表取締役兼社長執行役員および代表取締役兼副社長
執行役員(経理部分担)により承認されております。
(3) 測定の基礎
当社グループの要約中間連結財務諸表は、公正価値で測定される金融商品等を除き、取得原価を基礎として作成
しております。
(4) 機能通貨および表示通貨
当社グループの要約中間連結財務諸表は、当社の機能通貨である日本円を表示通貨としており、百万円未満を切
り捨てて表示しております。
(5) 会計上の見積り、判断および仮定
当社グループの要約中間連結財務諸表の作成において、経営者は、会計方針の適用ならびに資産、負債、収益お
よび費用の報告額に影響を及ぼす見積り、判断および仮定の設定を行っております。実際の業績はこれらの見積り
とは異なる場合があります。
見積りおよびその基礎となる仮定は継続して見直しております。これらの見積りの見直しによる影響は、当該見
積りを見直した期間および将来の期間において認識しております。
本要約中間連結財務諸表における重要な会計上の見積りおよび見積りを伴う判断は、前連結会計年度に係る連結
財務諸表と同様であります。
3.重要性がある会計方針
当社グループが本要約中間連結財務諸表において適用する会計方針は、前連結会計年度に係る連結財務諸表におい
て適用した会計方針と同様であります。なお、当中間連結会計期間の法人所得税費用は、見積平均年次実効税率を基
に算定しております。
22/40
EDINET提出書類
ライオン株式会社(E00991)
半期報告書
4.セグメント情報
(1) 報告セグメントの概要
当社グループの報告セグメントは、当社グループの構成単位のうち分離された財務情報が入手可能であり、取締
役会が、経営資源の配分の決定および業績を評価するために、定期的に検討を行う対象となっているものでありま
す。
当社グループは、製品別の事業本部を置き、各事業本部は、取り扱う製品の包括的な戦略を立案し、事業活動を
展開しております。国内の関係会社は、製品・サービスの特性に応じて営業活動を行っております。
海外の関係会社は、独立した経営単位であり、地域の特性に応じて営業活動を行っております。
したがって、当社グループは、事業本部および会社を基礎とした製品・サービス別および地域別のセグメントか
ら構成されており、「一般用消費財事業」、「産業用品事業」、「海外事業」の3つの報告セグメントに区分してお
ります。
当社グループの報告セグメントは、以下のとおりであります。
①
一般用消費財事業
主に日本において、日用品、一般用医薬品の製造販売および売買を行っております。
(主要製品)ハミガキ、ハブラシ、ハンドソープ、ボディソープ、柔軟剤、洗濯用洗剤、住居用洗剤、台所用
洗剤、解熱鎮痛薬、点眼剤、ペット用品
②
産業用品事業
主に日本において、化学品原料、業務用品等の製造販売および売買を行っており、海外諸地域への製造販売
および売買も含まれます。
(主要製品)油脂活性剤、導電性カーボン、業務用洗浄剤
③
海外事業
海外の関係会社において、主に日用品の製造販売および売買を行っております。
「その他」の区分は、報告セグメントに含まれない事業セグメントであり、日本において当社の子会社が、主に
当社グループ内の建設請負、不動産管理、人材派遣等を行っております。
23/40
EDINET提出書類
ライオン株式会社(E00991)
半期報告書
(2) 報告セグメントの売上高および業績
前中間連結会計期間(自
2025年1月1日
至
2025年6月30日)
(単位:百万円)
報告セグメント
売上高
(1) 外部顧客への
売上高
(2) セグメント間の
内部売上高又は
振替高(注)1
計
事業利益
その他
計
調整額
(注)2
連結
(注)3
一般用
消費財事業
産業用品
事業
海外事業
105,050
19,188
74,637
582
199,459
−
199,459
16,688
9,509
9,599
4,679
40,476
△40,476
−
121,739
28,698
84,237
5,261
239,936
△40,476
199,459
9,136
1,462
3,176
△33
13,742
△1,102
12,639
その他の収益
1,034
その他の費用
△294
営業利益
13,379
金融収益
730
金融費用
△966
持分法による投資利益
1,506
税引前中間利益
14,650
(注) 1
2
3
報告セグメント内の内部取引を含んでおります。
事業利益の調整額 △1,102百万円は、主に内部取引消去額および報告セグメントに帰属しない全社費用であ
ります。
売上総利益から事業利益への調整は以下のとおりです。
売上総利益
販売費及び一般管理費
事業利益
90,539百万円
△77,899百万円
12,639百万円
事業利益は、売上総利益から販売費及び一般管理費を控除した利益であり、当社の取締役会では事業利益
に基づいて事業セグメントの実績を評価しております。
24/40
EDINET提出書類
ライオン株式会社(E00991)
半期報告書
当中間連結会計期間(自
2026年1月1日
至
2026年6月30日)
(単位:百万円)
報告セグメント
売上高
(1) 外部顧客への
売上高
(2) セグメント間の
内部売上高又は
振替高(注)1
計
事業利益
その他
計
調整額
(注)2
連結
(注)3
一般用
消費財事業
産業用品
事業
海外事業
106,745
19,133
90,436
521
216,836
−
216,836
16,900
8,446
10,422
3,311
39,081
△39,081
−
123,646
27,579
100,859
3,832
255,918
△39,081
216,836
9,787
1,459
5,276
△77
16,445
△1,111
15,334
その他の収益
7,975
その他の費用
△2,606
営業利益
20,703
金融収益
1,332
金融費用
△540
持分法による投資利益
1,009
税引前中間利益
22,504
(注) 1
2
3
報告セグメント内の内部取引を含んでおります。
事業利益の調整額 △1,111百万円は、主に内部取引消去額および報告セグメントに帰属しない全社費用であ
ります。
売上総利益から事業利益への調整は以下のとおりです。
売上総利益
販売費及び一般管理費
事業利益
101,703百万円
△86,369百万円
15,334百万円
事業利益は、売上総利益から販売費及び一般管理費を控除した利益であり、当社の取締役会では事業利益
に基づいて事業セグメントの実績を評価しております。
25/40
EDINET提出書類
ライオン株式会社(E00991)
半期報告書
5.収益
当社グループは、事業本部および会社を基礎とした製品・サービス別および地域別のセグメントから構成されてお
り、「一般用消費財事業」、「産業用品事業」、「海外事業」の3つの報告セグメントに区分されております。当該報告
セグメントは、取締役会が、経営資源の配分の決定および業績を評価するために、定期的に検討を行う対象となってい
るものであることから、当該報告セグメントおよび報告セグメントの各事業に関連した事業において計上された収益を
売上高として表示しております。また、売上高は顧客の所在地を基礎とし、国又は地域に分類しております。
上記分解した売上高とセグメント売上高との関連は、以下のとおりであります。
なお、当中間連結会計期間より地域別の区分の見直しを行い、従来の「アジア」の区分を「アジア/オセアニア」に
変更し表示しております。この変更に伴い、前中間連結会計期間についても同様の区分に組み替えて開示しておりま
す。
前中間連結会計期間(自
2025年1月1日
至
2025年6月30日)
(単位:百万円)
アジア/オセアニア
日本
その他
合計
内、タイ
一般用消費財
105,022
28
−
−
105,050
産業用品
17,664
1,292
346
231
19,188
海外
19
74,069
31,047
549
74,637
その他
582
−
−
−
582
123,289
75,389
31,394
780
199,459
−
−
−
−
−
123,289
75,389
31,394
780
199,459
計
調整額
連結
当中間連結会計期間(自
2026年1月1日
至
2026年6月30日)
(単位:百万円)
アジア/オセアニア
日本
その他
合計
内、タイ
一般用消費財
106,702
43
−
−
106,745
産業用品
17,213
1,610
372
308
19,133
海外
23
89,072
33,326
1,340
90,436
その他
521
−
−
−
521
124,459
90,727
33,699
1,649
216,836
−
−
−
−
−
124,459
90,727
33,699
1,649
216,836
計
調整額
連結
一般用消費財事業は、主に日本において、日用品、一般用医薬品の製造販売および売買を行っており、主に国内の小
売業又は卸売業を営む企業および個人を顧客としております。
産業用品事業は、主に日本において、化学品原料、業務用品等の製造販売および売買を行っており、主に国内の化学
品メーカー・ホテル・レストラン・病院・介護施設・学校・官公庁・食品工場・リネンサプライ工場・クリーニング店
などを顧客としております。なお、海外諸地域への製造販売および売買も行っております。
海外事業は、海外の関係会社において、主に日用品の製造販売および売買を行っており、主に海外の小売業および卸
売業を営む企業を顧客としております。
その他は、日本において当社の子会社が、建設請負等、主に当社グループの各事業に関連した事業を行っておりま
す。
26/40
EDINET提出書類
ライオン株式会社(E00991)
半期報告書
6.金融商品
(金融商品の公正価値)
公正価値ヒエラルキーのレベル別分類
以下の表は、公正価値で測定される金融商品を評価方法ごとに分析したものであります。
公正価値の測定に利用するインプットをもとにそれぞれのレベルを以下のように分類しております。
なお、インプットには、株価、為替レートならびに金利および金融商品価格等に係る指数が含まれております。
・レベル1:活発な市場における(無調整の)公表価格により測定された公正価値
・レベル2:レベル1以外の、観察可能な価格を直接又は間接的に使用して算定された公正価値
・レベル3:重要な観察可能な市場データに基づかないインプットを含む、評価技法から算出された公正価値
(1) 公正価値で測定される金融商品
公正価値で測定される資産および負債は以下のとおりであります。
(単位:百万円)
前連結会計年度(2025年12月31日)
レベル1
レベル2
レベル3
合計
−
−
2,886
2,886
18,793
−
4,990
23,784
18,793
−
7,877
26,671
−
−
−
−
−
−
−
−
金融資産
その他の金融資産
純損益を通じて公正価値で測定される金融資産
その他の包括利益を通じて公正価値で測定される
金融資産
合計
金融負債
その他の金融負債
純損益を通じて公正価値で測定される金融負債
合計
(単位:百万円)
当中間連結会計期間(2026年6月30日)
レベル1
レベル2
レベル3
合計
−
−
3,243
3,243
18,655
−
5,076
23,731
18,655
−
8,319
26,974
−
−
1,673
1,673
−
−
1,673
1,673
金融資産
その他の金融資産
純損益を通じて公正価値で測定される金融資産
その他の包括利益を通じて公正価値で測定される
金融資産
合計
金融負債
その他の金融負債
純損益を通じて公正価値で測定される金融負債
合計
当社グループは、振替の原因となった事象又は状況の変化が認められた時点で、公正価値ヒエラルキーのレベル間
の振替を行っております。なお、前連結会計年度、当中間連結会計期間において、レベル1、2および3の間の振替はあ
りません。
公正価値の算定方法は以下のとおりであります。
(資本性金融商品)
市場価格が入手できる資本性金融商品の公正価値は、市場価格により算定しております。市場価格が入手できな
い資本性金融商品の公正価値は、主として、純資産に基づく評価モデル(株式発行会社の純資産に基づき、時価評
価により修正すべき事項がある場合は修正した金額により、企業価値を算定する方法)等により算定しておりま
す。
レベル3に分類された資本性金融商品について、観察可能な市場データに基づかないインプットを合理的に考え得
27/40
EDINET提出書類
ライオン株式会社(E00991)
半期報告書
る代替的な仮定に変更した場合の重要な公正価値の変動は、見込まれておりません。
(負債性金融商品)
負債性金融商品(公正価値で測定される金融資産)は、主に投資事業組合への出資金で構成されております。
投資事業組合への出資金の公正価値は、組合財産の公正価値を見積もった上、当該公正価値に対する持分相当額
で測定しております。従って、投資事業組合への出資金の公正価値の測定は、観察不能なインプットを用いている
ため、レベル3に分類しております。
レベル3に分類された金融商品の期首から中間期末までの変動は、以下のとおりであります。
その他の金融資産
(単位:百万円)
前中間連結会計期間
(自 2025年 1月 1日
至 2025年 6月30日)
期首残高
当中間連結会計期間
(自 2026年 1月 1日
至 2026年 6月30日)
6,444
7,877
純損益
△176
264
その他の包括利益
△281
86
購入
290
104
売却
−
△1
その他
△52
△12
期末残高
6,224
8,319
利得又は損失(注)
(注)純損益を通じて公正価値で測定される金融資産に関する利得又は損失は、要約中間連結損益計算書の「金融収
益」および「金融費用」に認識されており、その他の包括利益を通じて公正価値で測定される金融資産に関する
利得又は損失は、要約中間連結包括利益計算書の「その他の包括利益を通じて公正価値で測定される金融資産の
純変動」に認識されております。
その他の金融負債
前中間連結会計期間末において、その他の金融負債の残高はありません。
当中間連結会計期間末において、企業結合に伴い、条件付対価を新規に認識しております。当中間連結会計期間
末における当該負債の残高は、1,673百万円であります。
レベル3に分類される金融商品は、主に非上場株式により構成されており、担当部門が公正価値測定の評価方針およ
び手続きに従い、公正価値を測定しております。また、公正価値の測定結果につきましては、適切な責任者が承認し
ております。
(2) 償却原価で測定される金融商品
償却原価で測定される主な金融商品に係る公正価値の算定方法は以下のとおりであります。
なお、いずれも帳簿価額が公正価値の合理的な近似値となっているため、償却原価で測定される金融商品の公正価
値ヒエラルキーは記載しておりません。
(現金及び現金同等物、営業債権及びその他の債権、営業債務及びその他の債務)
短期間で決済されるため、公正価値は帳簿価額にほぼ等しいことから、当該帳簿価額によっております。
(借入金)
短期借入金は、短期間で決済されるため、公正価値は帳簿価額にほぼ等しいことから、当該帳簿価額によってお
ります。
28/40
EDINET提出書類
ライオン株式会社(E00991)
半期報告書
7.資本
(自己株式の消却)
前中間連結会計期間(自
2025年1月1日
至
2025年6月30日)
当社は、2025年4月28日開催の取締役会において、会社法第178条の規定にもとづき、自己株式を消却することを決
議し、実施いたしました。
1.自己株式の消却を行った理由
一株当たり当期利益(EPS)の成長を通じて株主価値の向上を図るため、自己株式の消却を行うものです。
2.自己株式の消却の内容
(1)消却した株式の種類
当社普通株式
(2)消却した株式の総数
4,650,000株
(3)消却後の発行済株式総数
279,782,746株
(4)消却実施日
2025年5月7日
当中間連結会計期間(自
2026年1月1日
至
2026年6月30日)
該当事項はありません。
29/40
EDINET提出書類
ライオン株式会社(E00991)
半期報告書
8.配当に関する事項
各年度における配当金の支払額は、以下のとおりであります。
前中間連結会計期間(自
2025年1月1日
決議
株式の種類
2025年2月13日
取締役会
普通株式
至
2025年6月30日)
配当金の総額
(百万円)
1株当たり配当額
(円)
3,877
14.00
基準日
効力発生日
2024年12月31日
2025年3月6日
(注) 2025年2月13日取締役会決議による配当金の総額には、役員報酬BIP信託が保有する自社の株式に対する配当
金 8百万円が含まれております。
当中間連結会計期間(自
2026年1月1日
決議
株式の種類
2026年2月12日
取締役会
普通株式
至
2026年6月30日)
配当金の総額
(百万円)
1株当たり配当額
(円)
4,159
15.00
基準日
効力発生日
2025年12月31日
2026年3月5日
(注) 2026年2月12日取締役会決議による配当金の総額には、役員報酬BIP信託が保有する自社の株式に対する配当
金 9百万円が含まれております。
基準日が当中間連結会計期間に属する配当のうち、配当の効力発生日が当中間連結会計期間末後となるものは、以
下のとおりであります。
前中間連結会計期間(自
決議
2025年8月7日
取締役会
2025年1月1日
株式の種類
至
2025年6月30日)
配当金の総額
(百万円)
普通株式
1株当たり配当額
(円)
4,159
15.00
基準日
効力発生日
2025年6月30日
2025年9月2日
(注) 2025年8月7日取締役会決議による配当金の総額には、役員報酬BIP信託が保有する自社の株式に対する配当金
9百万円が含まれております。
当中間連結会計期間(自
決議
2026年8月7日
取締役会
2026年1月1日
株式の種類
普通株式
至
2026年6月30日)
配当金の総額
(百万円)
1株当たり配当額
(円)
4,714
17.00
基準日
効力発生日
2026年6月30日
2026年9月2日
(注) 2026年8月7日取締役会決議による配当金の総額には、役員報酬BIP信託が保有する自社の株式に対する配当金
10百万円が含まれております。
30/40
EDINET提出書類
ライオン株式会社(E00991)
半期報告書
9.その他の収益
その他の収益の内訳は、以下のとおりであります。
(単位:百万円)
当中間連結会計期間
(自 2026年 1月 1日
至 2026年 6月30日)
前中間連結会計期間
(自 2025年 1月 1日
至 2025年 6月30日)
受取ロイヤリティー
429
453
関係会社株式売却益(注)
−
7,016
その他
605
505
1,034
7,975
合計
(注)当中間連結会計期間の関係会社株式売却益は、連結子会社であったライオン・スペシャリティ・ケミカルズ㈱
およびPT. Ipposha Indonesiaの株式を売却したことによるものであります。
10.その他の費用
その他の費用の内訳は、以下のとおりであります。
(単位:百万円)
前中間連結会計期間
(自 2025年 1月 1日
至 2025年 6月30日)
当中間連結会計期間
(自 2026年 1月 1日
至 2026年 6月30日)
固定資産処分損
110
175
減損損失
27
122
条件付対価に係る公正価値変動額(注)
―
1,670
特別退職金
―
358
その他
157
279
294
2,606
合計
(注)当中間連結会計期間の条件付対価に係る公正価値変動額は、PNB Consolidated Pty Ltd社の買収によるもので
あります。
11.偶発事象
保証債務の内訳は、以下のとおりであります。
(単位:百万円)
当中間連結会計期間
(2026年6月30日)
前連結会計年度
(2025年12月31日)
PT. Lion Wings
375
307
従業員
239
87
614
395
合計
(注)
上記保証債務は、保証先の借入金に対するものであります。
前連結会計年度の保証債務614百万円のうち187百万円については、当社の保証に対し他者からの再保証を受け
ております。
当中間連結会計期間の保証債務395百万円のうち153百万円については、当社の保証に対し他者からの再保証を
受けております。
31/40
EDINET提出書類
ライオン株式会社(E00991)
半期報告書
12.1株当たり当期利益
(1) 基本的1株当たり中間利益
前中間連結会計期間
(自 2025年 1月 1日
至 2025年 6月30日)
当中間連結会計期間
(自 2026年 1月 1日
至 2026年 6月30日)
9,609
10,844
276,537
276,678
34.75
39.20
前中間連結会計期間
(自 2025年 1月 1日
至 2025年 6月30日)
当中間連結会計期間
(自 2026年 1月 1日
至 2026年 6月30日)
9,609
10,844
−
−
9,609
10,844
276,537
276,678
ストックオプション(千株)
44
2
役員報酬BIP信託(千株)
272
260
276,854
276,941
34.71
39.16
親会社の所有者に帰属する中間利益(百万円)
普通株式の期中平均株式数(千株)
基本的1株当たり中間利益(円)
(2) 希薄化後1株当たり中間利益
親会社の所有者に帰属する中間利益(百万円)
中間利益調整額(百万円)
希薄化後1株当たり中間利益の計算に使用する
中間利益(百万円)
普通株式の期中平均株式数(千株)
希薄化後普通株式の期中平均株式数(千株)
希薄化後1株当たり中間利益(円)
32/40
EDINET提出書類
ライオン株式会社(E00991)
半期報告書
13.企業結合
前中間連結会計期間(自2025年1月1日
至2025年6月30日)
該当事項はありません。
当中間連結会計期間(自2026年1月1日
至2026年6月30日)
(1) 被取得企業の概要
名称
事業内容
PNB Consolidated Pty Ltd
ヘアケア、スキンケア製品等の製造販売
(2) 企業結合の概要
当社は、オーストラリアでビューティケア製品の製造・販売等の事業を展開するPNB Consolidated Pty Ltd社
(以下、「PNB社」)の全株式を取得し、本年1月20日付けで当社の100%子会社といたしました。
当社グループは、昨年スタートさせた中期経営計画「Vision2030 2nd STAGE」のテーマで
ある「収益力の強靭化」の実現に向け、事業ポートフォリオマネジメントの強化に取り組んでいます。
グループ内の各事業の方向性に沿った戦略施策を実行し、持続的な成長を図るべく、「最重点事業」に位置付
けるオーラルヘルスケア事業の成長加速と併せ、「チャレンジ事業」であるビューティケア事業では、新たな事
業機会の創出と成長が見込める海外を中心に事業機会の探索を行ってまいりました。
PNB社は、ナチュラルビューティケアブランド「Sukin」を中心に、オーストラリア国内にとどまらずアジア、
欧米を含む20以上の国・エリアに事業を展開し、高い収益性を誇っております。
「Sukin」は、自然由来の成分を使用した独自の世界観を形成し、オーストラリアの生活者から高い認知度と信
頼を得ており、主力のスキンケアを中心に、ヘアケアやボディケアなどのビューティケアカテゴリーにおいて、
生活者の毎日に寄り添う製品を幅広く展開しています。
「Sukin」は、オーストラリア国内でさらなる成長が見込めるうえ、当社グループが事業を展開するアジア市場
において、「Sukin」をビューティケア事業の中核ブランドの1つとして本格展開することで、新たな事業機会を
創出し、海外事業のさらなる拡大を図ることができると考えております。また、当社グループは主に東南アジア
などにおいてボディソープ、ハンドソープ等のビューティケア市場で一定のプレゼンスを有しており、既存事業
で得た知見を「Sukin」にも活用してまいります。
今後、PNB社の事業基盤と当社グループのアジアにおける事業ノウハウを融合させてシナジーを創出し、アジア
およびオーストラリアにおける「より良い習慣づくり」に貢献してまいります。
(3) 取得日
2026年1月20日
(4) 取得した議決権付資本持分の割合
100.0%
(5) 取得の対価
(単位:百万円)
金額
現金及び現金同等物
14,389
合計
14,389
(注) 契約の一部として、最大15,000千オーストラリア・ドルの支払いが発生する条件付対価が付されており
ます。当社グループとして、達成可能性等を見積もった結果、取得日時点においては条件付対価を認識
しておりません。
(6) 取得関連費用
取得関連費用として522百万円を、要約中間連結損益計算書上、「販売費及び一般管理費」に含めております。
33/40
EDINET提出書類
ライオン株式会社(E00991)
半期報告書
(7) 企業結合によるキャッシュ・フローへの影響
(単位:百万円)
金額
取得により支出した現金及び現金同等物
14,389
取得時に被取得会社が保有していた現金及び現金同等物
△725
合計
13,664
(8) 取得日現在における取得資産及び引受負債の公正価値
(単位:百万円)
金額
取得資産及び引受負債の公正価値
流動資産
4,835
現金及び現金同等物
725
棚卸資産
1,463
営業債権及びその他の債権
1,805
その他
840
非流動資産
6,709
有形固定資産
3,182
無形資産
944
使用権資産
2,305
繰延税金資産
276
流動負債
7,148
営業債務及びその他の債務
4,843
短期借入金
1,091
リース負債
307
その他
905
非流動負債
7,801
長期借入金
5,375
リース負債
2,225
その他
200
取得資産及び引受負債の公正価値(純額)
△3,405
のれん(注)2
17,794
(注)1. 上記のうち、一部の金額については取得原価の配分が完了していないため、現時点で入手可能な合理的
情報に基づき算定された暫定的な公正価値となっています。
2. のれんは、今後の事業展開や連結会社と被取得企業とのシナジーにより期待される将来の超過収益力を
反映したものであります。
(9) 業績に与える影響
当中間連結会計期間の要約中間連結損益計算書に含まれる当該企業結合から生じた売上高および中間利益、
並びに企業結合が期首に実施されたと仮定した場合の売上高および中間利益は、要約中間連結財務諸表に対す
る影響額に重要性がないため開示しておりません。
34/40
EDINET提出書類
ライオン株式会社(E00991)
半期報告書
14.支配の喪失
前中間連結会計期間(自2025年1月1日
至2025年6月30日)
該当事項はありません。
当中間連結会計期間(自2026年1月1日
至2026年6月30日)
(化学品事業子会社2社の株式譲渡)
(1)
支配の喪失の概要
当社は、連結子会社のライオン・スペシャリティ・ケミカルズ株式会社およびその子会社であるPT. Ipposha
Indonesiaの当社が保有する全株式を、株式会社アドバンテッジパートナーズがサービスを提供するファンドが組成
する特別目的会社、株式会社AP88へ譲渡することを決議し、株式譲渡契約を締結いたしました。また、2026年6月30
日に全株式の譲渡が完了いたしました。
(2)
支配の喪失を伴う資産及び負債
(単位:百万円)
項目
金額
支配喪失時の資産の内訳
流動資産
15,513
非流動資産
5,952
支配喪失時の負債の内訳
(3)
流動負債
5,874
非流動負債
719
支配の喪失に伴う損益
(単位:百万円)
項目
金額
支配の喪失に伴って認識した利益
7,263
売却に伴う付随費用
247
関係会社株式売却益
7,016
(4)
支配の喪失に伴う現金及び現金同等物の変動
(単位:百万円)
項目
金額
現金による受取対価
17,439
連結除外した子会社における現金及び現金同等物
2,097
連結範囲の変更を伴う子会社株式の売却による収入
15,341
35/40
EDINET提出書類
ライオン株式会社(E00991)
半期報告書
15.重要な後発事象
該当事項はありません。
36/40
EDINET提出書類
ライオン株式会社(E00991)
半期報告書
2 【その他】
2026年2月12日開催の取締役会において、2025年12月31日の最終の株主名簿に記録された株主に対し、次のとおり期
末配当を行うことを決議いたしました。
①
配当金の総額
②
1株当たりの金額
③
支払請求権の効力発生日および支払開始日
4,159,749,570円
15.00円
2026年3月5日
また、2026年8月7日開催の取締役会において、2026年6月30日の最終の株主名簿に記録された株主に対し、次のとお
り中間配当を行うことを決議いたしました。
①
配当金の総額
②
1株当たりの金額
③
支払請求権の効力発生日および支払開始日
4,714,370,912円
17.00円
2026年9月2日
37/40
EDINET提出書類
ライオン株式会社(E00991)
半期報告書
第二部【提出会社の保証会社等の情報】
該当事項はありません。
38/40
EDINET提出書類
ライオン株式会社(E00991)
半期報告書
独立監査人の中間連結財務諸表に対する期中レビュー報告書
2026年8月7日
ライオン株式会社
取締役会
御中
EY新日本有限責任監査法人
東
京
事
務
所
指定有限責任社員
業務執行社員
公認会計士
林
指定有限責任社員
業務執行社員
公認会計士
多
田
美
岐
雅
之
監査人の結論
当監査法人は、金融商品取引法第193条の2第1項の規定に基づき、「経理の状況」に掲げられているライオン株式会社
の2026年1月1日から2026年12月31日までの連結会計年度の中間連結会計期間(2026年1月1日から2026年6月30日まで)に
係る要約中間連結財務諸表、すなわち、要約中間連結財政状態計算書、要約中間連結損益計算書、要約中間連結包括利
益計算書、要約中間連結持分変動計算書、要約中間連結キャッシュ・フロー計算書及び注記について期中レビューを
行った。
当監査法人が実施した期中レビューにおいて、上記の要約中間連結財務諸表が、「連結財務諸表の用語、様式及び作
成方法に関する規則」第312条により規定された国際会計基準第34号「期中財務報告」に準拠して、ライオン株式会社及
び連結子会社の2026年6月30日現在の財政状態並びに同日をもって終了する中間連結会計期間の経営成績及びキャッ
シュ・フローの状況を適正に表示していないと信じさせる事項が全ての重要な点において認められなかった。
監査人の結論の根拠
当監査法人は、我が国において一般に公正妥当と認められる期中レビューの基準に準拠して期中レビューを行った。
期中レビューの基準における当監査法人の責任は、「要約中間連結財務諸表の期中レビューにおける監査人の責任」に
記載されている。当監査法人は、我が国における職業倫理に関する規定(社会的影響度の高い事業体の財務諸表監査に
適用される規定を含む。)に従って、会社及び連結子会社から独立しており、また、監査人としてのその他の倫理上の
責任を果たしている。当監査法人は、結論の表明の基礎となる証拠を入手したと判断している。
要約中間連結財務諸表に対する経営者並びに監査役及び監査役会の責任
経営者の責任は、国際会計基準第34号「期中財務報告」に準拠して要約中間連結財務諸表を作成し適正に表示するこ
とにある。これには、不正又は誤謬による重要な虚偽表示のない要約中間連結財務諸表を作成し適正に表示するために
経営者が必要と判断した内部統制を整備及び運用することが含まれる。
要約中間連結財務諸表を作成するに当たり、経営者は、継続企業の前提に基づき要約中間連結財務諸表を作成するこ
とが適切であるかどうかを評価し、国際会計基準第1号「財務諸表の表示」第4項に基づき、継続企業に関する事項を開
示する必要がある場合には当該事項を開示する責任がある。
監査役及び監査役会の責任は、財務報告プロセスの整備及び運用における取締役の職務の執行を監視することにあ
る。
要約中間連結財務諸表の期中レビューにおける監査人の責任
監査人の責任は、監査人が実施した期中レビューに基づいて、期中レビュー報告書において独立の立場から要約中間
連結財務諸表に対する結論を表明することにある。
監査人は、我が国において一般に公正妥当と認められる期中レビューの基準に従って、期中レビューの過程を通じ
て、職業的専門家としての判断を行い、職業的懐疑心を保持して以下を実施する。
・
主として経営者、財務及び会計に関する事項に責任を有する者等に対する質問、分析的手続その他の期中レビュー
手続を実施する。期中レビュー手続は、我が国において一般に公正妥当と認められる監査の基準に準拠して実施され
る年度の財務諸表の監査に比べて限定された手続である。
・
継続企業の前提に関する事項について、重要な疑義を生じさせるような事象又は状況に関して重要な不確実性が認
められると判断した場合には、入手した証拠に基づき、要約中間連結財務諸表において、国際会計基準第1号「財務諸
表の表示」第4項に基づき、適正に表示されていないと信じさせる事項が認められないかどうか結論付ける。また、継
39/40
EDINET提出書類
ライオン株式会社(E00991)
半期報告書
続企業の前提に関する重要な不確実性が認められる場合は、期中レビュー報告書において要約中間連結財務諸表の注
記事項に注意を喚起すること、又は重要な不確実性に関する要約中間連結財務諸表の注記事項が適切でない場合は、
要約中間連結財務諸表に対して限定付結論又は否定的結論を表明することが求められている。監査人の結論は、期中
レビュー報告書日までに入手した証拠に基づいているが、将来の事象や状況により、企業は継続企業として存続でき
なくなる可能性がある。
・
要約中間連結財務諸表の表示及び注記事項が、国際会計基準第34号「期中財務報告」に準拠していないと信じさせ
る事項が認められないかどうかとともに、関連する注記事項を含めた要約中間連結財務諸表の表示、構成及び内容、
並びに要約中間連結財務諸表が基礎となる取引や会計事象を適正に表示していないと信じさせる事項が認められない
かどうかを評価する。
・
要約中間連結財務諸表に対する結論表明の基礎となる、会社及び連結子会社の財務情報に関する証拠を入手する。
監査人は、要約中間連結財務諸表の期中レビューに関する指揮、監督及び査閲に関して責任がある。監査人は、単独
で監査人の結論に対して責任を負う。
監査人は、監査役及び監査役会に対して、計画した期中レビューの範囲とその実施時期、期中レビュー上の重要な発
見事項について報告を行う。
監査人は、監査役及び監査役会に対して、独立性についての我が国における職業倫理に関する規定を遵守したこと、
並びに監査人の独立性に影響を与えると合理的に考えられる事項、及び阻害要因を除去するための対応策を講じている
場合又は阻害要因を許容可能な水準にまで軽減するためのセーフガードを適用している場合はその内容について報告を
行う。
利害関係
会社及び連結子会社と当監査法人又は業務執行社員との間には、公認会計士法の規定により記載すべき利害関係はな
い。
以
(注) 1
2
上記の期中レビュー報告書の原本は当社(半期報告書提出会社)が別途保管しております。
XBRLデータは期中レビューの対象には含まれていません。
40/40
上