|
en inc. is a human resources services company operating in a single business segment. The group provides a range of recruitment and talent management services, including comprehensive job information sites, HR-tech solutions, and staffing agencies. Key platforms include En Shinkou for general job listings, engage for HR-tech recruitment support, and AMBI for early-career professionals. The company also serves middle-aged professionals through Mid no Tenkou and offers part-time job information via En Byte. Additional services include talent introduction through En Agent, new graduate scouting via iroots, and online reference checks with back check. The group supports corporate HR systems with consulting on personnel and evaluation structures. International operations are conducted through en world for global enterprises in Japan, Vietnam Works and Navigos Search in Vietnam, and New Era India for talent introduction and IT staffing in India. The company also provides recruitment management systems through Zeku and sales or marketing support via En SX and PRO SCOUT. Summarised from the annual report, fiscal year ended Mar 2026 |
Industry Staffing & Employment Services | Homepage corp.en-japan.com |
| Sector Industrials | IR page corp.en-japan.com | |
|
Tags
recruitment, hr-tech, staffing, talent management, job boards, executive search, it staffing, recruitment process outsourcing, En Shinkou, engage, AMBI, Mid no Tenkou, En Dispatch, En Byte, En Agent, iroots, back check, en world, Vietnam Works, Navigos Search, New Era India, Zeku, En SX, PRO SCOUT
|
Press page corp.en-japan.com/newsrelease |
Metrics
| Valuation | |
|---|---|
| Market cap | ¥ 87.55B |
| Market cap (USD) | $ 547.193M |
| P/E | 12.24 |
| PEG | — |
| P/BV | 2.50 |
| P/S | 1.56 |
| P/OCF | 14.96 |
| P/FCF | 39.90 |
| Dividend yield | 1.9% |
| Turnover / mcap | — |
| Returns | |
|---|---|
| ROE | 7.5% |
| ROI | 8.2% |
| ROIC | 9.0% |
| Profit margin | 4.4% |
| Growth | |
|---|---|
| Revenue growing | No |
| Profits growing | No |
| Revenue up 3y | No |
| Revenue up 5y | No |
| Earnings growth 3y (net profit CAGR) | -0.99% |
| Quality | |
|---|---|
| Profitable | Yes |
| Margin expanding | No |
| Buying back stock | No |
| Diluting (TTM) | No |
| Debt/Equity | — |
| Podcast bulls (TTM) | Sign up |
| Podcast bears (TTM) | Sign up |
| Podcast sentiment (TTM) | Sign up |
| Podcast sentiment % (TTM) | Sign up |
| News sentiment (TTM) | 17 |
| Quality score | -33.3% |
| Insiders | |
|---|---|
| Buys, 1w | Sign up |
| Buys, 1m | Sign up |
| Buys, 1y | Sign up |
| Sells, 1w | Sign up |
| Sells, 1m | Sign up |
| Sells, 1y | Sign up |
Sign up to see this company's insider trades
| Figure | FY 2026 | FY 2025 | FY 2024 | FY 2023 | FY 2022 | FY 2021 | FY 2020 | FY 2019 | FY 2018 | FY 2017 | FY 2016 | FY 2015 | FY 2014 | FY 2013 |
|---|---|---|---|---|---|---|---|---|---|---|---|---|---|---|
| Revenue | 59.093B | 65.678B | 67.661B | 67.716B | 54.544B | 42.725B | 56.848B | 48.733B | 40.71B | 31.719B | 26.135B | 19.623B | 16.755B | 13.563B |
| Net profit | 2.616B | 7.628B | 4.196B | 2.695B | 6.628B | 3.502B | 7.125B | 8.144B | 6.368B | 4.005B | 2.756B | 2.531B | 2.789B | 1.548B |
| Free cash flow | -749M | 4.256B | 2.468B | 1.695B | 9.478B | 3.834B | 6.287B | 10.445B | 8.329B | 7.378B | 4.745B | — | — | — |
| Figure | FY 2026 | FY 2025 | FY 2024 | FY 2023 | FY 2022 | FY 2021 | FY 2020 | FY 2019 | FY 2018 | FY 2017 | FY 2016 | FY 2015 | FY 2014 | FY 2013 |
|---|---|---|---|---|---|---|---|---|---|---|---|---|---|---|
| Share price | 1.112K | 1.643K | 2.698K | 2.279K | 2.952K | 3.415K | 2.022K | 3.22K | 6.169K | 2.48K | 1.901K | 825.36 | 917.51 | 625.69 |
| Price performance 12m | -0.32 | -0.39 | 0.18 | -0.23 | -0.14 | 0.69 | -0.37 | -0.48 | 1.49 | 0.3 | 1.3 | -0.1 | 0.47 | — |
Filed figures
Lines the statements and their notes report beside the headline figures, read from the filings' XBRL as filed (no restatement applied), with figures computed from one filing's own lines. Cash-flow lines carry their cash direction: an outflow is negative. Each period links to its filing; a figure's period, report date and tag are in its tooltip.
| Figure | Mar 2017 | Mar 2018 | Mar 2019 | Mar 2020 | Mar 2021 | Mar 2022 | Mar 2023 | Mar 2024 | Mar 2025 | Mar 2026 |
|---|---|---|---|---|---|---|---|---|---|---|
| Balance sheet detail | ||||||||||
| Trade receivables (JPY) | 3.57B | 4.66B | 5.61B | 5.74B | 4.35B | 5.47B | 6.47B | 6.02B | 6.44B | 7.24B |
| ↳ YoY growth | +16.2% | +30.7% | +20.4% | +2.2% | -24.2% | +25.7% | +18.3% | -7.0% | +7.0% | +12.4% |
| ↳ 5y CAGR | +7.2% | +8.9% | +6.8% | +1.4% | +2.3% | +10.7% | ||||
| Lease liabilities (JPY) | 25M | 8M | 0.00 | 338M | 250M | 221M | 264M | 762M | 551M | 388M |
| Cash and deposits (JPY) | 18.2B | 23.5B | 28.4B | 28.1B | 26.4B | 33.8B | 21.9B | 21.8B | 27.5B | 18.5B |
| Intangible assets (JPY) | 5.25B | 5.68B | 6.86B | 7.71B | 7B | 6.89B | 8.04B | 9.36B | 10.1B | 12.7B |
| Cash flow detail | ||||||||||
| Operating cash flow (JPY) | 7.6B | 9.46B | 10.7B | 8.04B | 5.65B | 11.5B | 4.45B | 6.43B | 8.06B | 3.55B |
| Purchases of property, plant and equipment (JPY) | -219M | -154M | -235M | -167M | -169M | -106M | -133M | -75M | -39M | -117M |
| Purchases of intangible assets (JPY) | -1.15B | -975M | -1.27B | -1.59B | -1.65B | -1.87B | -2.62B | -3.89B | -3.77B | -4.18B |
| Change in receivables (cash effect) (JPY) | -532M | -1.04B | -135M | -134M | 1.23B | -1.9B | -943M | 628M | -113M | -939M |
| Change in payables (cash effect) (JPY) | 13M | 34M | 15M | 360M | -24M | 645M | -106M | -197M | -12M | 1.7B |
| Dividends paid (cash effect) (JPY) | -826M | -1.32B | -2.23B | -3.01B | -3.56B | -1.75B | -3.31B | -3.14B | -3.02B | -3.02B |
| Share buybacks (cash effect) (JPY) | 0.00 | 0.00 | 0.00 | -1.59B | -1B | 0.00 | -5.87B | -4.13B | 0.00 | -5B |
| Interest paid (cash effect) (JPY) | — | — | — | -20M | -1M | -3M | -4M | -102M | -42M | -40M |
| Income taxes paid (cash effect) (JPY) | -2.07B | -2.65B | -3.4B | -3.6B | -3.13B | -2.6B | -3B | -1.03B | -2.06B | -3.62B |
| Operating cash flow before change in receivables (JPY) | 8.13B | 10.5B | 10.8B | 8.18B | 4.42B | 13.4B | 5.39B | 5.8B | 8.18B | 4.49B |
| Free cash flow (OCF - PPE - intangibles) (JPY) | 6.23B | 8.33B | 9.18B | 6.29B | 3.83B | 9.48B | 1.7B | 2.47B | 4.26B | -749M |
| Income detail | ||||||||||
| Total comprehensive income (JPY) | 3.85B | 6.26B | 8.28B | 7.04B | 3.36B | 7.24B | 3.07B | 4.65B | 8.25B | 2.37B |
| Comprehensive income to owners (JPY) | 3.84B | 6.25B | 8.14B | 6.91B | 3.33B | 7.11B | 3.26B | 4.57B | 8.25B | 2.37B |
| Provision for credit losses (JPY) | 157M | 65M | — | 55M | 56M | 4M | 464M | 138M | -47M | 154M |
| Credit cost ratio (credit losses / average receivables) (%) | 4.7% | 1.6% | — | 1.0% | 1.1% | 0.1% | 7.8% | 2.2% | 0.8% | 2.3% |
| Reported | Jun 28, 2017 | Jun 27, 2018 | Jun 26, 2019 | Jun 25, 2020 | Jun 25, 2021 | Jun 29, 2022 | Jul 31, 2023 | Jun 27, 2024 | Jun 23, 2025 | Jun 22, 2026 |
Sign up to see institutional holdings
Sign UpPodcast Mentions
Sign up to see podcast mentions and sentiment
Sign UpTimely disclosures published on TDnet, newest first, titles as filed in Japanese. The link opens the disclosure on TDnet. Filings with EDINET (periodic reports, extraordinary reports, offerings, holding and buy-back reports), newest first, titles as filed in Japanese. The link opens the filing on EDINET. Press releases from the company's own website, newest first.





















 「後悔しない仕事選び」を一緒に。
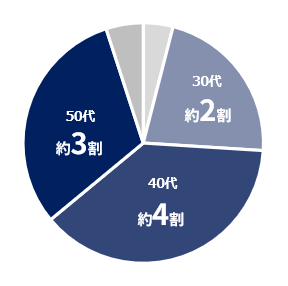
 30代・40代を中心とした
 若手ハイキャリアのための
 価値観の合う企業と出会える
 日本最大級。派遣のお仕事に
 オフィスワークなど「派遣バイト」
 フリーランスエンジニア向け
 エン転職の人材データベースを活用した
 人事戦略の精度を飛躍的に高める
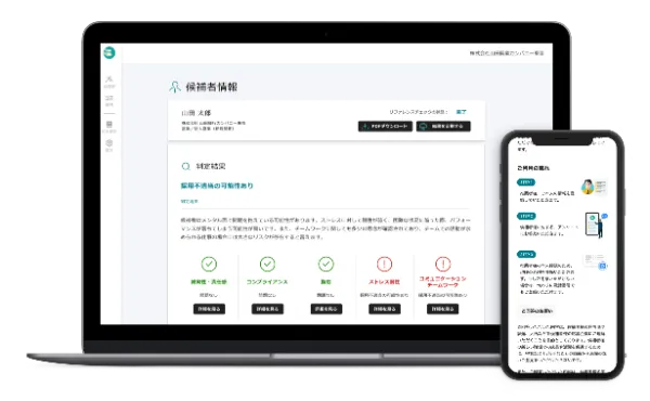
 入社後の離職リスクを可視化する
 考え方×スキルを可視化。
 スマホ回答で能力・価値観がわかる
 選考プロセスを一元管理。
 対話型AIを活用した
 採用ミスマッチを削減する選考ツール
 困ったらまずココで検索。
 入社後の活躍まで支援する
 外資系・グローバル求人に特化した
 年間5,000万ユーザーが利用する
 「営業変革」を通じた
 ベトナム国内最大級の求人情報サイト
Prompts
Click prompts to add them under the company line, click again to take one out, then copy the result into your AI chat. Shared by Asian Century Stocks and Uncovered Thai Stocks. Thank you.
ETFs Holding en inc.
Exchange-traded funds whose newest published daily portfolio holds one of the company's listings, largest weight first.
| ETF | Weight in ETF | Shares | Market value | As of |
|---|---|---|---|---|
| AVDV | 0.01% | 127,200 | $ 1.361M | Nov 16, 2026 |
| AVDS | 0.01% | 4,100 | $ 43.869K | Nov 16, 2026 |
| DFIS | 0.01% | 51,200 | $ 573.478K | Nov 12, 2026 |
| DXIV | 0.01% | 1,600 | $ 17.921K | Nov 12, 2026 |
| DFSI | 0.00% | 5,000 | $ 56.004K | Nov 12, 2026 |
| DFIC | 0.00% | 35,027 | $ 392.329K | Nov 12, 2026 |
| DFAI | 0.00% | 23,824 | $ 266.847K | Nov 12, 2026 |
| DFAX | 0.00% | 14,601 | $ 163.542K | Nov 12, 2026 |
| AVDE | 0.00% | 17,100 | $ 182.965K | Nov 16, 2026 |