1Q Fiscal Year 2026 Financial Results Briefing Materials August 10, 2026 Business Engineering Corporation Securities Code: 4828 TSE Prime © Business Engineering Corporation. Note: Fiscal Year 2026 or FY2026 represents the fiscal year ending March 31,…
1Q Fiscal Year 2026
Financial Results Briefing Materials
August 10, 2026
Business Engineering Corporation
Securities Code: 4828 TSE Prime
© Business Engineering Corporation.
Note: Fiscal Year 2026 or FY2026 represents the fiscal year ending March 31, 2027.
Agenda
- Summary of FY2026 1Q Financial Results and First Half Earnings Forecast
- AI Strategy: AI Powering a Stronger B-EN-G
- Earnings Forecast for FY2026
- Data Book
- Guide to IR Reference Materials
© Business Engineering Corporation.
2
- Summary of FY2026 1Q Financial Results and First Half Earnings Forecast
© Business Engineering Corporation.
3
Executive Summary of FY2026 1Q Financial Results
FY26 1Q
Business
Environment
Corporate earnings are maintaining high levels, with business sentiment also maintaining favorable levels.
The economy continues its gradual recovery. DX demand in manufacturing industries continues to be strong, with strategic
digital investments maintaining robust momentum.
FY26 1Q Financial Results
◆1Q Results
Net sales
・All overseas subsidiaries consolidated from this fiscal year
・License sales: Substantial growth to a record high, driving 1Q results
・Solutions Business: Sales declined slightly against the prior year's high base,
but orders expanded
・Net profit: Decreased due to the non-recurrence of the prior year's
gain on sales of strategic shareholdings
No revisions to first-half or full-year forecasts;
progressing steadily toward achieving the plan
Operating profit
Net profit
YoY + 12.3%
YoY +10.5%
YoY -7.1%
4 consecutive periods
of record highs
5 consecutive periods
of record highs
6,781
Achieved record highs in sales, operating profit, and orders received
(million yen)
1,910
1,274
*Impact of consolidation scope changes (million yen): Net sales +293, operating profit +50, net profit +33
◆1H Earnings Forecast (unchanged)
Net sales
Operating profit
Net profit
YoY +7.5%
YoY +2.4%
YoY -7.6%
13,200
3,450
2,300
Interim dividend
21.0 yen/share
YoY +5.4 yen
*Impact of consolidation scope changes (million yen): Net sales +600, operating profit +80, net profit +60
Solutions Business: ERP/core systems × Extended solutions
Products Business: Proprietary software packages centered on mcframe
•
•
•
Despite a transitional period between projects, sales remained at a high level on par with
License sales performed strongly, backed by market leadership and robust adoption
the previous year. Strengthened proposal activities expanded orders, with the order
demand. Projects built up in the previous period steadily came to fruition, driving
backlog at a high level heading into 2Q.
substantial license sales growth.
Project profitability remained strong, sustaining a high profit margin.
•
Substantial license sales growth delivered a high profit margin.
© Business Engineering Corporation.
4
Summary of Consolidated Income Statement
All overseas subsidiaries consolidated from this fiscal year. License sales growth drove both revenue and profit.
All indicators except net income hit record first-quarter highs despite the non-recurrence of the prior year's gain.
On track for the first-half plan.
FY26 1Q
(million yen)
FY25 1Q
Actual
Net sales
6,781
6,039
Gross profit
3,396
2,841
Gross profit margin
50.1%
47.0%
Operating profit
1,910
1,728
Operating profit margin
28.2%
28.6%
Ordinary profit
1,921
1,750
Ordinary profit margin
28.3%
29.0%
Net profit
1,274
1,371
Net profit margin
18.8%
22.7%
Orders received
7,214
6,164
FY26 1H
Change %
+12.3%
+19.5%
+10.5%
+9.7%
-7.1%
+17.0%
*From FY26 all five previously non-consolidated overseas subsidiaries are consolidated.
The impact of the consolidation scope change (million yen) is shown in the table to the right.
Forecast
FY25 1H
Progress
13,200
Actual
51.4%
6,400
53.1%
48.5%
3,450
55.4%
26.1%
3,450
55.7%
26.1%
2,300
55.4%
17.4%
13,500
53.4%
Change %
12,280
5,619
45.8%
+7.5%
+13.9%
3,370
+2.4%
27.4%
3,392
+1.7%
27.6%
2,489
-7.6%
20.3%
12,008
+12.4%
Net sales
FY26 1Q
+293
FY26 1H forecast
+600
Operating profit
FY26 1Q
+50
FY26 1H forecast
+80
Net profit
FY26 1Q
+33
FY26 1H forecast
+60
© Business Engineering Corporation.
5
Progress Against Full-Year Sales Forecast
The Products Business achieved substantial license sales growth in 1Q, with strong progress against the forecast.
The Solutions Business is progressing broadly in line with the plan. Off to a steady start toward achieving the full-year targets.
1Q
FY26
2Q
3Q
Net sales
4Q
¥26.8bn
25.3%
¥6.7bn
FY25
24.7%
25.5%
FY24
24.3%
24.3%
FY23
24.1%
26.2%
FY22
23.7%
24.2%
25.8%
24.9%
24.5%
26.3%
24.0%
¥24.4bn
26.6%
¥20.7bn
25.2%
¥19.4bn
25.8%
¥18.5bn
© Business Engineering Corporation.
6
Progress Against Full-Year Operating Profit Forecast
Substantial license sales growth in the Products Business drove profit expansion, resulting in strong 1Q progress.
Off to a steady start toward achieving the full-year targets.
1Q
FY26
2Q
3Q
4Q
Operating
Profit
27.7%
¥6.9bn
¥1.9bn
FY25
27.0%
FY24
25.0%
FY23
25.8%
FY22
26.0%
25.6%
26.7%
28.7%
23.7%
27.6%
26.6%
25.9%
28.2%
19.9%
¥6.4bn
21.7%
¥4.6bn
19.6%
¥3.8bn
22.1%
¥3.2bn
© Business Engineering Corporation.
7
Analysis of Changes in Operating Profit (YoY)
Substantial license sales growth in the Products Business drove profit growth.
Increases in SG&A expenses from strengthened sales activities and higher salary levels were absorbed by higher sales and
improved gross profit margin.
1Q comparison
(million yen)
+205
-372
+349
Sales growth
Substantial license sales
growth
1,728
FY25 1Q
Gross profit margin
improvement
47.0%⇒50.1%
Substantial license sales growth
Increase in SG&A expenses
Strengthened sales activities,
salary level increases
1,910
FY26 1Q
© Business Engineering Corporation.
8
Sales & Operating Profit by Segment
The Solutions Business sales declined slightly with lower profit against the prior year's high base.
The Products Business delivered high growth on substantial license sales expansion and the consolidation of overseas subsidiaries,
progressing well against forecast.
Net sales
(million yen)
FY26 1Q
Actual
FY25 1Q
Change %
Forecast
FY26 1H
Progress
Actual
FY25 1H
Change %
Solutions
3,935
3,991
-1.4%
7,900
49.8%
7,876
+0.3%
Products
2,739
1,953
+40.2%
5,100
53.7%
4,217
+20.9%
System Support
106
95
+11.8%
200
53.2%
187
+6.8%
Total
6,781
6,039
+12.3%
13,200
51.4%
12,280
+7.5%
mcframe license
2,040
1,421
+43.5%
3,400
60.0%
3,136
+8.4%
Operating profit
(million yen)
FY26 1Q
Actual
FY25 1Q
Change %
Forecast
FY26 1H
Progress
Actual
FY25 1H
Change %
Solutions
1,165
1,294
-10.0%
2,422
Products
1,159
757
+52.9%
1,661
System Support
131
138
-5.1%
245
Eliminations & corporate
(546)
(463)
1,910
1,728
+10.5%
55.4%
-959
Total
3,450
3,370
+2.4%
*From FY26, all five previously non-consolidated overseas subsidiaries are consolidated and included in the Products
Business. The impact of the consolidation scope change (million yen) is shown in the table to the right.
Net sales: Products, Total
Net sales: mcframe license
Operating profit: Products
Operating profit: Total
FY26 1Q
FY26 1Q
FY26 1Q
FY26 1Q
+293
+110
+50
+50
FY26 1H forecast
FY26 1H forecast
FY26 1H forecast
FY26 1H forecast
+600
+80
+80
© Business Engineering Corporation.
9
Segment Information: Solutions Business
<Net sales and Operating profit>
Net sales (million yen)
•
Operating profit (million yen)
32.4%
30.3%
28.2%
26.8%
3,991
3,170
3,170
28.4%
4,036
29.6%
•
Sales declined slightly year-on-year, reflecting the prior year's concentration of
projects and a transitional period between projects, but remained at a high
level on par with the previous year.
3,935
3,670
3,488
3,321
backlog remains at a high level heading into 2Q (¥4,973 million).
31.9%
3,885
25.1%
with client needs, backed by long-term relationships of trust with clients. Order
Operating profit margin
29.0%
Orders expanded through strengthened strategic proposal activities aligned
•
Despite strengthened activities for future growth and higher personnel costs,
high-quality project execution sustained a high profit margin.
<Net sales>
(million yen)
16,000
+18.5%
14,000
12,000
1,294
796
848
1,007
983
1,127
10,000
1,286
1,042
1,165
8,000
6,000
4,000
2,000
FY24
1Q
FY24
2Q
FY24
3Q
FY24
4Q
FY25
1Q
FY25
2Q
FY25
3Q
FY25
4Q
FY26
1Q
0
11,689
4Q
3,008
+9.2%
12,767
+3.0%
13,150
+1.3%
4Q
3,049
+14.4%
4Q
3,488
-2.6%
3Q
3,177
2Q
2,723
+28.1%
2Q
3,488
1Q
2,696
+13.2%
3Q
3,261
FY22
1Q
3,052
FY23
+4.5%
3Q
3,321
-9.1%
2Q
3,170
+3.8%
1Q
3,170
FY24
+5.2%
15,582
4Q
3,670
+21.5%
3Q
4,036
+22.6%
2Q
3,885
+25.9%
1Q
3,991
FY25
-1.4%
1Q
3,935
FY26
© Business Engineering Corporation.
10
Segment Information: Products Business
<Net sales and Operating profit>
Net sales (million yen)
42.2%
•
Operating profit (million yen)
41.4%
38.8%
39.9%
Operating profit margin
customer relationships, with large-scale projects also recorded. The
42.3%
consolidation of all overseas subsidiaries further contributed, driving
39.5%
substantial sales growth.
34.1%
34.0%
2,739
31.8%
1,734
1,729
•
Substantial license sales growth delivered a high profit margin.
•
Accelerating partner rollout of SaaS-based "mcframe X" and AI-driven product
development, strengthening the foundation for sustained growth.
2,263
2,149
2,042
1,953
1,926
License sales performed strongly under strategic partnerships and favorable
<Net sales>
1,693
(million yen)
+18.7%
8,000
1,159
903
729
757
718
576
7,000
6,000
848
5,000
695
613
4,000
3,000
2,000
1,000
FY24
1Q
FY24
2Q
FY24
3Q
FY24
4Q
FY25
1Q
FY25
2Q
FY25
3Q
FY25
4Q
FY26
1Q
*The impact of the consolidation scope change on FY26 1Q results: Net sales +¥293 million, operating profit +¥50 million.
0
6,393
-1.0%
6,326
4Q
1,634
+6.5%
4Q
1,739
3Q
1,536
2Q
1,656
1Q
1,566
FY22
-1.3%
3Q
1,516
-7.9%
2Q
1,525
-1.4%
1Q
1,544
FY23
+12.0%
7,083
+10.7%
4Q
1,926
+11.7%
3Q
1,693
+13.7%
2Q
1,734
+30.5%
+11.9%
1Q
1,729
+12.9%
FY24
+6.0%
+26.9%
8,408
4Q
2,042
3Q
2,149
2Q
2,263
1Q
1,953
FY25
+40.2%
1Q
2,739
FY26
© Business Engineering Corporation.
11
mcframe License Sales
Leveraging mcframe's competitive strength in supply chain management, growth was driven by accumulated license sales and
maintenance, with large-scale projects lifting results to consecutive record highs.
(Million yen)
+20.8%
6,184
6,000
+17.3%
5,120
+4.9%
5,000
+14.9%
4,364
+8.7%
+29.0%
4Q
1,249
3Q
887
+18.8%
+10.8%
3Q
982
2Q
960
+9.3%
2Q
1,050
+21.3%
+10.2%
1Q
1,082
+22.0%
4,000
3,798
3,000
4Q
968
2,000
1,000
0
1Q
982
FY22
FY23
4Q
1,358
3Q
1,167
2Q
1,273
1Q
1,320
FY24
+39.1%
+34.6%
+7.7%
4Q
1,424
3Q
1,624
2Q
1,714
1Q
1,421
FY25
+43.5%
1Q
2,040
FY26
*The impact of the consolidation scope change on FY26 1Q results is +¥110 million.
© Business Engineering Corporation.
12
Summary of Consolidated Balance Sheet
Balancing growth investment with capital efficiency. Intangible assets increased on investment to strengthen product
capabilities. While stepping up investment to accelerate new businesses, investments and other assets decreased from
the prior fiscal year-end due to reclassifications associated with the consolidation of overseas subsidiaries.
(million yen)
FY25 1Q
FY26 1Q
Actual
FY25
Change %
Actual
Change %
Current assets
18,901
15,582
+21.3%
17,219
+9.8%
Cash and deposits
13,083
9,933
+31.7%
12,141
+7.8%
Notes and accounts receivable, and contract assets
4,749
4,508
+5.3%
4,416
+7.6%
Non-current assets
4,292
3,801
+12.9%
4,306
-0.3%
Intangible assets
2,158
1,940
+11.2%
2,120
+1.8%
Investments and other assets
1,877
1,672
+12.3%
2,012
-6.7%
Total assets
23,193
19,384
+19.6%
21,526
+7.7%
Current liabilities
6,220
5,471
+13.7%
5,396
+15.3%
94
42
+124.0%
58
+62.0%
Net assets
16,878
13,870
+21.7%
16,071
+5.0%
Equity ratio
72.0%
71.6%
+0.4pt
74.7%
-2.7pt
Non-current liabilities
© Business Engineering Corporation.
13
Partially updated from the May 12, 2026 disclosure
- AI Strategy: AI Powering a Stronger B-EN-G
*For the full AI strategy, please refer to the Investors Guide.
https://www.b-en-g.co.jp/en/ir/materials/investorsguide.html
© Business Engineering Corporation.
14
Product Evolution (Adopting AI) | The mcframe Evolution Story
Updated: August 10, 2026
Building on 30 years of accumulated business expertise, ERP evolves through the data platform stage into the operational foundation for manufacturing
in the AI era.
Phase 1 | To date
Phase 2 | Going forward
~FY2025
Process ERP
FY2026~
Phase 3 | Future
Data platform
FY2028~
AI-driven manufacturing
ERP centered on business processes. 30 years of
proven track record as the foundation supporting
"record and control."
Evolving into a foundation that integrates
manufacturing data. Structuring operational data
into a form ready for AI utilization.
Through integration with AI agents, business
processes × AI = the operational foundation for an
automated manufacturing industry.
■ Cumulative track record across 1,131 companies and 17
countries
■ Industry-specific domain knowledge embedded in the
product
■ Extremely low churn rate and long-term lifecycle
■ Data integration across the entire supply chain
■ Data standardization as a business model
■ Available in both on-premise and SaaS forms
■ Operational automation via Master / Unit Agents
■ Irreplaceable value from business expertise × AI
■ An operational foundation that "takes on accountability"
Accelerating development speed, we plan to release the first version of "mcframe Alchemist," which creates new value from data in 4Q FY2026.
30 years of business expertise × AI:
mcframe is evolving into the digital platform for manufacturing in the AI era
© Business Engineering Corporation.
15
No change from the May 12, 2026 disclosure
- Earnings Forecast for FY2026
© Business Engineering Corporation.
16
Executive Summary of FY2026 Earnings Forecast
FY26
Business
Environment
While economic growth is expected to slow due to uncertain conditions including the Middle East situation,
manufacturers' strategic appetite for digital investment is expected to remain strong.
FY26 Consolidated Earnings Forecast
Advancing growth strategy through BE 2030
•
Consolidating all five previously non-consolidated overseas subsidiaries from FY26
Continued sales growth and expansion of consolidation scope expected
to drive topline increase
• Net profit forecast to decline due to the non-recurrence of one-time tax benefits
in previous year, while dividends will be maintained under the
Operating profit
Net profit
YoY +9.6%
YoY +7.6%
YoY -5.9%
26,800
• ROE expected to decline due to lower net profit and increased net assets
Continuing to expand growth investments, including product development
6,900
4,600
11 consecutive years
of record highs
ROE
Annual dividend
Dividend payout ratio
YoY -6.9pt
YoY +¥0.4
YoY +3.6pt
26.3%
progressive dividend policy
(million yen)
Net sales
5 consecutive years
of record highs
• Operating profit expected to increase, driven by sales growth
No change from the May 12, 2026 disclosure
¥42.0/share
54.5%
*Impact of consolidation scope changes on full-year forecast (million yen): Sales +1,200, operating profit +200, net profit +150
Solutions Business: ERP/core systems × Extended solutions
Products Business: Proprietary software packages centered on mcframe
• Strengthening strategic proposal activities tailored to client needs, expecting higher sales
year-on-year on the back of long-term relationships of trust with clients.
• Continuing to expand and strengthen sales partnerships, expecting continued license sales
growth and higher sales year-on-year through expansion of consolidation scope.
• Expanding solution development and delivery capabilities, advancing new business
• Driving market expansion through enhanced product value and a dual on-premise / SaaS
approach.
development.
© Business Engineering Corporation.
17
Earnings Forecast (1H/2H/FY)
No change from the May 12, 2026 disclosure
Looking toward FY30, aiming for record-high sales and operating profit. Consolidation scope expands from FY26.
(million yen)
FY26 1H
FY25 1H
Difference
FY26 2H
FY25 2H
Difference
FY26
FY25
Difference
Forecast
Actual
(Change %)
Forecast
Actual
(Change %)
Forecast
Actual
(Change %)
Net sales
13,200
12,280
Gross profit
6,400
5,619
Gross profit margin
48.5%
Operating profit
+919
13,600
12,161
+780
6,500
5,536
45.8%
(+13.9%)
47.8%
3,450
3,370
+79
Operating profit margin
26.1%
27.4%
Ordinary profit
3,450
Ordinary profit margin
+1,438
+2,357
26,800
24,442
+963
12,900
11,156
+1,743
45.5%
(+17.4%)
48.1%
45.6%
(+15.6%)
3,450
3,041
+408
6,900
6,411
+488
(+2.4%)
25.4%
25.0%
(+13.4%)
25.7%
26.2%
(+7.6%)
3,392
+57
3,450
3,042
+407
6,900
6,435
+464
26.1%
27.6%
(+1.7%)
25.4%
25.0%
(+13.4%)
25.7%
26.3%
(+7.2%)
Net profit
2,300
2,489
-189
2,300
2,401
-101
4,600
4,890
-290
Net profit margin
17.4%
20.3%
(-7.6%)
16.9%
19.7%
(-4.2%)
17.2%
20.0%
(-5.9%)
Orders received
13,500
12,008
13,500
12,576
27,000
24,585
Dividend (Non-consolidated)
¥21.0
¥15.6
+¥5.4
¥21.0
¥26.0
-¥5.0
¥42.0
¥41.6
+¥0.4
26.3%
33.2%
-6.9pt
+600
+120
+90
FY +1,200
FY
+200
FY
+150
ROE
(+7.5%)
+1,491
(+12.4%)
※ From FY26, all five previously non-consolidated overseas subsidiaries will be consolidated.
The impact on FY26 forecasts from this change in the scope of consolidation is shown to the right (million yen).
(+11.8%)
+923
(+7.3%)
Net sales
Operating profit
Net profit
1H
1H
1H
+600
+80
+60
2H
2H
2H
(+9.6%)
+2,414
(+9.8%)
© Business Engineering Corporation.
18
Segment & mcframe License Sales Forecasts (1H/2H/FY) No change from the May 12, 2026 disclosure
Solutions: Targeting year-on-year sales growth, supported by long-term client relationships and problem-solving expertise.
Products: Targeting year-on-year sales growth through license sales expansion and broader scope of consolidation.
(million yen)
FY26 1H
FY25 1H
Difference
FY26 2H
FY25 2H
Difference
FY26
FY25
Difference
Forecast
Actual
(Change %)
Forecast
Actual
(Change %)
Forecast
Actual
(Change %)
Solutions
7,900
7,876
Products
5,100
4,217
System Support
200
187
Total
13,200
12,280
mcframe license
3,400
3,136
+23
(+0.3%)
+882
(+20.9%)
+12
(+6.8%)
+919
(+7.5%)
+263
(+8.4%)
8,100
7,706
5,200
4,191
300
264
13,600
12,161
3,600
3,048
※ From FY26, all five previously non-consolidated overseas subsidiaries will be consolidated and included in the Products Business.
The impact on FY26 forecasts from this change is shown to the right (million yen).
+393
(+5.1%)
+1,008
(+24.1%)
16,000
15,582
10,300
8,408
500
451
26,800
24,442
+35
(+13.5%)
+1,438
(+11.8%)
+551
7,000
(+18.1%)
6,184
+417
(+2.7%)
+1,891
(+22.5%)
+48
(+10.7%)
+2,357
(+9.6%)
+815
(+13.2%)
Products
1H
+600
2H
+600
FY +1,200
mcframe license
1H
+80
2H
+120
FY
+200
© Business Engineering Corporation.
19
Solutions Business Forecast
No change from the May 12, 2026 disclosure
<Net sales>
Net sales (million yen)
FY26 Business Environment Outlook
YoY
+18.5%
15,582
+9.2%
+2.4%
12,767
+2.7%
•
enterprises and long-standing relationships of trust, we expect sales
16,000
+3.0%
Backed by an outstanding client base centered on major Japanese
to exceed the previous fiscal year.
•
We will also systematically strengthen initiatives for future growth,
targeting stable sales growth aligned with our resource capacity.
13,150
11,689
FY26 Initiatives
•
Strengthen strategic proposal activities closely aligned with client
needs.
•
Address clients' evolving challenges on an ongoing basis through ERP
combined with high-value-added extended solutions, securing the
foundation for both sales growth and profitability.
•
To support sustainable growth, expanding global solution
development and delivery capabilities, and advancing new business
development.
FY22
FY23
FY24
FY25
FY26
(Forecast)
© Business Engineering Corporation.
20
Products Business Forecast
No change from the May 12, 2026 disclosure
< Net sales >
Net sales (million yen)
FY26 Business Environment Outlook
YoY
+22.5%
•
management field and a strong partner sales network and sales
10,300
capabilities, we expect revenue growth driven by sustained
expansion of license sales.
+18.7%
•
8,408
-1.0%
6,393
6,326
From FY26, all overseas subsidiaries will be consolidated, and the
addition of implementation support sales is expected to deliver
+12.0%
+6.5%
Leveraging mcframe’s competitive advantage in the supply chain
strong sales growth compared to the previous fiscal year.
7,083
FY26 Initiatives
•
Expand and strengthen sales partners through our partnership
strategy, broadening the sales network and reinforcing sales
capabilities.
•
Expand overseas markets through closer collaboration with overseas
offices and partners.
•
Enhance product value through deeper integration with AI
technologies and advance a dual-track market expansion strategy
FY22
FY23
FY24
FY25
FY26
(Forecast)
across both on-premise and SaaS offerings.
※ From FY26, all five previously non-consolidated overseas subsidiaries will be consolidated and included in the Products Business. The impact on the FY26 forecast from this scope change is +¥1,200 million.
© Business Engineering Corporation.
21
Net Sales and YoY Growth
No change from the May 12, 2026 disclosure
In FY25 significant progress toward our FY30 target of ¥33.0 billion. From FY26, scope of consolidation expands.
Building a sustainable growth foundation while targeting continued sales growth and a fifth consecutive record-high year.
Net sales (million yen)
YoY
+9.6%
+17.6%
+13.2%
+5.9%
+1.4%
13,289
13,479
FY16
FY17
+16.2%
-0.1%
+0.3%
17,728
17,707
17,760
FY19
FY20
FY21
+4.2%
18,506
+5.3%
19,493
+6.6%
26,800
24,442
20,776
15,253
FY18
FY22
FY23
FY24
FY25
FY26
(Forecast)
※ From FY26, all five previously non-consolidated overseas subsidiaries will be consolidated. The impact on the FY26 forecast from this scope change is +¥1,200 million.
© Business Engineering Corporation.
22
Operating Profit & Operating Profit Margin
No change from the May 12, 2026 disclosure
In FY25 significant progress toward our FY30 target of ¥10.0 billion, driven by sales growth and margin expansion.
In FY26, continued sales growth and continued profit growth are expected to deliver an eleventh consecutive record-high year.
Operating profit (million yen)
Operating profit margin
26.2%
22.5%
6,411
19.9%
25.7%
6,900
17.5%
4,676
13.6%
3,885
10.7%
7.9%
5.4%
2,412
5.6%
715
757
FY16
FY17
3,246
8.9%
1,208
FY18
1,573
FY19
1,902
FY20
FY21
FY22
FY23
FY24
FY25
FY26
(Forecast)
※ From FY26, all five previously non-consolidated overseas subsidiaries will be consolidated. The impact on the FY26 forecast from this scope change is +¥200 million.
© Business Engineering Corporation.
23
mcframe License Sales & YoY Growth
No change from the May 12, 2026 disclosure
In FY25, a growth engine to achieve our FY30 targets, delivered market share gains and continued high growth.
Building on license sales and license maintenance, FY26 also targets a continued record-high streak.
mcframe license sales (million yen)
+13.2%
YoY
+20.8%
+17.3%
+14.9%
+28.4%
+9.2%
1,866
FY16
+21.2%
+4.4%
2,262
2,362
FY17
FY18
+12.3%
+3.7%
2,651
2,749
FY19
FY20
3,530
FY21
+7.6%
7,000
6,184
5,120
4,364
3,798
FY22
FY23
FY24
FY25
FY26
(Forecast)
※ From FY26, all five previously non-consolidated overseas subsidiaries will be consolidated. The impact on the FY26 forecast from this scope change is +¥200 million.
© Business Engineering Corporation.
24
Sales by Segment
No change from the May 12, 2026 disclosure
Solutions: Targeting stable growth in FY26, backed by long-term customer relationships
Products: targeting growth above FY25, driven by license sales expansion and broader scope of consolidation
Solutions
Products
System Support
(million yen)
500
451
25,000
20,000
443
15,000
10,000
5,000
0
305
264
4,321
4,788
8,663
8,427
FY16
FY17
334
5,323
407
5,071
341
6,004
423
6,393
398
6,326
542
8,408
10,300
7,083
4,953
9,965
FY18
11,961
12,228
11,413
11,689
FY19
FY20
FY21
FY22
12,767
13,150
FY23
FY24
15,582
16,000
FY25
FY26
(Forecast)
※ From FY26, all five previously non-consolidated overseas subsidiaries will be consolidated and included in the Products Business. The impact on the FY26 forecast from this scope change is +¥1,200 million.
© Business Engineering Corporation.
25
Dividends (Annual dividend per share)
No change from the May 12, 2026 disclosure
Payout ratio raised to over 50% from FY25; combined with higher net profit, FY25 delivered a significant dividend increase.
FY26 dividend maintained under progressive dividend policy.
Annual dividend per share (yen)
30.1%
30.9%
30.2%
31.0%
Dividend payout ratio
32.1%
30.6%
33.0%
35.6%
36.0%
50.9%
54.5%
41.6
42.0
FY25
FY26
(Forecast)
20.0
12.8
2.2
2.5
4.3
4.5
FY16
FY17
FY18
FY19
7.0
FY20
15.6
8.4
FY21
FY22
FY23
FY24
※ Pre-FY25 figures are dividend amounts adjusted for the stock splits effective June 1, 2022 and January 1, 2026.
© Business Engineering Corporation.
26
- Data Book
© Business Engineering Corporation.
27
Quarterly Income Statement (3-month)
(million yen)
Item
FY2024
FY2025
FY2026
1Q
2Q
3Q
4Q
1Q
2Q
3Q
4Q
1Q
Net sales
5,042
5,049
5,165
5,519
6,039
6,241
6,299
5,862
6,781
Cost of sales
2,821
2,736
2,859
3,268
3,197
3,462
3,389
3,236
3,385
Gross profit
2,221
2,313
2,305
2,250
2,841
2,778
2,909
2,626
3,396
Selling, general and administrative expenses
1,053
1,063
1,060
1,236
1,113
1,136
1,142
1,351
1,486
Operating profit
1,167
1,249
1,245
1,014
1,728
1,642
1,766
1,274
1,910
Operating profit margin
23.2%
24.7%
24.1%
18.4%
28.6%
26.3%
28.0%
21.7%
28.2%
Non-operating income
20
4
0
2
26
5
1
5
17
Non-operating expense
4
5
2
10
3
6
2
3
6
1,183
1,247
1,243
1,006
1,750
1,641
1,766
1,276
1,921
Extraordinary gains
239
Extraordinary losses
1,183
1,247
1,243
1,006
1,989
1,641
1,766
1,276
1,921
Income taxes - current
380
392
404
353
620
523
556
39
626
Income taxes - deferred
(0)
0
(0)
(180)
(2)
0
0
45
11
Total income taxes
380
392
403
172
618
523
556
85
637
8
803
854
839
833
1,371
1,118
1,209
1,191
1,274
EBITDA
1,365
1,448
1,467
1,220
1,948
1,851
2,009
1,535
2,167
EBITDA margin
27.1%
28.7%
28.4%
22.1%
32.3%
29.7%
31.9%
26.2%
32.0%
Ordinary profit
Profit before income taxes
Profit attributable to non-controlling interests
Profit attributable to owners of parent
2Q
3Q
4Q
© Business Engineering Corporation.
28
Quarterly Income Statement (Cumulative)
(million yen)
Item
FY2024
FY2025
FY2026
1Q
2Q
3Q
4Q
1Q
2Q
3Q
4Q
1Q
Net sales
5,042
10,092
15,257
20,776
6,039
12,280
18,579
24,442
6,781
Cost of sales
2,821
5,557
8,417
11,685
3,197
6,660
10,050
13,286
3,385
Gross profit
2,221
4,534
6,840
9,091
2,841
5,619
8,529
11,156
3,396
Selling, general and administrative expenses
1,053
2,117
3,178
4,415
1,113
2,249
3,392
4,744
1,486
Operating profit
1,167
2,417
3,662
4,676
1,728
3,370
5,137
6,411
1,910
Operating profit margin
23.2%
23.9%
24.0%
22.5%
28.6%
27.4%
27.6%
26.2%
28.2%
Non-operating income
20
24
24
26
26
32
34
39
17
Non-operating expense
4
10
12
23
3
10
12
15
6
1,183
2,430
3,673
4,679
1,750
3,392
5,158
6,435
1,921
Extraordinary gains
239
239
239
239
Extraordinary losses
1,183
2,430
3,673
4,679
1,989
3,631
5,397
6,674
1,921
Income taxes - current
380
772
1,177
1,530
620
1,144
1,700
1,740
626
Income taxes - deferred
(0)
0
(0)
(181)
(2)
(2)
(2)
43
11
Total income taxes
380
772
1,176
1,349
618
1,142
1,698
1,783
637
8
803
1,658
2,497
3,330
1,371
2,489
3,699
4,890
1,274
EBITDA
1,365
2,814
4,281
5,502
1,948
3,800
5,809
7,344
2,167
EBITDA margin
27.1%
27.9%
28.1%
26.5%
32.3%
30.9%
31.3%
30.0%
32.0%
Ordinary profit
Profit before income taxes
Profit attributable to non-controlling interests
Profit attributable to owners of parent
2Q
3Q
4Q
© Business Engineering Corporation.
29
Quarterly Segment Performance (3-month)
(million yen)
Segment
Solutions Business
Products Business
System Support Business
Item
FY2024
FY2025
FY2026
1Q
2Q
3Q
4Q
1Q
2Q
3Q
4Q
1Q
2Q
Net sales
3,170
3,170
3,321
3,488
3,991
3,885
4,036
3,670
3,935
Operating profit
796
848
1,007
983
1,294
1,127
1,286
1,042
1,165
Operating profit margin
25.1%
26.8%
30.3%
28.2%
32.4%
29.0%
31.9%
28.4%
29.6%
Orders received
2,775
3,677
3,530
3,639
4,212
3,628
3,583
3,912
4,494
Order backlog
3,783
4,291
4,500
4,651
4,882
4,626
4,173
4,416
4,973
Net sales
1,729
1,734
1,693
1,926
1,953
2,263
2,149
2,042
2,739
Operating profit
729
718
576
613
757
903
848
695
1,159
Operating profit margin
42.2%
41.4%
34.0%
31.8%
38.8%
39.9%
39.5%
34.1%
42.3%
Orders received
1,753
1,690
1,615
2,491
1,904
2,109
2,113
2,637
2,643
Order backlog
2,177
2,133
2,055
2,620
2,562
2,408
2,372
2,967
3,056
Net sales
142
145
150
103
95
92
113
150
106
Operating profit
129
123
133
113
138
106
118
145
131
Operating profit margin
90.3%
85.3%
88.6%
109.5%
145.7%
115.9%
104.0%
96.3%
123.6%
Orders received
145
99
105
164
46
105
131
197
77
Order backlog
138
92
48
108
60
73
91
139
110
3Q
4Q
© Business Engineering Corporation.
30
Quarterly Segment Performance (Cumulative)
(million yen)
Segment
Solutions Business
Products Business
System Support Business
Item
FY2024
FY2025
FY2026
1Q
2Q
3Q
4Q
1Q
2Q
3Q
4Q
1Q
2Q
Net sales
3,170
6,340
9,661
13,150
3,991
7,876
11,912
15,582
3,935
Operating profit
796
1,645
2,652
3,635
1,294
2,422
3,709
4,751
1,165
Operating profit margin
25.1%
25.9%
27.5%
27.6%
32.4%
30.8%
31.1%
30.5%
29.6%
Orders received
2,775
6,453
9,984
13,623
4,212
7,841
11,425
15,337
4,494
Order backlog
3,783
4,291
4,500
4,651
4,882
4,626
4,173
4,416
4,973
Net sales
1,729
3,463
5,157
7,083
1,953
4,217
6,366
8,408
2,739
Operating profit
729
1,447
2,023
2,636
757
1,661
2,509
3,205
1,159
Operating profit margin
42.2%
41.8%
39.2%
37.2%
38.8%
39.4%
39.4%
38.1%
42.3%
Orders received
1,753
3,443
5,059
7,550
1,904
4,014
6,127
8,765
2,643
Order backlog
2,177
2,133
2,055
2,620
2,562
2,408
2,372
2,967
3,056
Net sales
142
287
438
542
95
187
301
451
106
Operating profit
129
252
386
499
138
245
363
508
131
Operating profit margin
90.3%
87.8%
88.1%
92.2%
145.7%
131.0%
120.8%
112.7%
123.6%
Orders received
145
244
350
515
46
152
283
481
77
Order backlog
138
92
48
108
60
73
91
139
110
3Q
4Q
© Business Engineering Corporation.
31
Quarterly Balance Sheet
(million yen)
FY2024
FY2025
FY2026
1Q
2Q
3Q
4Q
1Q
2Q
3Q
4Q
1Q
Current assets
12,581
13,214
12,815
14,336
15,582
16,913
16,427
17,219
18,901
Cash and deposits
8,354
8,758
8,154
9,347
9,933
11,234
10,775
12,141
13,083
Notes and accounts receivable,
and contract assets
3,388
3,777
3,999
4,277
4,508
4,934
4,848
4,416
4,749
Non-current assets
3,245
3,344
3,747
4,115
3,801
3,890
3,958
4,306
4,292
Intangible assets
1,687
1,764
1,808
1,859
1,940
2,035
2,077
2,120
2,158
Investments and other assets
1,387
1,419
1,780
2,060
1,672
1,674
1,698
2,012
1,877
Total assets
15,827
16,558
16,563
18,451
19,384
20,803
20,385
21,526
23,193
Current liabilities
4,564
4,468
4,048
5,030
5,471
5,759
5,406
5,396
6,220
20
25
31
36
42
47
52
58
94
11,242
12,064
12,484
13,384
13,870
14,997
14,926
16,071
16,878
169
71.0%
72.9%
75.4%
72.5%
71.6%
72.1%
73.2%
74.7%
72.0%
Non-current liabilities
Net assets
Non-controlling interests
Equity ratio
2Q
3Q
4Q
© Business Engineering Corporation.
32
Cash Flows
(million yen)
FY2023
FY2024
FY2025
Item
1H
2H
Full Year
1H
2H
Cash flows from operating activities
1,874
1,679
Cash flows from investing activities
(616)
Cash flows from financing activities
Full Year
1H
2H
3,553
1,672
1,850
(511)
(1,127)
(621)
(695)
(307)
(1,003)
Effect of exchange rate changes on cash and cash equivalents
(10)
2
Net increase (decrease) in cash and cash equivalents
552
Cash and cash equivalents at beginning of period
Cash and cash equivalents at end of period
Full Year
3,522
2,841
3,065
5,906
(854)
(1,476)
(171)
(944)
(1,116)
(655)
(409)
(1,065)
(798)
(1,199)
(1,997)
(7)
(19)
2
(16)
16
(14)
1
862
1,414
376
588
965
1,887
906
2,794
6,966
7,519
6,966
8,381
8,758
8,381
9,347
11,234
9,347
7,519
8,381
8,381
8,758
9,347
9,347
11,234
12,141
12,141
© Business Engineering Corporation.
33
- Guide to IR Reference Materials
© Business Engineering Corporation.
34
Investors Guide
We disclose an investor-oriented document on our IR website that summarizes basic information, including business overview,
business model, AI strategy and growth strategy. Please note that certain sections of this document were updated on August 10, 2026.
IR Content
- What Is B-EN-G?
- Segment Information: Competitive Advantages and Market Positioning
- Global Expansion: Consolidating Overseas Subsidiaries to Drive the Next Growth Phase
- AI Strategy: AI Powering a Stronger B-EN-G
- Growth Strategy BE 2030
- Capital Allocation
- Data Book
- Appendix
Japanese https://www.b-en-g.co.jp/jp/ir/materials/investorsguide.html
English
https://www.b-en-g.co.jp/en/ir/materials/investorsguide.html
Japanese
English
© Business Engineering Corporation.
35
Integrated Report 2025
The Integrated Report 2025, published on September 26, 2025, outlines our approach to sustainable corporate value creation and is
intended to foster dialogue with our stakeholders. For non-financial information such as human capital, sustainability, and governance,
please refer to the report. FY2025 ESG Data Book released ahead of the 2026 Integrated Report.
Contents
• Brand Statement & Philosophy / Value Creation History / Facts / Top Management Message
• Value Creation Story
・Value Creation Process / Business Model and Competitive Advantages (Strengths) / Capital Supporting Value Creation /
Social Issues B-EN-G Addresses
• Growth Strategy
・Growth Strategy “BE 2030” / Management Plan “Management Vision 2026” / CFO Message / Business Strategies / Global
Strategy / Human Capital Strategy / Human Rights, Environment / Sustainability Promotion Framework and Materiality
• Governance
・Corporate Governance / Board of Directors / Compliance / Risk Management / Outside Director Message
• Corporate Data
・Financial Data / Non-Financial Data / Stock Information / Company Information
Japanese https://www.b-en-g.co.jp/jp/ir/materials/integrated_report.html
English
https://www.b-en-g.co.jp/en/ir/materials/integrated_report.html
Japanese
English
© Business Engineering Corporation.
36
<Notes on this presentation material>
• Fiscal years are principally displayed as "Fiscal Year 20yy" or "FYyy," representing one year from April 1, 20yy.
• All monetary amounts are displayed with figures less than one million yen truncated.
• Profit attributable to owners of parent (quarterly profit) is displayed as Net profit.
• Results for FY19 and earlier use figures prior to the retroactive application of the revenue recognition accounting standard.
<Caution>
• Forward-looking statements concerning business performance forecasts, etc. contained in this material are based on information currently available to
the company and certain assumptions deemed reasonable by the Company. Actual business performance may differ significantly from these forecasts
due to various factors.
• This document has been translated from the Japanese original for reference purposes only. In the event of any discrepancy between this translated
document and the Japanese original, the original shall prevail.
Business Engineering Corporation Abbreviation: B-EN-G
Securities Code: 4828 TSE Prime
IR information
Japanese https://www.b-en-g.co.jp/jp/ir/
English
https://www.b-en-g.co.jp/en/ir/
IR contact : [email protected]
Japanese
English
© Business Engineering Corporation.
37
© Business Engineering Corporation.






























 Event Information
 Useful Resources
 Column
 Contact us






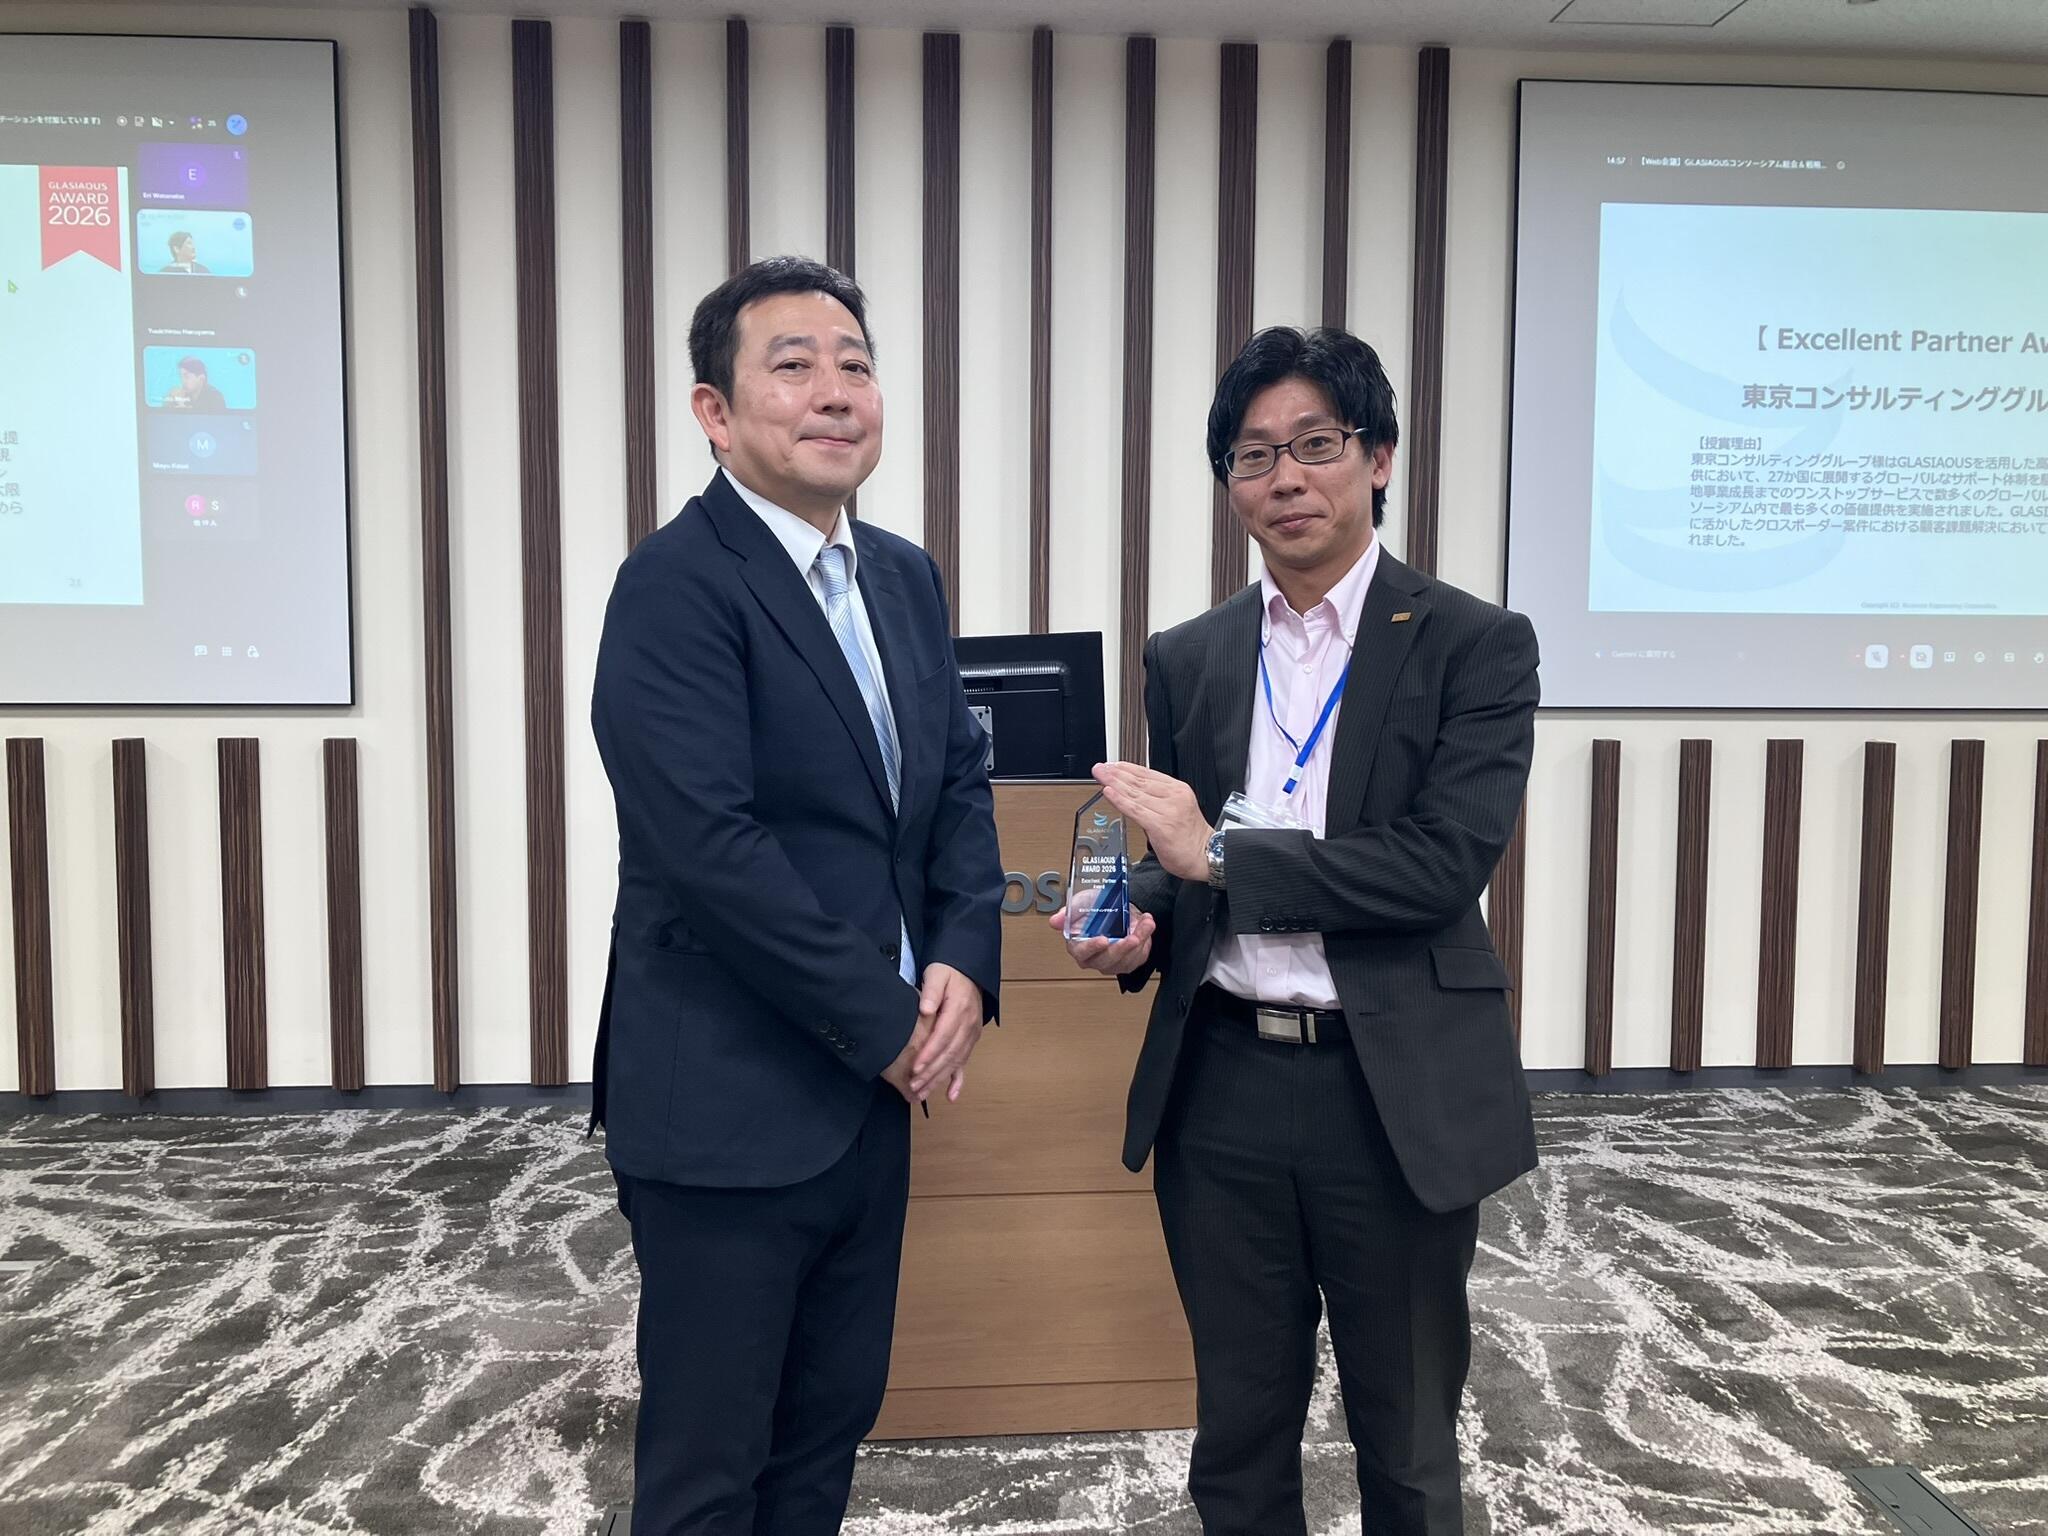 東京コンサルティンググループ様
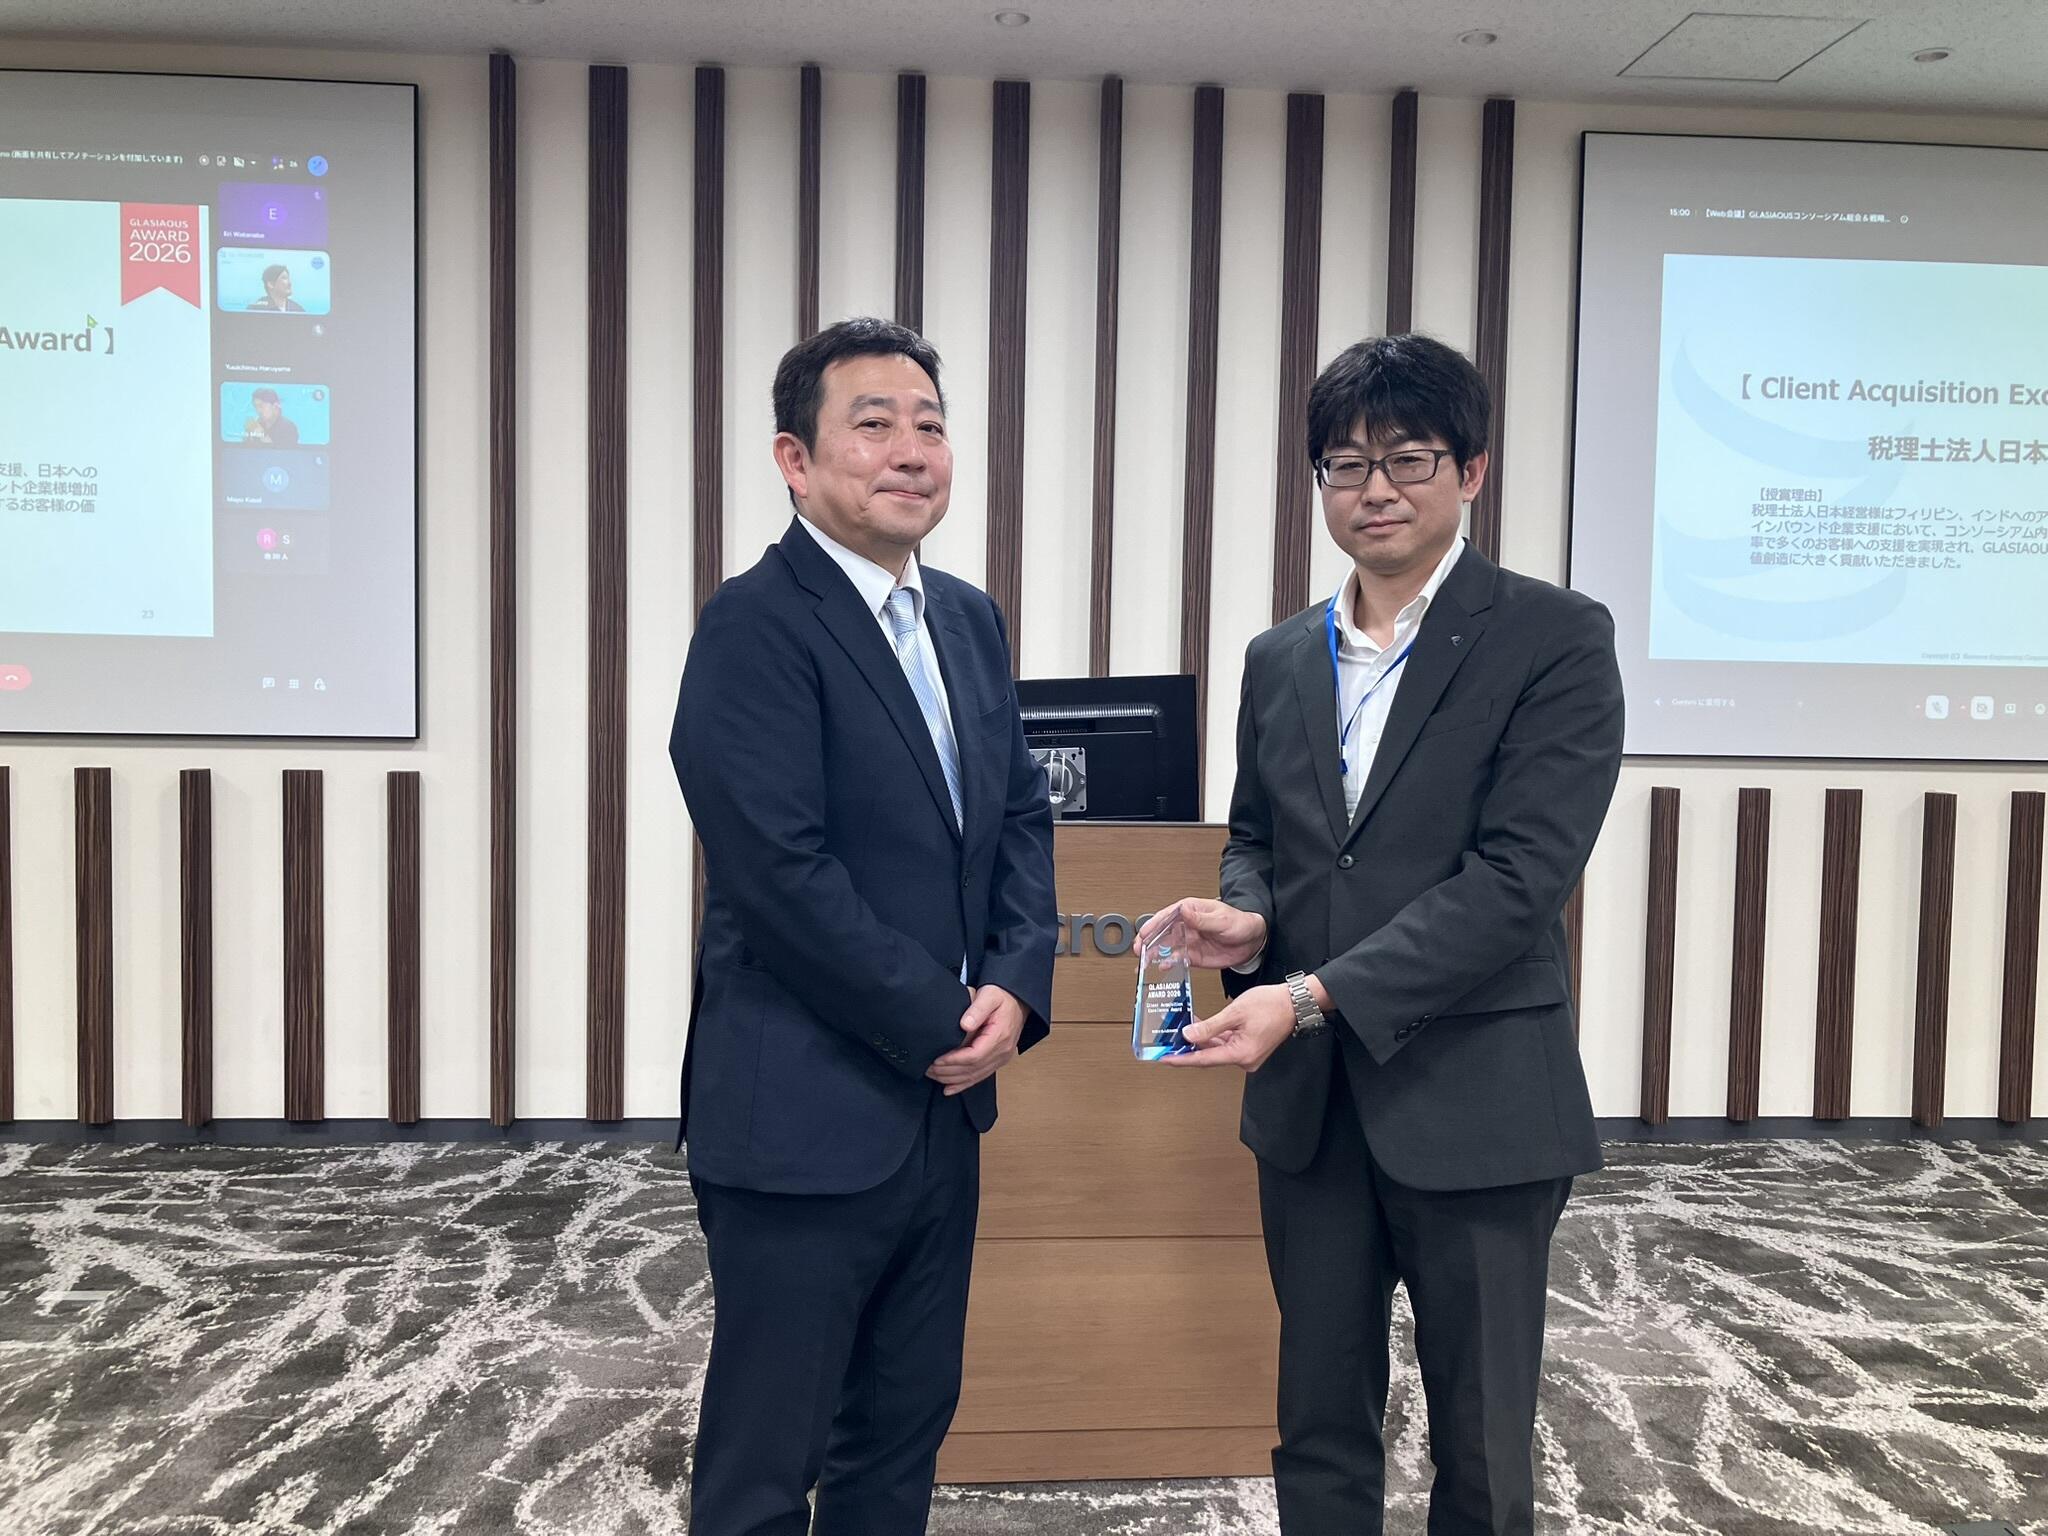 税理士法人日本経営様
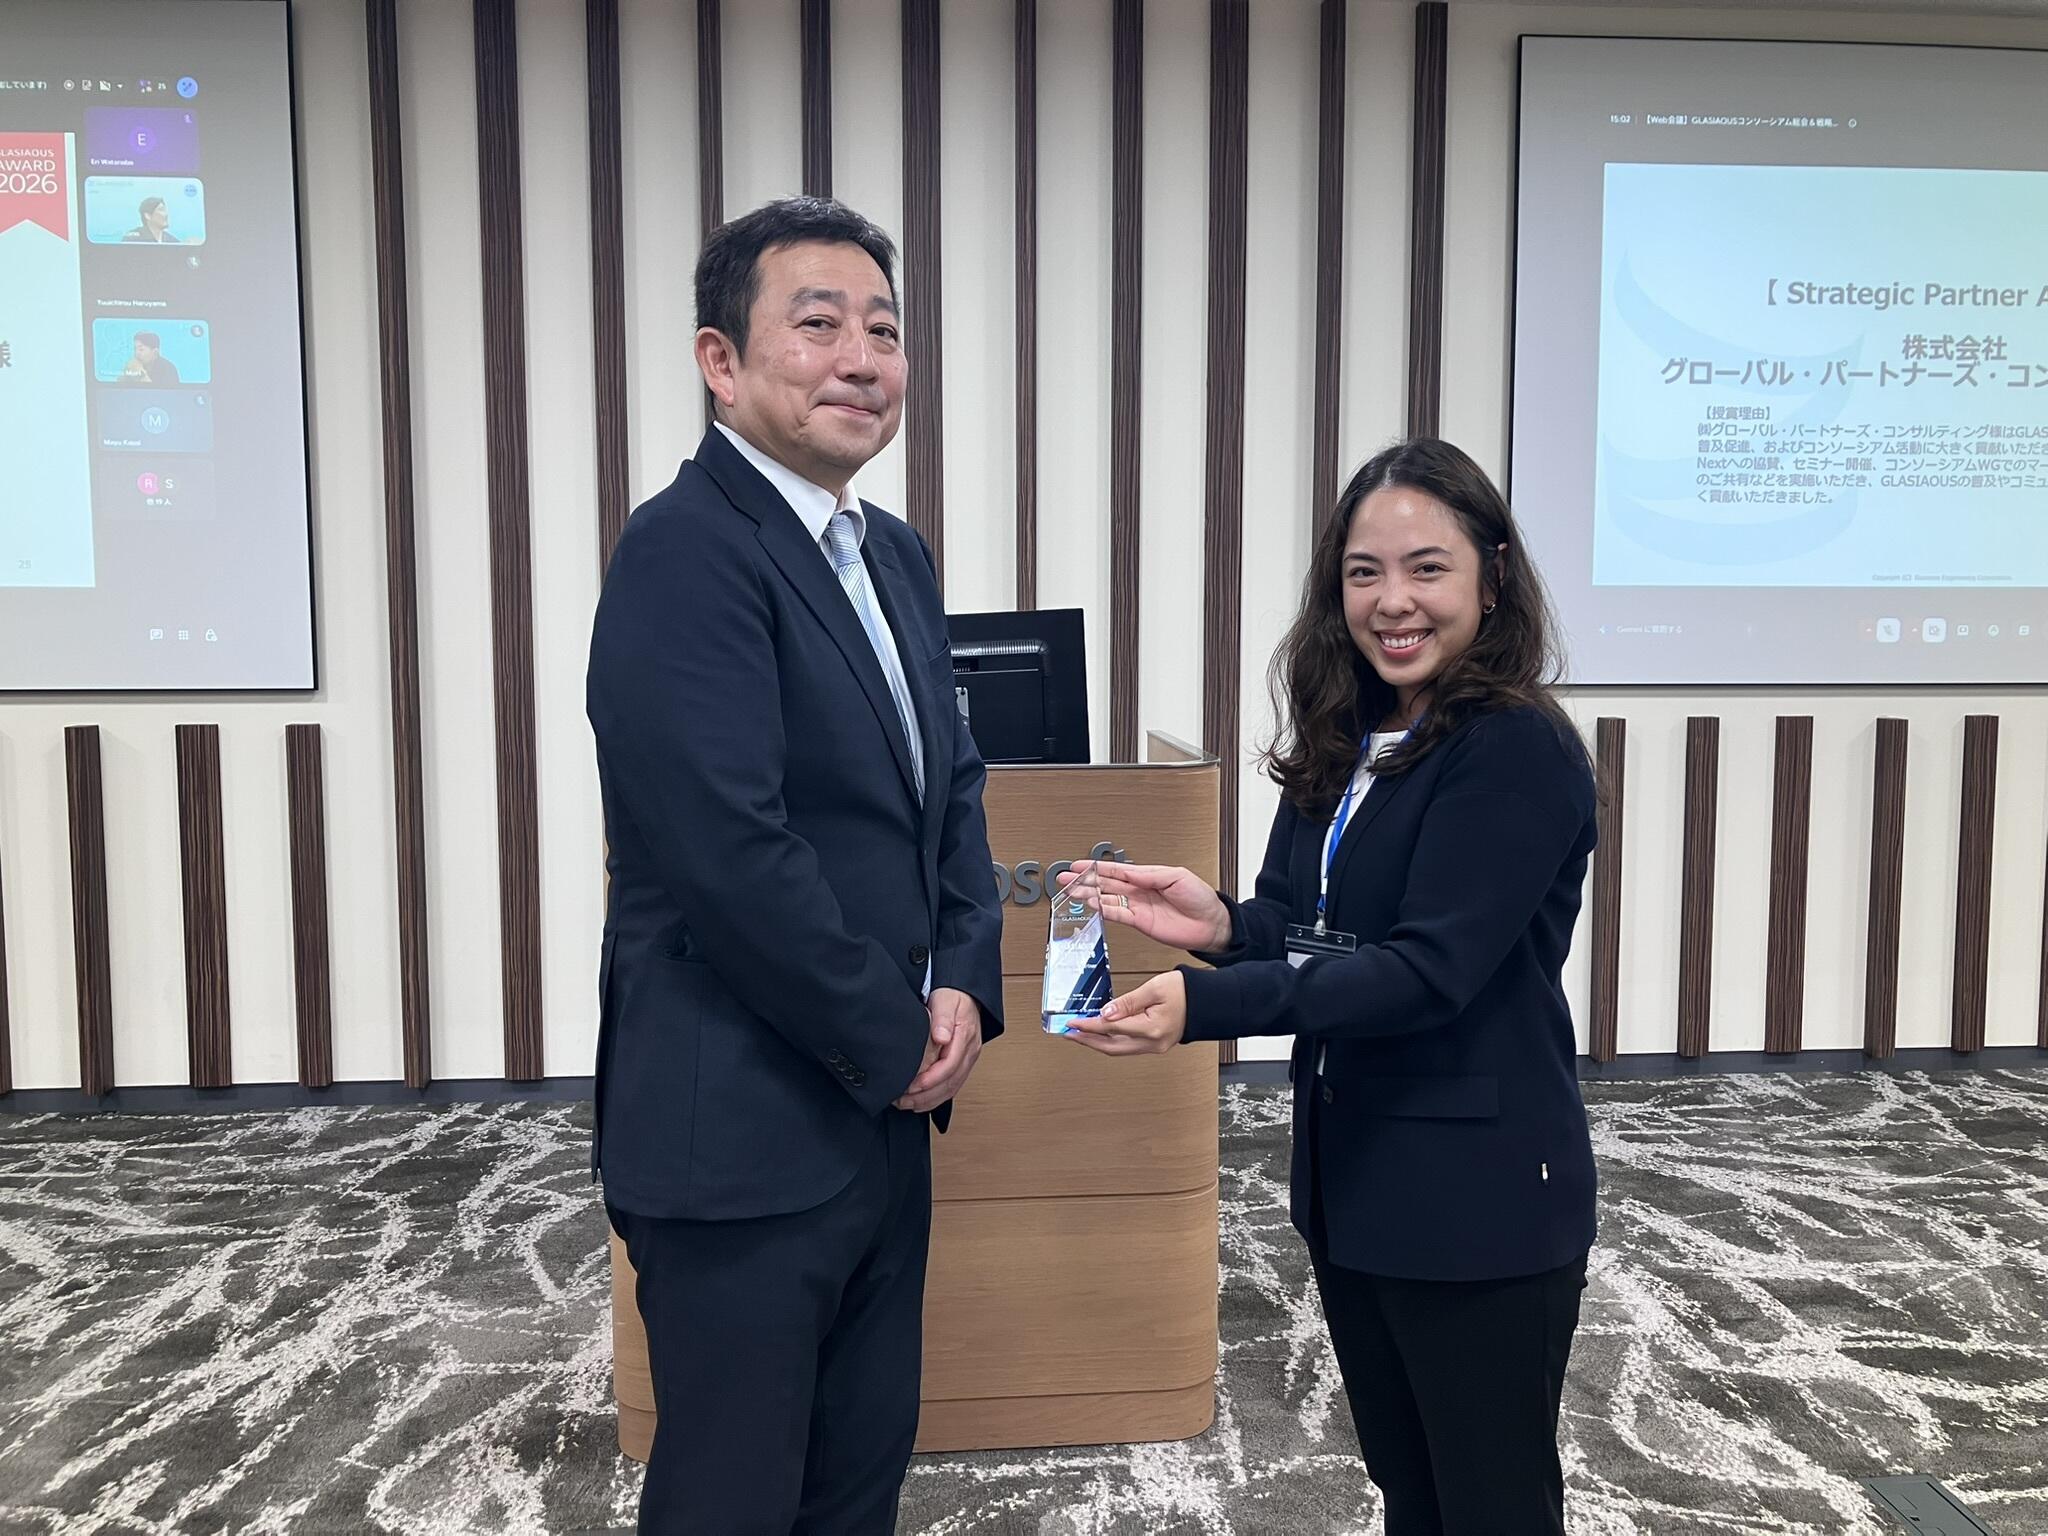 株式会社グローバル・パートナーズ・コンサルティング様
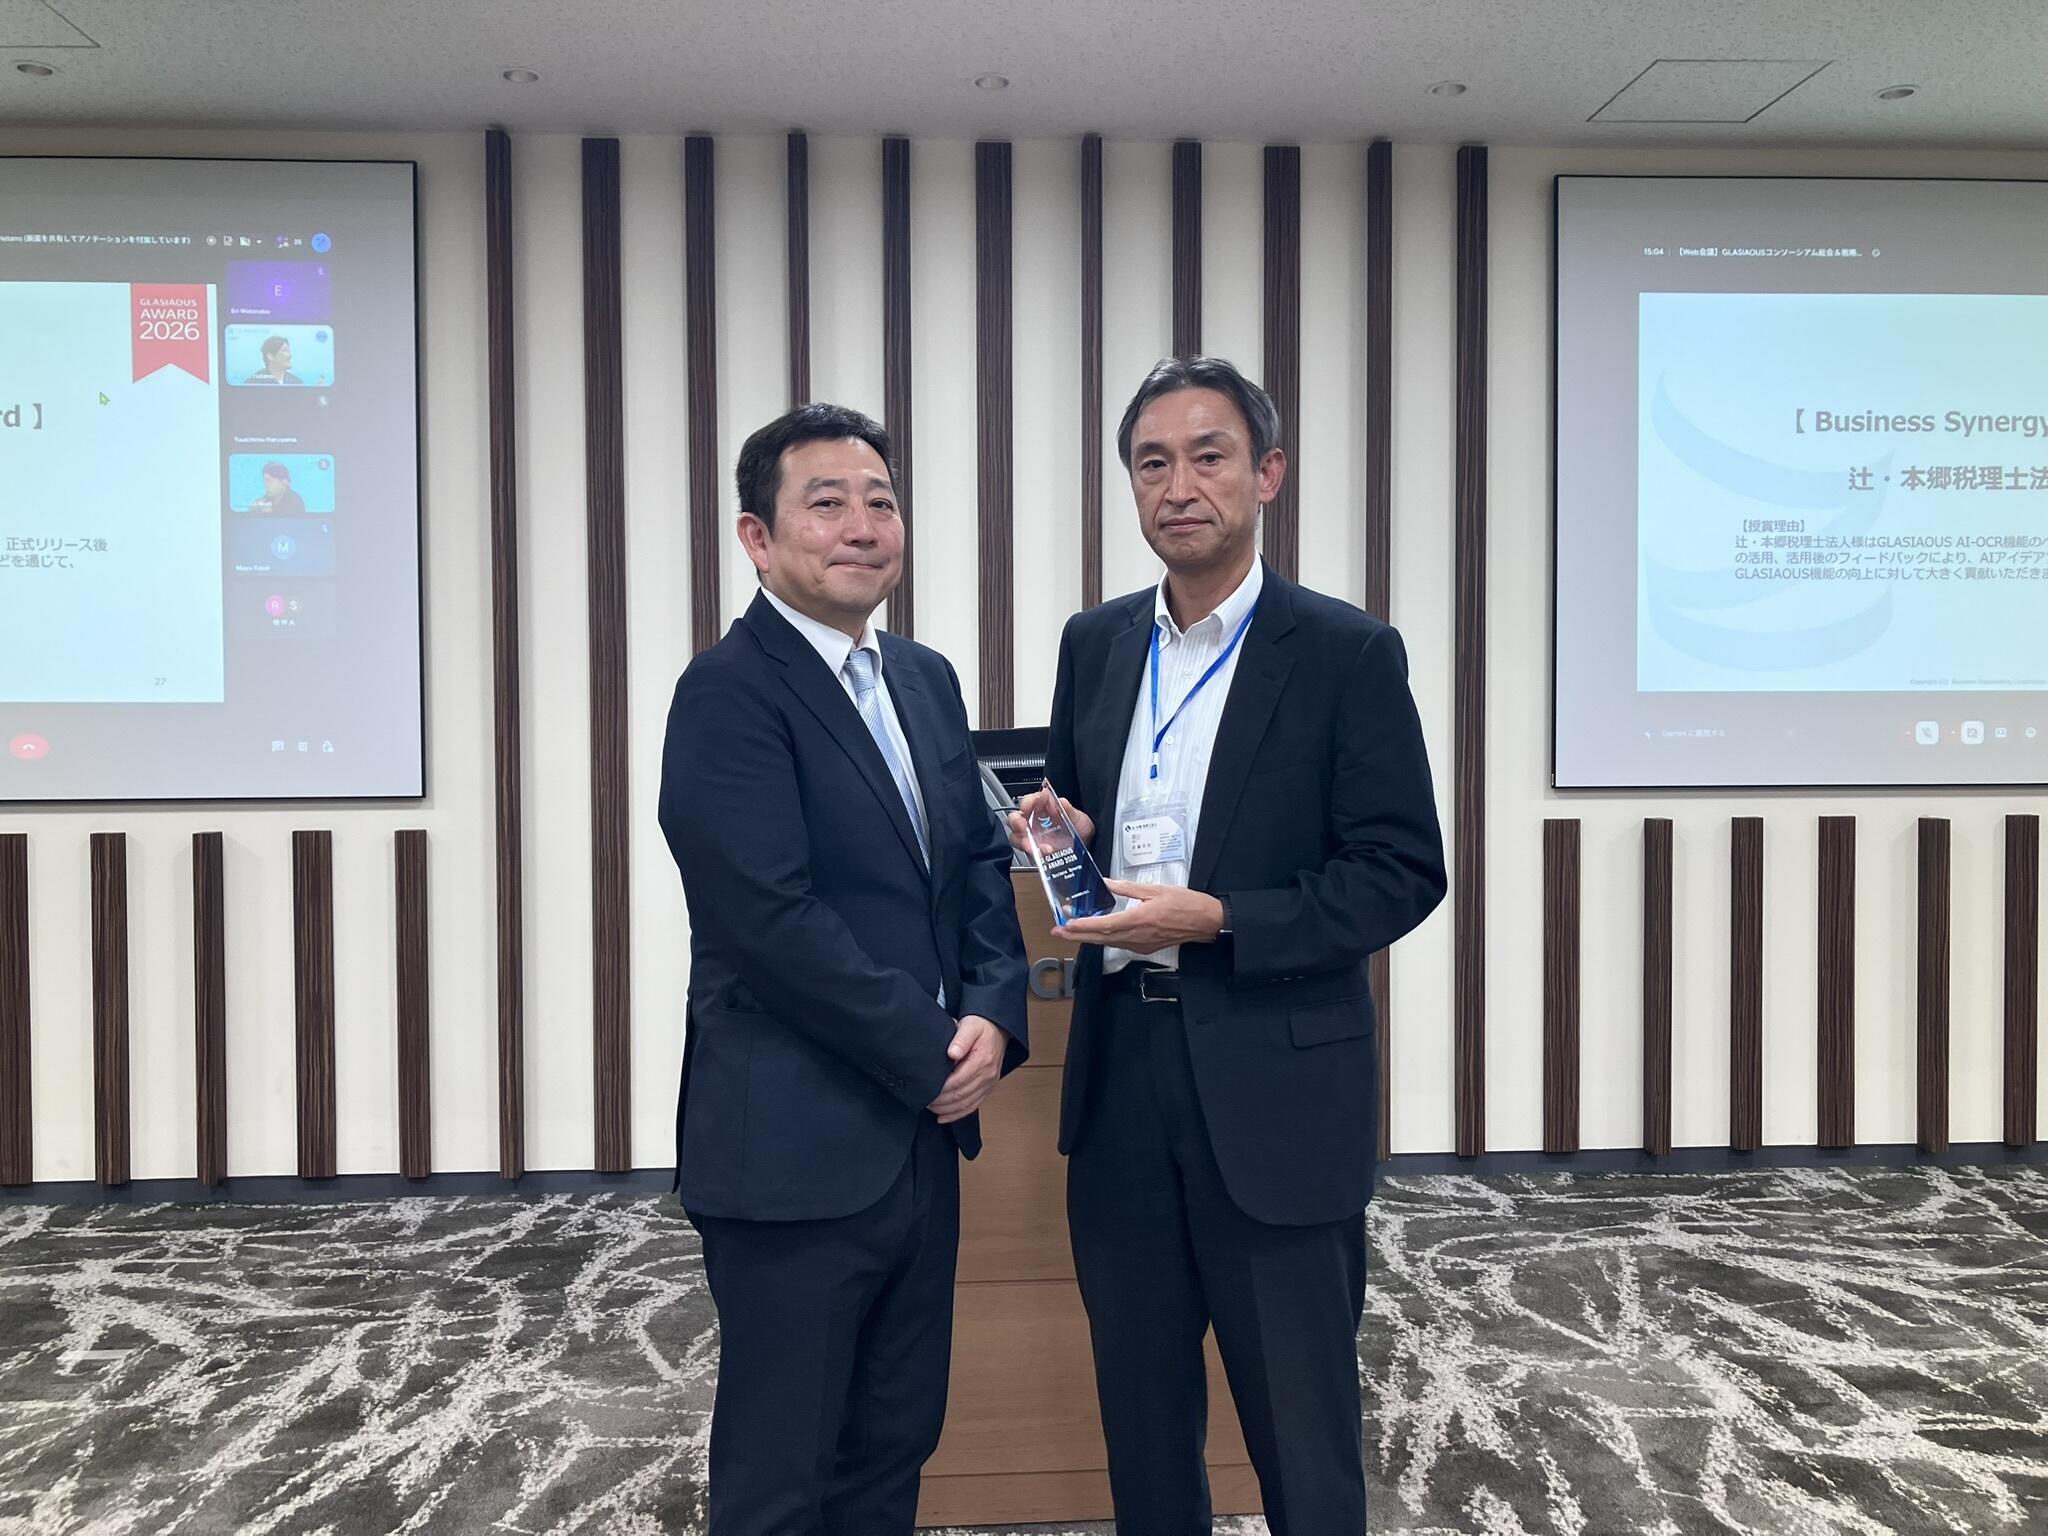 辻・本郷税理士法人様
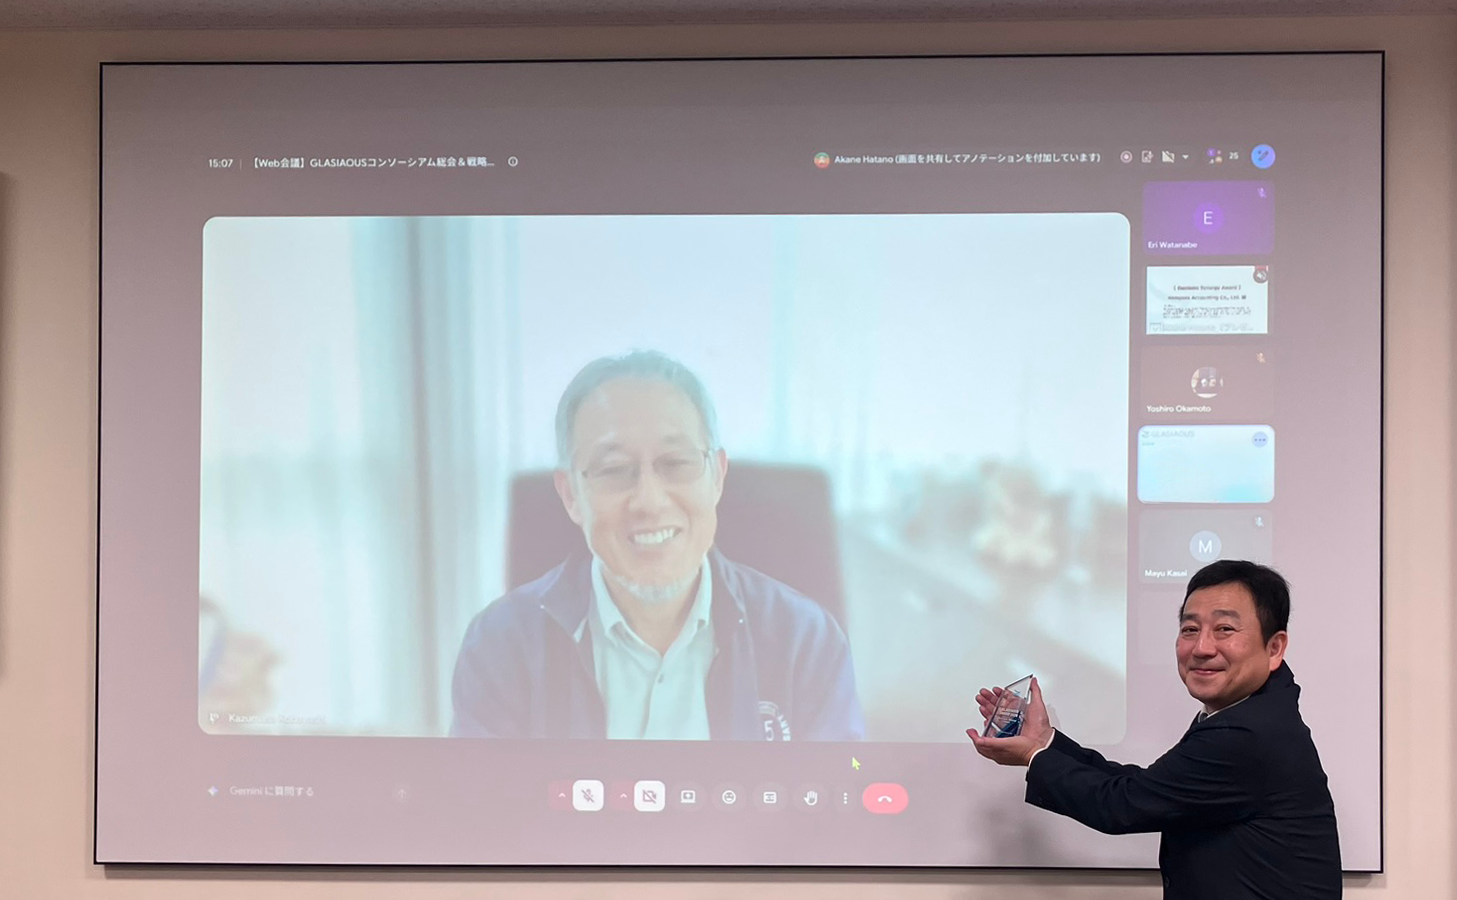 Kompass Accounting Co., Ltd.様