Financial Report 1Q of FY27.3 2026.8.13 I. Introduction Copyright © 2026 Digital Garage, Inc. All Rights Reserved 2 Designing ‘New Context’ for a sustainable society with technology Business Model / 3 Core Technologies IT INFORMATION TECHNOLOGY MT FT…
Financial Report
1Q of FY27.3
2026.8.13
I. Introduction
Copyright © 2026 Digital Garage, Inc. All Rights Reserved
2
Designing ‘New Context’ for a sustainable society
with technology
Business Model / 3 Core Technologies
IT
INFORMATION
TECHNOLOGY
MT
FT
MARKETING
TECHNOLOGY
FINANCIAL
TECHNOLOGY
By connecting 3 different technologies in context,
Digital Garage has built a structure that captures
technological evolution and achieves continuous
business growth
Copyright © 2026 Digital Garage, Inc. All Rights Reserved
4
History of DG Group's Contextual Design and Social Implementation
Since its establishment in 1995, DG has been developing the latest internet business deploying cutting-edge technologies
based on marketing and payment. Our next generation focus will be on Gen AI / web3, etc.
Copyright © 2026 Digital Garage, Inc. All Rights Reserved
5
Business Segment Formations
PS Segment
Fintech
Biztech
Group Businesses / Strategic Partners
LTI Segment
GII Segment
Media (Kakaku.com)
Retail Tech Real Estate B2B web3
Mobile & Next Tech
Money flow
・Data team
・PP project
DATA FLOW
Media & Mobile & Next Tech
Gravity
Information flow
Business flow
Startup
Global Incubation Stream
Global Tech & Startup Community
<Tokyo/San Francisco/London>
Logistics
Copyright © 2026 Digital Garage, Inc. All Rights Reserved
6
II. Consolidated Financial Highlights
Copyright © 2026 Digital Garage, Inc. All Rights Reserved
7
Optimizing Core Businesses and Developing a Grand Design for Growth Areas
toward the New Medium-Term Plan
• We are treating this as a transition year ahead of our new Medium-term Management Plan, driving cost efficiency and
optimization across the Group
• Following the strengthening of the management structure of our core businesses, we are reallocating management resources to
next-generation growth areas with an eye toward the AI era
Ahead of the release of our new Medium-term Management Plan later this year, we are strengthening the following three areas: ①, ②, and ③
① Strengthening
Our Management
Foundation
⚫ Optimizing and streamlining our organizational and workforce structure across the Group (targeting a 15–20% reduction in head office costs)
⚫ Optimizing office space / reducing head office footprint (implemented in July 2026)
⚫ Streamlining our business portfolio by exiting, selling, or consolidating unprofitable operations (having consolidated three Group companies over
the past year)
⚫ Divesting select securities and non-current assets and off-balancing our investment business (see p. 25)
⚫ In addition to our payment business, strengthening payment-related areas by leveraging industry-specific AI and data
② Strengthening
Our Core Business
⚫ Overhauling the management structure at our payment subsidiary and fundamentally restructuring its sales and development teams to optimize its
organizational and workforce structure
⚫ Enforcing rigorous project-level profitability management and reviewing our product strategy and priorities to improve profitability and take rate
⚫ QR code payment transaction volume for “Cloud Pay” surpassed ¥1 trillion, while strengthening payment marketing and data capabilities
⚫ Fully integrating AI into our development processes to reduce development costs
③Create the Next
Digital
Infrastructure
⚫ Development underway for the launch of “DG Bank (tentative name),” a strategic financial services initiative with Resona Group, during the current
fiscal year
⚫ Launching “DG SPS ,” a stablecoin payment platform supporting next-generation payment infrastructure, following proof-of-concept testing
⚫ Launch of “DG Agentic One ,” Japan’s first integrated Agentic Commerce platform
⚫ Maximizing returns from strategic alliances with partners by leveraging AI (including Resona, JCB, KDDI, Toshiba Tec, and ANA)
Copyright © 2026 Digital Garage, Inc. All Rights Reserved
8
Financial Results Summary for 1Q FY27.3
Results Summary
PS profits declined as expected amid ongoing optimization, while LTI posted significant growth and GII
remains on track to achieve its medium-term target
We recorded a consolidated pre-tax loss of 0.4 billion yen, primarily driven by losses in the investment business
Consolidated
PS
Profit before tax
(+¥0.9 B)
¥
PMT TXN Vol.
2.0 T → ¥2.9 T
(YoY)
(+41.3%)
PS
¥
Profit before tax
2.2 B → ¥1.9 B
(YoY)
(-11.9%)
LTI
¥
Profit before tax
0.6 B → ¥0.9 B
(YoY)
(+43.2%)
GII
Investment
business income
16.3 B
Total: ¥
(FY24.3~FY27.3 1Q)
Segment Highlights
Platform Solution
Long-Term Incubation
Global Investment Incubation
⚫ Payment transaction volume continued to
expand significantly, fueled by our largescale projects with the KDDI Group
⚫ Several strategic businesses have entered
the monetization phase, driving a reduction
in business losses
⚫ QR code payment transaction volume
continues to outperform broader market
growth, surpassing ¥1 trillion in 2025
⚫ Our out-of-app payment service, AppPay,
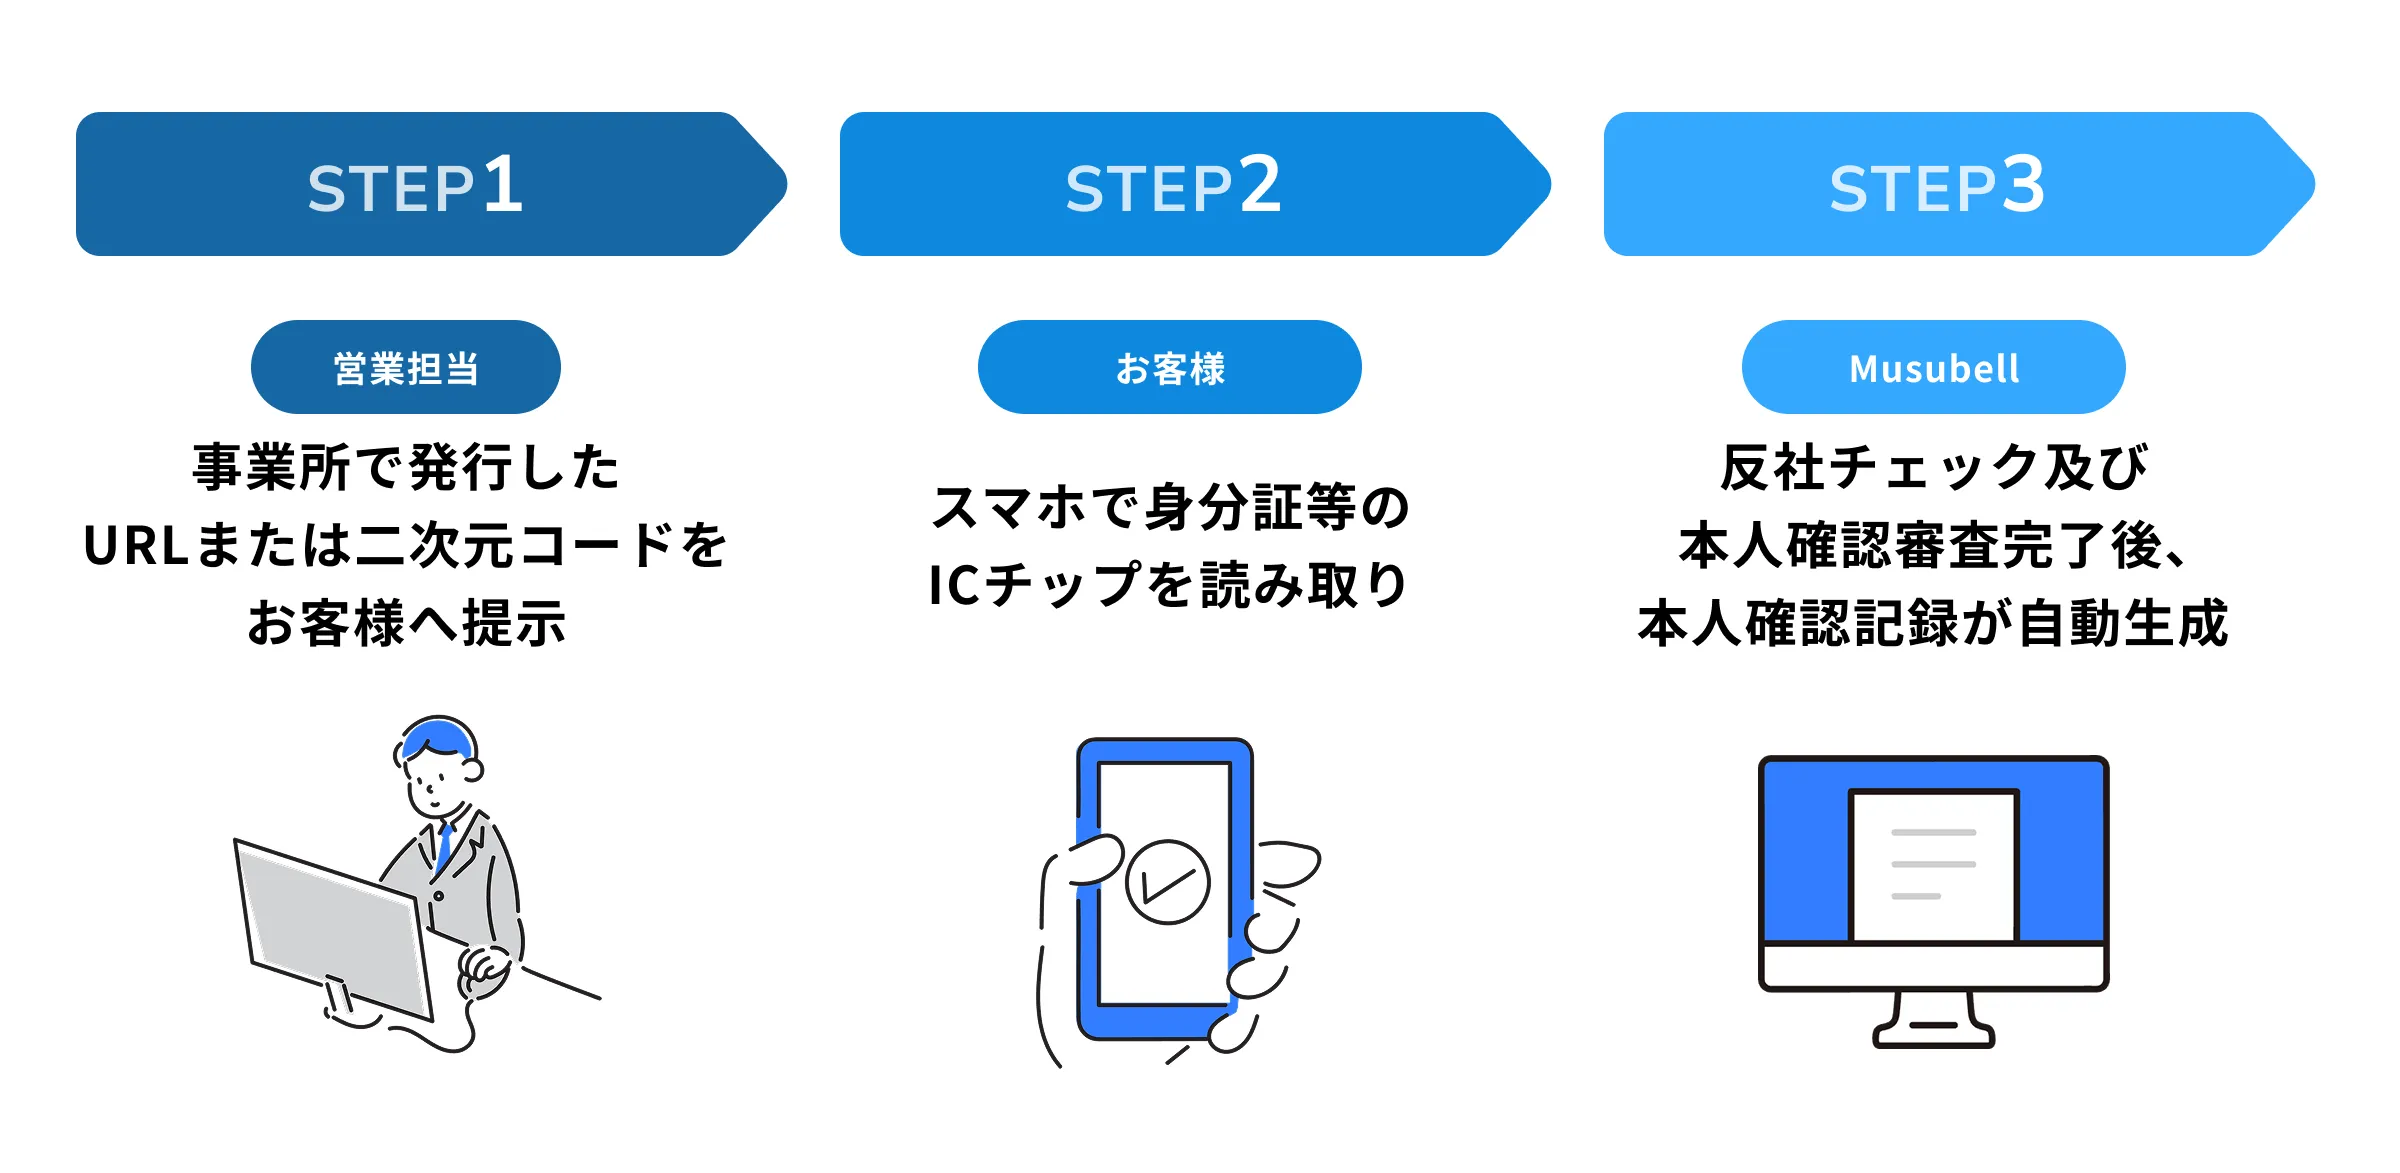
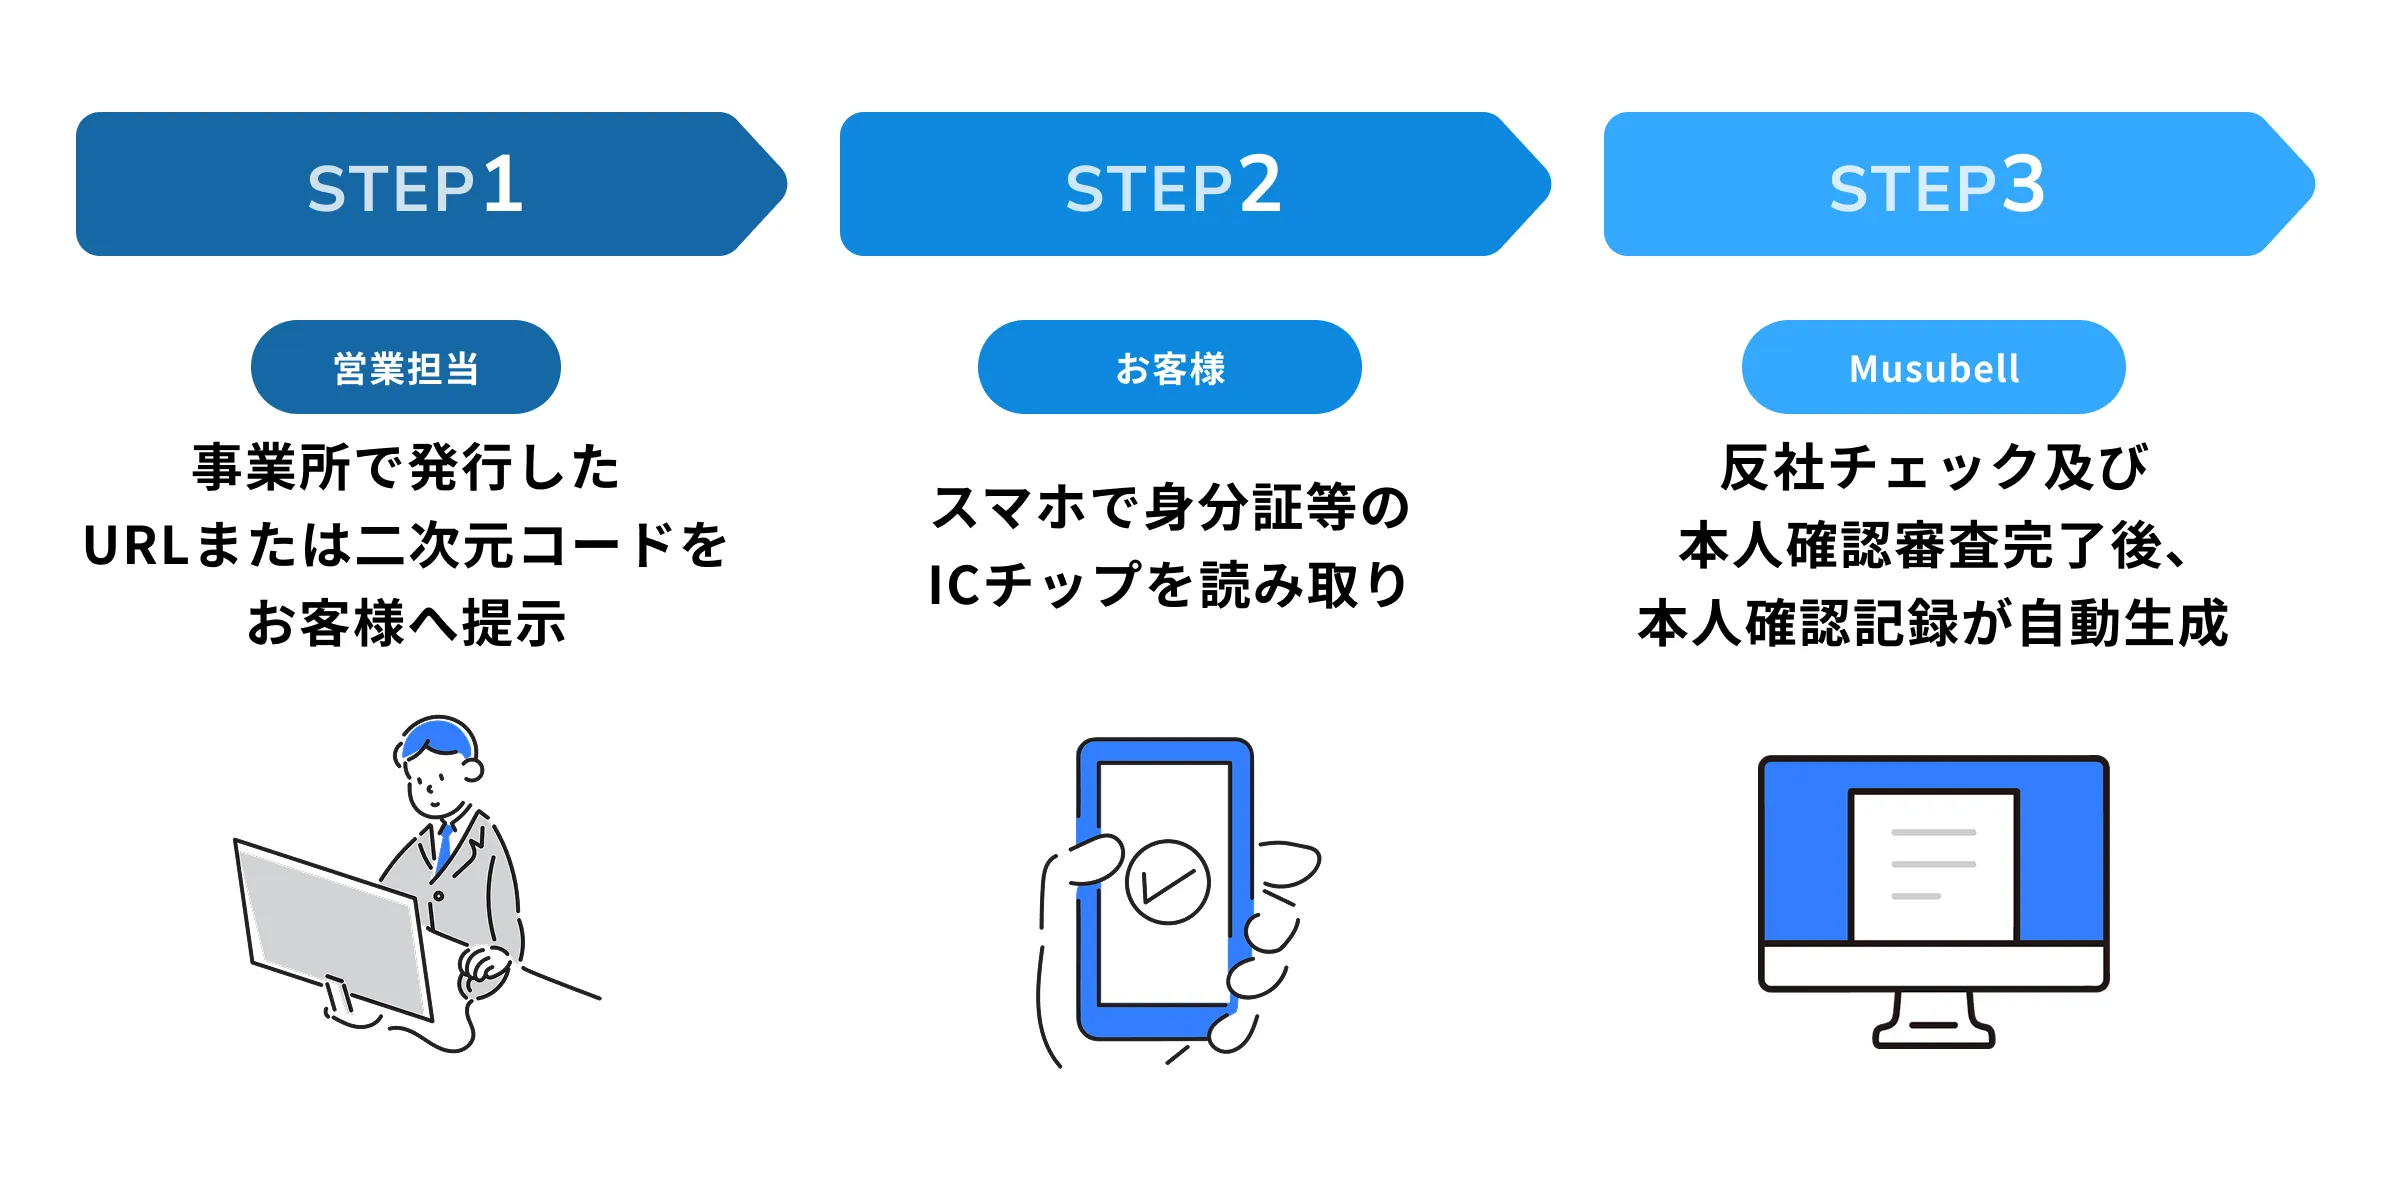
and real estate DX service, Musubell,
continue to scale steadily
⚫ We are accelerating asset sales and offbalancing initiatives to achieve our ongoing
Medium-Term Plan KPI of ¥30 billion in
investment business income
⚫ We will leverage our patented Cloud Pay
series to drive further market share
expansion
⚫ We have initiated the commercial rollout of
stablecoin payments to power nextgeneration payment infrastructure
⚫ We have formed a strategic alliance with a
world’s leading secondary fund
⚫ Our goal is to build a resilient operating
base that minimizes earnings volatility
Copyright © 2026 Digital Garage, Inc. All Rights Reserved
9
Consolidated Financial Highlights – Segment Profit
FY26.3
1Q
FY27.3
1Q
YoY
Change
(%)
Consolidated
profit before tax
-1,345
-428
+917
PS
2,205
1,942
-263
-11.9%
Payment
1,770
1,429
-340
-19.2%
Marketing
436
513
+77
+17.8%
• Tailwinds from continued momentum in the payments and financial advertising
market
LTI
625
895
+270
+43.2%
• Growth and monetization of strategic businesses (out of app payment and real
estate DX)
GII
-2,617
-952
+1,665
• Valuation losses on select operational investment securities
HQ/Adjustments
-1,559
-2,314
-755
• Increased costs driven by financial advisory fees and head office optimization
(Unit: M JPY)
Summary
• Breakdown of the main drivers behind our pre-tax profit:
• Strong Marketing performance offset by lower profits in Payment
• Lingering effects of churn and contract revisions among major customers LFY
• Gradual recovery expected from the second half as these impacts run their course
Copyright © 2026 Digital Garage, Inc. All Rights Reserved
10
Basic Business Revenue and Profit*
*Recurring business revenue and profit excluding
investment-related and one-time gains/losses
• Basic business profit declined due to lower profit in the core PS segment, as well as costs associated with HQ office optimization
and the Kakaku.com project
• As a transition year toward the new Medium-Term Plan, driving group-wide cost efficiency improvements and optimization
Basic Business Revenue
PS
Basic Business Profit
(Unit: M JPY)
(Unit: M JPY)
YoY
LTI
YoY
HQ/Adjustments
9,622
7,902
3,356
9,675
3,284
+0.5%
<Key Drivers of Profit Decline>
-2.1%
⚫
Lower profit in the PS segment
⚫
Kakaku.com TOB-related expenses
⚫
Office optimization costs
⚫
Higher interest expenses due to
rising interest rates
3,193
1,235
4,688
FY25.3 1Q
5,899
6,037
FY26.3 1Q
FY27.3 1Q
+2.3%
897
680
FY25.3 1Q
FY26.3 1Q
-44.9%
FY27.3 1Q
Copyright © 2026 Digital Garage, Inc. All Rights Reserved
11
III. Segment Performance Highlights
Copyright © 2026 Digital Garage, Inc. All Rights Reserved
12
Business Highlights and Overview
Ⅰ PS segment
Ⅱ LTI segment
<KPIs>
New businesses
revenue growth
+73 %
Pre-tax profit growth
+43 %
Business Highlights
◼ While equity-method profits
declined, payment transaction
volume reached a record high
Strategic
businesses
◼ Several strategic businesses,
including AppPay and Musubell,
have entered the monetization
phase, driving a reduction in
business losses
Group Synergies
◼ Payment transaction volume from the
Kakaku.com Group continues to grow
◼ Transaction volumes from new businesses
also maintained strong growth, up 52%
YoY
Ⅲ GII segment
<KPIs>
Payment TXN volume
(TTM)
Payment TXN vol. growth
Pre-tax profit growth
10 T
+41 %
-11.9 %
¥
<KPIs>
Investment business
income
16.3 B
¥
Business Highlights
◼ QR code payment transaction volume surpassed ¥1 trillion for
the first time in 2025, and has scaled to ¥1.5 trillion over the
trailing twelve-month period.
◼ We are leveraging our Cloud Pay series to drive adoption in
cash-heavy sectors and businesses still relying on fragmented,
manual systems
◼ Our next-generation payment platform, NESTA, is now fully
operational.
◼ We are scaling adoption across the broader au economic zone,
including KDDI Group companies, while actively driving
deployment to enterprise clients outside the KDDI Group
◼ We deepened our capital and business alliance in July 2025 to
fast-track our goal of hitting ¥1 trillion in payment transaction
volume.
◼ We are co-developing a new BaaS and digital finance business
for SMEs, slated for rollout later this fiscal year
Operational
investment securities
(End of FY27.3 1Q)
52.8 B
¥
Business Highlights
Fair value
◼ Our portfolio value fluctuated,
impacted by valuation losses on
select investments and movements
in FX
◼ Recorded a cumulative total of
¥16.3 billion
Investment
business
◼ Leverage our strategic partnership
income
with world’s leading secondary fund
to achieve the MTP targets
Group Synergies
◼ We established the Business Co-Creation
Department to serve as a cross-functional
hub for global tech startups, driving the
implementation of cutting-edge Fintech
◼ We are partnering with a U.S. startup in
our portfolio to co-develop an AI search
optimization (GEO) solution
*All figures pertain to FY27.3 1Q results
Copyright © 2026 Digital Garage, Inc. All Rights Reserved
13
Ⅰ PS
Segment Performance
• Payments: Profit declined, mainly due to the impact of major customer churn and contract revisions in Q2 of the previous
fiscal year
• Marketing: Continued to perform strongly, as in the previous fiscal year, supported by robust payment and financial services
markets, delivering double-digit profit growth
Segment Revenue
Payment
YoY
Marketing
4,688
FY25.3 1Q
YoY
Marketing
6,037
+2.3%
2,205
1,182
1,306
+10.5%
436
4,716
4,731
FY26.3 1Q
FY27.3 1Q
+0.3%
(Unit: M JPY)
Payment
5,899
1,070
3,591
Segment Profit
(Unit: M JPY)
1,736
214
1,560
FY25.3 1Q
1,770
FY26.3 1Q
1,942
-11.9%
513
+17.8%
1,429
-19.2%
FY27.3 1Q
Copyright © 2026 Digital Garage, Inc. All Rights Reserved
14
Outlook
Ⅰ PS
• FY27.3: Expecting a challenging 1H as impacts from major customer churn and contract revisions persist, with a planned return to growth in 2H
• Driving sustained growth by deepening strategic alliances with partners and leveraging deep insights into our customers’ businesses
• Deploying next-gen technologies to address the rapidly evolving business environment driven by AI and solve client challenges (Payments × AI × Data)
Business Plan for FY27.3
FY28.3 and Beyond
Return to growth in 2H as impacts from customer losses & contract revisions subside
PS Segment Profit Trends (Unit: M JPY)
GMV (Unit: T JPY)
-12%
2,262
Plan
Prior year
Plan
Prior year
1Q
2Q
3Q
4Q
7.5
9.1
_Segment Profit Growth Trajectory
Key Profit Growth Drivers
Plan
Plan
Prior year
⚫
Optimizing our
cost structure
11.5
Results
Prior year
⚫
Solving Customer
Challenges
2,350
1,942
⚫
Deepening
strategic alliances
+26%
2,257
2,205
Driving key initiatives to secure medium- to long-term growth in segment profit
FY25.3
FY26.3
⚫ Expanding into the KDDI Group's non-telecom
domains
⚫ Deepening our collaboration with the Resona
Group
⚫ Expanding and cross-selling into paymentrelated areas
⚫ Accelerating our vertical strategy
⚫ Optimizing personnel and reining in fixed costs
FY27.3
We anticipate a drop in 1H profits as we continue to feel the impact of the customer
churn and contract revisions that occurred in FY26.3 2Q
Heading into the second half, our ongoing structural reforms will help rein in fixed
costs and put us back on a growth track
We project ¥11.5 trillion (YoY +26%) in payment transaction volume, driven by organic
growth combined with a full year of contributions from the large-scale project for KDDI
Group
We will outline the full details in our new
Medium-Term Plan, scheduled for release
later this year
FY27.3
FY28.3
Copyright © 2026 Digital Garage, Inc. All Rights Reserved
15
Ⅰ PS
Payment Transaction Volume
• Payment transaction volume continued its strong growth trajectory in Q1, driven by the launch of a major project, bringing our
trailing twelve-month volume to roughly ¥10 trillion
• Our take rate has been largely in line with expectations, following the full-scale rollout of the large KDDI Group project in 26Q4
Payment Transaction Volume (Quarterly)
Payment Transaction Volume (by FY)
Online payments
(Unit: T JPY)
TXN take rate(%)
Offline payments
0.22
0.21
Online payments
TXN take rate
Offline payments
0.23
0.22
0.21
0.23
0.22
(Unit: T JPY)
0.22
0.22
0.21
0.21
0.21
0.20
0.26
0.23
0.24
0.23
0.24
0.21
0.18
YoY
7.5
6.2
5.3
1.3
4.0
FY23.3
+21.1%
2.8 2.9 +41.3%
3.0
+20.1%
2.3 0.8 0.8 +20.1%
1.8
4.4
FY24.3
FY25.3
YoY
9.1
2.5
5.0
0.17
6.1
FY26.3
+21.6%
2.0 1.9 2.0 2.0
1.8 1.8
0.8
1.6
1.6
0.7
0.7 0.7 0.7
1.4 1.4 1.5 1.5
0.6
0.6
1.2 1.2
0.5 0.5
0.4 0.3 0.4 0.4
0.3 0.3
2.0 2.0 +52.6%
1.4 1.3 1.3 1.3 1.5
1.2
1.2
1.2
1.1
1.1
1.1
1.1
1.0
0.9 0.9
1Q
2Q
3Q
FY23.3
4Q
1Q
2Q
3Q
FY24.3
4Q
1Q
2Q
3Q
FY25.3
4Q
1Q
2Q
3Q
FY26.3
4Q
1Q
FY27.3
Copyright © 2026 Digital Garage, Inc. All Rights Reserved
16
Ⅰ PS
Breakdown of Increase/Decrease in Transaction Volume (Quarterly)
• Offline payments: Volume growth rebounded to over 20% for the first time in three quarters, overcoming the ongoing slowdown
in inbound consumption
• Online payments: Volume grew substantially as contributions from the large-scale KDDI Group project offset the lingering impact
of major customer churn
Offline Payments
⚫ General Retail: Growth remained in the single digits in FY27.3 1Q. A continued slump in
inbound tourism drove a double-digit YoY decline in overseas QR code payment volume
⚫ Strategic Alliances: Maintained steady growth momentum with key partners including
Toshiba Tec, Recruit, and Square
+20.1%
843
Online Payments
(Unit: B JPY)
(Unit: B JPY)
⚫ Telecommunications/SaaS surged following the full-scale rollout of the KDDI Group project
⚫ Food Service sustained high growth fueled by rising mobile and table orders
⚫ Securities/FX Trading: Volume fell sharply, weighed down by the lingering impact of FY26.3
2Q major customer churn
2,016
YoY
YoY
+52.6%
702
General retail
+9.5%
Telecom & SaaS +445.6%
1,321
Travel-related
+58.7%
Food & B. / alcohol
+24.9%
Travel-related
+11.4%
+19.7%
Public sector
-0.6%
Professional services +18.1%
Food service
+28.7%
Others
Securities / FX
-77.5%
Others
Food service
FY26.3 1Q
FY27.3 1Q
FY26.3 1Q
FY27.3 1Q
Copyright © 2026 Digital Garage, Inc. All Rights Reserved
17
Ⅱ LTI
Segment Performance
• Strategic Businesses: Several businesses highly synergistic with our payments segment have entered their growth phase, narrowing
overall business losses
• Equity-method earnings from Kakaku.com and others declined, but payment volume via the platform continues to grow (See 24p)
Segment Revenue
Business revenue
Equity-method profit
3,217
1,002
Segment Profit
(Unit: M JPY)
YoY
3,356
3,291
1,020
966
-5.2%
-0.8%
2,191
2,336
2,318
FY25.3 1Q
FY26.3 1Q
FY27.3 1Q
(Unit: M JPY)
Segment profit
YoY
Business profit
Equity-method profit
-1.9%
506
-520
FY25.3 1Q
625
-398
FY26.3 1Q
895
+43.2%
-78
FY27.3 1Q
Copyright © 2026 Digital Garage, Inc. All Rights Reserved
18
Ⅲ GII
Segment Performance (Breakdown of Operational Investment Securities)
• Strategic Partnership: Reached a basic agreement in May 2026 with one of the world’s leading venture-focused secondary fund
• Portfolio Optimization: Expect to achieve Medium-Term Plan KPIs by selling and transferring the majority of our investment
portfolio (See 25p)
(Unit: M JPY)
Operational Investment Securities – Waterfall Chart
Investment business income (MTP)
Investment business income (Actual)
53,505
30.0 B (FY24.3 ~ FY28.3)
3-year (cumulative): ¥16.3 B (FY24.3 ~ FY27.3 1Q)
5-year (cumulative): ¥
+52
(USD/JPY FX Rate)
Mar. 2026 End: ¥159.9
Jun. 2026 End: ¥162.4
-209
52,780
-1,258
-14
FY26.3
New investment
Decrease in book
value due to sales
Fair value change
(excluding FX)
Others
52,076
EoQ balance
(excluding FX)
+704
Fair value change
(FX impact)
FY27.3 1Q
Copyright © 2026 Digital Garage, Inc. All Rights Reserved
19
IV. Segment Topics
Copyright © 2026 Digital Garage, Inc. All Rights Reserved
20
Ⅰ PS
Platform Solution – Business Overview
Membership
Acquisition
Support
Online
Payments
Merchant
Support
Offline
Payments
BNPL
QR Code
Payments
Business Domain
Growth Engine
Results
Membership
Acquisition Support
Affiliate advertising consulting
capabilities & technology
utilization
Annual Revenue
Online Payments
Further expansion through
collaboration with Resona/KDDI
Group, etc.
Annual GMV
Offline Payments
Collaboration with Toshiba Tec
Corporation, ANA Group, Square
& Recruit etc.
Annual GMV
QR Code Payments
Growth acceleration by Cloud Pay
series
BNPL
Business growth through SCORE's
expansion into the B2B BNPL
+38%
Merchant Support
Marketing talents collaboration
and unified data infrastructure
development
Annual Revenue
(Buy Now Pay Later)
(Website creation, cybersecurity, etc.)
¥24.4 B
¥6.1 T
¥3.0 T
3y CAGR
+45%
3y CAGR
¥6.5 B
(*Annual results: Apr. 2025 – Mar. 2026; 3Y CAGR: FY23.3 to FY26.3; QR code payment: GMV CAGR; BNPL: PBT CAGR)
Copyright © 2026 Digital Garage, Inc. All Rights Reserved
21
Ⅰ PS
Growth in QR code payments driven by Cloud Pay
• Our QR code payment transaction volume is growing 1.7x faster than the broader market. Volume cleared ¥1 trillion in 2025 and
has reached ¥1.5 trillion over the trailing 12 months
• We will drive further market share gains by leveraging our patented Cloud Pay series of bundled QR payment services
< QR Code Payment Transaction Volume Clears ¥1 Trillion >
< Cloud Pay Series
– Outline >
⚫ DGFT's QR code payment transaction volume crossed the ¥1 trillion
mark for the first time in 2025
⚫ Over the past three years (2022 to 2025), we achieved a CAGR of 48%
⚫ Outpaced the broader market's 28% growth by 1.7x, allowing us to
steadily capture market share
20
DGFT share (Right axis: %)
QR code payment market (Left axis: ¥ trillion)
12
9
10
6
5
0
1
2
One of Japan's
largest QR Payment
Bundled Services
2020
2021
2022
2023
2024
*Source: Market size based on data from METI; DGFT share based on Digital Garage estimates
2025
Low-cost
deployment enabled
by a device-less
approach
3
Offer access to
payment methods
beyond QR codes,
such as credit cards
Driving adoption across cash-heavy sectors
where fragmented systems remain prevalent
Vending machines
(Market size: ¥2 trillion)
Arcade & family
entertainment
(Market size: ¥720 billion)
Preschools &
childcare facilities
(Market size: ¥2.5 trillion)
Field services
(Market size: ¥4 trillion)
Parking facilities
Food service & retail
3
0
Patented
>
15
Patented
*Source: June 15, 2026 press release, “Digital Garage Group's Cloud Pay QR Code Payment Transaction Volume Clears ¥1 Trillion”
Copyright © 2026 Digital Garage, Inc. All Rights Reserved
22
Ⅱ LTI
Segment Overview
Development & nurturing of strategic businesses to drive payment platform expansion for medium to long-term growth
Through initiatives to support Kakaku.com’s growth and cross-Group projects, we aim to expand payment transaction volume generated by Kakaku.com
Media, while building new revenue streams through the development of strategic businesses and M&A and increasing DGFT’s payment transaction volume
LTI segment business domain
PS segment business domain
Operating an internet media business with
one of the highest traffic volumes in
Japan
Developing strategic business initiatives
and next-generation infrastructure in
sectors aligned with payment services
Operating one of Japan's largest payment
processing businesses / Designated as
critical infrastructure in Japan
Media
Focus area
Payment
• Monthly users: 97M
• Monthly PV: 2,460M
• Monthly users: 31M
• Monthly PV:
236M
• Monthly users:
• Monthly PV:
16M
173M
Traffic
Ⅰ
Industry-specific DX
Ⅱ
B2B payment/finance
Ⅲ
Next-gen technologies
Payment
10 T
Payment
TXN volume
¥
Payment
Location
1.40
Supported
payment methods
40 +
M
types
- Data is based on the trailing 12 months (TTM).
Copyright © 2026 Digital Garage, Inc. All Rights Reserved
23
Ⅱ LTI
Update on Strategic Businesses
• Several strategic businesses highly accretive with payments have entered the growth phase, driving a steady expansion in both
revenue and payment transaction volume.
• Payment transaction volume via Kakaku.com continues on a steady upward trajectory, and we are promoting joint business
initiatives that leverage the assets of both companies.
Key Business Topics
Strategic businesses
Strategic businesses
– PMT TXN Vol. (YTD basis)
TXN vol from Kakaku.com
Growth of AppPay (out-of-app PMT service)
YoY
YoY
YoY
⚫
Global Expansion: Payment volume surged approximately 6x YoY
⚫
Regulatory Tailwinds: Expanding business scale, bolstered by
the new Smartphone Act (enacted Dec. 2025)
⚫
Steady growth in contracted titles secured our position as
Japan's No. 1 off-app billing platform*1
+73%
(TTM)
+17%
+52%
Launched Musubell Smart Identity Verification
⚫
Compliant with the upcoming April 2027 AML regulations
⚫
Streamlines operations using mobile eKYC
⚫
Capitalizing on robust eKYC demand to scale our client base
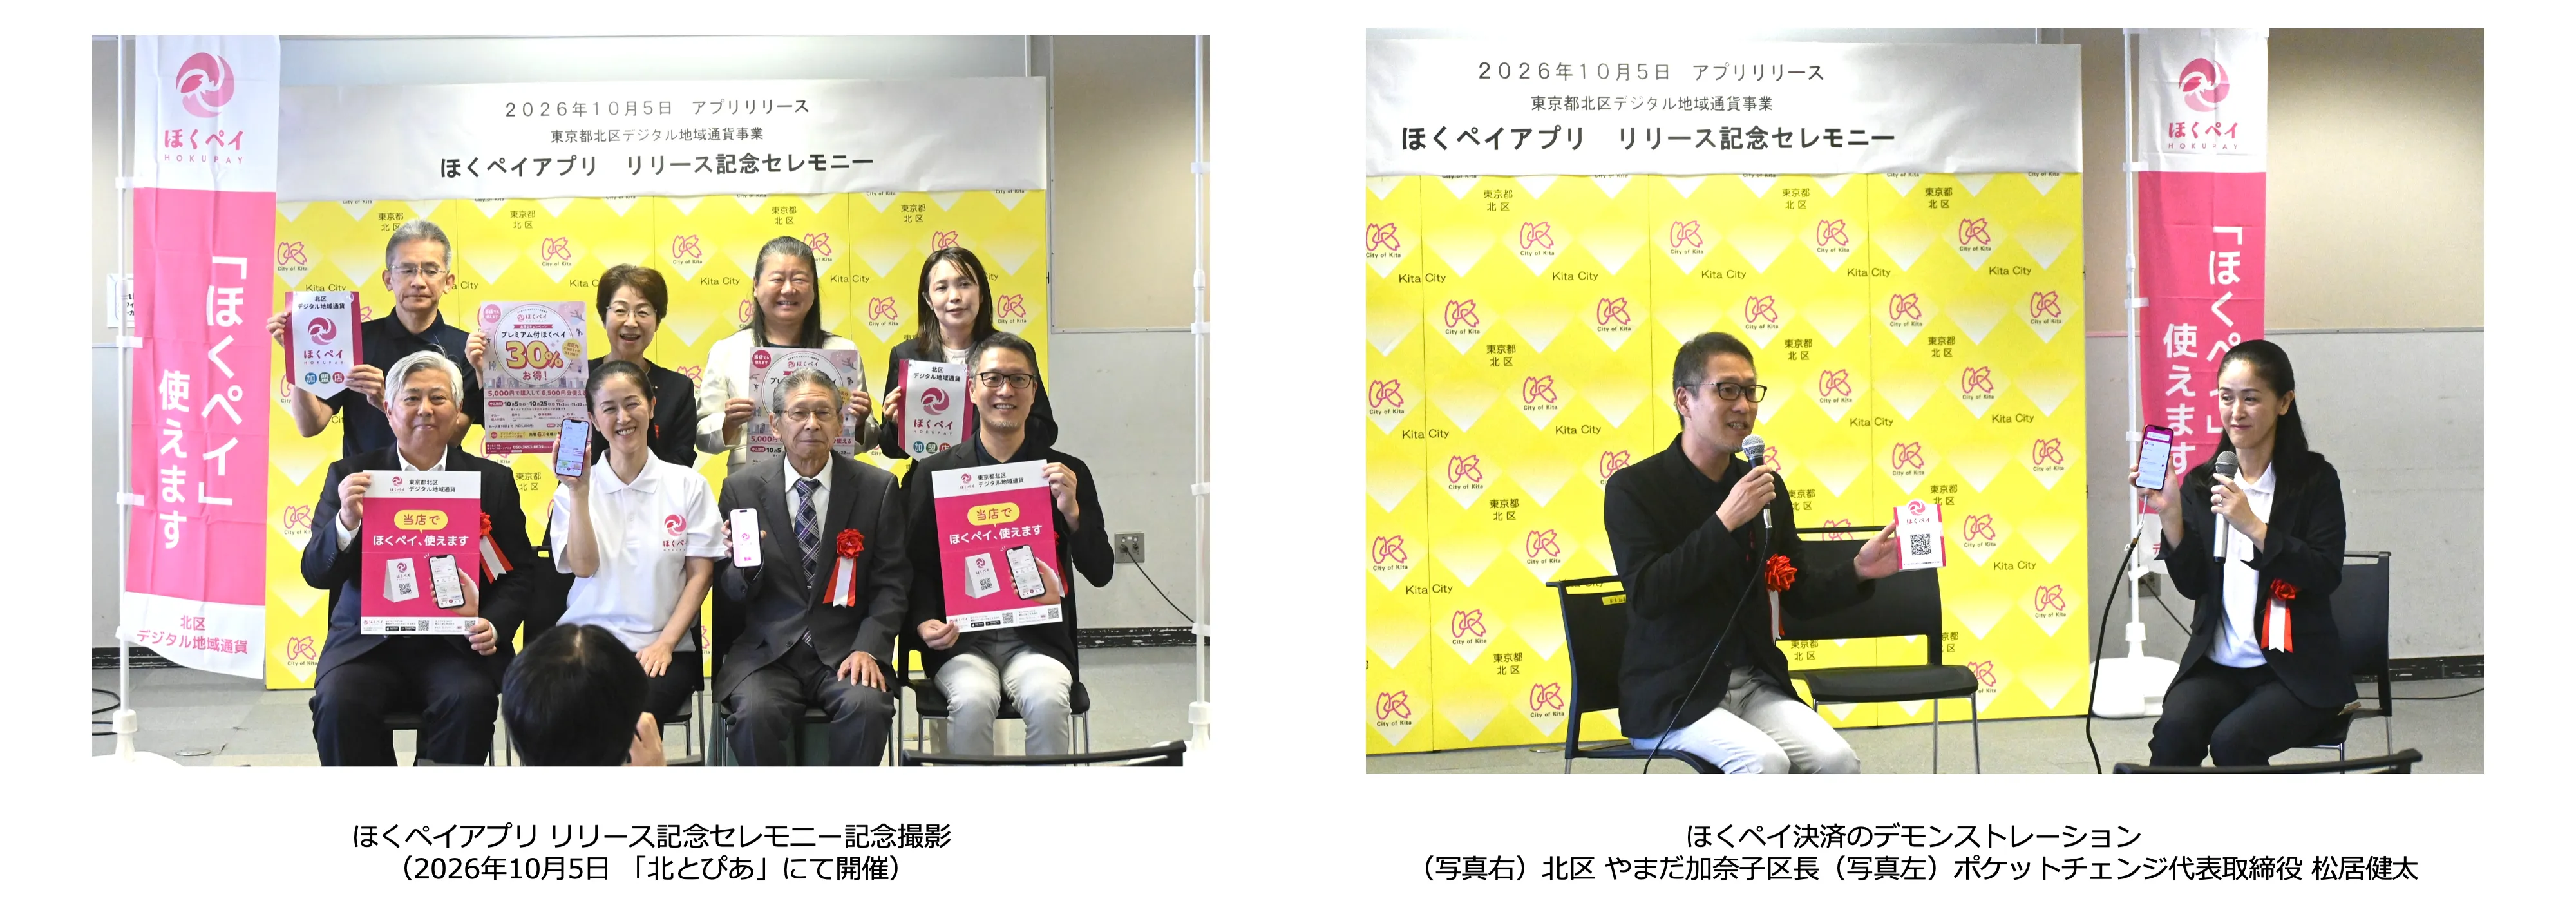
Pocket Change's "Pokepay" launched in Kita Ward, Tokyo
⚫
Selected as the engine for Kita Ward's local digital currency
⚫
Launching Fall 2026: Powered by Pokepay, the proven platform
behind Shibuya's "Hachi-Pay"
26Q1
27Q1
26Q1
27Q1
26Q1
27Q1
*1) Ranks No. 1 out of all third-party PMT service platforms in Japan by number of mobile game and app integrations (October 2025 survey by Digital Garage)
Copyright © 2026 Digital Garage, Inc. All Rights Reserved
24
Ⅲ GII
Off-Balance Sheet Initiatives
• Executing our Medium-Term Plan to transition assets off-balance sheet, minimizing earnings volatility and securing a stable operating base
• Following our basic agreement with a world’s leading secondary fund, we are actively negotiating terms for the strategic
portfolio sale
Investment Business: Challenges & Progress to Date
Balance Sheet De-Risking Through Secondary Fund Partnership
Earnings volatility driven by fair value fluctuations (including FX impacts)
Negotiating final deal terms and structure
Consolidated Profit Before Tax (JPY millions)
Overview of Strategic Off-Balance Sheet Plan
45,393
10,008
FY20.3
14,317
FY21.3
6,298
FY22.3
Secondary
Fund
DG Group
-13,881
FY23.3
2,966
-10,216
FY24.3
FY25.3
Investment
portfolio
¥
FY26.3
¥
Portfolio Divestment
& Transfer
z
Investment
portfolio
IPO / M&A
Secondary
Targeted
market
Secondary Sales
¥
Divesting majority of the DG Group portfolio to
secondary fund—
de-consolidating investment assets to unlock liquidity
Medium-Term Plan: Off-Balance Sheet Transition & Investment Restructuring
Disciplined approach to
new investments
Accelerating direct
investment exits
Shifting to a
fund-based model
Smoothing out earnings volatility to establish a stable operating base
Copyright © 2026 Digital Garage, Inc. All Rights Reserved
25
V. Strategic Businesses Leveraging Next-Generation Technologies
Copyright © 2026 Digital Garage, Inc. All Rights Reserved
26
Agentic Commerce and Stablecoin Initiatives
Across the Group, we are providing end-to-end infrastructure for the AI agent era—from top-of-funnel awareness
through to payment and settlement—fueling our clients' business growth
Scaling Stablecoins and AI Agents
Supporting E-commerce Merchants in the Agentic Commerce Era
Mainstream adoption of stablecoins is fueling the development of AI agents
Adapting to AI agents is now an urgent imperative for e-commerce merchants
USDC circulating supply*1 (Unit: 0.1 B USD)
770
737 753
600 613
439
246
324 322 355
23/12 24/03 24/06 24/09 24/12 25/03 25/06 25/09 25/12 26/03
About AI Agents
Product Search
Comparison &
recommendation
Order & Checkout
Processing
Automated
settlement
• Unlike legacy AI that merely answers
questions, these agents think and
execute tasks on behalf of the user
• In e-commerce, agents manage the
entire customer journey: from product
discovery and comparison straight
through to checkout and payment
Strategies to be chosen
by AI
Integrating stablecoin
payments
Transition from SEO to GEO*3
Launching two new services to provide comprehensive support for business growth in the AI era
Awareness &
interest
Comparison &
consideration
Product selection &
cart
Ⅰ
Payments
Settlement and payout
Ⅱ
Japan's first integrated Agentic
Commerce platform
Stablecoin payment infrastructure
Integrating data, AI, and payments to build
the commerce infrastructure for the Agentic
Commerce era
Delivering seamless global payments, starting with
inbound tourism and cross-border e-commerce
By 2030, AI agents are projected to facilitate approximately 25% of global e-commerce sales*2
We are entering an era where AI will fundamentally rewire consumer behavior and the
underlying industrial landscape
Building a new commerce ecosystem for the AI era
*1 Compiled from Circle Internet Group Inc., "Transparency & stability / Reserves composition" *2 Source: Deloitte, "Agentic commerce─Redefining the economics of retail" *3 Stands for "Generative Engine Optimization"
Copyright © 2026 Digital Garage, Inc. All Rights Reserved
27
Integrated Agentic Commerce Platform, DG Agentic One
Ⅰ
• Launching Japan's first integrated Agentic Commerce platform, DG Agentic One
• Leveraging integrated expertise in Data Science × Commerce × Payments, powered by AI technology
Launch of a Next-Generation AI Agent Platform Business that Automates the Entire E-Commerce Process
< Structural Changes in the E-commerce Market>
< DG Agentic One
2030 Forecast (*)
78 trillion
20%
Domestic online payments
Penetration rate of Agentic
Commerce in Japan
¥
Architecture and Consumer Experience >
“Can you recommend some
products?”
¥
15 trillion
Consumers
Product recommendations
Providing the
checkout URL
<Coordination with
DGFT>
Enabling a new shopping
experience through nextgeneration payments,
such as stablecoins
Transaction volume of Agentic
Commerce in Japan
AI
Agents
Product discovery request
Continued on next
page
Signaling
purchase intent
Market Background
Product discovery
response and
negotiation
⚫ The consumer journey is shifting from manual search and social
media to AI-driven autonomous commerce—where agents handle
discovery, recommendations, and checkout
Challenges for E
-commerce Merchants
⚫ AI agent integration protocols (UCP/ACP) are now a hard
requirement for merchants
⚫ Critical shortage of the technical know-how needed to structure
data and build semantic context for AI
*Calculated by the Company based on the Ministry of Economy, Trade and Industry’s “Market Survey on Electronic Commerce” and
Yano Research Institute’s “Current Status and Future Outlook of Online Payment Service Providers,” among other sources
DG Agentic One
EC
merchants
DG Agentic One
GEO
MCP
Making data AIdiscoverable
Interaction between AI
Agents and E-commerce
Platforms
Cart integration
DG Agentic One
Checkout and
order
processing
DG Agentic One
DG Agentic One
DataFeed
Commerce
Payment
Optimizing data
for AI
Purchase execution
Multi-method
payments, including
stablecoins
*Initiatives to improve operational efficiency and enhance practical effectiveness of the Agentic Commerce units, leveraging AI
integration of e-commerce business operator data (patent pending)
Copyright © 2026 Digital Garage, Inc. All Rights Reserved
28
Launch of DG SPS : The Stablecoin Payment Platform for Offline, Online, and AI
Commerce
Ⅱ
• Launching DG SPS , the stablecoin platform powering next-generation payments
• Unlocking seamless global payments—starting with inbound travel and cross-border e-commerce
< DG SPS
< Addressable Markets for Stablecoin Payments in Japan*>
¥
9.5 trillion
Inbound tourism spending
¥
4 trillion
Cross-border e-commerce
¥
54 trillion
Users
Payment
*All data are from 2025
Goods /
Services
Users
⚫ Global stablecoin adoption is turning real-world B2B payments into a
reality. At the same time, the point of sale is evolving, expanding beyond
traditional offline and online checkouts to include AI
AI Agents
Transfer
< Our Stablecoin Track Record >
Feb. 2026 Conducted a proof-of-concept using USDC and JPYC
at physical retail stores
QR
Processing
PSPs
Confirmation
Credit
Card
Companies
POS
EC
etc...
Jan. 2026 Partnered with JCB and Resona Holdings to bring
stablecoin payments to the mass market
Payment
Providers
Merchants
Online payments in Japan
Market Background
Payment Flow and Key Features >
Funds
received
JPY
Settlement
Processing
Confirmation
Financial
Institutions
Transaction validation
Address screening
Transfer instructions
etc...
Transaction status
Blockchain
Features
① Frictionless merchant integration via API
② Multi-chain support for key stablecoins
③ Unified backend powering AI Agent transactions
*Includes certain estimates based on sources such as the Japan Tourism Agency’s “Inbound Consumption Trends Survey” and the Ministry
of Economy, Trade and Industry’s “Market Survey on E-Commerce.”
Copyright © 2026 Digital Garage, Inc. All Rights Reserved
29
VI. Kakaku.com’s Going-Private Transaction
Copyright © 2026 Digital Garage, Inc. All Rights Reserved
30
Privatization of Kakaku.com
• On August 13, 2026, EQT increased its tender offer price for Kakaku.com, Inc. to ¥3,570 per share (previously ¥3,450).
• If the transaction is completed during FY27.3, we expect to recognize approximately ¥30.0 billion in gain on sale of shares of
subsidiaries and associates in our consolidated financial statements.
Tender Offer Price
⚫ 3,570 yen per share (previously ¥3,450)
⚫ 2,902 yen per share (previously ¥2,805))
Share Repurchase Price
Tender Offer Period
Expected Cash Proceeds
(after the share repurchase
and other transactions)
⚫ Taking into account the fact that the provision which allows the deemed dividend not to be
included in taxable income under the Corporation Tax Act is expected to apply to the Treasury
Share Repurchase, the amount of after-tax proceeds for the Company with the Treasury Share
Repurchase has been set such that such amount shall be substantially equivalent to the amount of
after-tax proceeds the Company would have received had it tendered its shares in the Tender Offer
at the Tender Offer Price
⚫ From May 13, 2026 to August 27, 2026
⚫ 20 billion yen
Copyright © 2026 Digital Garage, Inc. All Rights Reserved
31
Reference Materials
Business Segment Classification
Long-term Incubation
Segment
New services/products to drive payment
platform expansion
Non-linear business to implement nextgeneration technologies in society
Platform Solution Segment
Global Investment Incubation
Segment
Core business built around
the payment platform
Investing in and supporting
startups focused on next-gen
technologies and collaborating
with DG Group
• Industry-specific DX services
• Payment service provider
• Investment incubation
• New Fintech
• Payment-related functions that add value
• Supporting startups
• Next-gen Media
• Marketing and CRM solutions for the
financial sector
• Fund management
Copyright © 2026 Digital Garage, Inc. All Rights Reserved
33
Reference Materials (1):
Supplementary Data
Copyright © 2026 Digital Garage, Inc. All Rights Reserved
34
Basic Business Revenue and Profit (Quarterly)
• Basic business profit declined due to lower profit in the core PS segment, as well as costs associated with HQ office optimization
and the Kakaku.com project
• As a transition year toward the new Medium-Term Plan, driving group-wide cost efficiency improvements and optimization
Basic Business Revenue
Basic Business Profit
(Unit: M JPY)
PS
(Unit: M JPY)
YoY
LTI
YoY
HQ/Adjustments
9,574
9,697
3,612
3,311
7,902
10,168
3,453
9,622
3,356
9,900
3,397
10,078
3,393
9,792
2,466
9,675
+0.5%
3,284
-2.1%
3,193
1,296
4,688
1Q
5,523
5,909
6,300
2Q
3Q
4Q
FY25.3
5,899
6,077
6,330
1Q
2Q
3Q
FY26.3
6,887
4Q
6,037
1Q
FY27.3
+2.3%
897
1,286
1,365
1,235
1,157
1,008
885
680
1Q
2Q
3Q
FY25.3
4Q
1Q
2Q
3Q
FY26.3
4Q
-44.9%
1Q
FY27.3
Copyright © 2026 Digital Garage, Inc. All Rights Reserved
35
Segment Performance (Quarterly)
Ⅰ PS
• Payments: Profit declined, mainly due to the impact of major customer churn and contract revisions in Q2 of the previous
fiscal year
• Marketing: Continued to perform strongly, as in the previous fiscal year, supported by robust payment and financial services
markets, delivering double-digit profit growth
Segment Revenue
Segment Profit
(Unit: M JPY)
Payment
YoY
Marketing
Payment
5,748
4,688
5,909
6,300
1,582
5,899
1,182
6,077
1,180
1,466
1,841
6,037
1,306
1,068
1,255
4,679
4,652
4,718
4,716
4,897
4,863
5,046
4,731
2Q
3Q
4Q
1Q
2Q
3Q
4Q
1Q
+2.3%
+10.5%
YoY
Marketing
6,887
6,330
(Unit: M JPY)
2,329
2,356
499
490
2,336
607
1,736
2,205
2,257
436
419
2,262
587
2,350
1,942
-11.9%
513
+17.8%
1,485
1,429
-19.2%
4Q
1Q
865
214
1,070
+0.3%
1,560
1,855
1,875
1,733
1,770
1,837
1,675
3,591
1Q
FY25.3
FY26.3
FY27.3
1Q
2Q
3Q
FY25.3
4Q
1Q
2Q
3Q
FY26.3
FY27.3
Copyright © 2026 Digital Garage, Inc. All Rights Reserved
36
Ⅰ PS
Inbound-related Payment
• 1Q visitor arrivals from China dropped 57% YoY. This prolonged sluggishness dragged down the overall inbound visitor growth
rate by 5%
• As a result, inbound-driven QR code payments in 1Q fell 14% YoY
The Number of Foreign Visitors to Japan (by Area)
Offline Transaction Volume
(Unit: B JPY)
QR code payment by foreign visitors
Mainland China/Hong Kong
32.9
Other offline payment
Others
41.3 35.3
44.0
1.7
2.3
1.5
2.2
3.1
3.5
4.3 4.8
12.6
25.3 34.0
24.6
51.6
51.5
45.6
38.3
45.0
1Q 2Q 3Q 4Q 1Q 2Q 3Q 4Q 1Q 2Q 3Q 4Q 1Q 2Q 3Q 4Q 1Q 2Q 3Q 4Q 1Q
FY22.3
FY23.3
FY24.3
FY25.3
FY26.3
FY27.3
FY22.3
FY23.3
FY24.3
FY25.3
FY26.3
FY27.3
(Source) Japan National Tourism Organization, “Visitor Statistics”
Copyright © 2026 Digital Garage, Inc. All Rights Reserved
37
Capital Expenditures and Expenses Related to Payment Business
Ⅰ PS
• With major development projects largely completed, capital expenditures have been declining since peaking in Q4 of the previous
fiscal year
• The contribution profit ratio has also recovered from the decline in Q4 of the previous fiscal year and is expected to remain stable
at the current level going forward
Payment-related Expenditures/Depreciation
Payment-related Costs/Contribution Profit Ratio
(Unit: M JPY)
(Unit: M JPY)
Contribution profit ratio
Depreciation
Capital expenditure
84.7%
78.4%
80.2%
79.6%
80.5%
79.3%
77.9%
78.0%
73.6%
Fixed costs
Variable costs
1,595
1,362
1,201
958
804
493
324
1Q
1,022
354
357
2Q
3Q
FY25.3
349
4Q
335
1Q
346
367
2Q
3Q
FY26.3
426
4Q
416
1Q
FY27.3
920
1,332
1,041
953
867
2,027
2,046
2,113
2,260
1,663
1,858
2,229
1,714
2Q
3Q
4Q
1Q
2Q
3Q
4Q
1Q
509
795
525
908
1,014
1,075
1,293
1Q
FY25.3
FY26.3
FY27.3
Copyright © 2026 Digital Garage, Inc. All Rights Reserved
38
Segment Performance (Quarterly)
Ⅱ LTI
• Strategic Businesses: Several businesses highly synergistic with our payments business have entered their growth phase,
narrowing overall business losses
• Equity-method earnings from Kakaku.com and others declined, but payment volume via the platform continues to grow
Segment Revenue
Business revenue
YoY
Equity-method profit
3,588
3,217
3,328
983
3,436
782
1,136
1,002
Segment Profit
(Unit: M JPY)
3,356
1,020
3,397
3,411
897
1,024
3,291
2,487
15
966
Segment profit
One-off gains/losses
Business profit
Equity-method profit
2,191
1Q
2Q
2,671
2,175
3Q
FY25.3
4Q
2,336
2,499
2,369
2,451
2,318
1Q
2Q
3Q
4Q
1Q
FY26.3
FY27.3
YoY
-1.9%
-5.2%
506
-520
2,629
(Unit: M JPY)
523
-414
625
554
-144
-642
-398
663
700
-245
-333
+43.2%
895
-268
-78
-236
-614
-0.8%
1Q
2Q
3Q
FY25.3
4Q
1Q
2Q
3Q
FY26.3
4Q
1Q
FY27.3
Copyright © 2026 Digital Garage, Inc. All Rights Reserved
39
Breakdown of Operational Investment Securities
Ⅲ GII
• Diversified portfolio comprising companies across North America, Asia, and Japan
• As of June 30, 2026, the fair value of our operational investment securities reached ¥52.8 B, approximately 2x the amount invested
Investments by Area
Investments by Currency
Breakdown
Total Fair Value
¥52.8 B
INR Others
Others
JPY
20.6%
Europe
etc.
12.3%
3.4%
1.7%
Unrealized gains
¥25.2 B
1.5%
Asia 9.5%
13.4%
Japan
54.9% North America
Invested amount
82.6%
¥27.6 B
USD
Copyright © 2026 Digital Garage, Inc. All Rights Reserved
40
Consolidated Statement of Financial Position (IFRS)
(Unit: M JPY)
FY26.3 4Q
FY27.3 1Q
Difference
132,472
126,455
-6,017
Cash and cash equivalents
40,469
40,805
+336
Trade and other receivables
35,695
29,792
-5,902 Payment business-related item
Operational investment securities
53,505
52,780
-725 Exit and change in fair value of investee companies in GII segment (including FX effects)
86,231
86,666
+435
Property, plant and equipment
11,997
11,064
-933
Intangible assets
11,390
12,240
+850
Investments accounted for using equity method
37,356
37,414
+57
Other financial assets
14,761
15,118
+357 Change in fair value of investee companies (including FX effects)
Total assets
218,703
213,121
-5,582
Current liabilities
87,868
86,246
-1,623
Bonds and borrowings
26,366
26,545
+179
Trade and other payables
54,364
52,861
-1,504 Payment business-related item
53,139
51,297
-1,841
Bonds and borrowings
35,687
34,308
-1,379
Other financial liabilities
4,927
4,407
-521
Total liabilities
141,007
137,543
-3,464
Total equity attributable to owners of parent
75,584
73,006
-2,578
Share capital
8,014
8,285
+271
Capital surplus
5,457
5,054
-404
Treasury shares
-5,033
-5,002
+31
Retained earnings
65,146
62,401
-2,745
Non-controlling interests
2,112
2,573
+461
77,696
75,578
-2,118
Current assets
Non-current assets
Non-current liabilities
Total equity
Reason for change / Remarks
Copyright © 2026 Digital Garage, Inc. All Rights Reserved
41
Reference Materials (2):
Business Model
Copyright © 2026 Digital Garage, Inc. All Rights Reserved
42
Ⅰ PS
B2C Cashless Market
Starting in 2026, METI is updating their cashless payment tracking methodology
Specifically, stripping out non-transactional items such as imputed rent gives a clear picture of actual spending, and the government
aims for 65% cashless penetration in Japan by 2030 (55% on a global comparison basis)
Cashless Market Size (Japan)
Cashless Rate by Country
(As of 2023)
Cashless Payment Ratio
Credit Card
99.1%
Debit Card
E-Money
QR Code Payments
National Final
Expenditure (excluding
imputed rent of owneroccupied dwellings)
(Unit: ¥T)
230
237
252
262
267
281
68.4%
58.0%
37.3%
2020
83.3%
40.0%
2021
44.0%
2022
48.4%
52.8%
64.0%
Government’s 2030 target
55% (global comparison basis)
58.4%
52.7%
48.0%
39.3%
2023
2024
2025
Sources: Japan Consumer Credit Association; Cabinet Office, “National Accounts”; Japan Debit Card Promotion Association (through 2015); Bank of Japan,
“Payment and Settlement Systems Report” and “Payment and Settlement Statistics” (from 2016 onward); Payments Japan Association, “Survey on Code Payment
Usage Trends”; and Cabinet Office, “National Accounts” (Nominal), Payments Japan Association, “Cashless Payment Ratio in Major Countries”
Copyright © 2026 Digital Garage, Inc. All Rights Reserved
43
Ⅰ PS
Structure of Payment Service Provider
An intermediary service that connects merchants (e-commerce and physical stores) with payment providers (credit card companies,
convenience stores, etc.) allowing merchants to implement multiple payment methods through a single contract
Electronic transaction
Money
Consumer
Merchant
① Order
EC website
Payment service provider
② Payment information
③ Payment information
Means of payment
Credit card companies
Bank payment
Convenience store payment
⑦ Provision of goods
⑤ Result notification
④ Result notification
⑨ Payments
(commission deducted)
⑧ Payments
(commission deducted)
Physical stores
e-money payment
Telecom carrier payment
ID payment
International payment
⑥ Payments
QR code payment
BNPL (Buy now pay later)
Copyright © 2026 Digital Garage, Inc. All Rights Reserved
44
Ⅰ PS
Contract Type of Payment Service Provider
Storage agency type (Representative contract)
• Monthly sales proceeds are deposited into the merchant's account in a lump-sum
payment from our company
• Single point of contact for payment
Merchant
• We handle all contracting procedures with payment providers such as credit card
companies and financial institutions
Merchant contract
• Streamline operations such as payment management and confirmation
Payment data
processing
Payment
service provider
Payment data
processing
Monthly fee
Pay the amount less the
payment service provider ’s
fees
Pay sales proceeds less
fees
Payment institutions
Acting as an all-in-one agent for contracting procedures with various
payment institutions and payment of sales amounts
Payment data processing type(Direct contract)
• Merchants sign contracts directly with credit card companies
• Provide the necessary software and transaction management tools
• Also provide support for software installation
Electronic
message
Money
Payment data
processing
Payment
service provider
Monthly fee,
Processing fee
Merchant contract
Pay sales proceeds less fees
Payment data
processing
Payment institutions
• Provide payment systems and automate card payment processing
Data processing
contract
Merchant
Based on the merchant agreements with credit card companies signed
by the merchants, credit card payment processing is automated
through the introduction of a payment system provided by PSP
Copyright © 2026 Digital Garage, Inc. All Rights Reserved
45
Multi-layered Business and Revenue Opportunities Related to Payments
• Stable platform generating consistent revenue, primarily from payment services
• Building multi-layered revenue streams through existing businesses, DX, Fintech, and Next-generation media
Acquiring
Members
Opening
Accounts
Payment partners
Platform
Solution
Payment platform
Business
Operators
(Merchants)
Financial Marketing
CRM Solutions
Commerce marketing
DX/cashless products
・Credit Cards
・e-money
・Bank
・QR payment
etc.
Joint development
of new services
Payment
Long-term
Incubation
B2B payment/cashflow
improvement
Next-generation media
DX
Cashless
Attracting
customers
Consumer
Payment
Companies
Financial
Institutions
Consumer behavior
data from awareness
to purchase
B2B transaction
Wholesalers
Manufacturers
Payment & purchasing
data
Copyright © 2026 Digital Garage, Inc. All Rights Reserved
46
The Structure of Credit Card Industry
International brands
Contract
Commission
Money
VISA/MASTER/AMEX/DINERS/JCB
Brand
membership
Commission
Acquire and manage merchants
Comprehensive
contract
Payment Service
Provider
(Multi-payment)
Advance
Payment
Payment
processing
contract
Merchant
Credit card member
Consumer
Acquirer
Advance
Payment
Credit card contract
Issue credit cards
Payment
Payment
Issuer
Brand
membership
Merchant contract (direct)
Commission
Payment
Ⅰ PS
Purchase goods & services
e-commerce &
store business
Copyright © 2026 Digital Garage, Inc. All Rights Reserved
47
DG’s role in the Credit Card Industry
Commission
Contract
Commission
International brands
Money
VISA/MASTER/AMEX/DINERS/JCB
Brand
membership
Payment
Credit card contract
Payment
Issue credit cards
Acquirer
Acquire and manage merchants
Commission
Membership
acquisition
CRM
Advance
payment
Payment service
provider
Marketing/
CRM solution
(Multi-payment)
Advance
payment
Credit card member
Representative
contract
Payment
Issuer
Marketing
Brand
membership
Marketing Solution
Consumer
Attracting
customers
PSP
contract
Merchant contract (direct)
Ⅰ PS
Merchant
E-commerce & store business
Purchase goods & services
Copyright © 2026 Digital Garage, Inc. All Rights Reserved
48
Reference Materials (3):
Cashflow Allocation / Shareholder Return
Copyright © 2026 Digital Garage, Inc. All Rights Reserved
49
Cashflow Allocation
PL
Profit before tax
in PS
Revenue
Cashflow
before tax
Expenses
Distributable cash
Use of cash
Corporate tax
Headquarter
costs
Capex in PS
Repayments of debt
+Depreciation
- Impairment/valuation
gains/losses
Base business
cashflow
Dividends from
subsidiary and affiliates
Investment
Business Income
・ Distribution income
・ from funds
・ Dividends Income
30+ bn JPY in 5 years
10+ bn JPY in 5 years
New business
development
Positive cashflow from new Business
will be added to the Distributable cash
Corporate tax etc.
in investment business
Costs for investment
business
・Proceeds from the sales
・ of securities
Shareholder returns
(progressive dividend)
Investment
business
cashflow
Additional
Shareholder returns
Startup investment
Strategic investment
M&A
Up to 30% of investment
business income
Finance
Debt, equity, asset sales, etc.
Copyright © 2026 Digital Garage, Inc. All Rights Reserved
50
Financial Strategy and KPIs for Investment Business
• Promote the sales of shares directly held by DG to generate investment EXIT income (proceeds from sales, etc.)
• Carefully select new investments, and plan for investing through funds for income purposes to diminish the balance
• Clarify the use of investment EXIT income and make strategic decisions on growth investment and additional returns, including new business development
Usage of Investment EXIT Cashflow
5Y Picture of Direct Investment and Income from Sales
70 B JPY
Investment in Growth
(New Business Development)
Make strategic decisions based on business
environment and opportunities
Operational
Investment
on
Balance
Sheet
Unrealized
Profit
Investment
Business CF
(Operating costs,
after tax)
Book Value
Investment
Business Income
30+ B JPY
(5Y Total)
End of FY23.3
Consider Additional
Shareholder Return
Reinvestment in Startups
and Managed Fund
Up to 30% of Investment Business
Income
Strategic Investments
(M&A・Capital alliance)
End of FY28.3
Copyright © 2026 Digital Garage, Inc. All Rights Reserved
51
Shareholder Return Policy
Policy
Stable
Dividends
Long-term stable dividends on a
progressive dividend basis
Accelerating
Dividend Increase
Increasing dividend growth rate by
launching new businesses
Additional
Return
Special dividends/share buybacks
based on portfolio sales progress
Distributable Resources
Base Business
Cashflow
Income from sales/distributions in
the investment business
Copyright © 2026 Digital Garage, Inc. All Rights Reserved
52
Shareholder Return Policy
• Dividend Policy: Progressive dividends based on PS cash flow plus additional dividends from new business cash flow
• Consider additional returns (including special dividends and share buybacks) from investment business cash flow as active options
Shareholder Return by Base Business CF
Shareholder Return Policy
Additional Return
from Investment CF
Additional dividends
from new businesses
(LTI)
10+ B JPY
Medium-term Plan
(New businesses)
Base Business CF
Stable dividends from CF from PS Segment
FY24.3
2nd Layer
1st layer
(PS)
Investment for growth or additional shareholder returns
will be determined, considering business environment
and investment opportunities
Aim to increase dividends by generating
cashflow through launch of strategic
businesses
Plan to pay progressive dividends from
cashflow of PS Segment, which is
expected as continuous profit growth
Dividend
payout
ratio
30%
FY28.3
Copyright © 2026 Digital Garage, Inc. All Rights Reserved
53
Reference Materials (4):
Sustainability Initiatives
Copyright © 2026 Digital Garage, Inc. All Rights Reserved
54
External Ratings and GPIF Index Inclusion
Driven by the progress of our sustainability initiatives, our scores from rating agencies continue to improve.
As a result, we have been selected as a constituent of multiple ESG indices adopted by the GPIF
(Government Pension Investment Fund)
Overall ESG Ratings
FTSE Russell
FTSE ESG score
3.4
Maximum score of 5.0
FY2026:3.4
↑
FY2025:1.7
Selected as a constituent of the FTSE JPX Blossom Japan Index
Adopted by the GPIF, this comprehensive index features companies demonstrating strong Environmental, Social,
and Governance (ESG) practices based on FTSE Russell ratings. Built on the FTSE4Good Index Series, it utilizes an
absolute scoring methodology that heavily weights the depth and transparency of a company's ESG reporting
Selected as a constituent of the FTSE JPX Blossom Japan Sector Relative Index
An ESG index adopted by the GPIF. It uses a sector-neutral approach to select top ESG performers within each
sector. In the interest of accelerating decarbonization, companies in carbon-intensive sectors are only eligible for
inclusion if they demonstrate tangible progress on the TPI Management Quality Score
CDP
Climate change
CDP Climate
Change Score
B
About CDP
One of the world's largest environmental disclosure platforms,
operated by a U.K. NGO.
A score of 'B' ranks third highest on its 8-level scale
CDP 8 -Level Evaluation
A,A−
Leadership
Implementing best practices
B,B−
Management
Executing policies & strategies
Execute policies & strategies
C,C−
Awareness
Understanding risks & impacts
2023: D⇒2024: B−⇒2025: B
D,D−
Disclosure
Environmental Disclosures
Management Level
S&P Global
S&P Global CSA Score
34
FY2025:34
↑
FY2024:30
↑
FY2023:21
Overall ESG Ratings
Selected as a constituent of the
S&P/JPX Carbon Efficient Index
Adopted by the GPIF, the S&P/JPX Carbon Efficient
Index is an environmental-themed ESG benchmark
jointly developed by S&P Dow Jones Indices and
JPX. Using TOPIX as its universe, the index weights
constituents based on their environmental
disclosures and carbon efficiency, measured by
emissions per unit of revenue.
*Note: The S&P CSA Overall Score is a corporate sustainability assessment based
on questionnaire responses. It is a completely separate metric from inclusion in
the S&P/JPX Carbon Efficient Index, which is determined strictly by a company's
carbon efficiency and environmental disclosures within TOPIX
Copyright © 2026 Digital Garage, Inc. All Rights Reserved
55
Please note that the business forecasts and strategies covered in today’s presentation are based on our current evaluation and future results may vary significantly depending on unforeseeable
events or circumstances. This announcement is solely for the purpose of the investors relationship and is not for making any solicitation for investment in any securities. This announcement does
not constitute an offer to sell or the solicitation of an offer to buy any securities in the United States or any other jurisdiction in which such offer, solicitation or sale would be unlawful prior to
registration or qualification under the securities laws of any such jurisdiction. Any securities of our consolidated subsidiaries have not been registered under the U.S. Securities Act of 1933, as
amended (the “U.S. Securities Act”) and may not be offered or sold in the United States absent registration or an applicable exemption from the registration requirements of the U.S. Securities Act.
Any public offering of securities to be made in the United States will be made by means of a prospectus. Such prospectus will contain detailed information about the company making the offer and
its management and financial statements.