|
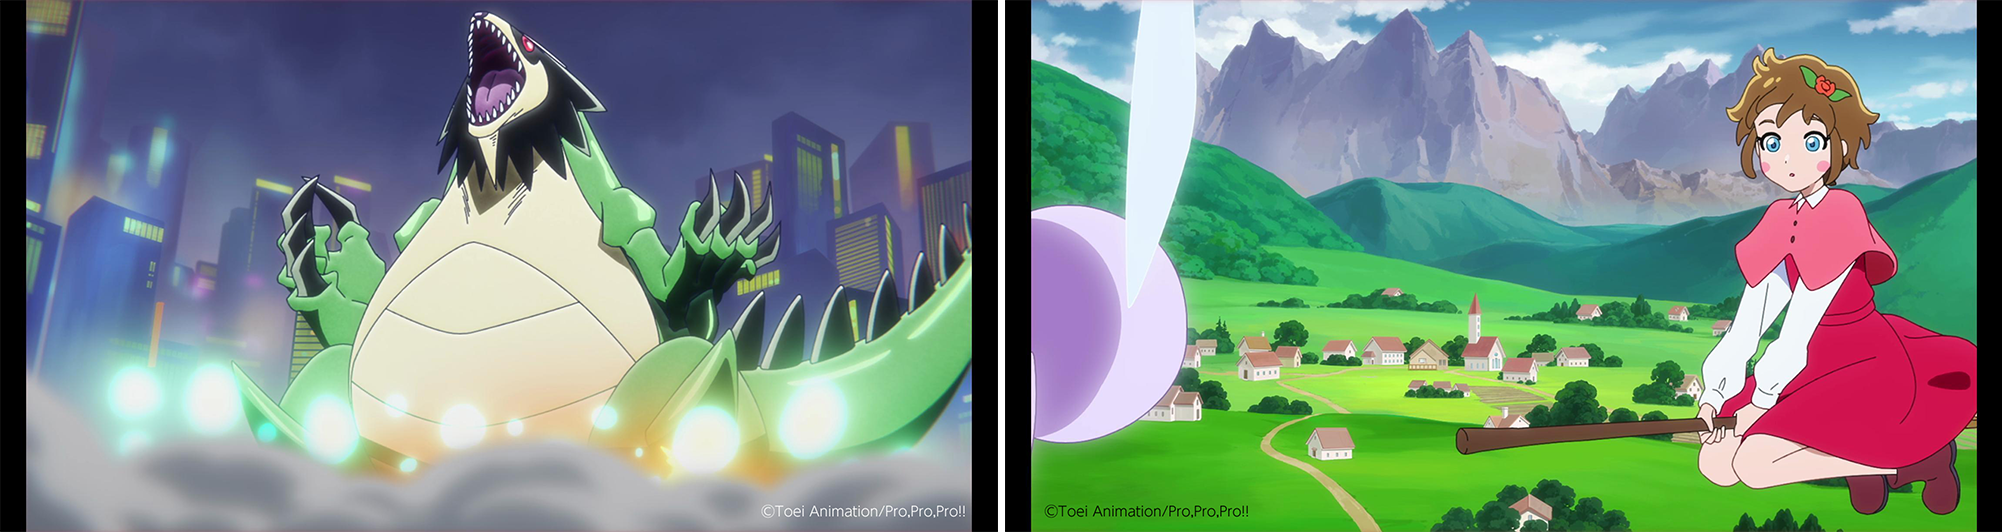
Toei Animation Co., Ltd. is a Japanese animation studio that plans, produces, and sells animated works for theatrical and television release. The company operates three main business segments: video production and sales, licensing, and merchandise sales. Its video production segment involves creating anime series and films, primarily based on manga originals, and selling broadcasting rights domestically and internationally. The licensing segment generates revenue by granting usage rights for its characters to toy, game, stationery, and apparel manufacturers. The merchandise segment involves the direct sale of character goods. The company also operates event businesses, including mascot shows and musicals. Notable titles in its extensive library include Dragon Ball, One Piece, Sailor Moon, Digimon Adventure, GeGeGe no Kitaro, and Mazinger Z. The company maintains a portfolio of over 14,000 content titles, including more than 200 television series and 270 theatrical films. Key subsidiaries involved in overseas distribution and licensing include Toei Animation Enterprises Ltd., Toei Animation Incorporated, and Toei Animation Europe S.A.S. Domestic distribution and video sales are supported by partners such as Toei Company and Toei Video. Summarised from the annual report, fiscal year ended Mar 2026 |
Industry Entertainment | Homepage toei-anim.co.jp |
| Sector Communication Services | IR page toei-anim.co.jp | |
|
Tags
anime production, character licensing, merchandise sales, broadcasting rights, theatrical animation, television animation, manga adaptation, event management, Dragon Ball, One Piece, Sailor Moon, Digimon Adventure, GeGeGe no Kitaro, Mazinger Z, Devilman, Babel II, Cutey Honey, Getter Robo, UFO Robo Grendizer, Ikkyu-san, Captain Harlock, Galaxy Express 999, Dr. Slump, Kinnikuman, Fist of the North Star, Maple Town Story, Saint Seiya, Bikkuriman, Akuma-kun, Dragon Quest: Dai no Daibouken, Slam Dunk, Marmalade Boy, Hell Teacher Nube, Hana Yori Dango, Cutey Honey F, Kindaichi Shounen no Jikenbo, Yume no Kureyon Oukoku, Ojamajo Doremi, Tomorrow's Najica, Golden Gash Bell, Bobobo-bo Bo-bobo, Futari wa Pretty Cure, Bouken Ou Beet, Powerpuff Girls Z, Mononoke, Hakaba Kitaro, Uchi no 3 Shimai, Dragon Ball Kai, Kaidan Restaurant, Digimon Xros Wars, Toriko, Saint Seiya Omega, Tantei DriLand, Keisou Giga, Mazinkaiser, Sailor Moon Crystal, World Trigger, Dragon Ball Super, Digimon Universe Appmonsters, Tiger Mask W, Seikai Suru Kado, Oshiri Tantei, Bakuchou Bar Hunter, Fushigi Dagashiya Sentendou, Digimon Beatbreak, Meitantei Precure, Toei Animation Enterprises Ltd., Toei Animation Incorporated
|
Press page toei-anim.co.jp/news |
Metrics
| Valuation | |
|---|---|
| Market cap | ¥ 625.59B |
| Market cap (USD) | $ 3.91B |
| P/E | 25.37 |
| PEG | 4.06 |
| P/BV | 3.55 |
| P/S | 6.56 |
| P/OCF | 38.23 |
| P/FCF | 41.30 |
| Dividend yield | 1.5% |
| Turnover / mcap | — |
| Returns | |
|---|---|
| ROE | 15.5% |
| ROI | 14.7% |
| ROIC | 13.3% |
| Profit margin | 26.8% |
| Growth | |
|---|---|
| Revenue growing | No |
| Profits growing | Yes |
| Revenue up 3y | No |
| Revenue up 5y | No |
| Earnings growth 3y (net profit CAGR) | 6.3% |
| Quality | |
|---|---|
| Profitable | Yes |
| Margin expanding | Yes |
| Buying back stock | No |
| Diluting (TTM) | No |
| Debt/Equity | — |
| Podcast bulls (TTM) | Sign up |
| Podcast bears (TTM) | Sign up |
| Podcast sentiment (TTM) | Sign up |
| Podcast sentiment % (TTM) | Sign up |
| News sentiment (TTM) | 23 |
| Quality score | 0% |
| Insiders | |
|---|---|
| Buys, 1w | Sign up |
| Buys, 1m | Sign up |
| Buys, 1y | Sign up |
| Sells, 1w | Sign up |
| Sells, 1m | Sign up |
| Sells, 1y | Sign up |
Sign up to see this company's insider trades
| Figure | FY 2026 | FY 2025 | FY 2024 | FY 2023 | FY 2022 | FY 2021 | FY 2020 | FY 2019 | FY 2018 | FY 2017 | FY 2016 | FY 2015 | FY 2014 | FY 2013 |
|---|---|---|---|---|---|---|---|---|---|---|---|---|---|---|
| Revenue | 93.669B | 100.836B | 88.654B | 87.457B | 57.02B | 51.595B | 54.819B | 55.701B | 45.992B | 40.747B | 33.612B | 30.313B | 31.028B | 33.645B |
| Net profit | 25.07B | 23.623B | 18.795B | 20.9B | 12.82B | 11.067B | 11.437B | 11.375B | 7.848B | 7.204B | 5.145B | 2.437B | 2.334B | 3.29B |
| Free cash flow | 15.786B | 26.071B | 15.662B | 14.342B | 14.552B | 7.71B | 10.333B | 9.914B | 6.547B | 6.428B | 4.497B | — | — | — |
| Figure | FY 2026 | FY 2025 | FY 2024 | FY 2023 | FY 2022 | FY 2021 | FY 2020 | FY 2019 | FY 2018 | FY 2017 | FY 2016 | FY 2015 | FY 2014 | FY 2013 |
|---|---|---|---|---|---|---|---|---|---|---|---|---|---|---|
| Share price | 2.595K | 3.1K | 3.1K | 13.16K | 10.169K | 11.851K | 5.05K | 5.46K | 3.505K | 6.659K | 1.676K | 1.183K | 866.77 | 2.252K |
| Price performance 12m | -0.16 | 0 | -0.76 | 0.29 | -0.14 | 1.35 | -0.08 | 0.56 | -0.47 | 2.97 | 0.42 | 0.37 | -0.62 | — |
Filed figures
Lines the statements and their notes report beside the headline figures, read from the filings' XBRL as filed (no restatement applied), with figures computed from one filing's own lines. Cash-flow lines carry their cash direction: an outflow is negative. Each period links to its filing; a figure's period, report date and tag are in its tooltip.
| Figure | Mar 2017 | Mar 2018 | Mar 2019 | Mar 2020 | Mar 2021 | Mar 2022 | Mar 2023 | Mar 2024 | Mar 2025 | Mar 2026 |
|---|---|---|---|---|---|---|---|---|---|---|
| Balance sheet detail | ||||||||||
| Trade receivables (JPY) | 7.8B | 9.12B | 13.1B | 10.6B | 12.8B | 29.3B | 49.9B | 48B | 58.8B | 53.9B |
| ↳ YoY growth | +23.3% | +16.9% | +43.4% | -18.8% | +20.4% | +129.2% | +70.4% | -3.9% | +22.3% | -8.3% |
| ↳ 5y CAGR | +15.1% | +30.3% | +40.5% | +29.7% | +40.8% | +33.3% | ||||
| Cash and deposits (JPY) | 25.6B | 28.5B | 34.5B | 40B | 43B | 60.1B | 66.9B | 79B | 82.5B | 92.7B |
| Intangible assets (JPY) | 339M | 498M | 466M | 454M | 527M | 633M | 1.18B | 1.32B | 1.28B | 1.44B |
| Cash flow detail | ||||||||||
| Operating cash flow (JPY) | 8.53B | 10.1B | 10.5B | 10.6B | 8.05B | 15.1B | 15.3B | 16.3B | 27.2B | 17B |
| Purchases of property, plant and equipment (JPY) | -1.97B | -3.59B | -454M | -107M | -77M | -307M | -196M | -181M | -703M | -778M |
| Purchases of intangible assets (JPY) | -138M | -433M | -140M | -124M | -263M | -208M | -722M | -441M | -389M | -386M |
| Change in receivables (cash effect) (JPY) | -1.69B | -1.19B | -4.07B | 2.41B | -2.22B | -1.52B | -9.73B | 1.62B | -4.58B | 2.84B |
| Change in inventories (cash effect) (JPY) | -322M | -7.56M | -1.57B | -2.27B | -2.07B | -5.37B | -16M | 3.15B | -263M | -3.29B |
| Change in payables (cash effect) (JPY) | 1.68B | 2.89B | 1.2B | -1.77B | 1.51B | 8.41B | 1.38B | -3.23B | 767M | -5.06B |
| Dividends paid (cash effect) (JPY) | -1.31B | -1.79B | -1.99B | -2.89B | -2.89B | -2.89B | -3.88B | -6.39B | -6.39B | -8.46B |
| Share buybacks (cash effect) (JPY) | -237,000 | -489,000 | 0.00 | -150M | -1M | 0.00 | -133M | -1M | 0.00 | -651M |
| Interest paid (cash effect) (JPY) | -291,000 | -198,000 | 0.00 | -20M | -45M | -2M | -18M | 0.00 | 0.00 | 0.00 |
| Income taxes paid (cash effect) (JPY) | -3.2B | -3.86B | -3.94B | -5.18B | -4.95B | -5.64B | -6.73B | -10.6B | -6.41B | -10.7B |
| Operating cash flow before change in receivables (JPY) | 10.2B | 11.3B | 14.6B | 8.16B | 10.3B | 16.6B | 25B | 14.7B | 31.7B | 14.1B |
| Free cash flow (OCF - PPE - intangibles) (JPY) | 6.43B | 6.11B | 9.91B | 10.3B | 7.71B | 14.6B | 14.3B | 15.7B | 26.1B | 15.8B |
| Income detail | ||||||||||
| Total comprehensive income (JPY) | 7.48B | 8.26B | 11.1B | 10.5B | 13.3B | 13.8B | 22.4B | 23.5B | 27.8B | 26.9B |
| Comprehensive income to owners (JPY) | 7.48B | 8.26B | 11.1B | 10.5B | 13.3B | 13.8B | 22.4B | 23.5B | 27.8B | 26.9B |
| Provision for credit losses (JPY) | -36.3M | 11.9M | 66M | 45M | -7M | -18M | 4M | 41M | 120M | 73M |
| Credit cost ratio (credit losses / average receivables) (%) | 0.5% | 0.1% | 0.6% | 0.4% | 0.1% | 0.1% | 0.0% | 0.1% | 0.2% | 0.1% |
| Reported | Jun 29, 2017 | Jun 28, 2018 | Jun 26, 2019 | Jun 25, 2020 | Jun 28, 2021 | Jun 27, 2022 | Jun 26, 2023 | Jun 26, 2024 | Jun 20, 2025 | Jun 19, 2026 |
Sign up to see institutional holdings
Sign UpPodcast Mentions
Sign up to see podcast mentions and sentiment
Sign UpTimely disclosures published on TDnet, newest first, titles as filed in Japanese. The link opens the disclosure on TDnet. Filings with EDINET (periodic reports, extraordinary reports, offerings, holding and buy-back reports), newest first, titles as filed in Japanese. The link opens the filing on EDINET. Press releases from the company's own website, newest first.
2027年3月期
第2四半期(中間期)決算短信〔日本基準〕(連結)
2026年10月30日 上場会社名 東映アニメーション株式会社 上場取引所 東 コ ー ド 番号 4816 URL https://www.toei-anim.co.jp/ 代 表 者 (役職名) 代表取締役社長 (氏名) 高木勝裕 問合せ先責任者 (役職名) 取締役 (氏名) 布施稔 (TEL) 03-5318-0639 半期報告書提出予定日 2026年11月13日 配当支払開始予定日 - 決算補足説明資料作成の有無 :有 決算説明会開催の有無 : 有 (証券アナリスト・機関投資家・マスコミ向け) (百万円未満切捨て)
1.2027年3月期第2四半期(中間期)の連結業績(2026年4月1日~2026年9月30日) (1)連結経営成績(累計) (%表示は、対前年中間期増減率) 売上高
営業利益
百万円
%
親会社株主に帰属 する中間純利益
経常利益
百万円
%
百万円
%
百万円
2027年3月期中間期 46,612 3.7 15,161 △8.9 16,182 △9.6 11,893 2026年3月期中間期 44,954 △8.2 16,638 △2.1 17,904 4.7 12,980 8.9%) (注) 包括利益 2027年3月期中間期 14,656百万円( 2026年3月期中間期 13,462百万円( 潜在株式調整後 1株当たり 1株当たり 中間純利益 中間純利益 円
2027年3月期中間期 2026年3月期中間期
銭
円
58.23 63.49
%
△8.4 6.2 5.0%)
銭
- -
(2)連結財政状態 総資産
純資産 百万円
自己資本比率 百万円
2027年3月期中間期 208,772 2026年3月期 202,271 (参考) 自己資本 2027年3月期中間期 176,191百万円
%
176,191 84.4 171,039 84.6 2026年3月期 171,039百万円
2.配当の状況 年間配当金 第1四半期末第2四半期末第3四半期末 円
銭
円
銭
円
2026年3月期 - 0.00 2027年3月期 - 0.00 2027年3月期(予想) (注) 直近に公表されている配当予想からの修正の有無 : 無
期末
合計
銭
円
-
44.00
銭
44.00
円
銭
-
44.00
44.00
3.2027年3月期の連結業績予想(2026年4月1日~2027年3月31日) 売上高 百万円
営業利益 %
百万円
(%表示は、対前期増減率) 親会社株主に帰属 1株当たり する当期純利益 当期純利益
経常利益 %
通期 98,200 4.8 26,400 △14.9 (注) 直近に公表されている業績予想からの修正の有無 : 無
百万円
%
27,700 △17.2
%
円銭
20,000 △20.2
百万円
97.94
※ 注記事項 (1)当中間期における連結範囲の重要な変更 新規
―社 (社名) ―
:無 、除外
―社 (社名) ―
(2)中間連結財務諸表の作成に特有の会計処理の適用
:無
(3)会計方針の変更・会計上の見積りの変更・修正再表示 ① 会計基準等の改正に伴う会計方針の変更
:無
②
①以外の会計方針の変更
:無
③
会計上の見積りの変更
:無
④
修正再表示
:無
(4)発行済株式数(普通株式) ① 期末発行済株式数(自己株式を含む)
2027年3月期中間期
210,000,000株 2026年3月期
210,000,000株
5,855,434株 2026年3月期
5,687,029株
②
期末自己株式数
2027年3月期中間期
③
期中平均株式数(中間期)
2027年3月期中間期
204,265,523株 2026年3月期中間期
204,440,248株
(注)当社は、役員報酬BIP信託及び株式付与ESOP信託を導入しており、当該信託が保有する当社株式を期末自己株式 数及び期中平均株式数の算定上控除する自己株式数に含めております。
※ ※
第2四半期(中間期)決算短信は公認会計士又は監査法人のレビューの対象外です 業績予想の適切な利用に関する説明、その他特記事項 本資料に記載されている業績見通し等の将来に関する記述は、当社グループが本資料の発表日現在において入手 可能な情報から得られた判断に基づいており、リスク及び不確実性を包含しております。業績予想の前提となる仮 定及び業績予想のご利用に当たっての注意事項については、添付資料P.3「1.経営成績等の概況(3)連結業績 予想などの将来予測情報に関する説明」をご覧ください。
東映アニメーション株式会社(4816) 2027年3月期第2四半期(中間期)決算短信
○添付資料の目次 1.経営成績等の概況 ………………………………………………………………………………………………2 (1)当中間連結会計期間の経営成績の概況 …………………………………………………………………2 (2)当中間連結会計期間の財政状態の概況 …………………………………………………………………3 (3)連結業績予想などの将来予測情報に関する説明 ………………………………………………………3 (4)利益配分に関する基本方針 ………………………………………………………………………………3 2.中間連結財務諸表及び主な注記 ………………………………………………………………………………4 (1)中間連結貸借対照表 ………………………………………………………………………………………4 (2)中間連結損益計算書及び中間連結包括利益計算書 ……………………………………………………5 (3)中間連結財務諸表に関する注記事項 ……………………………………………………………………7 (株主資本の金額に著しい変動があった場合の注記) ……………………………………………………7 (継続企業の前提に関する注記) ……………………………………………………………………………7
1
東映アニメーション株式会社(4816) 2027年3月期第2四半期(中間期)決算短信
1.経営成績等の概況 (1)当中間連結会計期間の経営成績の概況 当中間連結会計期間において、当社グループでは「ワンピース」、「ドラゴンボール」シリーズ、「プリキュ ア」シリーズ、「デジモンアドベンチャー」シリーズといった主力作品群からの安定的な収益の確保・拡大を図り ました。 この結果、当中間連結会計期間における売上高は466億12百万円(前年同期比3.7%増)、営業利益は151億61百万 円(同8.9%減)、経常利益は161億82百万円(同9.6%減)、親会社株主に帰属する中間純利益は118億93百万円 (同8.4%減)となりました。 セグメントごとの経営成績は次のとおりであります(セグメント間取引金額を含む)。 なお、セグメント損益は、営業利益ベースの数値であります。 ①映像製作・販売事業 劇場アニメ部門では、9月に公開した「映画名探偵プリキュア!不思議な庭と2人の秘密」が好調に稼働し、増 収となりました。 テレビアニメ部門では、「ワンピース」、「DIGIMON BEATBREAK」、「名探偵プリキュア!」、「おしりたんて い」、「ふしぎ駄菓子屋銭天堂」の5作品を放送しました。前年同期と比較して新作の放送話数が増加したこと に加え、ゲーム向け音声製作が好調に稼働し、増収となりました。 コンテンツ部門では、前年同期好調に推移した「ガールズバンドクライ」のブルーレイ・DVDの反動減により、 減収となりました。 海外映像部門では、「ワンピース」、「ドラゴンボール」シリーズを中心に、北米・欧州における配信権販売 が好調に推移したものの、アジアにおける一部配信権販売の定例契約更新・見直しの影響により、減収となりま した。 その他部門では、「ドラゴンボール」シリーズの国内の配信権販売が好調に稼働し、増収となりました。 この結果、映像製作・販売事業全体では、売上高は152億40百万円(前年同期比4.9%減)、セグメント利益は 44億25百万円(同32.0%減)と減収減益となりました。 ②版権事業 国内版権部門では、「ドラゴンボール」シリーズ、「ワンピース」のゲーム化権販売が前年同期の勢いには至 らなかったこと等から、減収となりました。 海外版権部門では、「ワンピース」の商品化権販売、「デジモンアドベンチャー」シリーズの商品化権販売及 びゲーム化権販売が好調に稼働し、大幅な増収となりました。 この結果、版権事業全体では、売上高は250億83百万円(前年同期比6.0%増)、セグメント利益は130億13百万 円(同0.3%増)と増収増益となりました。 ③商品販売事業 商品販売部門では、「ドラゴンボール」シリーズのショップ事業が増収に寄与したことに加え、「プリキュ ア」シリーズのEC事業が好調に推移し、増収となりました。 この結果、売上高は44億56百万円(前年同期比24.0%増)、セグメント利益は3億61百万円(同9.5%増)と増 収増益となりました。 ④その他事業 その他部門では、催事イベントやキャラクターショー等を展開しました。「プリキュア」シリーズ、「ワンピ ース」、「ワールドトリガー」の催事が好調に稼働したこと等から、増収となりました。 この結果、売上高は21億68百万円(前年同期比15.4%増)、セグメント利益は2億31百万円(同274.5%増)と 増収増益となりました。
2
東映アニメーション株式会社(4816) 2027年3月期第2四半期(中間期)決算短信
(2)当中間連結会計期間の財政状態の概況 (資産) 流動資産は、前連結会計年度末に比べて4.6%増加し、1,418億17百万円となりました。これは、現金及び預金 が42億86百万円、仕掛品が24億15百万円、流動資産のその他が10億86百万円それぞれ増加し、受取手形及び売掛 金が18億38百万円減少したこと等によるものです。 固定資産は、前連結会計年度末に比べて0.4%増加し、669億54百万円となりました。これは、有形固定資産が 4億10百万円、投資有価証券が29億8百万円それぞれ増加し、投資その他の資産の長期預金が30億円減少したこ と等によるものです。 この結果、総資産は、前連結会計年度末に比べて3.2%増加し、2,087億72百万円となりました。 (負債) 流動負債は、前連結会計年度末に比べて2.8%増加し、272億44百万円となりました。これは、未払法人税等が 18億1百万円、流動負債のその他が2億54百万円それぞれ増加し、買掛金が14億68百万円減少したこと等による ものです。 固定負債は、前連結会計年度末に比べて13.0%増加し、53億36百万円となりました。これは、固定負債のその 他が5億71百万円増加したこと等によるものです。 この結果、負債合計は、前連結会計年度末に比べて4.3%増加し、325億80百万円となりました。 (純資産) 純資産合計は、前連結会計年度末に比べて3.0%増加し、1,761億91百万円となりました。これは、利益剰余金 が28億89百万円、その他有価証券評価差額金が16億42百万円、為替換算調整勘定が11億24百万円それぞれ増加し たこと等に加え、「株式付与ESOP信託」の導入に伴い、自己株式が5億円増加したことによるものです。
(3)連結業績予想などの将来予測情報に関する説明 2027年3月期の連結業績予想につきましては、現時点では2026年10月28日に公表いたしました業績予想から の変更はありません。 なお、実際の業績は、当社グループの事業を取り巻く経済環境、市場動向、為替レートの変動等様々な要因 により、記述されている業績見通しとは大きく異なる結果となり得ることをご承知おきください。
(4)利益配分に関する基本方針 当社では、財務の健全性、戦略投資、株主還元のバランスを取り、堅牢な財務基盤の下、高い資本効率(ROE) を維持しつつ、1株当たり利益(EPS)を飛躍的に高め、持続的成長と中長期的な企業価値向上を実現することを 財務戦略の基本方針として掲げています。 足元では、堅牢な財務基盤は確保出来ており、戦略投資・株主還元へより重点配分致します。株主還元面で は、過去配当総額を下限とした安定配当を基本とし、投資戦略や業績動向に応じて柔軟に、総合的な判断を行 って参ります。 なお中期経営計画「VISION2030」においては、中計期間(2027年3月期~2031年3月期)を通じた財務KPIと して、配当性向40%以上、最終年度の財務KPIとして、総還元性向50%目途、としています。
3
東映アニメーション株式会社(4816) 2027年3月期第2四半期(中間期)決算短信
2.中間連結財務諸表及び主な注記 (1)中間連結貸借対照表 (単位:百万円) 前連結会計年度 (2026年3月31日) 資産の部 流動資産 現金及び預金 受取手形及び売掛金 有価証券 商品及び製品 仕掛品 原材料及び貯蔵品 その他 貸倒引当金 流動資産合計 固定資産 有形固定資産 無形固定資産 投資その他の資産 投資有価証券 長期預金 その他 貸倒引当金 投資その他の資産合計 固定資産合計 資産合計 負債の部 流動負債 買掛金 未払法人税等 賞与引当金 その他 流動負債合計 固定負債 役員株式給付引当金 退職給付に係る負債 その他 固定負債合計 負債合計 純資産の部 株主資本 資本金 資本剰余金 利益剰余金 自己株式 株主資本合計 その他の包括利益累計額 その他有価証券評価差額金 繰延ヘッジ損益 為替換算調整勘定 その他の包括利益累計額合計 純資産合計 負債純資産合計
4
当中間連結会計期間 (2026年9月30日)
92,748 26,931 181 1,788 11,375 142 2,484 △85 135,566
97,035 25,093 247 1,990 13,791 149 3,571 △61 141,817
8,776 1,435
9,186 1,417
22,902 31,300 2,433 △142 56,493 66,704 202,271
25,811 28,300 2,357 △118 56,350 66,954 208,772
17,359 2,843 672 5,633 26,510
15,891 4,645 819 5,888 27,244
314 162 4,244 4,721 31,231
352 168 4,816 5,336 32,580
2,867 3,409 149,710 △1,406 154,581
2,867 3,409 152,599 △1,906 156,970
9,002 △2 7,457 16,458 171,039 202,271
10,645 △7 8,582 19,220 176,191 208,772
東映アニメーション株式会社(4816) 2027年3月期第2四半期(中間期)決算短信
(2)中間連結損益計算書及び中間連結包括利益計算書 中間連結損益計算書
売上高 売上原価 売上総利益 販売費及び一般管理費 営業利益 営業外収益 受取利息 受取配当金 持分法による投資利益 為替差益 その他 営業外収益合計 営業外費用 支払利息 持分法による投資損失 子会社清算損 その他 営業外費用合計 経常利益 特別利益 投資有価証券売却益 特別利益合計 特別損失 減損損失 特別損失合計 税金等調整前中間純利益 法人税、住民税及び事業税 法人税等調整額 法人税等合計 中間純利益 親会社株主に帰属する中間純利益
前中間連結会計期間 (自 2025年4月1日 至 2025年9月30日) 44,954 20,136 24,817 8,179 16,638
(単位:百万円) 当中間連結会計期間 (自 2026年4月1日 至 2026年9月30日) 46,612 21,409 25,203 10,042 15,161
481 201 49 438 100 1,271
480 292 - 263 65 1,101
0 - - 5 5 17,904
0 46 26 7 80 16,182
376 376
- -
25 25 18,254 5,219 54 5,274 12,980 12,980
- - 16,182 4,604 △316 4,288 11,893 11,893
5
東映アニメーション株式会社(4816) 2027年3月期第2四半期(中間期)決算短信 中間連結包括利益計算書
中間純利益 その他の包括利益 その他有価証券評価差額金 繰延ヘッジ損益 為替換算調整勘定 持分法適用会社に対する持分相当額 その他の包括利益合計 中間包括利益 (内訳) 親会社株主に係る中間包括利益 非支配株主に係る中間包括利益
前中間連結会計期間 (自 2025年4月1日 至 2025年9月30日) 12,980
(単位:百万円) 当中間連結会計期間 (自 2026年4月1日 至 2026年9月30日) 11,893
1,690 △2 △1,371 164 482 13,462
1,707 △4 1,124 △64 2,762 14,656
13,462 -
14,656 -
6
東映アニメーション株式会社(4816) 2027年3月期第2四半期(中間期)決算短信
(3)中間連結財務諸表に関する注記事項 (株主資本の金額に著しい変動があった場合の注記) 該当事項はありません。 (継続企業の前提に関する注記) 該当事項はありません。
7
東映アニメーション株式会社 計数資料 2027年3月期第2四半期決算(2026/4~2026/9)
2026年10月30日
TOEI ANIMATION CO., LTD. Data Sheets The Second Quarter Period of FY 2027.3(Apr. 1, 2026 to Sep. 30, 2026)
●連結業績推移/Consolidated Operating Results 【第2四半期/2nd Quarter 】 営業利益/経常利益/四半期純利益/ 1株当たり四半期純利益
部門別売上高/売上総利益率 Net Sales/Gross Profit Margin
Operating Profit/Ordinary Profit/Net Profit/ Net Profit per Share
その他事業/Others 商品販売事業/Sales of Goods 版権事業/Licensing 映像製作・販売事業/Film 売上総利益率/Gross Profit Margin
営業利益/Operating Profit 経常利益/Ordinary Profit 四半期純利益/Net Profit 1株当たり四半期純利益/Net Profit per Share (円/¥)
(%)
(百万円/ ¥ Million)
50,000
100
20,000
100
40,000
80
16,000
80
30,000
60
12,000
60
20,000
40
8,000
40
10,000
20
4,000
20
0
0
(百万円/ ¥Million)
0
'23/3 2Q
'24/3 2Q
'25/3 2Q
'26/3 2Q
'27/3 2Q
'23/3 2Q
'24/3 2Q
'25/3 2Q
'26/3 2Q
'27/3 2Q
0
百万円/¥Million
第2四半期/2nd Quarter 売上高/Net Sales 映像製作・販売事業/Film 版権事業/Licensing 商品販売事業/Sales of Goods その他事業/Others
’23/3 2Q
セグメント比率(%)[映像/版権/商品販売/その他] /Share [Film/Licensing/Sales of Goods/Others]
内部売上消去/Intra-company Sales 売上原価率(%)/Cost of Sales to Net Sales(%) 売上総利益率(%)/Gross Profit Margin(%) 営業利益/Operating Profit 経常利益/Ordinary Profit 四半期純利益/Net Profit 1株当たり四半期純利益(円)/Net Profit per Share(¥) 注: Notes:
2
’24/3 2Q
’25/3 2Q
’26/3 2Q
‘27/3 2Q
増減%
42,450
46,184
48,964
44,954
46,612
3.7
19,847
19,112
20,653
16,022
15,240
△ 4.9
20,432
19,262
22,217
23,660
25,083
6.0
1,516
6,589
4,708
3,595
4,456
24.0
774
1,482
1,703
1,878
2,168
15.4
47/48/3/2
41/42/14/3
42/45/10/3
36/52/8/4
32/53/10/5
121
261
318
201
337
54.5
61.1
50.4
44.8
45.9
45.5
38.9
49.6
55.2
54.1
14,194
11,365
16,993
16,638
15,161
△ 8.9
15,524
13,857
17,099
17,904
16,182
△ 9.6
11,521
10,240
12,219
12,980
11,893
△ 8.4
56.35
50.09
59.75
63.49
58.23
△ 8.3
当社は、2024 年4月1日付で普通株式1株につき5株の株式分割を行っております。2021 年3 月期の期首に当該株式分割が 行われたものと仮定して、「1株当たり当期純利益(1株当たり純資産)」を算定しております。 The Company implemented a five-for-one split of its common stock on April 1, 2024. The net Profit per share (net assets per share) have been calculated by assuming that this stock split was carried out at the beginning of the fiscal year ended March 31, 2021.
【通期/Fiscal Year 】 ●連結業績推移/Consolidated Operating Results 営業利益/経常利益/当期純利益/ 1株当たり当期純利益
部門別売上高/売上総利益率 Net Sales/ Gross Profit Margin
Operating Profit/Ordinary Profit/Net Profit/ Net Profit per Share
その他事業/Others 商品販売事業/Sales of Goods 版権事業/Licensing 映像製作・販売事業/Film 売上総利益率/Gross Profit Margin
(百万円/ ¥Million)
営業利益/Operating Profit 経常利益/Ordinary Profit 当期純利益/Net Profit (%)
100
120,000
1株当たり当期純利益/Net Profit per Share
(百万円/ ¥ Million)
100,000 75 80,000
(円/¥)
35,000
140
30,000
120
25,000
100
20,000
80
15,000
60
10,000
40
5,000
20
50
60,000
40,000 25 20,000
0
'22/3
'23/3
'24/3
'25/3
'26/3
0
0
'22/3
'23/3
'24/3
'25/3
0
'26/3
百万円/¥Million
決算期/Fiscal Year Ended 売上高/Net Sales 映像製作・販売事業/Film 版権事業/Licensing 商品販売事業/Sales of Goods その他事業/Others セグメント比率(%)[映像/版権/商品販売/その他] /Share [Film/Licensing/Sales of Goods/Others]
内部売上消去/Intra-company Sales 売上原価率(%)/Cost of Sales to Net Sales(%) 売上総利益率(%)/Gross Profit Margin(%) 営業利益/Operating Profit 経常利益/Ordinary Profit 当期純利益/Net Profit 1株当たり当期純利益(円)/Net Profit per Share(¥) 注: Notes:
2022/3
2023/3
2024/3
2025/3
2026/3
増減%
57,020
87,457
88,654
100,836
93,669
20,769
37,267
34,828
37,323
31,151 △ 16.5
32,995
42,060
39,671
50,582
48,905
2,231
6,149
10,681
9,211
7,923 △ 14.0
1,104
2,216
3,922
4,315
6,325
46.6
42/48/7/3 39/45/12/4
37/50/9/4
33/52/8/7
36/58/4/2
△ 7.1 △ 3.3
80
237
449
597
636
53.2
53.2
57.8
52.0
47.5
46.8
46.8
42.2
48.0
52.5
18,107
28,669
23,364
32,432
31,018
△ 4.4
18,822
29,791
26,453
33,188
33,462
0.8
12,820
20,900
18,795
23,623
25,070
6.1
62.69
102.22
91.93
115.52
122.67
6.2
当社は、2024 年4月1日付で普通株式1株につき5株の株式分割を行っております。2022 年3 月期の期首に当該株式分割が 行われたものと仮定して、「1株当たり当期純利益(1株当たり純資産)」を算定しております。 The Company implemented a five-for-one split of its common stock on April 1, 2024. The net Profit per share (net assets per share) have been calculated by assuming that this stock split was carried out at the beginning of the fiscal year ended March 31, 2022.
3
●連結セグメント別業績推移①/Consolidated Results by Segment 【第2四半期/2nd Quarter 】
(百万円/ ¥Million)
映像製作・販売事業
版権事業
商品販売事業・その他事業
Film
Licensing
Sales of Goods / Others
その他/Others 海外映像/Overseas Film コンテンツ事業/Contents テレビアニメ/TVs 劇場アニメ/Movies
海外版権/Overseas Licensing
その他/Others
国内版権/Domestic Licensing
(百万円/ ¥Million)
27,000
27,000
27,000
24,000
24,000
24,000
21,000
21,000
21,000
18,000
18,000
18,000
15,000
15,000
15,000
12,000
12,000
12,000
9,000
9,000
9,000
6,000
6,000
6,000
3,000
3,000
3,000
0
'23/3 2Q
'24/3 2Q
'25/3 2Q
'26/3 2Q
'27/3 2Q
nd Quarter
0
'23/3 2Q
第2四半期/2 売上高/Net Sales 映像製作・販売事業/Film 劇場アニメ/Movies テレビアニメ/TVs コンテンツ事業/Contents 海外映像/Overseas Film その他/Others 営業利益/Operating Profit 版権事業/Licensing 国内版権/Domestic Licensing 海外版権/Overseas Licensing 営業利益/Operating Profit 商品販売事業/Sales of Goods 営業利益/Operating Profit その他事業/Others 営業利益/Operating Profit 内部売上消去/Intra-company Sales
4
'24/3 2Q
'25/3 2Q
'26/3 2Q
商品販売/Sales of Goods
(百万円/ ¥Million)
'27/3 2Q
0
'23/3 2Q
'24/3 2Q
'25/3 2Q
'26/3 2Q
'27/3 2Q
百万円/¥Million 増減% ‘27/3 2Q
’23/3 2Q
’24/3 2Q
’25/3 2Q
’26/3 2Q
42,450
46,184
48,964
44,954
46,612
3.7
19,847
19,112
20,653
16,022
15,240
△ 4.9
3,164
1,475
389
292
356
21.6
1,701
1,391
1,336
1,214
1,520
25.2
180
203
242
375
106
△ 71.7
12,678
13,789
14,497
12,304
11,262
△ 8.5
2,124
2,251
4,187
1,835
1,996
8.8
6,353
2,733
7,881
6,508
4,425
△ 32.0
20,432
19,262
22,217
23,660
25,083
6.0
7,770
7,602
8,769
7,945
7,136
△ 10.2
12,662
11,659
13,448
15,714
17,947
14.2
9,654
9,197
10,955
12,975
13,013
0.3
1,516
6,589
4,708
3,595
4,456
24.0
△45
1,326
513
330
361
9.5
774
1,482
1,703
1,878
2,168
15.4
76
55
161
61
231
274.5
121
261
318
201
337
【通期/Fiscal Year 】
(百万円/ ¥Million)
映像製作・販売事業
版権事業
商品販売事業・その他事業
Film
Licensing
Sales of Goods/Others
その他/Others 海外映像/Overseas Film コンテンツ事業/Contents テレビアニメ/TVs 劇場アニメ/Movies
海外版権/Overseas Licensing (百万円/ ¥Million)
その他/Others
国内版権/Domestic Licensing
(百万円/ ¥Million)
55,000
55,000
55,000
50,000
50,000
50,000
45,000
45,000
45,000
40,000
40,000
40,000
35,000
35,000
35,000
30,000
30,000
30,000
25,000
25,000
25,000
20,000
20,000
20,000
15,000
15,000
15,000
10,000
10,000
10,000
5,000
5,000
5,000
0
'22/3
'23/3
'24/3
'25/3
'26/3
0
'22/3
'23/3
'24/3
'25/3
'26/3
0
商品販売/Sales of Goods
'22/3
'23/3
'24/3
'25/3
'26/3
百万円/¥Million
決算期/Fiscal Year Ended 売上高/Net Sales 映像製作・販売事業/Film 劇場アニメ/Movies テレビアニメ/TVs コンテンツ事業/Contents 海外映像/Overseas Film その他/Others 営業利益/Operating Profit 版権事業/Licensing 国内版権/Domestic Licensing 海外版権/Overseas Licensing 営業利益/Operating Profit 商品販売事業/Sales of Goods 営業利益/Operating Profit その他事業/Others 営業利益/Operating Profit 内部売上消去/Intra-company Sales
2022/3 57,020
2023/3 87,457
2024/3 88,654
2025/3 100,836
2026/3 93,669
20,769
37,267
34,828
37,323
31,151
△ 16.5
452
7,500
2,635
692
480
△ 30.7
3,302
2,868
2,761
3,270
2,776
△ 15.1
402
389
1,730
583
475
△ 18.4
12,747
21,917
22,532
26,026
23,324
△ 10.4
3,864
4,592
5,169
6,750
4,094
△ 39.3
5,753
10,680
6,832
10,379
8,751
△ 15.7
32,995
42,060
39,671
50,582
48,905
△ 3.3
11,958
16,033
15,830
17,414
14,685
△ 15.7
21,037
26,027
23,841
33,167
34,220
3.2
15,957
20,945
18,956
25,924
26,720
3.1
2,231
6,149
10,681
9,211
7,923
△ 14.0
増減%
△ 7.1
△189
648
1,825
654
734
12.3
1,104
2,216
3,922
4,315
6,325
46.6
△253
103
134
176
356
101.7
80
237
449
597
636
5
●連結セグメント別業績推移②/Consolidated Results by Segment 【第2四半期/2nd Quarter 】 国内/海外別売上高
海外事業地域別売上高
Sales breakdown of Overseas and Domestic
Overseas Sales by Region
アジア地域/Asia
海外事業/Overseas
欧州地域/Europe
国内事業/Domestic
中南米地域/Latin America 北米地域/U.S.
(百万円/ ¥Million)
(百万円/ ¥Million)
88%
50,000
40,000
40,000 30,000
57%
30,000
57%
64%
64%
58% 20,000
20,000 81%
10,000
0
42%
'23/3 2Q
81%
88%
43%
43%
'24/3 2Q
'25/3 2Q
91%
91%
10,000
36%
36%
'26/3 2Q
'27/3 2Q
0
'23/3 2Q
'24/3 2Q
'25/3 2Q
'26/3 2Q
'27/3 2Q
百万円/¥Million nd Quarter
第2四半期/2 売上高/Net Sales 国内事業/Domestic 海外事業/Overseas 北米地域/U.S. 中南米地域/Latin America 欧州地域/Europe アジア地域/Asia 売上高比率(%)(国内/海外)/ Share(Dom est i c/ Ov erseas)
内部売上消去/Intra-company Sales
6
’23/3 2Q
’24/3 2Q
’25/3 2Q
42,450
46,184
17,923
19,868
24,648
26,577
28,192
28,694
30,137
5.0
8,934
8,751
8,507
10,009
13,354
33.4
1,009
737
1,649
2,204
1,898
△ 13.9
3,545
4,798
6,095
5,354
7,289
36.1
11,159
12,291
11,940
11,125
7,594
△ 31.7
42/58
43/57
43/57
36/64
36/64
121
261
318
201
337
’26/3 2Q
’27/3 2Q
48,964
44,954
46,612
3.7
21,090
16,461
16,812
2.1
増減%
【通期/Fiscal Year 】 国内/海外別売上高
海外事業地域別売上高
Sales breakdown of Overseas and Domestic
Overseas Sales by Region
アジア地域/Asia 欧州地域/Europe
海外事業/Overseas
中南米地域/Latin America
国内事業/Domestic
北米地域/U.S.
(百万円/ ¥Million)
(百万円/ ¥Million)
120,000
70,000
60,000
100,000
50,000
80,000 60% 55%
60,000
54%
40,000 63% 30,000
40,000
62% 81%
88%
91%
20,000
91%
51%
20,000
45%
46%
40%
'24/3
'25/3
37%
10,000
38%
0
'22/3
'23/3
0
'26/3
'22/3
'23/3
'24/3
'25/3
'26/3
百万円/¥Million
決算期/Fiscal Year Ended 売上高/Net Sales 国内事業/Domestic 海外事業/Overseas 北米地域/U.S. 中南米地域/Latin America 欧州地域/Europe アジア地域/Asia 売上高比率(%)(国内/海外)/ Share(Dom est i c/ Ov erseas)
内部売上消去/Intra-company Sales
2022/3
2023/3
2024/3
2025/3
2026/3
増減%
57,020
87,457
88,654
100,836
93,669
△ 7.1
21,426
39,414
40,936
40,835
34,626
△ 15.2
35,674
48,279
48,167
60,598
59,679
△ 1.5
12,008
17,027
16,374
22,181
21,869
△ 1.4
1,105
2,886
2,131
3,772
3,824
1.4
5,112
8,502
9,996
14,172
15,592
10.0
17,448
19,862
19,665
20,471
18,392
△ 10.2
38/62
45/55
46/54
40/60
37/63
80
237
449
597
636
7
●主要セグメント別作品内訳/Consolidated Sales of Major Titles by Segment 【第2四半期/2nd Quarter 】 国内版権売上上位4作品/Domestic Licensing Top 4 ’23/3 2Q 全体/total 7,770 ドラゴンボール
DRAGON BALL
3,126 ワンピース
’24/3 2Q
’25/3 2Q
ワンピース
ONE PIECE
3,111 ドラゴンボール
8,769 ドラゴンボール
DRAGON BALL
3,318 ワンピース
DRAGON BALL
ONE PIECE
PRECURE
PRECURE
PRECURE
228
2,590 プリキュア 255
セーラームーン セーラームーン SAILOR MOON
144
SAILOR MOON
172
7,945
ドラゴンボール
ドラゴンボール
ワンピース
ワンピース
2,653
2,262
2,967
ONE PIECE
3,117 プリキュア
プリキュア
PRECURE
344 デジモン DIGIMON 137
407
デジモン
DIGIMON
132
’24/3 2Q
’25/3 2Q
’26/3 2Q
デジモン
DIGIMON
137
百万円/¥Million ’27/3 2Q
ワンピース
ワンピース
ワンピース
ワンピース
ONE PIECE
ONE PIECE
ONE PIECE
ワンピース
ドラゴンボール
ドラゴンボール DRAGON BALL
ドラゴンボール
ドラゴンボール
DRAGON BALL
DRAGON BALL
DRAGON BALL
聖闘士星矢
スラムダンク
SAINT SEIYA
581
デジモン
DIGIMON
487
2,274
SLAM DUNK
1,870
聖闘士星矢
SAINT SEIYA
627
3,604
3,082 スラムダンク セーラームーン SLAM DUNK SAILOR MOON 375 646 セーラームーン デジモン
SAILOR MOON
DIGIMON
553
373
海外版権売上上位4作品/Overseas Licensing Top 4 ’23/3 2Q 全体/total 12,662 ドラゴンボール
DRAGON BALL
5,778
ワンピース
ONE PIECE
2,315 デジモン
DIGIMON
1,158
’24/3 2Q 11,659 ドラゴンボール
DRAGON BALL
5,102
ワンピース
ONE PIECE
2,939 デジモン
DIGIMON
543
スラムダンク
スラムダンク
485
436
SLAM DUNK
SLAM DUNK
’25/3 2Q 13,448 ドラゴンボール
DRAGON BALL
5,823
ワンピース
ONE PIECE
3,683 デジモン DIGIMON 690
聖闘士星矢 SAINT SEIYA 252
’26/3 2Q 15,714 ドラゴンボール
DRAGON BALL
6,273
ワンピース ONE PIECE
423
11,262
ONE PIECE
7,136
プリキュア
12,304
4,828
国内版権
PRECURE
14,497
4,511
4,749
セーラームーン SAILOR MOON ワンピース ONE PIECE
その他 Others
海外映像 Overseas Film
11,262
3,055
ドラゴンボール DRAGON BALL
デジモン
DIGIMON
235
セーラームーン SAILOR MOON
デジモン DIGIMON
66
百万円/¥Million ’27/3 2Q 17,947
聖闘士星矢 SAINT SEIYA
ワンピース
その他 Others
ONE PIECE
6,825
ワンピース ドラゴンボール
6,476 デジモン DIGIMON 1,275
聖闘士星矢 聖闘士星矢 SAINT SEIYA SAINT SEIYA 333 385
ワンピース ONE PIECE
海外版権
ONE PIECE DRAGON BALL
5,837 デジモン DIGIMON 915
ドラゴンボール DRAGON BALL
Domestic Licensing
ONE PIECE
ONE PIECE
3,573
8
2,822
13,789
4,424
その他 Others
ドラゴンボール
DRAGON BALL
DRAGON BALL
3,938
デジモン DIGIMON
7,136 PRECURE
DRAGON BALL
海外映像売上上位4作品/Overseas Film Top 4 ’23/3 2Q 全体/total 12,678
百万円/¥Million ’27/3 2Q プリキュア
7,602
ONE PIECE
2,880 プリキュア
’26/3 2Q
Overseas Licensing
17,947
デジモン DIGIMON
ドラゴンボール DRAGON BALL
【通期/Fiscal Year 】 国内版権売上上位4作品/Domestic Licensing Top 4 2022/3 全体/total 11,958 ドラゴンボール
2023/3
2024/3
16,033
15,830
17,414
14,685
ワンピース
ワンピース
ドラゴンボール
ワンピース ONE PIECE 5,130 ドラゴンボール
DRAGON BALL
ONE PIECE
ワンピース
ドラゴンボール
5,487
百万円/¥Million 2026/3
2025/3
6,553
ONE PIECE DRAGON BALL
6,706
6,321
ドラゴンボール
ワンピース
ONE PIECE
DRAGON BALL
DRAGON BALL
ONE PIECE
DRAGON BALL
PRECURE
PRECURE
PRECURE
PRECURE
PRECURE
セーラームーン セーラームーン セーラームーン
ゲゲゲの鬼太郎 GEGEGE no KITARO
デジモン DIGIMON 252
3,496 プリキュア 528
SAILOR MOON
257
6,149 プリキュア 553
SAILOR MOON
273
5,234 プリキュア
6,102 プリキュア
663
SAILOR MOON
215
812
208
海外映像売上上位4作品/Overseas Film Top 4 2022/3 全体/total 12,747 ワンピース
2023/3
2024/3
21,917 ワンピース
26,026
ワンピース
ワンピース
ONE PIECE
ドラゴンボール
ドラゴンボール
ドラゴンボール
ドラゴンボール
ドラゴンボール
2,474
聖闘士星矢
DRAGON BALL
DRAGON BALL
聖闘士星矢
スラムダンク
スラムダンク
セーラームーン
1,474
2,164
958
667
SAINT SEIYA
プリキュア
スラムダンク
715
1,063
PRECURE
SLAM DUNK
3,907
SLAM DUNK
6,560
SLAM DUNK
聖闘士星矢
プリキュア
SAINT SEIYA
PRECURE
1,098
927
海外版権売上上位4作品/Overseas Licensing Top 4 2022/3 全体/total 21,037 ドラゴンボール
DRAGON BALL
9,328
2023/3
2024/3
26,027 ドラゴンボール
DRAGON BALL
11,590
ドラゴンボール
DRAGON BALL
9,898
DIGIMON
33,167 ドラゴンボール
DRAGON BALL
13,629
34,220 ワンピース ONE PIECE
12,497
ワンピース
ワンピース
ワンピース
ONE PIECE
ONE PIECE
ONE PIECE
DRAGON BALL
SLAM DUNK
DIGIMON
DIGIMON
DIGIMON
DIGIMON
7,228 デジモン
1,673 デジモン
2,208 スラムダンク
1,147 スラムダンク
1,532
855
724
DIGIMON
SLAM DUNK
SLAM DUNK
ドラゴンボール DRAGON BALL
デジモン DIGIMON
585
ワンピース
5,930 デジモン
23,324
SAILOR MOON
ONE PIECE
4,394 スラムダンク
Overseas Film
セーラームーン SAILOR MOON
百万円/¥Million 2026/3
2025/3
23,841
海外映像
4,386
デジモン
ワンピース ONE PIECE ワンピース ONE PIECE
その他 Others
10,216
DRAGON BALL
SAINT SEIYA
844
8,866
DRAGON BALL
5,403
プリキュア PRECURE
ワンピース
ONE PIECE
DRAGON BALL
ドラゴンボール DRAGON BALL
23,324
ONE PIECE
8,258
14,685
866
ONE PIECE
7,234
国内版権 Domestic Licensing
5,082 プリキュア
ONE PIECE
4,184
ワンピース ONE PIECE
その他 Others
百万円/¥Million 2026/3
2025/3
22,532
デジモン DIGIMON
9,994 デジモン
1,532 聖闘士星矢
SAINT SEIYA
632
聖闘士星矢 SAINT SEIYA その他 Others
ワンピース ONE PIECE
海外版権
ドラゴンボール
Overseas Licensing
34,220
11,331
デジモン
2,280 聖闘士星矢
SAINT SEIYA
696
海外子会社は、12月31日が決算日となっており、連結決算日との間に生じた重要な取引については、 調整を行っております。 Notes: Because the fiscal year of the overseas subsidiaries ends Dec. 31, appropriate adjustments are made concerning to important business deals occurred till the closing date of the parent company.
ドラゴンボール DRAGON BALL
デジモン DIGIMON
注:
9
●収益性/Profitability 売上高営業利益率/経常利益率/当期純利益率
使用総資産経常利益率/当期純利益率
Operating Profit Margin/ Ordinary Profit Margin/Net Profit Margin
Ordinary Profit to Total Assets/Net Profit to Total Assets
売上高営業利益率/Operating Income to Net Sales
使用総資産経常利益率/Ordinary Income to Total Assets
売上高経常利益率/Ordinary Income to Net Sales (%)
売上高当期純利益率/Net Income to Net Sales
50.0
(%)
40.0
20
30.0
15
20.0
10
10.0
5
0.0
'22/3
'23/3
'24/3
'25/3
使用総資産当期純利益率/Net Income to Total Assets
25
0
'26/3
'22/3
'23/3
'26/3
Return on Equity
(回/Times)
(%)
1
25
0.8
20
0.6
15
0.4
10
0.2
5
'22/3
'25/3
自己資本当期純利益率
総資産回転率(回) Total Assets Turnover (Times)
0
'24/3
'23/3
'24/3
'25/3
'26/3
0
'22/3
'23/3
'24/3
'25/3
'26/3
%
決算期/Fiscal Year Ended 売上高営業利益率/Operating Profit Margin 売上高経常利益率/Ordinary Profit Margin 売上高当期純利益率/Net Profit Margin 使用総資産経常利益率/Ordinary Profit to Total Assets 使用総資産当期純利益率/Net Profit to Total Assets 総資産回転率(回)/Total Assets Turnover(Times) 自己資本当期純利益率/Return on Equity 注:
2022/3
2023/3
2025/3
2026/3
32.8
26.4
32.2
33.1
33.0
34.1
29.8
32.9
35.7
22.5
23.9
21.2
23.4
26.8
16.2
21.5
16.9
18.8
17.0
11.0
15.1
12.0
13.4
12.8
0.5
0.6
0.6
0.6
0.5
14.2
19.9
15.3
16.6
15.5
使用総資産経常利益率=経常利益/総資産(期中平均)×100 使用総資産当期純利益率=当期純利益/総資産(期中平均)×100 総資産回転率=売上高/総資産(期中平均) 自己資本当期純利益率=当期純利益/自己資本(期中平均)×100 Notes: Ordinary Profit to Total Assets=Ordinary Profit /Total Assets (Yearly Average)×100 Net Profit to Total Assets=Net Profit /Total Assets (Yearly Average)×100 Total Assets Turnover=Net Sales/Total Assets (Yearly Average) Return on Equity=Net Profit /Shareholder’s Equity (Yearly Average)×100
10
2024/3
31.8
●安定性/Stability 流動比率/当座比率
固定比率/固定長期適合率
Current Ratio/Quick Ratio
Fixed Ratio/ Fixed Long-term Appropriateness Ratio 固定比率/Fixed Ratio
流動比率/Current Ratio (%)
(%)
当座比率/Quick Ratio
600
固定長期適合率/Fixed Long-term Appropriateness Ratio
80
500
60
400 40
300 200
20
100 0
'22/3
(百万円/ ¥Million)
'23/3
'24/3
'25/3
0
'26/3
'24/3
'25/3
純資産/自己資本比率
1株当たり純資産 Net Assets per Share
純資産/Net Assets 自己資本比率/Shareholders' Equity Ratio
(%)
160,000
80
800
120,000
60
600
80,000
40
400
40,000
20
200
0
0
'22/3
'23/3
'24/3
'25/3
'26/3
'26/3
(円/¥)
1,000
0
'23/3
Net Assets/Shareholders’ Equity Ratio
100
200,000
'22/3
'22/3
'23/3
'24/3
'25/3
'26/3
%
決算期/Fiscal Year Ended 流動比率/Current Ratio 当座比率/Quick Ratio 固定比率/Fixed Ratio 固定長期適合率/Fixed Long-term Appropriateness Ratio 純資産(百万円)/Net Assets(¥ Million) 1株当たり純資産(円)/Net Assets per Share(¥) 自己資本比率/Shareholders’ Equity Ratio
2022/3
2023/3
2024/3
2025/3
2026/3
310.1
314.9
419.3
375.9
511.4
169.4
198.7
264.9
281.1
389.8
35.4
34.8
32.1
41.1
39.0
35.0
34.5
31.6
40.2
38.0
96,044
114,502
131,713
153,198
171,039
469.67
560.89
644.15
749.2
837.1
75.7
76.1
80.9
80.2
84.6
注:
流動比率=流動資産(期末)/流動負債(期末)×100 当座比率={現金及び預金(期末)+売上債権(期末)+有価証券(期末)}/流動負債(期末)×100 固定比率=固定資産(期末)/純資産(期末)×100 固定長期適合率=固定資産(期末)/{純資産(期末)+固定負債(期末)}×100 Notes: Current Ratio=Current Assets (Fiscal Year-end)/Current Liabilities (Fiscal Year-end)×100 Quick Ratio={Cash and Time Deposits (Fiscal Year-end) +Accounts Receivable (Fiscal Year-end) +Securities (Fiscal Year-end)}/Current Liabilities (Fiscal Year-end)×100
Fixed Ratio=Fixed Assets (Fiscal Year-end)/Net Assets×100 Fixed Long-term Appropriateness Ratio=Fixed Assets (Fiscal Year-end)/{Net Assets (Fiscal Year-end) +Long-term Liabilities (Fiscal Year-end)}×100 注:
当社は、2024 年4月1日付で普通株式1株につき5株の株式分割を行っております。2022 年3月期の期首に当該株式分割が行われたものと仮定して、 「1株当たり当期純利益(1株当たり純資産)」を算定しております。 Notes: The Company implemented a five-for-one split of its common stock on April 1, 2024. The net Profit per share (net assets per share) have been calculated by assuming that this stock split was carried out at the beginning of the fiscal year ended March 31, 2022.
11
●効率性/Efficiency 1人当たり売上高/期末従業員数
1人当たり経常利益/当期純利益
Net Sales per Employee/Number of Employees at Year-end
Ordinary Profit per Employee/Net Profit per Employee
(千円/ ¥Thousand)
120,000
1人当たり売上高/Net Sales per Employee
(人)
(千円/ ¥Thousand)
1,800
40,000
期末従業員数/Number of Employees at Year-end
100,000
1,500
80,000
1,200
60,000
900
40,000
600
20,000
300
1人当たり経常利益/Ordinary Income per Employee 1人当たり当期純利益/Net Income per Employee
35,000 30,000 25,000 20,000 15,000 10,000
0
'22/3
'23/3
'24/3
'25/3
'26/3
5,000 0
0
'22/3
キャッシュ・フロー
'24/3
'25/3
'26/3
売上高販管費率
Cash Flows
(千円/ ¥Thousand)
'23/3
Selling, General and Administrative Expenses to Net Sales (%)
15,000,000
20
12,500,000 10,000,000
15
7,500,000 10
5,000,000 2,500,000
5
0 -2,500,000 -5,000,000
'22/3
'23/3
'24/3
'25/3
0
'26/3
'22/3
'23/3
'24/3
'25/3
'26/3
千円/¥Thousand
決算期/Fiscal Year Ended 1人当たり売上高/Net Sales per Employee 期末従業員数(名)/Number of Employees at Year-end 1人当たり経常利益/Ordinary Profit per Employee 1人当たり当期純利益/Net Profit per Employee 減価償却費/Depreciation and Amortization キャッシュ・フロー/Cash Flows 期末発行済株式数(株)/Number of Shares Outstanding 売上高販管費率(%)/SG&A Expenses to Net Sales (%)
2023/3
2024/3
2025/3
2026/3
68,084
99,609
97,907
107,788
93,295
856
900
911
960
1,048
22,474
33,931
29,214
35,476
33,328
15,307
23,804
20,757
25,252
24,970
602,849
603,426
790,255
782,180
759,484
△1,981,441
8,781,818
7,217,342
14,186,659
9,623,753
204,493,255 204,438,250 204,476,720 204,496,371 204,312,971 15.1
14.1
15.9
15.9
注: Notes:
従業員1人当たり指標は、期中平均従業員数に基づいて算出しています。 Per Employee Data are based on the yearly average number of employees.
注:
当社は、2024 年4 月1日付で普通株式1 株につき5 株の株式分割を行っております。2022 年3月期の期首に当該株式分割が行わ れたものと仮定して、「期末発行済株式数(株)」を算定しております。 The Company implemented a five-for-one split of its common stock on April 1, 2024. The number of shares (net assets outstanding have been calculated by assuming that this stock split was carried out at the beginning of the fiscal year ended March 31, 2022.
Notes:
12
2022/3
19.4
●連結貸借対照表/Consolidated Balance Sheets 百万円/¥Million 決算期/Fiscal Year Ended
2023/3
2024/3
2025/3
2027/3 2Q
2026/3
増減
【資産の部】/Assets 流動資産/Current Assets
110,702 120,455 127,940
135,566 141,817
現金及び預金/Cash and Deposits
66,909
79,007
82,474
92,748
97,035
4,286
受取手形及び売掛金/Notes and Accounts Receivable 製作品/ Finished Products
24,975
24,012
29,376
26,931
25,093
△1,838
3,716
99
109
48
137
88
商品/Merchandise 仕掛品/ Work in Progress
1,095
1,295
1,598
1,739
1,853
113
8,417
8,562
8,281
11,375
13,791
2,415
107
123
151
142
149
7
関係会社短期貸付金/Short-term Loans to Related Parties
3,187
3,136
3,134
69
228
158
その他/Other
2,315
4,276
2,979
2,596
3,590
993
貸倒引当金/Allowance for Doubtful Accounts
△21
△58
△165
△85
△61
24
固定資産/Fixed Assets
39,806
42,283
63,039
66,704
66,954
250
有形固定資産/Total Property and Equipment 建物及び構築物(純額)/Buildings and Structures, Net
8,392
8,180
8,558
8,776
9,186
410
6,581
6,406
6,628
6,915
7,116
201
1,315
1,315
1,315
1,315
1,315
6
3
107
33
33
原材料及び貯蔵品/ Raw Materials and Supplies
土地/ Land 建設仮勘定/Construction in Progress その他/ Other
6,250
489
455
507
545
721
176
無形固定資産/Intangible Assets
1,184
1,321
1,281
1,435
1,417
△17
投資その他の資産/Investments and Other Assets
30,229
32,782
53,199
56,493
56,350
△143
投資有価証券/Investment Securities
12,522
15,888
20,666
22,875
25,787
2,911
関係会社長期貸付金/Long-term Loans to Related Parties
3,006
3,000
長期預金/Long-term Deposits
13,000
12,000
30,500
31,300
28,300
△3,000
その他/Other
1,704
1,896
2,035
2,460
2,380
△79
△2
△2
△2
△142
貸倒引当金/Allowance for Doubtful Accounts 資産合計/Total Assets 【負債の部】/Liabilities 流動負債/Current Liabilities
△118
24
150,508 162,739 190,980
202,271 208,772
6,500
35,150
28,730
34,035
26,510
27,244
734
支払手形及び買掛金/Notes and Accounts Payable-trade
22,763
20,370
22,125
17,359
15,891
△1,468
未払法人税等/Profit Taxes Payable
5,334
2,119
5,279
2,843
4,645
1,801
547
545
592
672
819
146
6,505
5,695
6,038
5,633
5,888
254
固定負債/Non-Current Liabilities
855
2,295
3,745
4,721
5,336
614
役員株式給付引当金/Provision for Share-based Remuneration for Directors 退職給付に係る負債/Net Defined Benefit Liability
158
175
229
314
352
37
225
302
172
162
168
5
賞与引当金/Provision for Bonuses その他/Other
その他/Other 負債合計/Total Liabilities 【純資産の部】/Net Assets 株主資本/Shareholders' Equity 資本金/Share Capital 資本剰余金/Capital Surplus 利益剰余金/Retained Earnings 自己株式/Treasury shares
472
1,817
3,343
4,244
4,816
571
36,006
31,025
37,781
31,231
32,580
1,349
154,581 156,970
2,389
108,768 121,273 138,553 2,867
2,867
2,867
3,409
3,409
3,409
103,298 115,751 133,030 △807
△754
△754
5,734
10,440
14,645
2,867
2,867
3,409
3,409
149,710 152,599
2,889
△1,406 △1,906
△500
16,458
19,220
2,762
純資産合計/Total Net Assets
114,502 131,713 153,198
171,039 176,191
5,151
負債純資産合計/Total Liabilities and Net Assets
150,508 162,739 190,980
202,271 208,772
6,500
その他の包括利益累計額/Accumulated other comprehensive Profit
13
●連結損益計算書/Consolidated Statements of Profit 【第2四半期/2nd Quarter 】 nd Quarter
第2四半期/2
百万円/¥Million ’23/3 2Q ’24/3 2Q ’25/3 2Q ’26/3 2Q ‘27/3 2Q
増減
売上高/Net Sales
42,450
46,184
48,964
44,954
46,612
1,658
売上原価/Cost of Sales
23,142
28,197
24,684
20,136
21,409
1,272
売上総利益/Gross Profit
19,308
17,986
24,280
24,817
25,203
385
販売費及び一般管理費/Selling, General and Administrative Expenses
5,113
6,621
7,286
8,179
10,042
1,862
営業利益/Operating Profit
14,194
11,365
16,993
16,638
15,161 △1,477
営業外収益/Non-operating Profit
1,341
2,523
879
1,271
1,101
△169
12
31
773
5
80
74
15,524
13,857
17,099
17,904
376
営業外費用/Non-operating Expenses 経常利益/Ordinary Profit 特別利益/Extraordinary Profit
16,182 △1,721
△376
△25
特別損失/Extraordinary Losses 税金等調整前四半期純利益/Net Profit before Profit Taxes
157
25
15,524
13,857
16,941
18,254
16,182 △2,072
法人税、住民税及び事業税/Profit Taxes, Inhabitant Taxes and Enterprise Taxes
4,191
4,016
4,662
5,219
4,604
△614
△316
△370
法人税等調整額/Profit Taxes Adjustment
△189
△399
60
54
四半期純利益/Net Profit
11,521
10,240
12,219
12,980
11,893 △1,086
親会社株主に帰属する四半期純利益/Net Profit Attributable to Owners of Parent
11,521
10,240
12,219
12,980
11,893 △1,086
14
●連結損益計算書/Consolidated Statements of Profit 百万円/¥Million 決算期/Fiscal Year Ended 売上高/Net Sales
2022/3 57,020
2023/3 87,457
2024/3 2025/3 88,654 100,836
増減 2026/3 93,669 △7,166
売上原価/Cost of Sales
30,327
46,490
51,205
52,413
44,465 △7,948
売上総利益/Gross Profit
26,693
40,966
37,449
48,422
49,203
781
販売費及び一般管理費/Selling, General and Administrative Expenses
8,585
12,296
14,085
15,989
18,185
2,195
営業利益/Operating Profit
18,107
28,669
23,364
32,432
31,018 △1,414
営業外収益/Non-operating Profit
859
1,650
3,161
1,780
2,464
営業外費用/Non-operating Expenses
144
528
71
1,024
18,822
29,791
26,453
33,188
33,462
274
1
253
744
744 △347
経常利益/Ordinary Profit 特別利益/Extraordinary Profit 特別損失/Extraordinary Losses 税金等調整前当期純利益/Profit before Profit Taxes 法人税、住民税及び事業税/Profit Taxes, Inhabitant Taxes and Enterprise Taxes
684
20 △1,004
204
378
31
18,619
29,791
26,707
32,809
34,175
1,366
5,672
8,995
7,529
9,265
8,516
△748
126
△103
382
△79
588
668
当期純利益/Net Profit
12,820
20,900
18,795
23,623
25,070
1,446
親会社株主に帰属する当期純利益/Net Profit Attributable to Owners of Parent
12,820
20,900
18,795
23,623
25,070
1,446
法人税等調整額/Profit Taxes Adjustment
●配当の状況/Dividends 1株当たり配当金/Dividends per Share (円/Yen)
100
配当性向/Payout Ratio
(%)
100
80
80
60
60
40
40
20
20
0
'21 /3
'22 /3
'23 /3
'24 /3
'25 /3
'26 /3
0
円/¥
決算期/Fiscal Year Ended 1株当たり配当金/Dividends per Share 配当金総額(百万円)/Total Dividend (¥ Million) 配当性向(%) /Payout Ratio (%) 純資産配当率(%)/Dividend on Equity Ratio (%) 注:
2021/3
2022/3
2023/3
2024/3
70.00 (14.00) 2,888 25.9 3.6
94.00 (18.80) 3,878 30.0 4.2
155.0 (31.00) 6,395 30.3 6.0
155.0 (31.00) 6,395 33.7 5.1
2025/3
2026/3
41.00
44.00
8,458 35.5 5.9
9,077 35.9 5.5
当社は2024年4月1日付けで株式分割をしております。2024年3月期以前の配当金額は、実際の配当金額と()内に各期首に株式分割を したと仮定して計算した配当金額を記載しております
Notes: The company conducted a share split on April 1, 2024. The dividend prior to the fiscal year ending March 2024 was calculated based on the assumption that shares are split at the beginning of each term, as described in parenthesis, in addition to the actual dividend.
15













Prompts
Click prompts to add them under the company line, click again to take one out, then copy the result into your AI chat. Shared by Asian Century Stocks and Uncovered Thai Stocks. Thank you.
ETFs Holding Toei Animation Co., Ltd.
Exchange-traded funds whose newest published daily portfolio holds one of the company's listings, largest weight first.
| ETF | Weight in ETF | Shares | Market value | As of |
|---|---|---|---|---|
| BCDF | 0.64% | 9,204 | $ 137.841K | Jun 30, 2026 |
| INFL | 0.15% | 150,799 | $ 2.258M | Jun 30, 2026 |
| DFIS | 0.03% | 93,700 | $ 1.91M | Nov 12, 2026 |
| DXIV | 0.02% | 1,800 | $ 36.698K | Nov 12, 2026 |
| DFSI | 0.01% | 8,100 | $ 165.141K | Nov 12, 2026 |
| DFIC | 0.01% | 87,900 | $ 1.792M | Nov 12, 2026 |
| DFAX | 0.01% | 41,200 | $ 839.975K | Nov 12, 2026 |
| DFAI | 0.00% | 43,400 | $ 884.828K | Nov 12, 2026 |