2027年3月期 第2四半期(中間期)決算短信〔日本基準〕(連結) 2026年10月30日 上場会社名 株式会社エフアンドエム 上場取引所 コード番号 4771 URL https://www.fmltd.co.jp/ 代表者 (役職名) 代表取締役社長 (氏名)森中一郎 問合せ先責任者 (役職名)…
2027年3月期
第2四半期(中間期)決算短信〔日本基準〕(連結)
2026年10月30日
上場会社名
株式会社エフアンドエム
上場取引所
コード番号
4771
URL https://www.fmltd.co.jp/
代表者
(役職名) 代表取締役社長
(氏名)森中一郎
問合せ先責任者 (役職名) 管理本部長
(氏名)松尾麻希
半期報告書提出予定日
2026年11月13日
配当支払開始予定日
決算補足説明資料作成の有無:有
決算説明会開催の有無
:有 (アナリスト向け)
東
TEL 06-6339-7177
2026年12月1日
(百万円未満切捨て)
1.2027年3月期第2四半期(中間期)の連結業績(2026年4月1日~2026年9月30日)
(1)連結経営成績(累計)
(%表示は、対前年中間期増減率)
売上高
百万円
11,458
8,956
2027年3月期中間期
2026年3月期中間期
(注)包括利益
営業利益
2027年3月期中間期
%
27.9
25.5
百万円
1,997
937
1,380百万円 (113.0%)
1株当たり
中間純利益
円銭
93.38
43.78
2027年3月期中間期
2026年3月期中間期
経常利益
%
113.1
49.9
百万円
2,029
958
親会社株主に帰属する
中間純利益
%
百万円
%
111.7
1,381
113.3
50.1
647
59.9
2026年3月期中間期
648百万円 (53.9%)
潜在株式調整後
1株当たり
中間純利益
円銭
-
-
(2)連結財政状態
総資産
2027年3月期中間期
2026年3月期
(参考)自己資本
純資産
百万円
21,941
20,642
2027年3月期中間期
16,359百万円
自己資本比率
百万円
16,359
15,423
2026年3月期
%
74.6
74.7
15,423百万円
2.配当の状況
第1四半期末
円銭
-
-
第2四半期末
円銭
21.00
30.00
2026年3月期
2027年3月期
2027年3月期(予想)
(注)直近に公表されている配当予想からの修正の有無:無
年間配当金
第3四半期末
円銭
-
期末
合計
円銭
30.00
円銭
51.00
-
30.00
60.00
%
29.4
親会社株主に帰属
する当期純利益
百万円
%
3,448
22.0
3.2027年3月期の連結業績予想(2026年4月1日~2027年3月31日)
(%表示は、対前期増減率)
売上高
営業利益
百万円
%
百万円
%
通期
25,675
23.4
4,994
29.4
(注)直近に公表されている業績予想からの修正の有無:無
経常利益
百万円
5,046
1株当たり
当期純利益
円銭
233.12
※
注記事項
(1)当中間期における連結範囲の重要な変更:無
新規 -社 (社名)
、除外
-社
(社名)
(2)中間連結財務諸表の作成に特有の会計処理の適用:無
(3)会計方針の変更・会計上の見積りの変更・修正再表示
① 会計基準等の改正に伴う会計方針の変更
:無
② ①以外の会計方針の変更
:無
③ 会計上の見積りの変更
:無
④ 修正再表示
:無
(4)発行済株式数(普通株式)
① 期末発行済株式数(自己株式を含む)
2027年3月期中間期
15,714,400株
②
期末自己株式数
2027年3月期中間期
921,978株
③
期中平均株式数(中間期)
2027年3月期中間期
14,792,464株
2026年3月期
2026年3月期
2026年3月期中間期
15,714,400株
921,897株
14,792,529株
※
第2四半期(中間期)決算短信は公認会計士又は監査法人のレビューの対象外です
※
業績予想の適切な利用に関する説明、その他特記事項
(将来に関する記述等についてのご注意)
本資料に記載されている業績見通し等の将来に関する記述は、当社が現在入手している情報及び合理的であると判
断する一定の前提に基づいており、その達成を当社として約束する趣旨のものではありません。また、実際の業績等
は様々な要因により大きく異なる可能性があります。業績予想の前提となる条件及び業績予想のご利用に当たっての
注意事項等については、添付資料P.5「1.経営成績等の概況 (3)連結業績予想などの将来予測情報に関する
説明」をご覧ください。
(決算補足説明資料の入手方法及び決算説明会開催について)
決算補足説明資料は2026年10月30日(金)に当社ウェブサイトに掲載する予定です。
また、当社は2026年11月2日(月)にアナリスト向け説明会を開催する予定です。
㈱エフアンドエム(4771) 2027年3月期
第2四半期(中間期)決算短信
○添付資料の目次
1.経営成績等の概況 ………………………………………………………………………………………………………
2
(1)当中間期の経営成績の概況 ………………………………………………………………………………………
2
(2)当中間期の財政状態の概況 ………………………………………………………………………………………
4
(3)連結業績予想などの将来予測情報に関する説明 ………………………………………………………………
5
2.中間連結財務諸表及び主な注記 ………………………………………………………………………………………
6
(1)中間連結貸借対照表 ………………………………………………………………………………………………
6
(2)中間連結損益計算書及び中間連結包括利益計算書 ……………………………………………………………
8
中間連結損益計算書 ………………………………………………………………………………………………
8
中間連結包括利益計算書 …………………………………………………………………………………………
9
(3)中間連結財務諸表に関する注記事項 ……………………………………………………………………………
10
(セグメント情報等の注記) ………………………………………………………………………………………
10
(株主資本の金額に著しい変動があった場合の注記) …………………………………………………………
12
(継続企業の前提に関する注記) …………………………………………………………………………………
12
㈱エフアンドエム(4771) 2027年3月期
第2四半期(中間期)決算短信
1.経営成績等の概況
(1)当中間期の経営成績の概況
当中間連結会計期間における我が国経済は、地政学リスクの慢性化に伴うエネルギー価格の高止まりや、為替相
場における円安基調の定着など、外部環境の先行き不透明さが継続いたしました。一方で、国内金融市場において
は株価が歴史的な最高値を更新するなど堅調に推移したほか、生成AIの普及や半導体、データセンター関連を中心
としたITインフラ需要の底堅さに加え、都市部の大型再開発プロジェクトに伴う設備投資意欲の改善が、景気の下
支えとして強く意識されました。
個人消費においては、今春の春闘でも高い水準の賃上げが維持されたものの、日銀の追加利上げに伴う住宅ロー
ン金利等の上昇への警戒感や生活必需品の値上げが依然として家計を圧迫いたしました。これにより、小売市場を
中心に消費者の節約志向や買い控えの動きが顕著となるなか、不要な支出を徹底して抑える一方、自己研鑽やウェ
ルビーイングへの投資には支出を惜しまない「メリハリ消費」の傾向が一段と強まりました。
金融環境につきましては、日銀による政策金利の引き上げが進み「金利のある世界」への移行が本格化したこと
で、多くの企業において金利コスト上昇への懸念や対応を迫られる局面となりました。効率的な資金調達戦略の構
築や財務体質の強靭化、および資本効率を重視した経営への変革が、企業の持続可能性を評価する重要な指標とな
った期間でありました。
このような経済状況のもと、当社グループは主要事業の会員数の増加およびサービス内容の拡充と業務の効率化
に取り組んでまいりました。
この結果、当中間連結会計期間の経営成績は売上高114億58百万円(前年同期比27.9%増)、営業利益19億97百
万円(同113.1%増)、経常利益20億29百万円(同111.7%増)、親会社株主に帰属する中間純利益13億81百万円
(同113.3%増)となりました。
セグメントごとの経営成績は次のとおりであります。
なお、第1四半期連結会計期間より、報告セグメントの区分を変更しており、以下の前年同四半期比較について
は、前年同四半期の数値を変更後のセグメント区分に組み替えた数値で比較しております。
(ⅰ)アカウンティングサービス事業
アカウンティングサービス事業は、生命保険営業職員を中心とする個人事業主及び小規模企業に対する記帳代行
等の会計サービスになります。当中間連結会計期間の営業面におきましては、各生命保険会社が新入社員向けに随
時実施する研修への参加を継続し、顧客獲得チャネルの維持・確保に努めました。サービス面におきましては、顧
客エンゲージメントの強化を目的に、提供中のユーザー向けアプリを改修しました。定期的に必要となる提出資料
のリマインド通知や、アプリ内での直接的なチャット(トーク)機能の拡充など、アプリを活用した施策を推進し
たことで、ユーザーとの接点強化と業務効率化を両立しました。
その結果、当中間連結会計期間末(2026年9月30日)の会計サービス会員数は122,469件(前期末比8,967件増)
となりました。
この結果、アカウンティングサービス事業における当中間連結会計期間の売上高は23億87百万円(前年同期比
10.5%増)、営業利益は6億95百万円(同20.0%増)となりました。
(ⅱ)コンサルティング事業
コンサルティング事業は、中堅・中小企業向け管理部門支援サービスの「エフアンドエムクラブ」、ISO及びプ
ライバシーマークの認証取得支援、「ものづくり補助金」「中堅等の大規模成長投資補助金」をはじめとした補助
金受給申請支援、資金繰り改善のための経営改善計画の策定支援、講師派遣型研修サービス等になります。
「エフアンドエムクラブ」については、2026年9月末時点で240行庫の金融機関と提携し、営業機会の増強に努
めております。2026年7月15日には、株式会社三菱UFJ銀行との取り組みを「紹介」から「媒介」へと前進させ、
媒介契約の締結を発表するなど、当社グループが金融機関にとって最良のパートナーとなるよう関係強化を進めて
おります。また、当期より「新規営業」「顧客フォロー」と役割ごとに分かれていた部門を、地域ごとに統合し、
一気通貫体制へと移行しております。この体制のもとで紹介顧客の状況共有に力を入れた結果、提携金融機関との
連携強化が進み、営業体制の拡充と合わせて、着実な新規契約の獲得につながっております。
会員企業へのアプローチにおいては、新規獲得とフォローの顧客接点を一部門へ統合したことで経営課題に対す
る解像度が高まり、企業のバックオフィス支援を含む包括的な支援基盤の拡充が順調に進んでおります。こうした
体制強化を背景に、採用競争力を高めるための求人票添削などの採用支援、労務管理体制の整備による就業環境の
改善、採用後の定着率やパフォーマンス向上のための人事考課制度策定支援、設備投資や人的投資に関わるキャッ
シュ・フローの分析といったサービスが中小企業経営者のニーズを掴み、新規会員の増加に貢献しました。加え
て、人材育成、財務体質改善、労務業務のDX推進など、各分野の専門チームが顧客の課題に合わせた深度ある支援
㈱エフアンドエム(4771) 2027年3月期
第2四半期(中間期)決算短信
を行うことで、顧客満足度の向上および契約継続率の改善においても良好な成果を上げております。
その結果、当中間連結会計期間末(2026年9月30日)のエフアンドエムクラブ会員数は15,764社(前期末比947
社増)となりました。
ISO及びプライバシーマークの認証取得支援については、公共工事における入札加点を目的とした建設業向けの
ISO9001およびISO14001の受注が中心となりました。食品製造業の海外輸出促進に伴うFSSC22000やHACCPの受注も
引き続き堅調に推移しております。加えて、近年の地震や風水害による災害対策として、BCP関連の認証に関する
問い合わせも増加傾向にあります。
補助金受給申請支援については、「ものづくり補助金(ものづくり・商業・サービス生産性向上促進補助金)」
や「中堅等の大規模成長投資補助金(中堅・中小・スタートアップ企業の賃上げに向けた省力化等の大規模成長投
資補助金)」(※1)等の支援を継続するとともに、注力している「中小企業省力化投資補助金(一般型)」にお
いては、引き続き高水準の実績を維持しています。加えて、「中小企業成長加速化補助金」第2次公募において
は、当社の支援により採択率54.7%を達成しました。同公募の全国平均採択率(25.6%)を大きく上回る実績であ
り、第1次公募での当社採択率25.0%からも29.7ポイントの大幅な向上を実現しております。なお、2026年10月以
降に採択結果が発表された補助金にともなう売上高は第3四半期以降に計上されます。
補助金名
回次
採択発表
申請数
採択数
22次
2026年4月30日
22件
13件
23次
2026年8月7日
12件
9件
中堅等の大規模成長投資補助金
(※1)
5次
2026年5月18日
17件
8件
6次
2026年11月上旬
5件
発表待ち
中小企業成長加速化補助金
2次
2026年8月4日
64件
※2
35件
第3回
2026年7月1日
21件
11件
第4回
2026年9月30日
35件
14件
第5回
2026年6月5日
86件
78件
第6回
2026年8月28日
68件
61件
第7回
2026年11月中旬
118件
発表待ち
第8回
2027年2月上旬
104件
発表待ち
ものづくり補助金
新事業進出補助金
中小企業省力化投資補助金(一般型)
※1
同補助金は、4次公募までは「中堅・中小成長投資補助金(中堅・中小企業の賃上げに向けた省力化等の大
規模成長投資補助金)」の名称で公募されていました。
※2 申請後の取り下げを反映した数字を記載しております。
※3
上表は2026年10月29日現在の状況です。
資金繰り改善のための経営改善計画書の策定支援については、スピードを重視し、405事業を活用しないリファ
イナンス支援にも注力しています。これにより、効果的な中小企業の財務改善の実現をサポートしております。
企業の従業員向け研修に専門的な知識や経験を持つ講師を派遣する講師派遣型研修サービスにおいては、市場環
境の変化や顧客ニーズに即した高付加価値サービスの提供を積極的に推進してまいりました。支援型リーダーシッ
プやマネジメント領域の研修需要を確実に獲得するとともに、生成AI活用・導入の支援を本格化させました。
この結果、コンサルティング事業における当中間連結会計期間の売上高は54億73百万円(前年同期比37.1%
増)、営業利益は21億23百万円(同74.9%増)となりました。
(ⅲ)ビジネスソリューション事業
ビジネスソリューション事業は、士業向けコンサルティング、及び企業・士業向けITソリューションの提供等に
なります。
士業向けコンサルティングは、認定支援機関である税理士・公認会計士事務所の対応力向上を支援する「経営革
新等支援機関推進協議会」等となります。当期間においては、税理士・公認会計士の顧問先である中小企業への支
援ニーズや、自事務所の生産性向上に向けた継続的なニーズを背景に、安定的な営業機会を確保しました。特に、
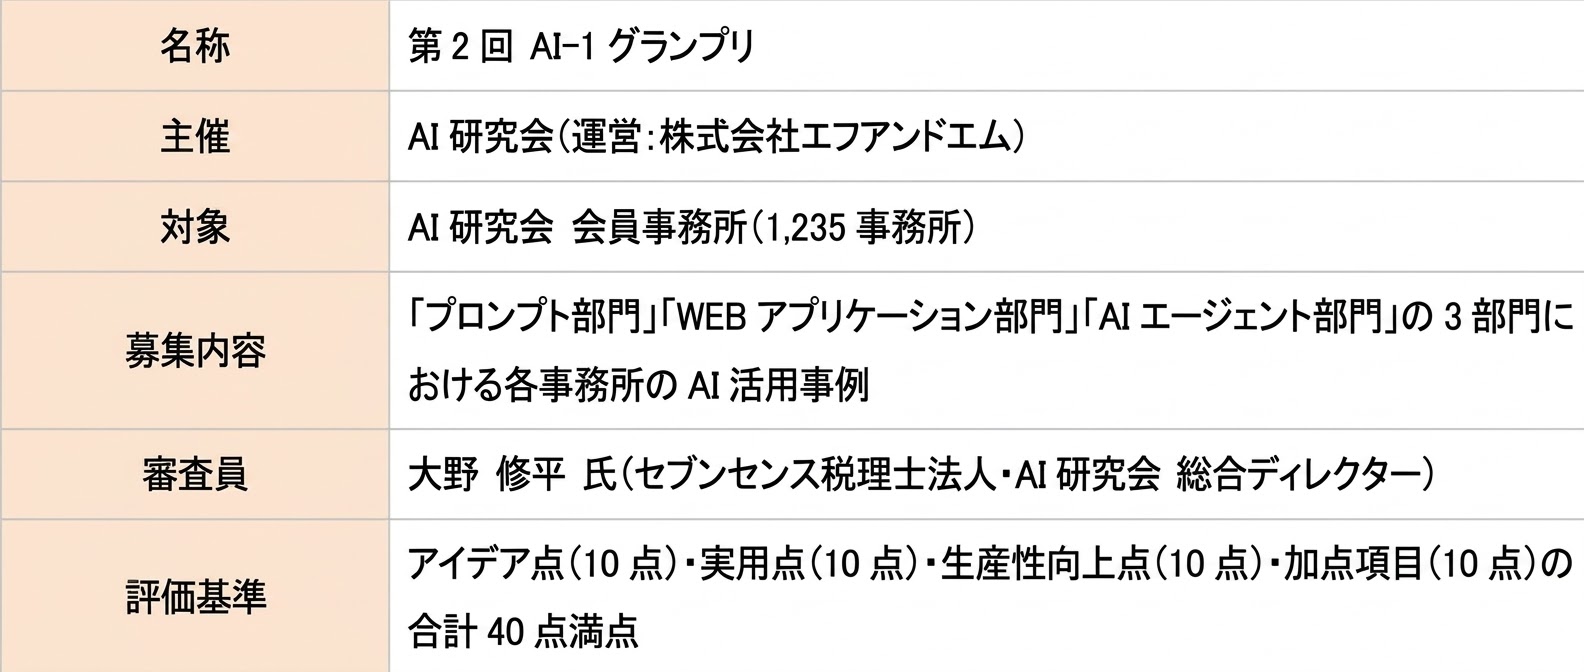
「生成AI勉強会」の開催や、税理士・公認会計士事務所向けの「生成AIプロンプト」の提供など、市場トレンドを
㈱エフアンドエム(4771) 2027年3月期
第2四半期(中間期)決算短信
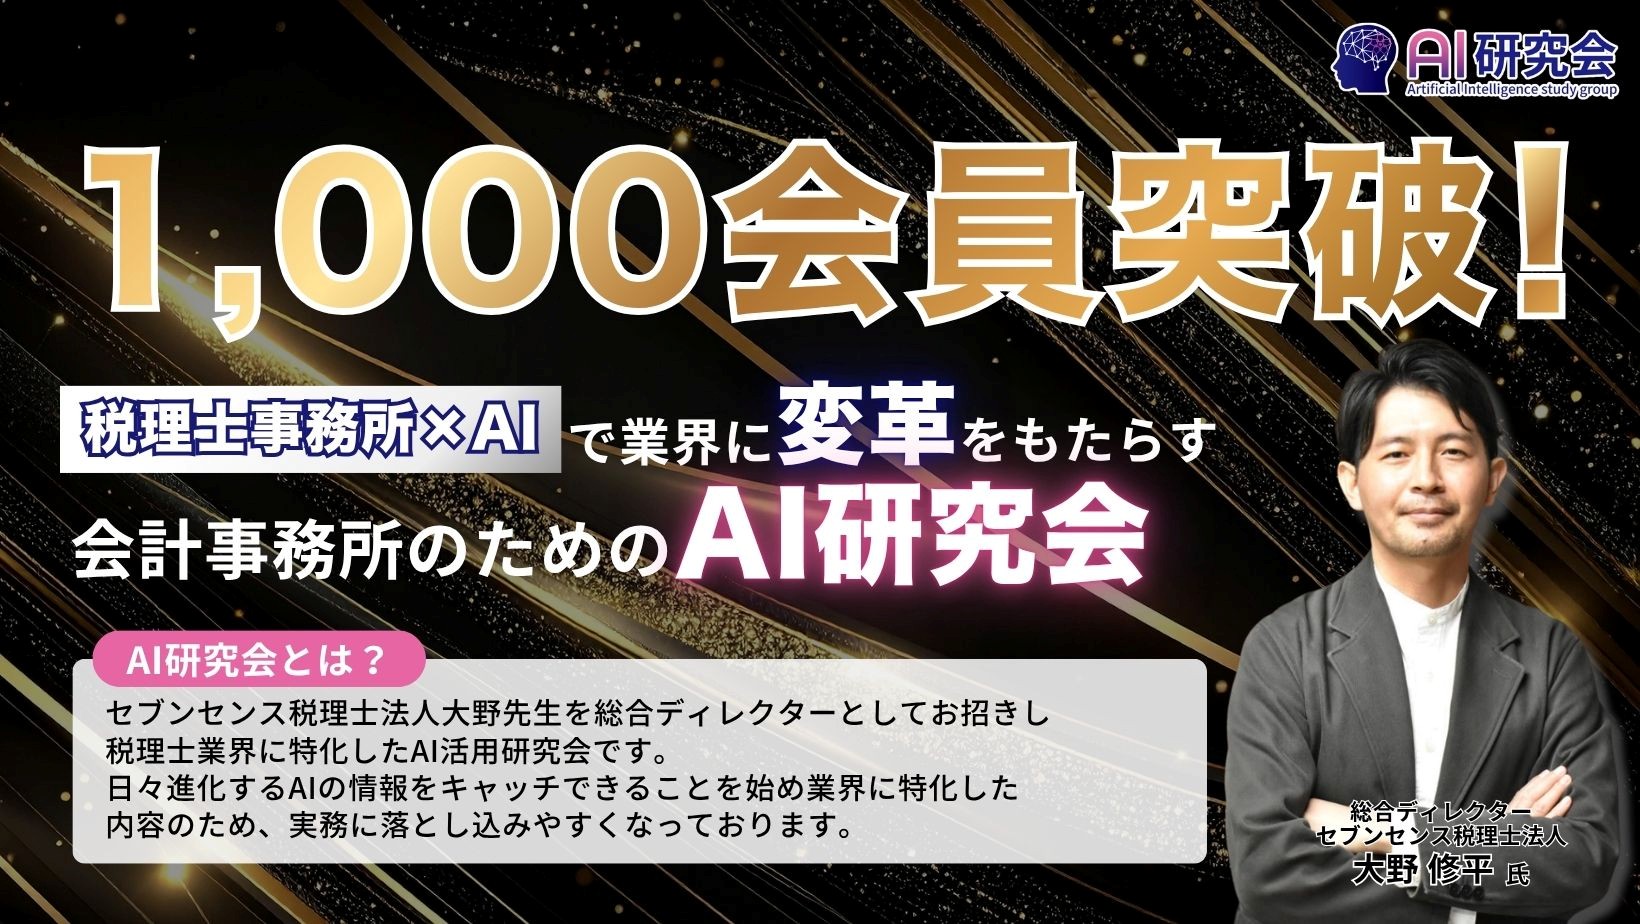
捉えた施策が功を奏し、「AI研究会」への加入が堅調に推移しました。
その結果、当中間連結会計期間末(2026年9月30日)の「経営革新等支援機関推進協議会」等の会員数は2,333
事務所(前期末比238事務所増)となりました。
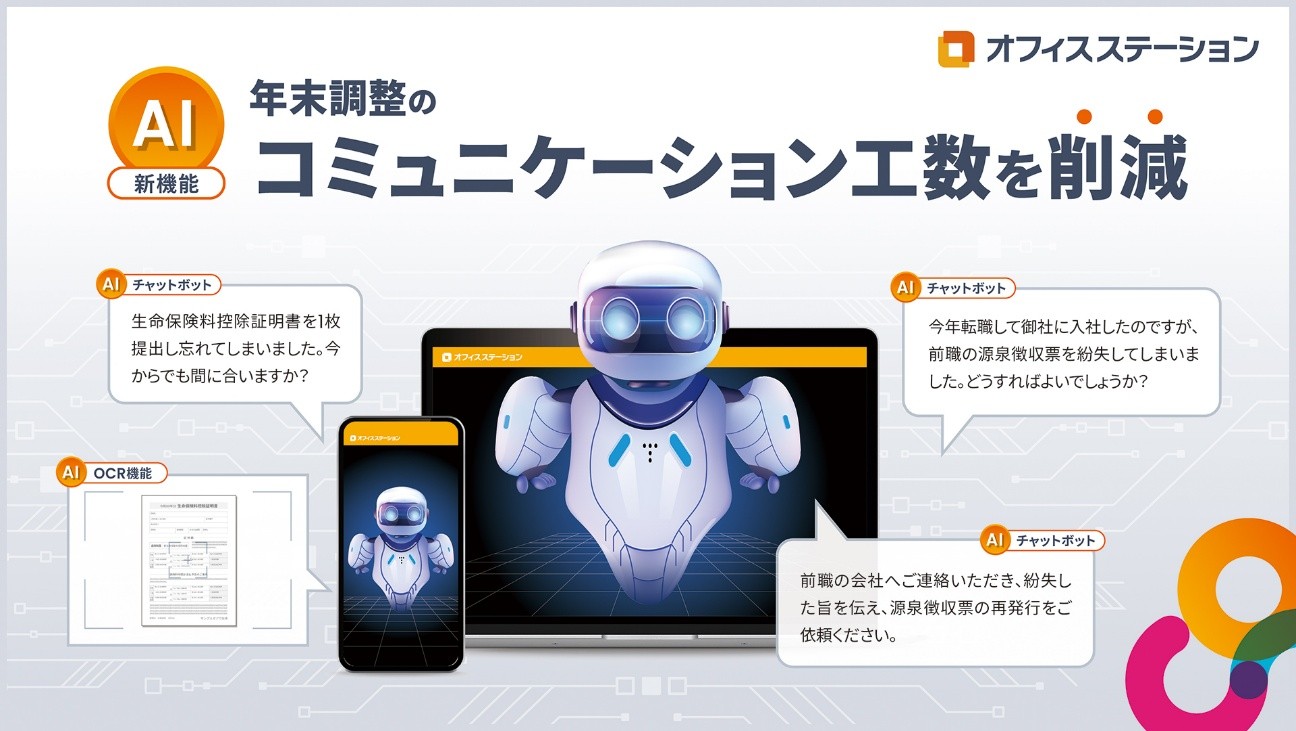
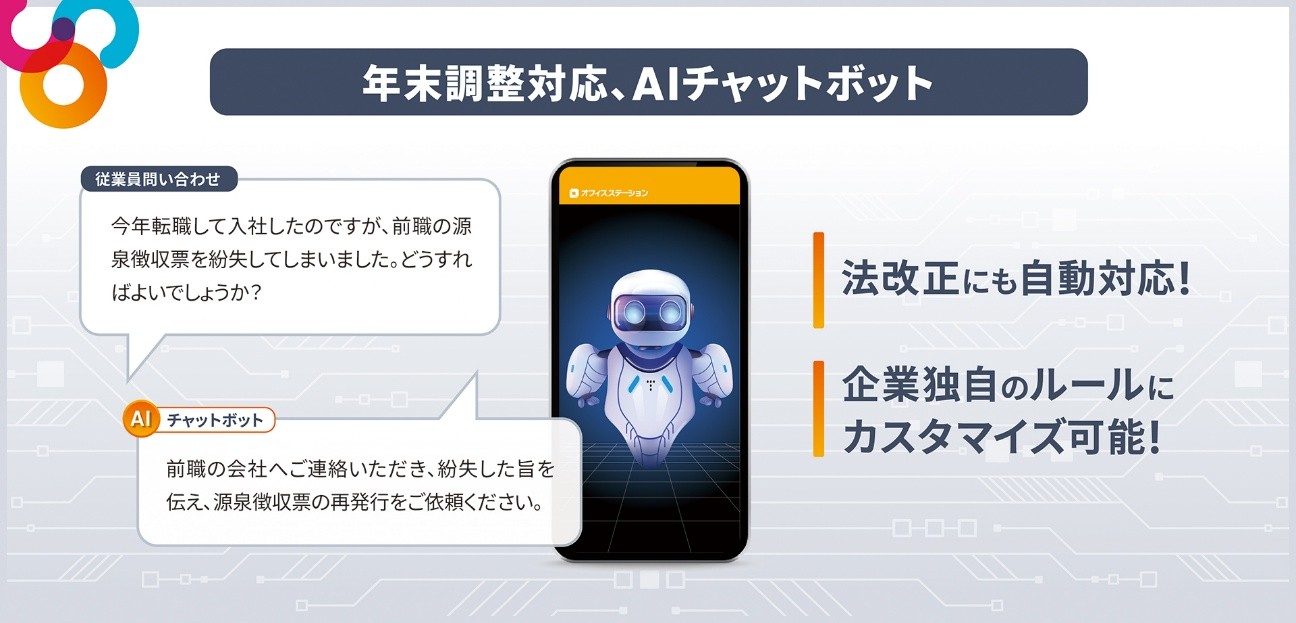
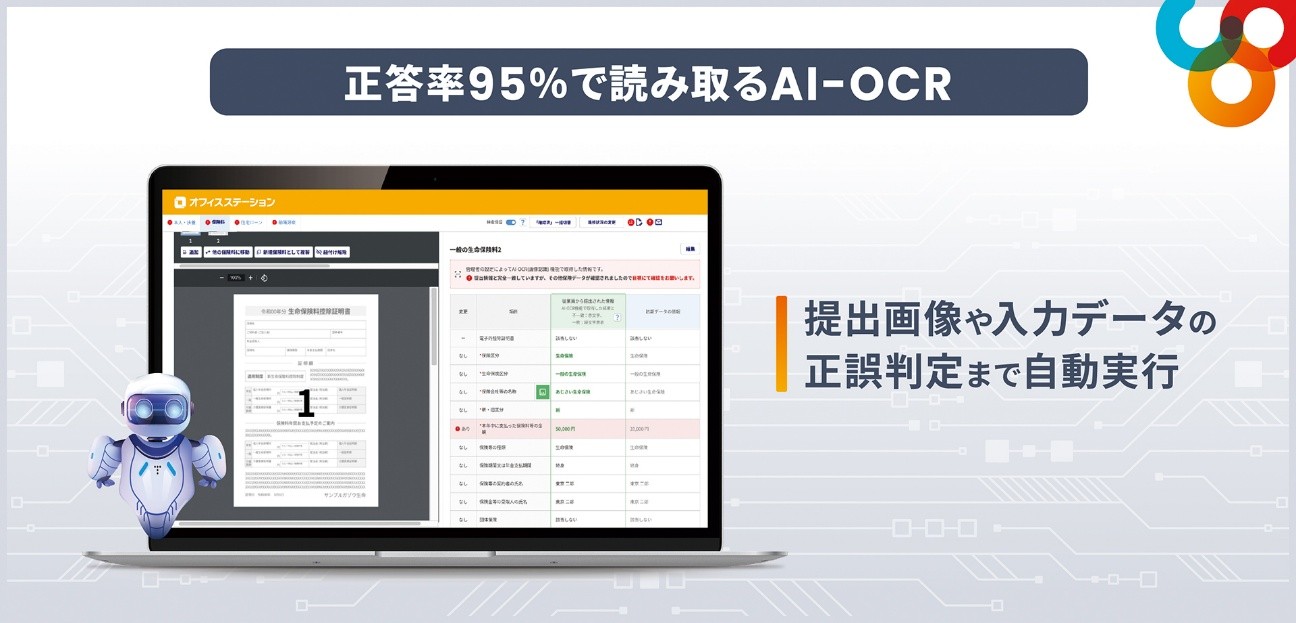
企業・士業向けITソリューションの提供は、人事労務クラウドソフト「オフィスステーション」シリーズの販売
等となります。
顧客獲得に向けたマーケティング活動においては、ターゲット層が多数集まる展示会へ継続して出展しました。
ブース内での個別相談を通じて、今回の展示会出展では市場でのリマインドと購入検討の再開を主眼としました。
また、勤怠・労務管理の効率化といったニーズに加え、「バラバラに契約していた個別SaaSを単一ブランドへ統合
したい」という具体的なニーズを直接吸い上げることができました。こうした明確な課題に対し、「オフィスステ
ーション」による一本化のメリットを訴求した結果、ツール集約を伴う成約金額の大きい商談の創出につながって
おります。
売上高の拡大に向けた営業施策としては、カスタマーサクセス部門が主体となり、既存ユーザーのシステム活用
度に応じた提案活動を展開しました。具体的には、契約企業内での利用従業員数の登録促進に加え、労務・年末調
整・給与明細といったシリーズ製品間のクロスセル提案を強力に実施しました。さらに、フィールドセールスとカ
スタマーサクセスが緊密に連携する体制を構築したことで、顧客のニーズ変化に対してタイムリーな提案が可能と
なり、営業リードタイムの短縮や成約率の向上など、営業プロセス全体の最適化を実現しました。
加えて、契約後のチャーン(解約)防止と契約継続率の維持を目的に、円滑なシステム立ち上げを支援するオン
ボーディング体制の整備に注力しました。また、顧客からの不明点を短時間で解決できるようサポートデスクの要
員拡充やFAQの充実を徹底し、既存ユーザーが安心してシステムを使い続けられるサポート環境の構築に努めまし
た。
その結果、当中間連結会計期間末(2026年9月30日)の「オフィスステーション」シリーズの利用は、無料で提
供している「オフィスステーション 労務ライト」の利用を含み、企業が56,601社(前期末比3,932社増)、士業が
3,839事務所(前期末比173事務所増)となりました。
この結果、ビジネスソリューション事業における当中間連結会計期間の売上高は33億65百万円(前年同期比
30.7%増)、営業損失は98百万円(前年同期は160百万円の営業損失)となりました。
(ⅳ)不動産賃貸事業
不動産賃貸事業は当社が所有するビルの賃貸収入で、安定した収益を計上しております。当中間連結会計期間の
売上高は54百万円(前年同期比1.6%増)、営業利益は13百万円(同5.2%増)となりました。
(ⅴ)システム開発事業
システム開発事業は、連結子会社エフアンドエムネット株式会社のシステム開発事業等になります。エフアンド
エムネットでは、「オフィスステーション」シリーズを中心としたエフアンドエムが販売する商品などのグループ
内向け開発が大部分を占めました。
この結果、システム開発事業における当中間連結会計期間の売上高は1億57百万円(前年同期比10.2%増)、63
百万円の営業損失(前年同期は171百万円の営業損失)となりました。
(ⅵ)その他事業
その他事業は、パソコン教室の本部運営及びFC指導事業等になります。同事業においては、経営資源の最適配分
および事業ポートフォリオの見直しの一環として、受講生への対応を継続しつつ、順次閉校に伴う事業の縮小を進
めてまいりました。
この結果、その他事業における当中間連結会計期間の売上高は20百万円(前年同期比32.5%減)、営業損失は4
百万円(前年同期は2百万円の営業利益)となりました。
(2)当中間期の財政状態の概況
(資産)
当中間連結会計期間末における流動資産は88億88百万円となり、前連結会計年度末に比べ1億52百万円増加しま
した。これは主に売掛金及び契約資産が5億41百万円、その他(流動資産)が1億73百万円増加した一方、現金及
び預金が4億66百万円、有価証券が1億円減少したことなどによるものです。
固定資産は130億53百万円となり、前連結会計年度末に比べ11億47百万円増加しました。これは主にその他(無
形固定資産)が9億50百万円、繰延税金資産が1億42百万円増加したことなどによるものです。
この結果、総資産は219億41百万円となり、前連結会計年度末に比べ12億99百万円増加しました。
㈱エフアンドエム(4771) 2027年3月期
第2四半期(中間期)決算短信
(負債)
当中間連結会計期間末における流動負債は53億93百万円となり、前連結会計年度末に比べ3億56百万円増加しま
した。これは主に契約負債が1億22百万円、賞与引当金が3億93百万円増加した一方、その他(流動負債)が1億
22百万円減少したことなどによるものです。
固定負債は1億88百万円となり、前連結会計年度末に比べ7百万円増加しました。
この結果、負債合計は55億81百万円となり、前連結会計年度末に比べ3億63百万円増加しました。
(純資産)
当中間連結会計期間末における純資産合計は163億59百万円となり、前連結会計年度末に比べ9億36百万円増加
しました。これは主に親会社株主に帰属する中間純利益13億81百万円が計上された一方、剰余金の配当を4億43百
万円行ったことなどによるものです。
この結果、自己資本比率は74.6%(前連結会計年度末は74.7%)となりました。
なお、特筆すべき重要な資本的支出の予定及びそれに伴う資金の調達は当面ありません。
(3)連結業績予想などの将来予測情報に関する説明
通期の連結業績予想につきましては、当中間連結会計期間における好調な業績進捗を反映した形で2026年10月29
日に上方修正を行いました。同日に「業績予想の修正に関するお知らせ」で公表いたしました通期の連結業績予想
から変更ありません。
なお、本資料に記載されている業績見通し等の将来に関する記述は、当社が現在入手している情報及び合理的で
あると判断する一定の前提に基づいており、実際の業績等は様々な要因により大きく異なる可能性があります。
㈱エフアンドエム(4771) 2027年3月期
第2四半期(中間期)決算短信
2.中間連結財務諸表及び主な注記
(1)中間連結貸借対照表
(単位:千円)
前連結会計年度
(2026年3月31日)
資産の部
流動資産
現金及び預金
売掛金及び契約資産
有価証券
商品及び製品
仕掛品
原材料及び貯蔵品
その他
貸倒引当金
流動資産合計
固定資産
有形固定資産
建物及び構築物(純額)
工具、器具及び備品(純額)
土地
有形固定資産合計
無形固定資産
のれん
ソフトウエア
その他
無形固定資産合計
投資その他の資産
投資有価証券
繰延税金資産
滞留債権
差入保証金
保険積立金
その他
貸倒引当金
投資その他の資産合計
固定資産合計
資産合計
当中間連結会計期間
(2026年9月30日)
6,740,850
1,644,323
100,000
2,104
53
5,733
281,363
△38,425
8,736,003
6,274,826
2,185,464
-
2,403
20,465
5,354
454,589
△54,825
8,888,277
1,285,577
220,833
1,281,627
2,788,037
1,260,141
287,523
1,281,627
2,829,291
8
6,387,715
489,128
6,876,853
8
6,447,452
1,439,206
7,886,667
898,837
615,767
122,857
153,432
514,642
20,501
△84,818
2,241,220
11,906,110
20,642,114
898,380
758,615
103,174
139,535
506,276
20,218
△88,521
2,337,679
13,053,638
21,941,916
㈱エフアンドエム(4771) 2027年3月期
第2四半期(中間期)決算短信
(単位:千円)
前連結会計年度
(2026年3月31日)
負債の部
流動負債
買掛金
契約負債
未払法人税等
賞与引当金
その他
流動負債合計
固定負債
退職給付に係る負債
負ののれん
その他
固定負債合計
負債合計
純資産の部
株主資本
資本金
資本剰余金
利益剰余金
自己株式
株主資本合計
その他の包括利益累計額
その他有価証券評価差額金
その他の包括利益累計額合計
純資産合計
負債純資産合計
当中間連結会計期間
(2026年9月30日)
9,521
1,059,953
893,023
1,060,540
2,014,727
5,037,767
8,805
1,182,552
855,583
1,454,233
1,892,663
5,393,838
115,901
189
64,812
180,903
5,218,670
123,209
99
64,812
188,122
5,581,960
989,650
2,467,459
12,157,719
△223,828
15,391,000
989,650
2,467,459
13,095,298
△224,038
16,328,369
32,442
32,442
15,423,443
20,642,114
31,586
31,586
16,359,955
21,941,916
㈱エフアンドエム(4771) 2027年3月期
第2四半期(中間期)決算短信
(2)中間連結損益計算書及び中間連結包括利益計算書
(中間連結損益計算書)
(単位:千円)
前中間連結会計期間
(自 2025年4月1日
至 2025年9月30日)
売上高
売上原価
売上総利益
販売費及び一般管理費
営業利益
営業外収益
受取利息
有価証券利息
受取配当金
受取手数料
助成金収入
除斥配当金受入益
その他
営業外収益合計
経常利益
特別利益
固定資産売却益
保険解約返戻金
特別利益合計
特別損失
固定資産除却損
保険解約損
特別損失合計
税金等調整前中間純利益
法人税、住民税及び事業税
法人税等調整額
法人税等合計
中間純利益
親会社株主に帰属する中間純利益
当中間連結会計期間
(自 2026年4月1日
至 2026年9月30日)
8,956,382
3,021,988
5,934,394
4,997,304
937,089
11,458,609
3,951,348
7,507,261
5,509,986
1,997,274
7,806
6,793
1,248
-
2,071
372
3,097
21,389
958,479
18,704
6,897
1,285
3,831
114
451
791
32,076
2,029,351
28
-
28
-
3,535
3,535
0
-
0
958,507
465,510
△154,570
310,939
647,567
647,567
8
1,232
1,240
2,031,645
792,614
△142,322
650,292
1,381,353
1,381,353
㈱エフアンドエム(4771) 2027年3月期
第2四半期(中間期)決算短信
(中間連結包括利益計算書)
(単位:千円)
前中間連結会計期間
(自 2025年4月1日
至 2025年9月30日)
中間純利益
その他の包括利益
その他有価証券評価差額金
その他の包括利益合計
中間包括利益
(内訳)
親会社株主に係る中間包括利益
当中間連結会計期間
(自 2026年4月1日
至 2026年9月30日)
647,567
1,381,353
477
477
648,045
△856
△856
1,380,497
648,045
1,380,497
㈱エフアンドエム(4771) 2027年3月期
第2四半期(中間期)決算短信
(3)中間連結財務諸表に関する注記事項
(セグメント情報等の注記)
Ⅰ
【セグメント情報】
前中間連結会計期間(自
2025年4月1日
至
2025年9月30日)
1.報告セグメントごとの売上高及び利益又は損失の金額に関する情報
(単位:千円)
報告セグメント
アカウンテ コンサル ビジネスソ
不動産賃貸 システム開
ィングサー ティング リューショ
事業
発事業
ビス事業
事業
ン事業
計
その他
(注)
合計
売上高
外部顧客への売上高 2,161,653 3,993,163 2,575,069
セグメント間の内部
-
売上高又は振替高
1,620
53,279
1,276
計
2,161,653 3,994,783 2,576,346
セグメント利益又は損
失(△)
579,136 1,214,647 △160,811
142,600
8,925,766
30,615
8,956,382
4,350 1,116,101
1,123,348
3,067
1,126,415
57,629 1,258,701 10,049,115
33,682 10,082,798
12,370 △171,551
2,919
1,473,792
1,476,711
(注)「その他」の区分は、報告セグメントに含まれない事業セグメントであり、パソコン教室の運営及び
FC指導事業等を含んでおります。
2.報告セグメントの利益又は損失の金額の合計額と中間連結損益計算書計上額との差額及び当該差額の主な
内容(差異調整に関する事項)
(単位:千円)
利益
金額
報告セグメント計
1,473,792
「その他」の区分の利益
2,919
セグメント間取引消去
△2,485
のれんの償却額
△1
全社費用(注)
△608,280
固定資産の調整額
71,146
中間連結損益計算書の営業利益
937,089
(注)全社費用は、主に報告セグメントに帰属しない一般管理費であります。
㈱エフアンドエム(4771) 2027年3月期
Ⅱ
当中間連結会計期間(自
2026年4月1日
至
第2四半期(中間期)決算短信
2026年9月30日)
1.報告セグメントごとの売上高及び利益又は損失の金額に関する情報
(単位:千円)
報告セグメント
アカウンテ コンサル ビジネスソ
不動産賃貸 システム開
ィングサー ティング リューショ
事業
発事業
ビス事業
事業
ン事業
計
その他
(注)
合計
売上高
外部顧客への売上高 2,387,860 5,473,477 3,365,409
54,108
セグメント間の内部
売上高又は振替高
4,350 1,784,981
計
-
1,365
1,278
2,387,860 5,474,843 3,366,688
セグメント利益又は損
失(△)
695,042 2,123,952
△98,545
157,102 11,437,958
1,791,975
20,651 11,458,609
3,067
1,795,042
58,458 1,942,083 13,229,933
23,718 13,253,652
13,012
△4,400
△63,326
2,670,133
2,665,733
(注)「その他」の区分は、報告セグメントに含まれない事業セグメントであり、パソコン教室の運営及び
FC指導事業等を含んでおります。
2.報告セグメントの利益又は損失の金額の合計額と中間連結損益計算書計上額との差額及び当該差額の主な
内容(差異調整に関する事項)
(単位:千円)
利益
金額
報告セグメント計
2,670,133
「その他」の区分の損失
△4,400
セグメント間取引消去
△4,636
のれんの償却額
△0
全社費用(注)
△712,353
固定資産の調整額
48,531
中間連結損益計算書の営業利益
1,997,274
(注)全社費用は、主に報告セグメントに帰属しない一般管理費であります。
3.報告セグメントの変更等に関する事項
これまで「アカウンティングサービス事業」セグメントに含めておりましたBPO事業について、今後の事
業展開等を踏まえて管理区分を見直した結果、第1四半期連結会計期間より「ビジネスソリューション事
業」セグメントに区分変更いたしました。
なお、前中間連結会計期間のセグメント情報は、当中間連結会計期間の報告セグメントの区分に基づき作
成したものを開示しております。
㈱エフアンドエム(4771) 2027年3月期
(株主資本の金額に著しい変動があった場合の注記)
該当事項はありません。
(継続企業の前提に関する注記)
該当事項はありません。
第2四半期(中間期)決算短信