|
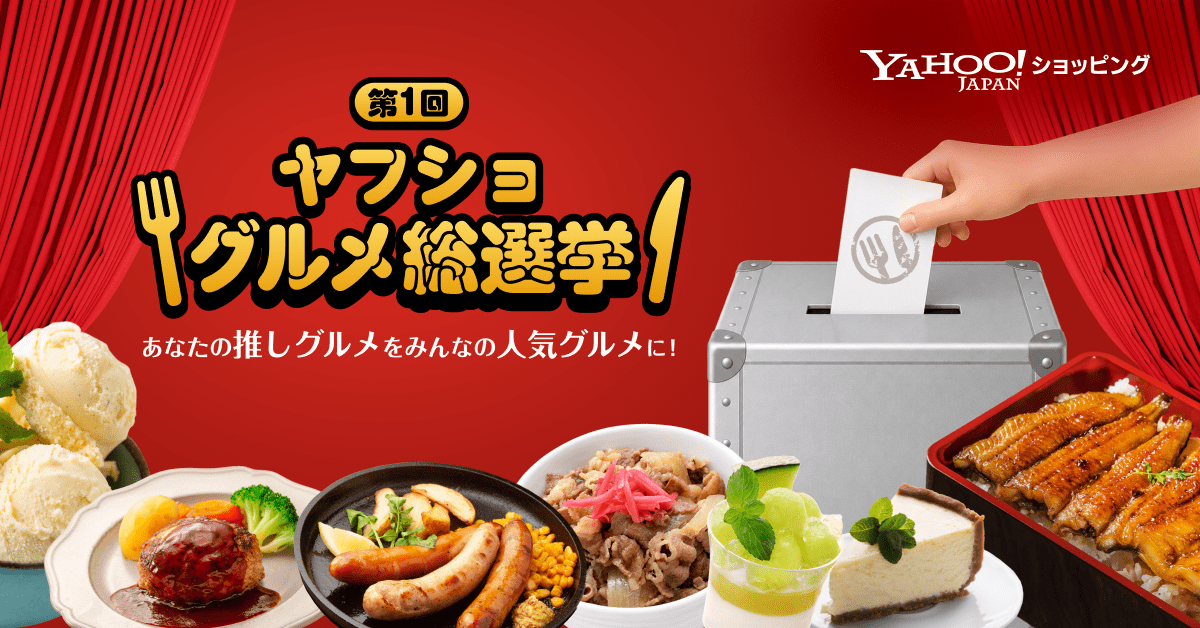
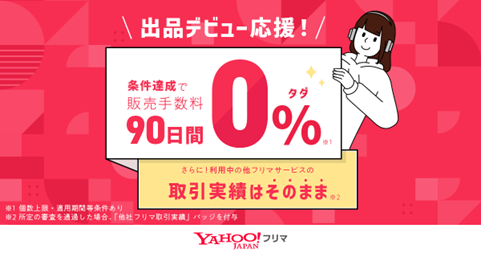
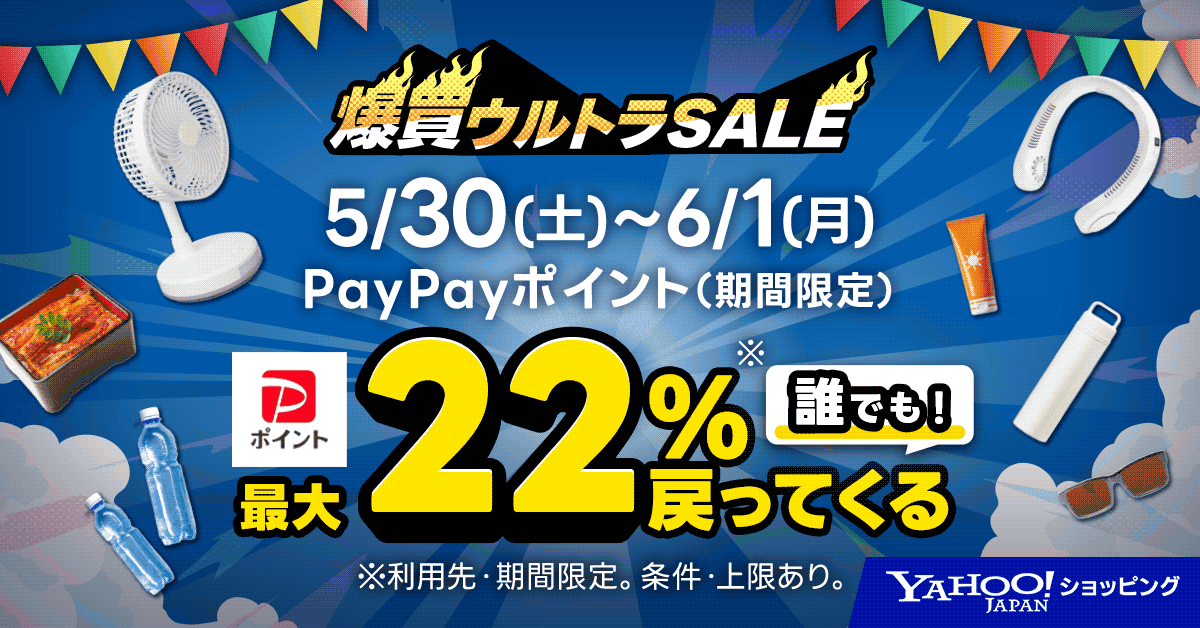
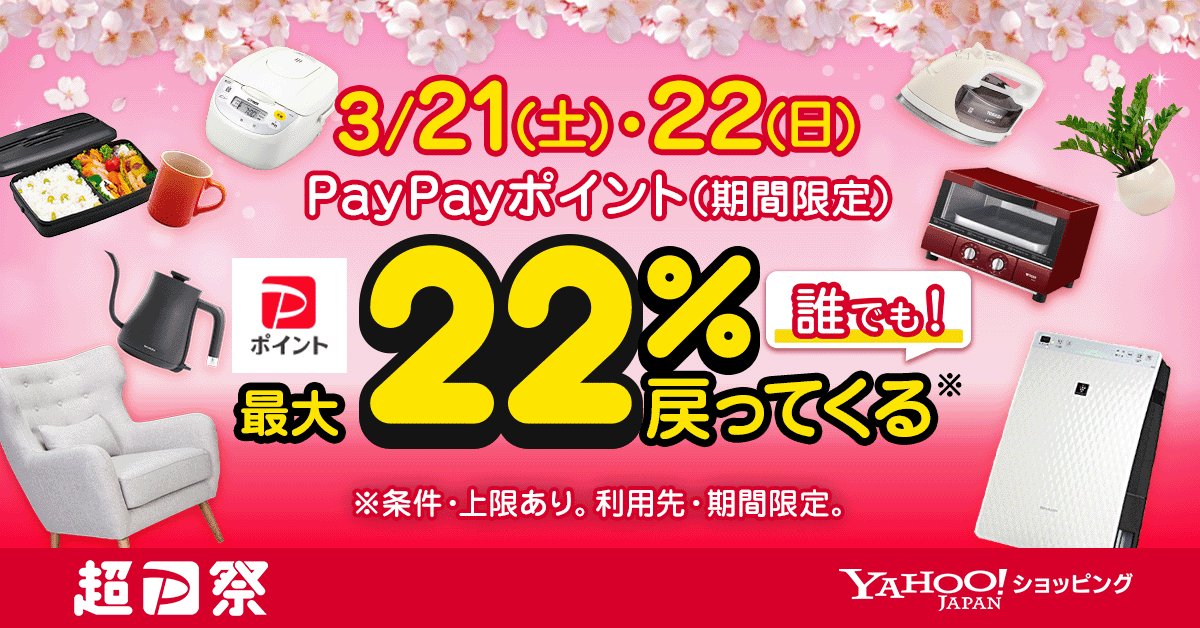
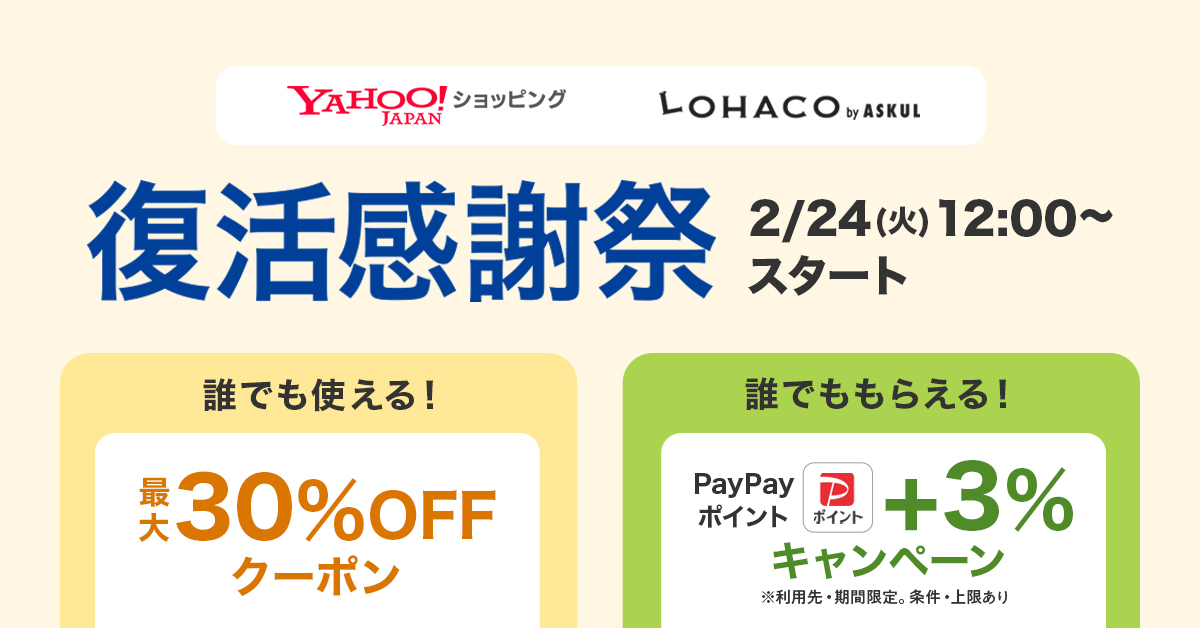
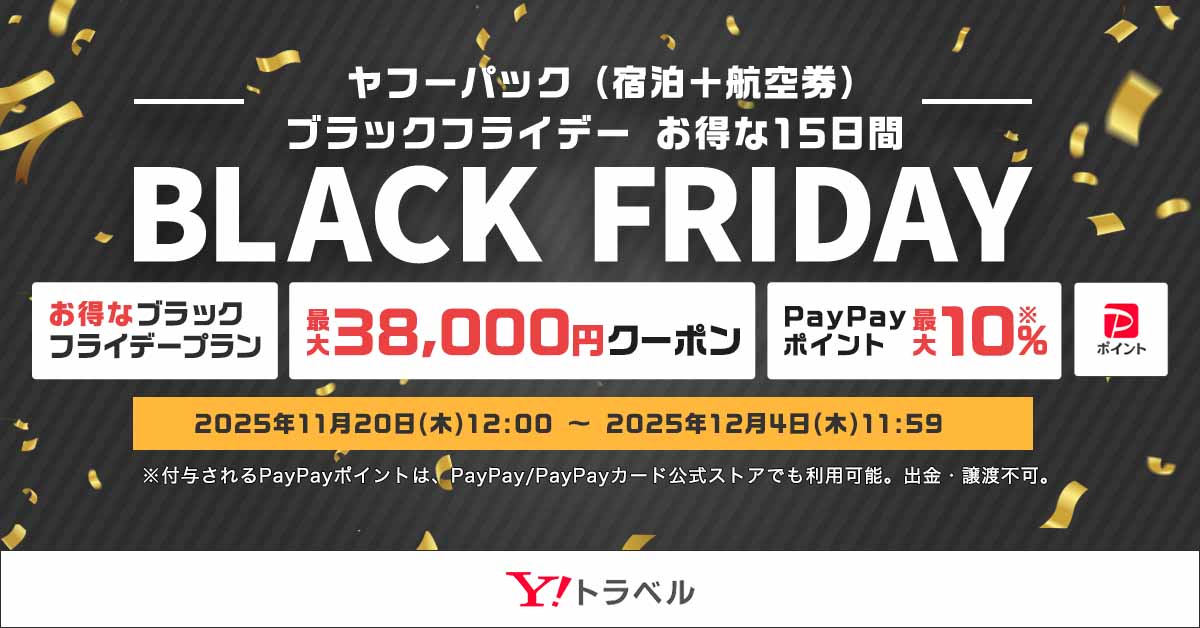
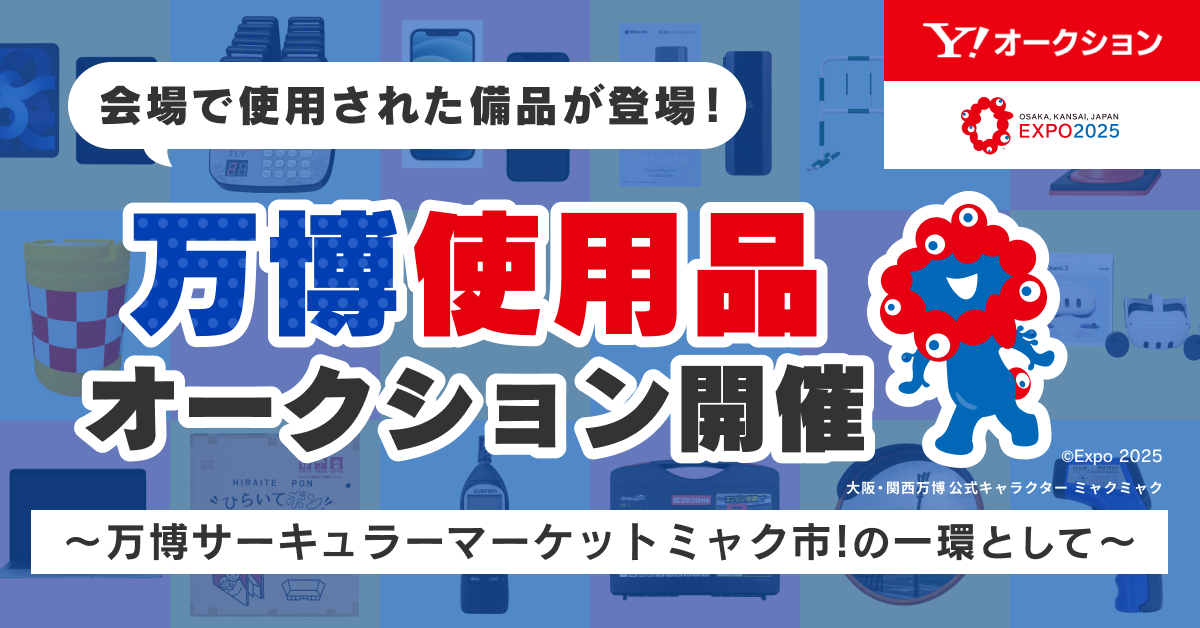
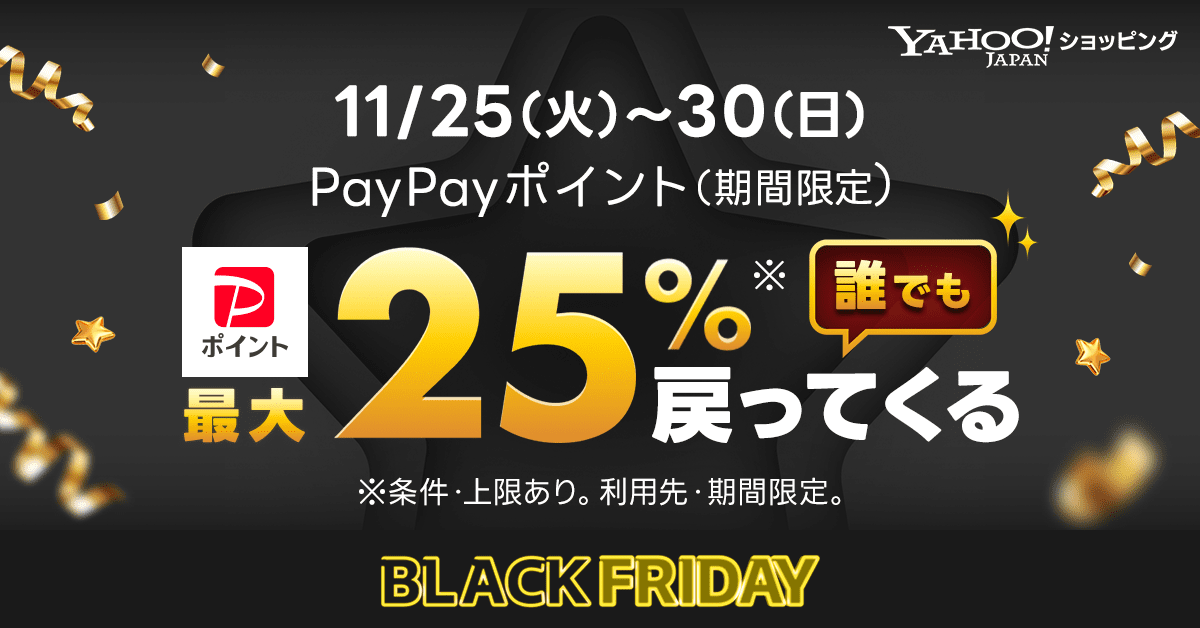
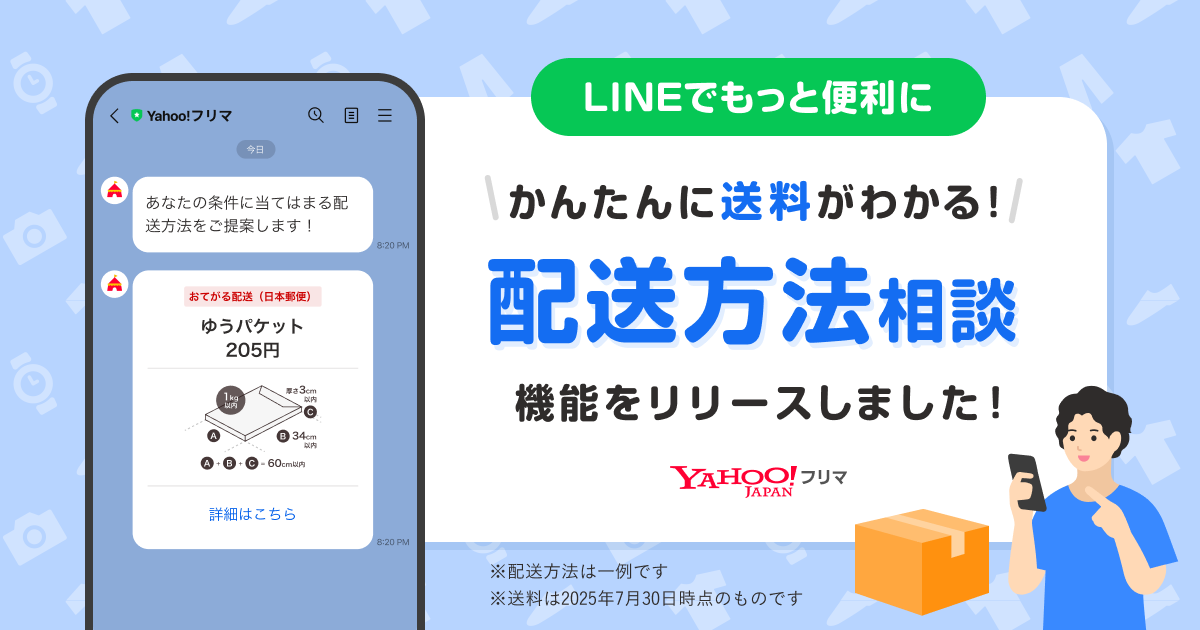
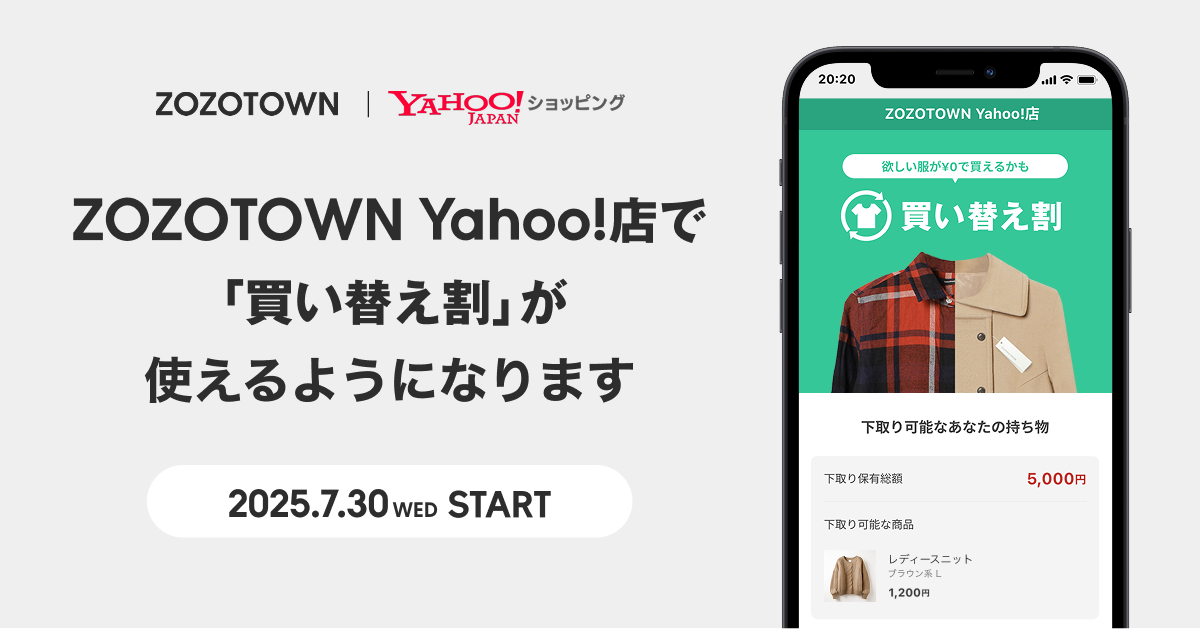
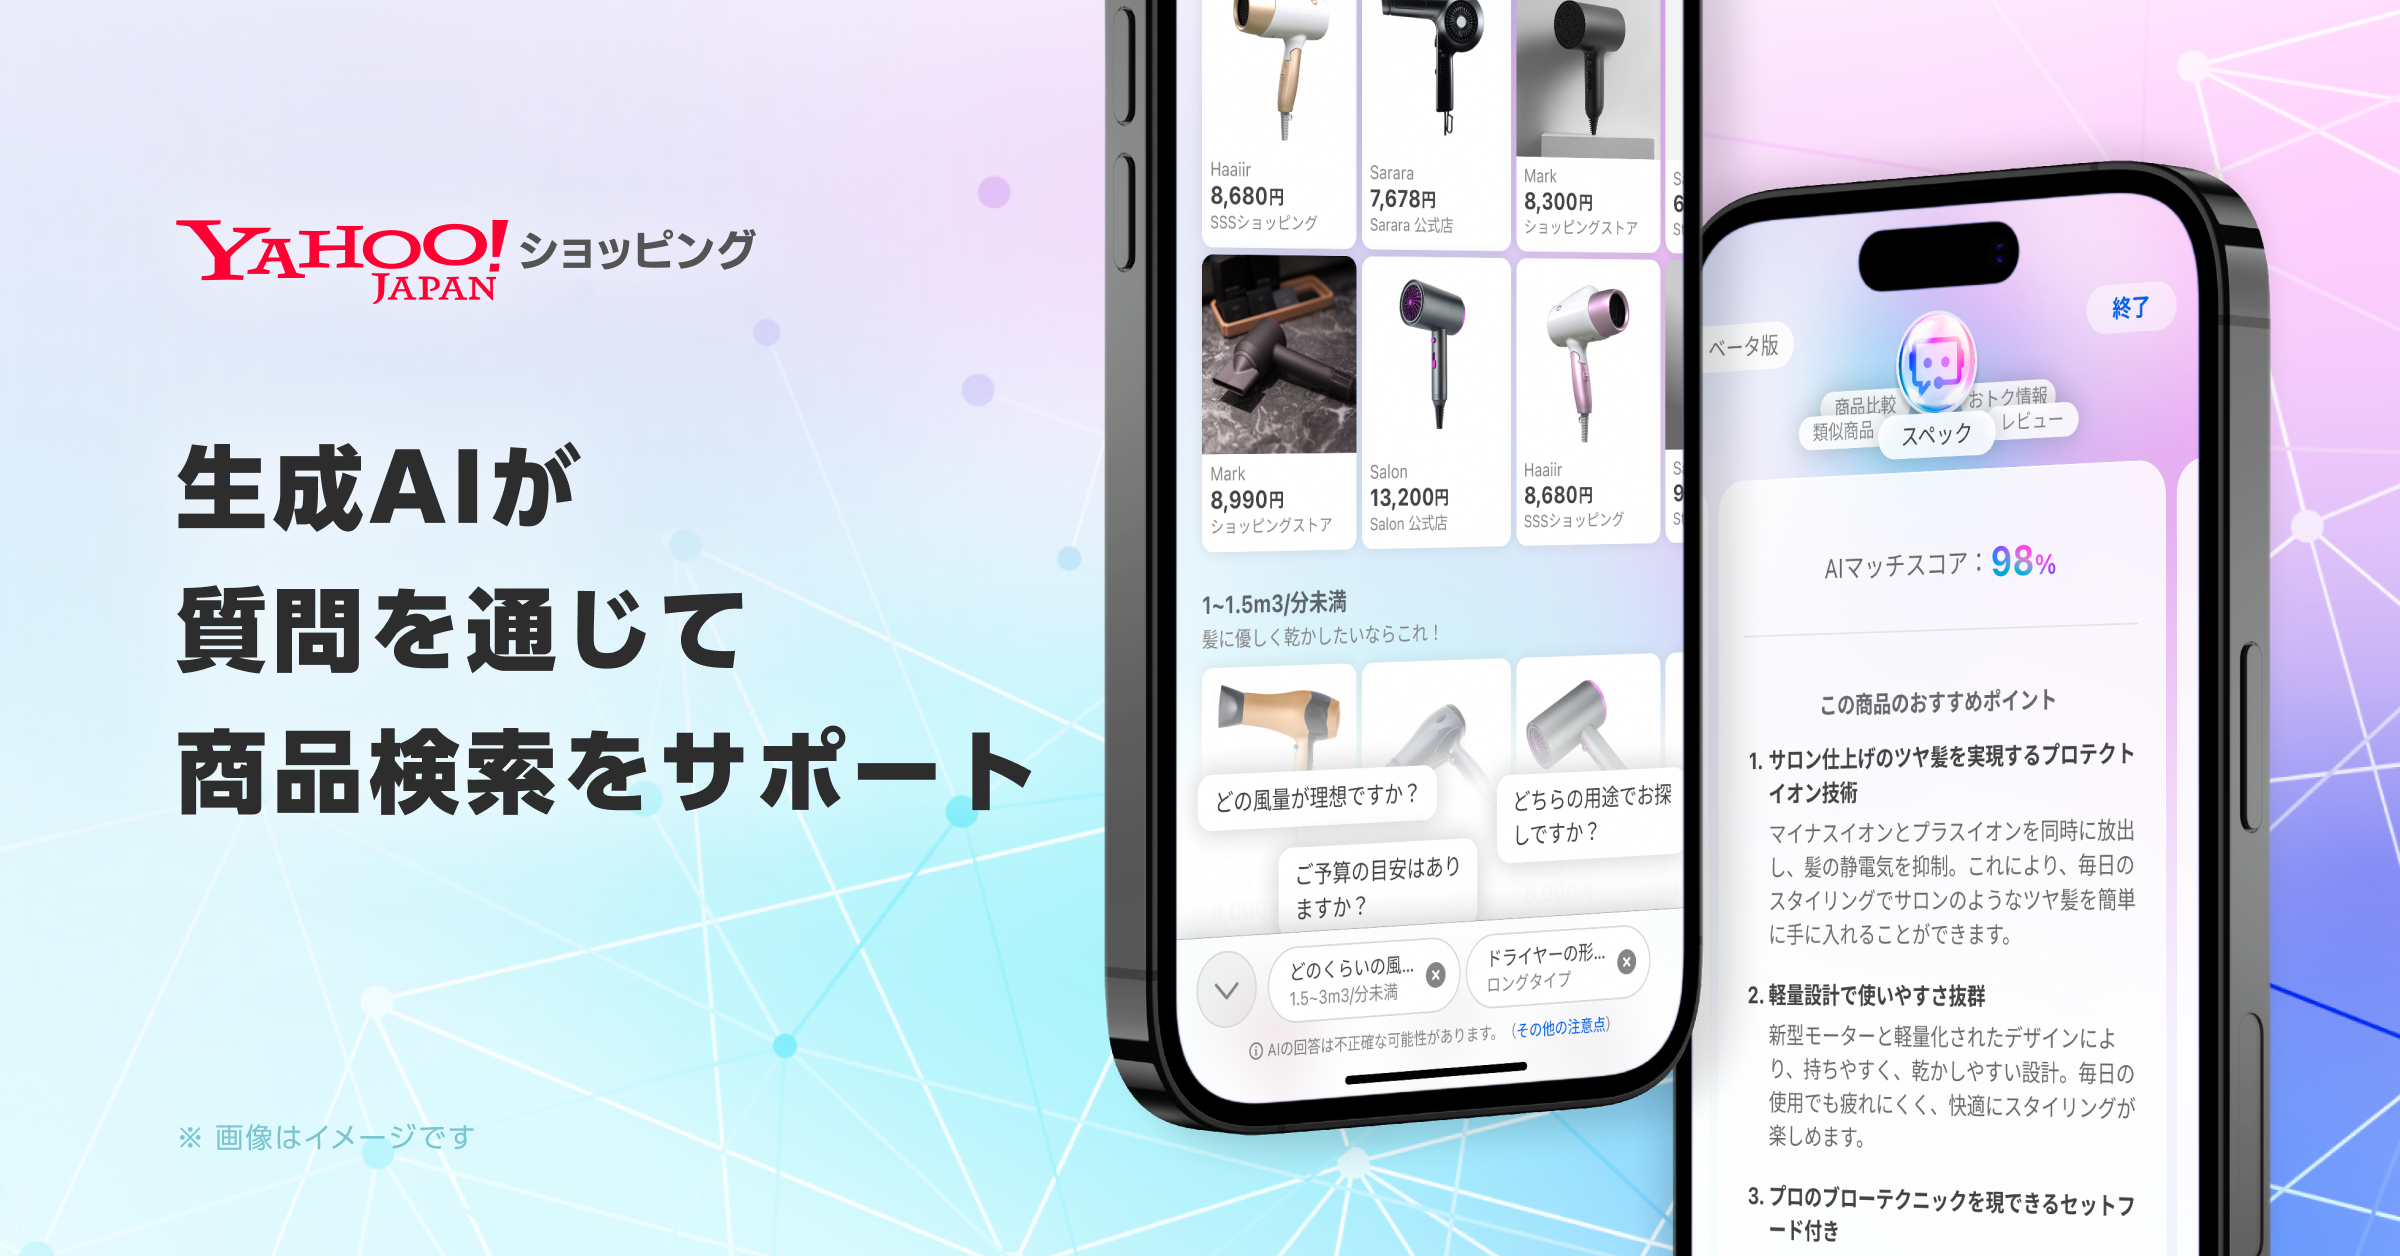
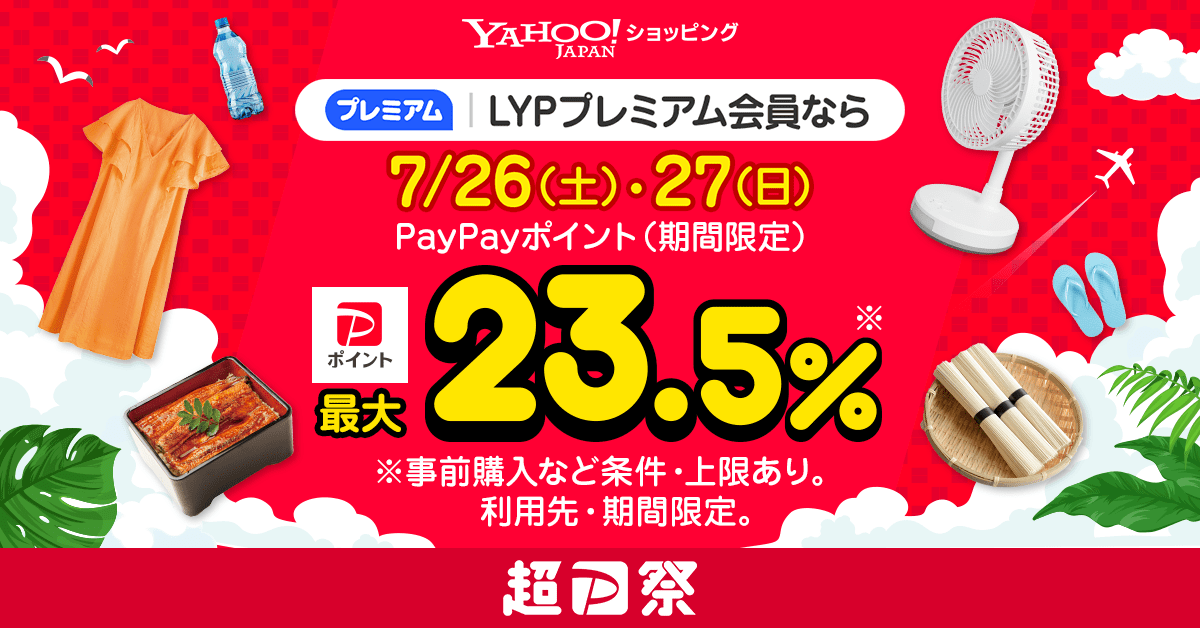
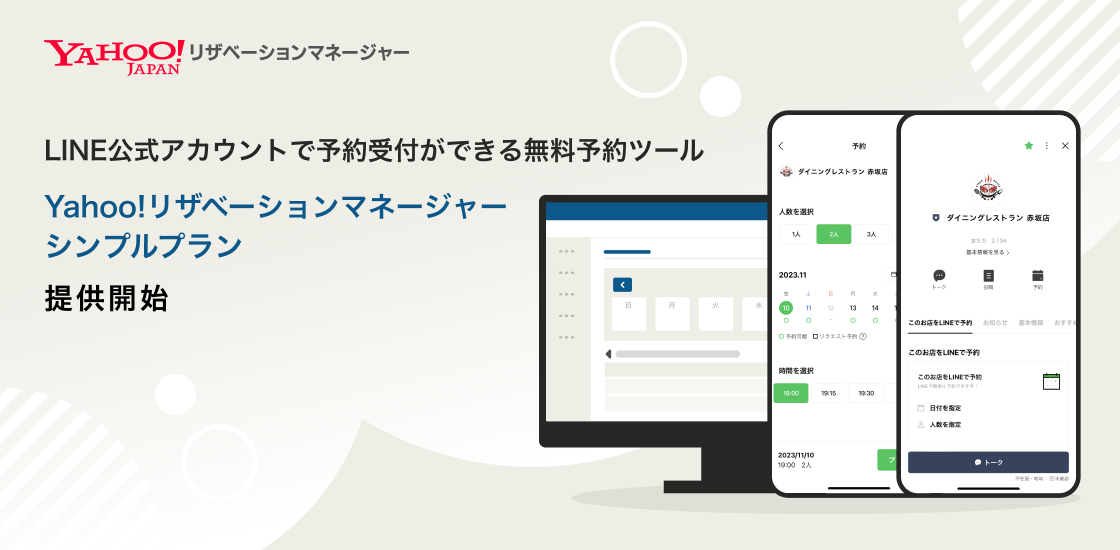
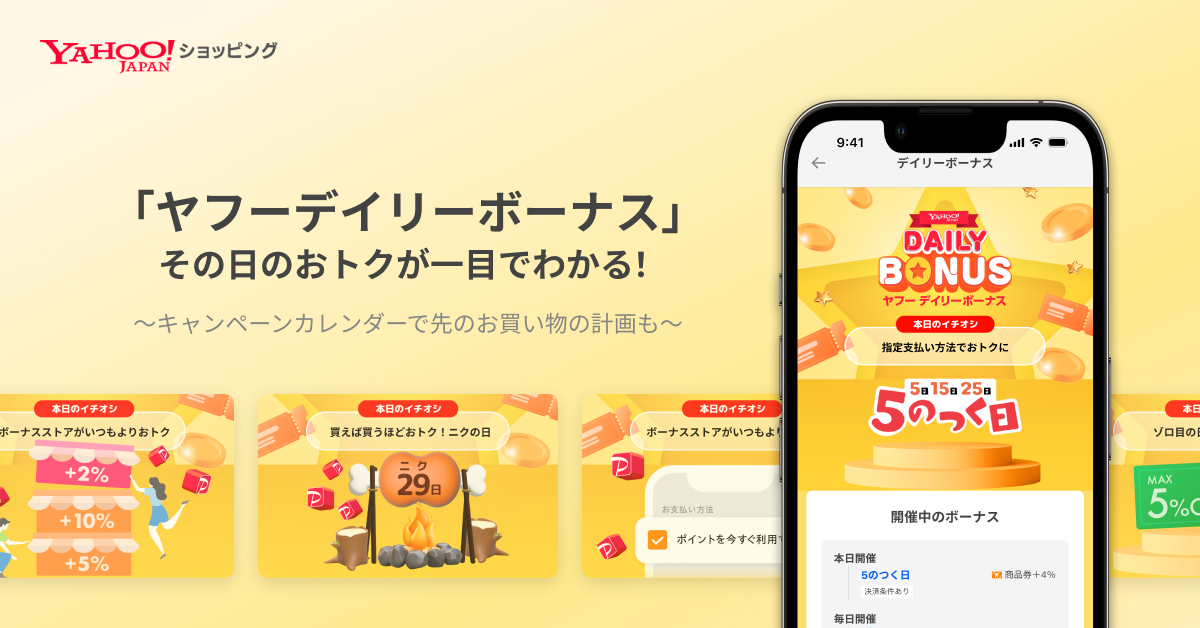
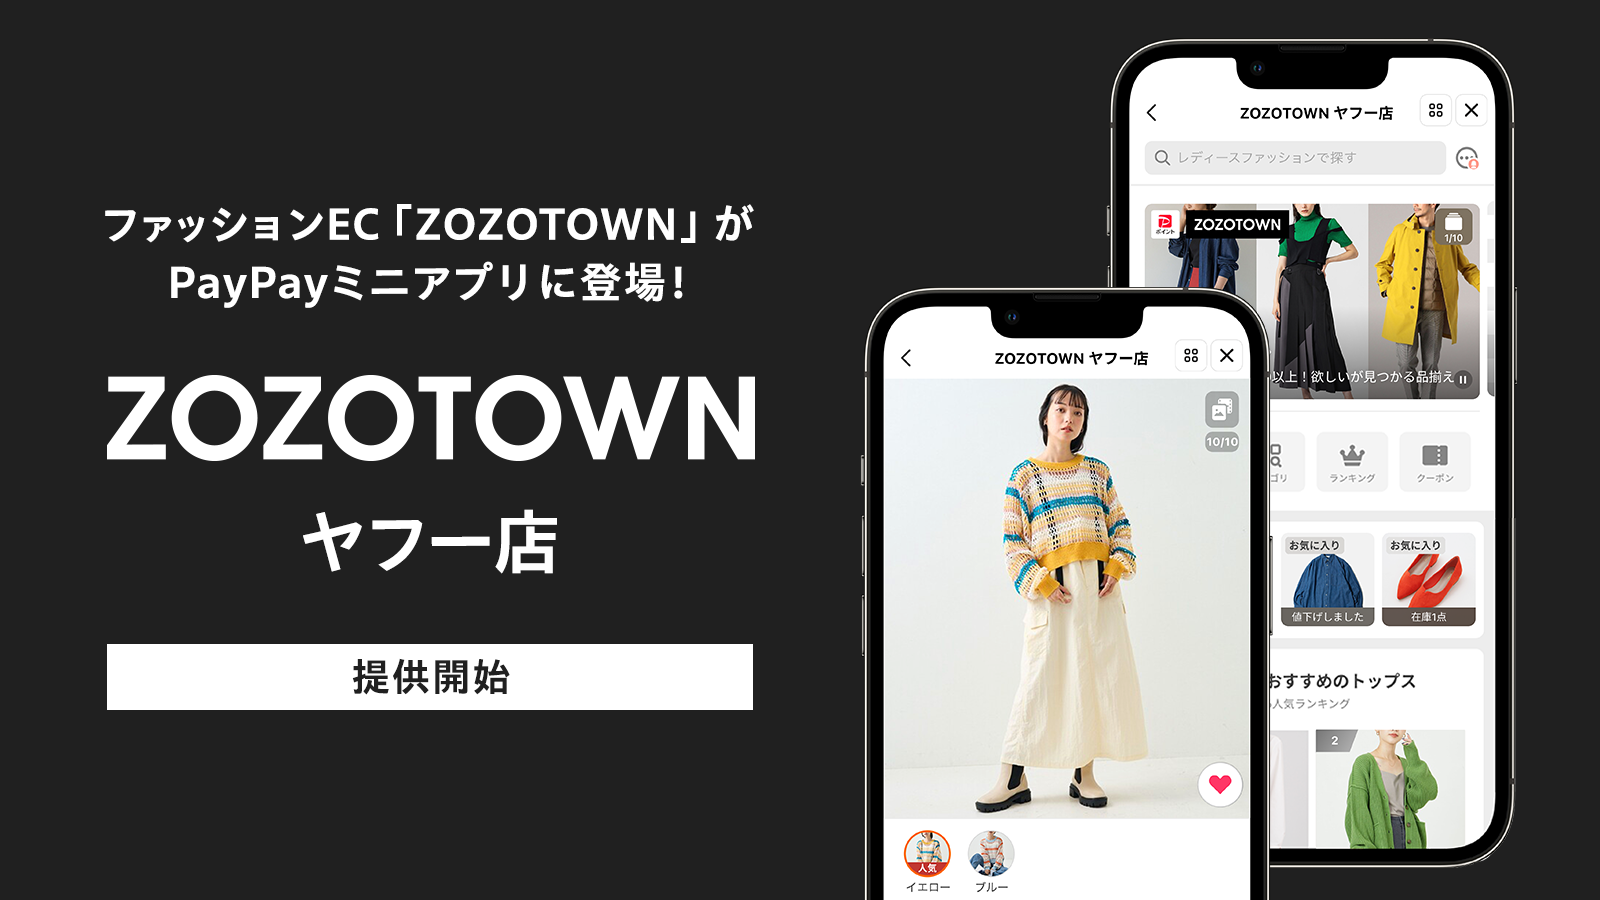
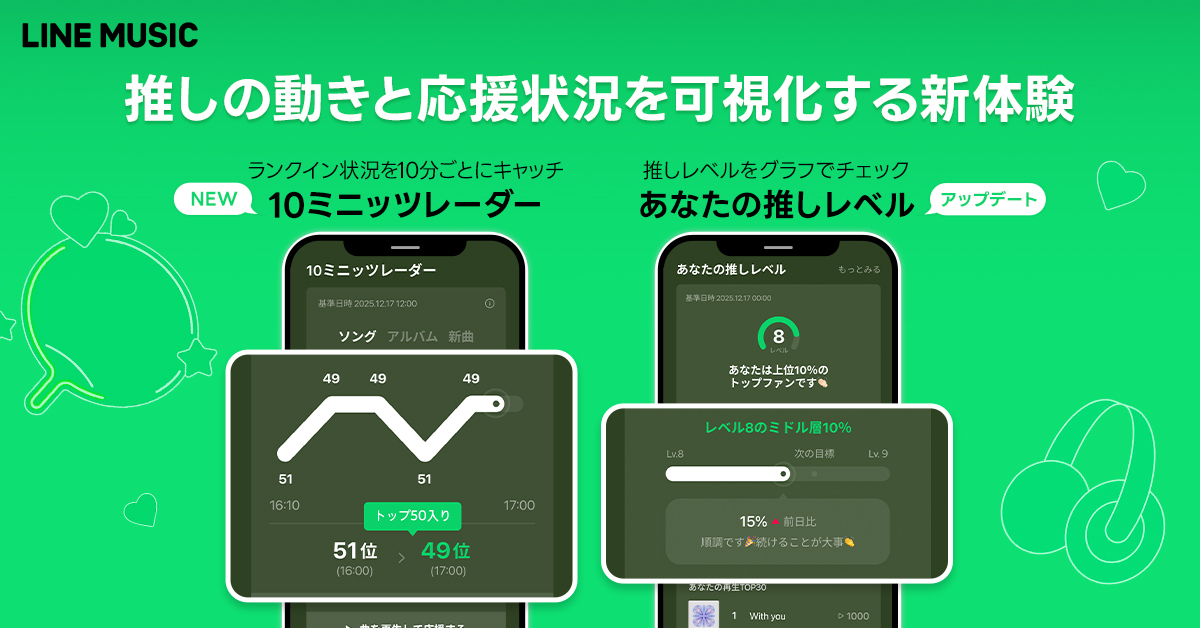
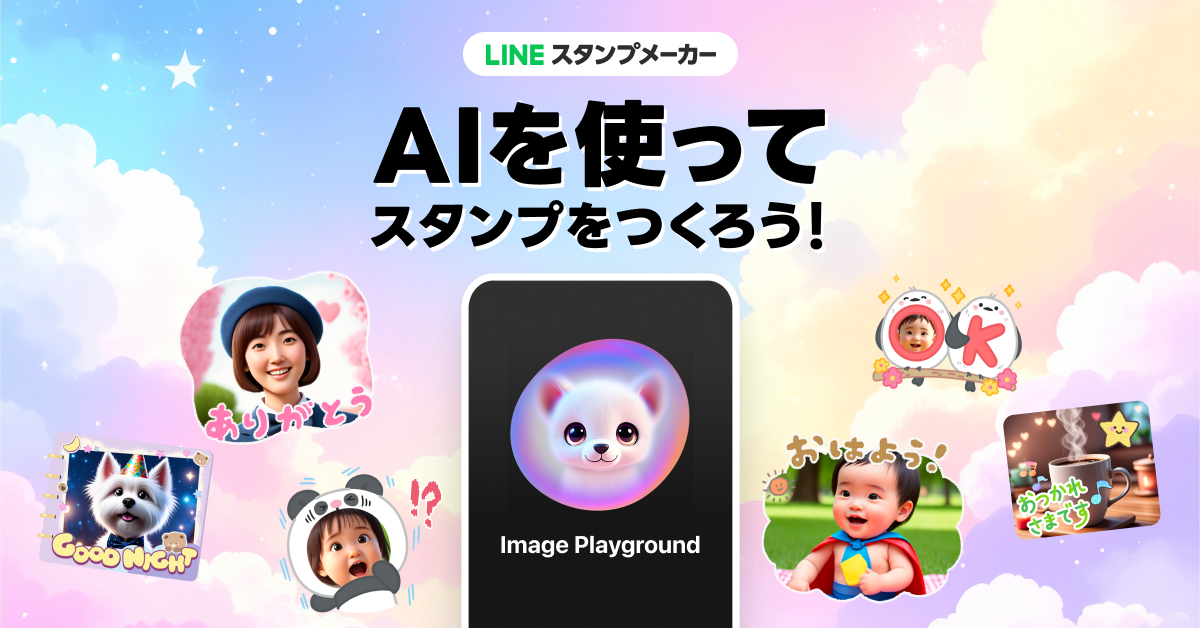
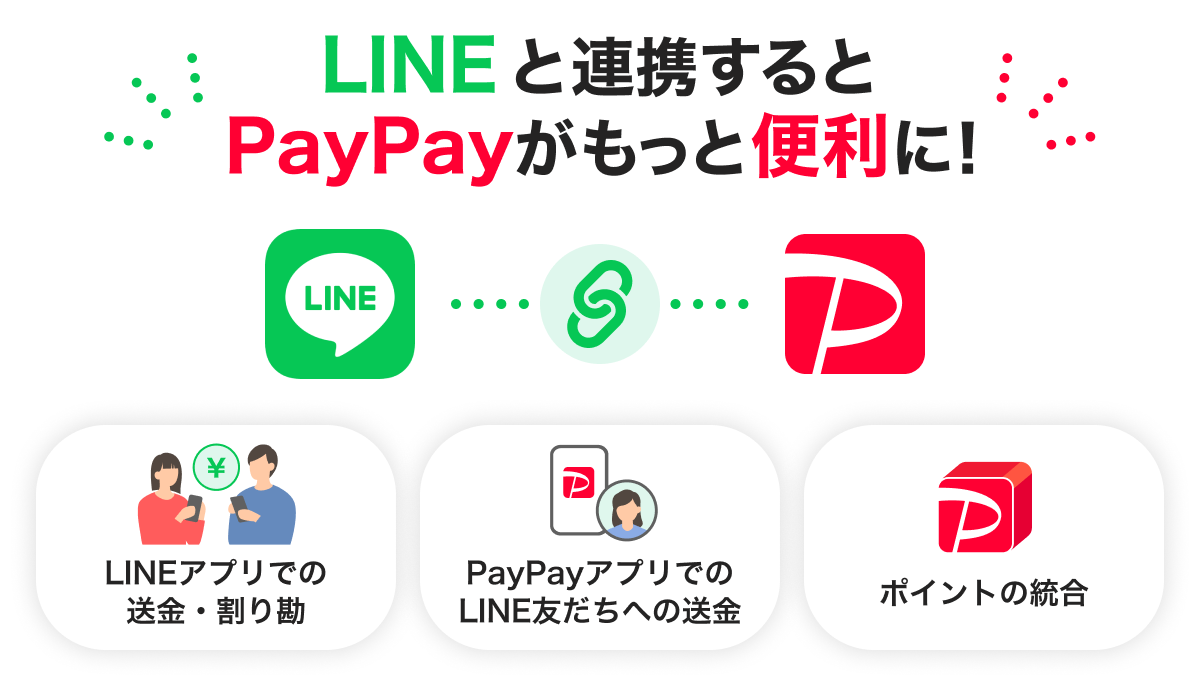
LY Corporation is a Japanese digital services group established in 1996, operating under the SoftBank Group umbrella. The company is organized into three main business segments: Media, Commerce, and Strategy. The Media segment provides digital advertising through Yahoo! and LINE platforms, alongside consumer services such as LINE MUSIC, LINE Manga, and LINE Search. The Commerce segment operates e-commerce and marketplace services including ZOZOTOWN, Yahoo! Shopping, Yahoo! Auctions, and office supply distribution via Askul. It also manages travel booking services like Ichikyu.com and food delivery operations through LINE MAN in Thailand. The Strategy segment focuses on financial technology, offering mobile payment solutions via PayPay, credit card services, and banking operations through PayPay Bank and LINE Bank Taiwan. The group serves consumers and businesses in Japan and Southeast Asia, with key subsidiaries including ZOZO, Askul, PayPay, and LINE MAN Corporation. Summarised from the annual report, fiscal year ended Mar 2026 |
Industry Internet Content & Information | Homepage lycorp.co.jp/ja |
| Sector Communication Services | IR page lycorp.co.jp/ja | |
|
Tags
digital advertising, e-commerce, mobile payments, fintech, food delivery, travel booking, office supplies distribution, digital media, banking, credit cards, ZOZO, ZOZOTOWN, ZOZOBASE, ZOZOUSED, Lyst, Askul, SOLOEL ARENA, APMRO, FEED Dental, LOHACO, Charm, PayPay, PayPay Card, PayPay Bank, PayPay Securities, PayPay Asset Management, PayPay Insurance, Ichikyu, Ichikyu.com, LINE Plus Corporation, LINE SOUTHEAST ASIA CORP. PTE.LTD., LINE Financial Taiwan Limited, LINE Bank Taiwan Limited, LINE MAN CORPORATION PTE. LTD., DECACORN CO. LTD, LINE MAN (THAILAND) COMPANY LIMITED, BEENOS, Yahoo! Shopping, LINE Brand Catalog, LINE FRIENDS, LINE Gift, LINE Shopping, Yahoo! Quick Mart, GIFTSHOP, MyShop, Yahoo! Auctions, Yahoo! Flea Market, Yahoo! Travel, LINE Travel, LINE MAN, LINE Pay, LINE Score, LINE Pocket Money, LINE BITMAX, LINE FX, DOSI, LINE Stamps, LINE GAME, LINE Divination, LINE MUSIC, LINE Manga, LINE Search, LYP Premium, ebookjapan, Yahoo! Mail, LINE VOOM, LINE NEWS, Talk Head View Custom
|
Press page lycorp.co.jp/ja/news/release |
Metrics
| Valuation | |
|---|---|
| Market cap | ¥ 3.561T |
| Market cap (USD) | $ 22.255B |
| P/E | 23.78 |
| PEG | 8.84 |
| P/BV | 0.95 |
| P/S | 1.65 |
| P/OCF | 5.90 |
| P/FCF | 7.28 |
| Dividend yield | 1.4% |
| Turnover / mcap | — |
| Returns | |
|---|---|
| ROE | 5.4% |
| ROI | 5.2% |
| ROIC | 8.8% |
| Profit margin | 9.5% |
| Growth | |
|---|---|
| Revenue growing | Yes |
| Profits growing | Yes |
| Revenue up 3y | Yes |
| Revenue up 5y | Yes |
| Earnings growth 3y (net profit CAGR) | 2.7% |
| Quality | |
|---|---|
| Profitable | Yes |
| Margin expanding | Yes |
| Buying back stock | Yes |
| Diluting (TTM) | No |
| Debt/Equity | — |
| Podcast bulls (TTM) | Sign up |
| Podcast bears (TTM) | Sign up |
| Podcast sentiment (TTM) | Sign up |
| Podcast sentiment % (TTM) | Sign up |
| News sentiment (TTM) | 20 |
| Quality score | 50.0% |
| Insiders | |
|---|---|
| Buys, 1w | Sign up |
| Buys, 1m | Sign up |
| Buys, 1y | Sign up |
| Sells, 1w | Sign up |
| Sells, 1m | Sign up |
| Sells, 1y | Sign up |
Sign up to see this company's insider trades
| Figure | FY 2026 | FY 2025 | FY 2024 | FY 2023 | FY 2022 | FY 2021 | FY 2020 | FY 2019 | FY 2018 | FY 2017 | FY 2016 | FY 2015 | FY 2014 | FY 2013 |
|---|---|---|---|---|---|---|---|---|---|---|---|---|---|---|
| Revenue | 2.036T | 1.917T | 1.815T | 1.672T | 1.567T | 1.206T | 1.053T | 954.714B | 897.185B | 853.73B | 652.327B | 395.932B | 386.284B | 342.989B |
| Net profit | 193.692B | 153.465B | 113.199B | 178.868B | 77.316B | 70.145B | 81.675B | 78.677B | 131.153B | 136.589B | 171.617B | 123.559B | 125.116B | 115.035B |
| Free cash flow | 489.104B | 419.85B | 245.468B | 209M | 214.542B | 179.343B | 158.152B | 64.908B | — | — | — | — | — | — |
| Figure | FY 2026 | FY 2025 | FY 2024 | FY 2023 | FY 2022 | FY 2021 | FY 2020 | FY 2019 | FY 2018 | FY 2017 | FY 2016 | FY 2015 | FY 2014 | FY 2013 |
|---|---|---|---|---|---|---|---|---|---|---|---|---|---|---|
| Share price | 382.71 | 506.3 | 387.68 | 372.83 | 536.41 | 550.65 | 348.03 | 271.07 | 494.08 | 513.94 | 479 | 495.92 | 505.97 | 432.99 |
| Price performance 12m | -0.24 | 0.31 | 0.04 | -0.3 | -0.03 | 0.58 | 0.28 | -0.45 | -0.04 | 0.07 | -0.03 | -0.02 | 0.17 | — |
Filed figures
Lines the statements and their notes report beside the headline figures, read from the filings' XBRL as filed (no restatement applied), with figures computed from one filing's own lines. Cash-flow lines carry their cash direction: an outflow is negative. Each period links to its filing; a figure's period, report date and tag are in its tooltip.
| Figure | Mar 2017 | Mar 2018 | Mar 2019 | Mar 2020 | Mar 2021 | Mar 2022 | Mar 2023 | Mar 2024 | Mar 2025 | Mar 2026 |
|---|---|---|---|---|---|---|---|---|---|---|
| Balance sheet detail | ||||||||||
| Cash and deposits (JPY) | 543B | 868B | 547B | 880B | 1.07T | 1.13T | 1.65T | 1.42T | 1.04T | 1.07T |
| Intangible assets (JPY) | — | 167B | 165B | 679B | 1.08T | 1.22T | 1.27T | 1.25T | 1.23T | 1.31T |
| Right-of-use assets (JPY) | — | — | — | 106B | 151B | 163B | 221B | 189B | 179B | 198B |
| Cash flow detail | ||||||||||
| Operating cash flow (JPY) | 127B | 75.5B | 150B | 243B | 208B | 266B | 93.1B | 316B | 520B | 663B |
| Purchases of property, plant and equipment (JPY) | — | -43.3B | -41.8B | -34.4B | -28.6B | -51.8B | -92.8B | -71B | -99.7B | -174B |
| Purchases of intangible assets (JPY) | — | -44.3B | -43.3B | -50.8B | -42.2B | -221B | -56.1B | — | — | — |
| Change in receivables (cash effect) (JPY) | — | -14.7B | -40.7B | -31.2B | 10.6B | 10.3B | 7.69B | -63.8B | 10.1B | 174B |
| Change in payables (cash effect) (JPY) | — | 42.4B | 50.3B | 73.8B | 3.39B | 21.7B | 192B | 216B | 178B | 321B |
| Dividends paid (cash effect) (JPY) | — | -50.4B | -50.5B | -45B | -42.2B | -42.2B | -43.6B | -41.9B | -41.7B | -49.9B |
| Share buybacks (cash effect) (JPY) | — | 0.00 | -221B | -527B | -2M | -68.3B | -16.9B | 0.00 | -150B | -149B |
| Interest paid (cash effect) (JPY) | — | — | — | -2.4B | -5.48B | -12.5B | -10.8B | -12.2B | -14.8B | -21.8B |
| Income taxes paid (cash effect) (JPY) | — | -71.9B | -59.4B | -59.1B | -159B | -110B | -110B | -133B | -74.3B | -104B |
| Operating cash flow before change in receivables (JPY) | — | 90.2B | 191B | 275B | 197B | 256B | 85.4B | 380B | 509B | 489B |
| Free cash flow (OCF - PPE - intangibles) (JPY) | — | -12.2B | 64.9B | 158B | 137B | -6.32B | -55.9B | 245B | 420B | 489B |
| Income detail | ||||||||||
| Research and development expense (JPY) | — | — | 1.02B | 922M | 2.76B | 30B | 39.1B | 42.3B | 46.6B | 48.2B |
| ↳ 5y CAGR | +110.9% | +119.1% | +77.2% | |||||||
| Total comprehensive income (JPY) | — | 136B | 83.6B | 79.4B | 121B | 121B | 287B | 171B | 168B | 313B |
| Comprehensive income to owners (JPY) | 138B | 133B | 83.9B | 73.8B | 102B | 107B | 277B | 144B | 123B | 220B |
| Segments | ||||||||||
| Commerce · Segment revenue (JPY) | — | 592B | 650B | 743B | 840B | 811B | 836B | 822B | 848B | 858B |
| ↳ YoY growth | +9.7% | +14.3% | +13.1% | -3.5% | +3.1% | -1.8% | +3.3% | +1.1% | ||
| Commerce · Segment operating income (JPY) | — | 82.9B | 55.8B | 80.7B | 111B | 79.2B | 94.1B | 76.7B | 104B | 87.4B |
| Media Business · Segment revenue (JPY) | — | 291B | 303B | 309B | 341B | 640B | 642B | 708B | 732B | 735B |
| ↳ YoY growth | +4.4% | +1.7% | +10.4% | +87.8% | +0.4% | +10.2% | +3.4% | +0.5% | ||
| Media Business · Segment operating income (JPY) | — | 156B | 141B | 154B | 150B | 250B | 247B | 187B | 217B | 211B |
| Stragegy · Segment revenue (JPY) | — | — | — | — | 87.4B | 116B | 192B | 290B | 341B | 446B |
| ↳ YoY growth | +32.9% | +65.3% | +51.0% | +17.7% | +30.6% | |||||
| Stragegy · Segment operating income (JPY) | — | — | — | — | 2.88B | -22.6B | 88.7B | -31.5B | 34B | 68.4B |
| Reported | Jun 19, 2017 | Jun 17, 2019 | Jun 17, 2019 | Jun 17, 2021 | Jun 16, 2022 | Jun 16, 2022 | Jun 15, 2023 | Jun 18, 2025 | Jun 18, 2025 | Jun 18, 2026 |
Sign up to see institutional holdings
Sign UpPodcast Mentions
Sign up to see podcast mentions and sentiment
Sign UpTimely disclosures published on TDnet, newest first, titles as filed in Japanese. The link opens the disclosure on TDnet. Filings with EDINET (periodic reports, extraordinary reports, offerings, holding and buy-back reports), newest first, titles as filed in Japanese. The link opens the filing on EDINET. Press releases from the company's own website, newest first.
当社は、2026 年5月8日に公表した 2027 年3月期の連結業績予想および期末配当予想について、下記 のとおり修正することとしましたので、お知らせいたします。 記 1.2027年3月期の連結業績予想数値の修正(2026年4月1日~2027年3月31日) 売上収益 前回発表予想(A) 今回修正予想(B) 増減額(B-A)
調整後 EPS
百万円
百万円
円
2,240,000
585,000
30.0
2,330,000
640,000
35.0
90,000
55,000
5.0
4.0%
9.4%
16.7%
2,036,366
496,681
28.73
増減率(%) [ご参考]前期連結実績(2026 年3月期)
調整後 EBITDA
<修正の理由> 本日公表いたしました2027年3月期第2四半期(中間期)の連結業績を踏まえ、2027年3月期の 連結業績予想を上記のとおり上方修正いたしました。 売上収益は、コマース事業におけるアスクル株式会社およびLINE MAN CORPORATION PTE. LTD.、 ならびに戦略事業におけるPayPay連結(※)が当初想定を上回って推移していることから、前回予想 を上回る見通しです。 また、利益面では、上記の増収効果に加え、PayPay連結の収益性が当初想定を上回ったことによ り、事業拡大に伴う販売促進費や支払手数料等の費用増加を吸収し、調整後EBITDAおよび調整後EPS についても前回予想を上回る見通しです。 なお、今回の業績予想の修正は適時開示基準には該当するものではありませんが、後記の期末配 当予想の修正とあわせて、株主・投資家の皆様の投資判断に資する情報を提供する観点から、任意 で開示するものです。 (※)PayPay株式会社、PayPayカード株式会社、クレジットエンジン株式会社、PayPay銀行株式会社、PayPay証券株式会社の連結数値。 会社間の内部取引消去後の数値。当社にて関連するIFRS調整を行い独自に算出
2.期末配当予想の修正 年間配当金 第2四半期末
合計
期末
円銭
円銭
円銭
-
11.00
11.00
今回修正予想
-
12.00
12.00
当期実績
0.0
-
-
[ご参考] 前期実績(2026年3月期)
0.0
7.30
7.30
前回予想
<修正の理由> 当社は、中長期的かつ持続的な企業価値の向上を目指す上で、将来の成長を見据えたサービスへ の先行投資や設備投資に加え、利益還元を通じて株主の皆様に報いることが重要だと考えておりま す。 こうした考えのもと、2025年度からの5年間で累計総還元性向70%以上を目指す還元方針を掲 げ、同方針および業績等を総合的に勘案し、2027年3月期の期末配当予想については、1株当たり 11.00円と公表しておりました。 このたび、2027年3月期の連結業績予想の上方修正を踏まえ、上記還元方針に基づき改めて検討 した結果、2027年3月期の期末配当予想を、1株当たり1.00円増額し、12.00円に修正することとい たしました。 今後も、利益成長に応じた配当を実施するとともに、公表しているキャピタル・アロケーション 方針に則り、成長投資と株主還元の適切なバランスを図りながら、資本効率の改善および企業価値 の向上に努めてまいります。
































































































































































































































































































































































































Prompts
Click prompts to add them under the company line, click again to take one out, then copy the result into your AI chat. Shared by Asian Century Stocks and Uncovered Thai Stocks. Thank you.
Company History
Name and ticker changes, and re-registrations under a new regulatory id. When a ticker stopped being used is not recorded, so former tickers are undated.
| Date | Change | Detail |
|---|---|---|
| Jun 26, 2025 | Acquired | Acquired BEENOS Inc. (EDINET code E03437). Its filings from before the deal are on its own company page, not shown here. |
ETFs Holding LY Corporation
Exchange-traded funds whose newest published daily portfolio holds one of the company's listings, largest weight first.
| ETF | Weight in ETF | Shares | Market value | As of |
|---|---|---|---|---|
| JSTC | 0.15% | 127,155 | $ 432.921K | Nov 17, 2026 |
| DFIV | 0.14% | 9,625,617 | $ 31.538M | Nov 12, 2026 |
| DFSI | 0.04% | 159,900 | $ 523.9K | Nov 12, 2026 |
| NTSI | 0.04% | 81,500 | $ 217.534K | Jun 30, 2026 |
| DFAI | 0.04% | 2,209,466 | $ 7.239M | Nov 12, 2026 |
| DXIV | 0.03% | 23,200 | $ 76.013K | Nov 12, 2026 |
| DFIC | 0.03% | 1,476,900 | $ 4.839M | Nov 12, 2026 |
| AVDE | 0.02% | 1,190,400 | $ 4.044M | Nov 16, 2026 |
| DFAX | 0.01% | 487,500 | $ 1.597M | Nov 12, 2026 |
| AVSD | 0.01% | 5,800 | $ 19.703K | Nov 16, 2026 |