|
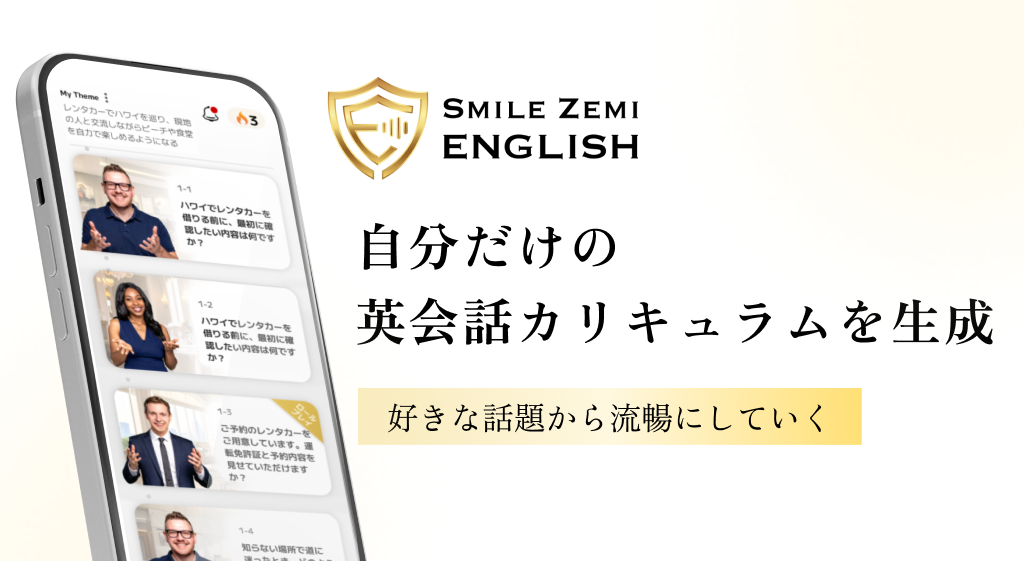
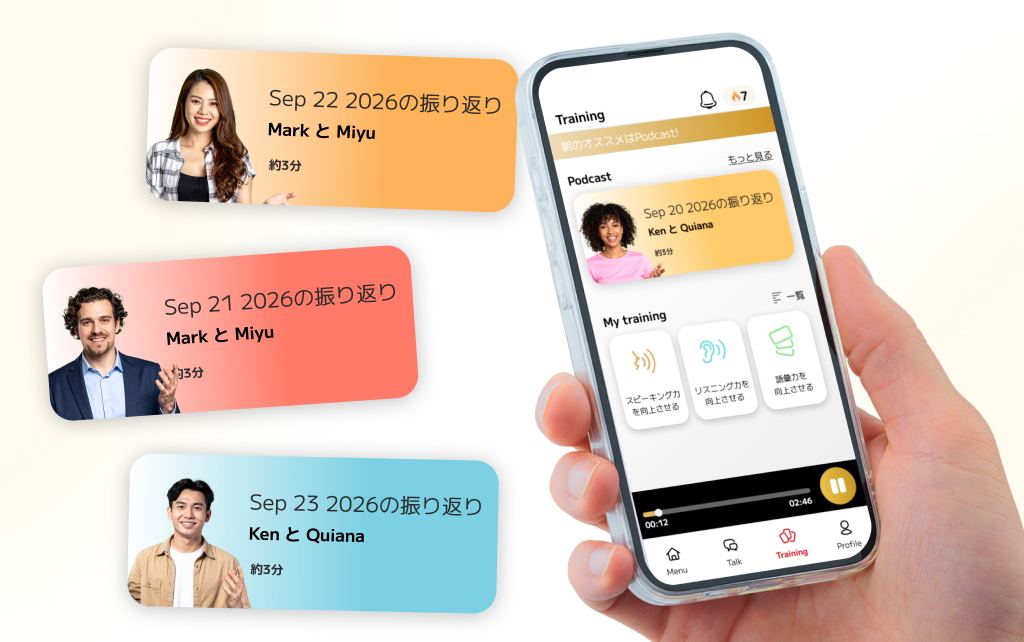
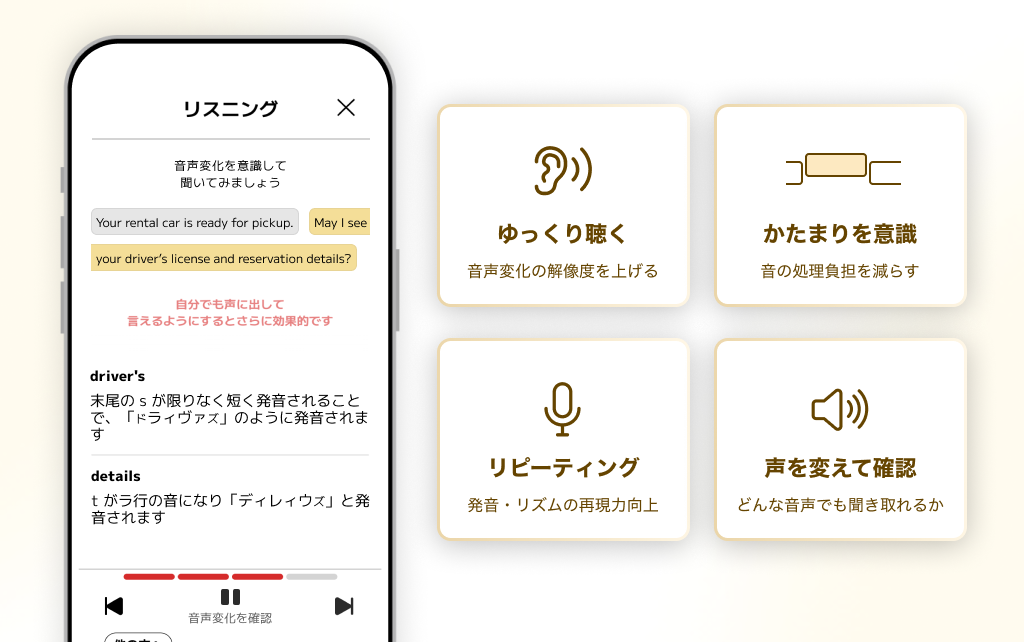
Justsystems Corporation is a software company that plans, develops, and provides software and related services. Its business segments include consumer software, enterprise solutions, and educational services. Key products include the Japanese input system ATOK, the tablet-based distance learning service Smile Zemi, the no-code cloud database JUST.DB, and the learning cloud platform Just Smile for elementary and middle schools. The company also offers the office suite JUST Office and the AI English conversation service Smile Zemi ENGLISH. Justsystems serves a wide range of customers, including individual consumers, private enterprises, government agencies, local authorities, schools, and hospitals. The company operates an e-commerce platform called Just MyShop for direct sales. It has two consolidated subsidiaries and maintains a relationship with Kyence, an electronic equipment manufacturer, though there is no business transaction between them. Summarised from the annual report, fiscal year ended Mar 2026 |
Industry Software - Application | Homepage justsystems.com/jp |
| Sector Technology | IR page justsystems.com/jp/ir | |
|
Tags
japanese input systems, distance learning, no-code databases, educational software, office suites, ai language coaching, enterprise software, consumer software, ATOK, Smile Zemi, JUST.DB, Just Smile, JUST Office, Smile Zemi ENGLISH, ATOK Passport, ATOK Sync One, Just MyShop, Kyence
|
Press page justsystems.com/jp/news |
Metrics
| Valuation | |
|---|---|
| Market cap | ¥ 283.231B |
| Market cap (USD) | $ 1.77B |
| P/E | 18.16 |
| PEG | 4.50 |
| P/BV | 2.24 |
| P/S | 5.55 |
| P/OCF | 15.76 |
| P/FCF | 19.43 |
| Dividend yield | 0.61% |
| Turnover / mcap | — |
| Returns | |
|---|---|
| ROE | 13.5% |
| ROI | 12.7% |
| ROIC | 13.1% |
| Profit margin | 29.3% |
| Growth | |
|---|---|
| Revenue growing | Yes |
| Profits growing | Yes |
| Revenue up 3y | No |
| Revenue up 5y | No |
| Earnings growth 3y (net profit CAGR) | 4.0% |
| Quality | |
|---|---|
| Profitable | Yes |
| Margin expanding | Yes |
| Buying back stock | No |
| Diluting (TTM) | No |
| Debt/Equity | — |
| Podcast bulls (TTM) | Sign up |
| Podcast bears (TTM) | Sign up |
| Podcast sentiment (TTM) | Sign up |
| Podcast sentiment % (TTM) | Sign up |
| News sentiment (TTM) | 23 |
| Quality score | 16.7% |
| Insiders | |
|---|---|
| Buys, 1w | Sign up |
| Buys, 1m | Sign up |
| Buys, 1y | Sign up |
| Sells, 1w | Sign up |
| Sells, 1m | Sign up |
| Sells, 1y | Sign up |
Sign up to see this company's insider trades
| Figure | FY 2026 | FY 2025 | FY 2024 | FY 2023 | FY 2022 | FY 2021 | FY 2020 | FY 2019 | FY 2018 | FY 2017 | FY 2016 | FY 2015 | FY 2014 | FY 2013 |
|---|---|---|---|---|---|---|---|---|---|---|---|---|---|---|
| Revenue | 51.515B | 44.551B | 40.985B | 41.95B | 41.676B | 41.174B | 36.504B | 28.647B | 22.991B | 19.467B | 17.183B | 17.418B | 17.047B | 13.765B |
| Net profit | 15.092B | 12.327B | 11.636B | 13.401B | 12.165B | 10.957B | 9.287B | 6.21B | 3.519B | 3.365B | 2.683B | 2.912B | 2.807B | 2.159B |
| Free cash flow | 16.157B | 12.033B | 10.526B | 14.312B | 12.119B | 11.161B | 14.23B | 3.113B | 5.939B | 4.687B | 3.64B | — | — | — |
| Figure | FY 2026 | FY 2025 | FY 2024 | FY 2023 | FY 2022 | FY 2021 | FY 2020 | FY 2019 | FY 2018 | FY 2017 | FY 2016 | FY 2015 | FY 2014 | FY 2013 |
|---|---|---|---|---|---|---|---|---|---|---|---|---|---|---|
| Share price | 3.495K | 3.373K | 2.668K | 3.508K | 5.796K | 6.054K | 4.918K | 2.823K | 2.592K | 1.378K | 914.45 | 739.47 | 795.94 | 607.4 |
| Price performance 12m | 0.04 | 0.26 | -0.24 | -0.39 | -0.04 | 0.23 | 0.74 | 0.09 | 0.88 | 0.51 | 0.24 | -0.07 | 0.31 | — |
Filed figures
Lines the statements and their notes report beside the headline figures, read from the filings' XBRL as filed (no restatement applied), with figures computed from one filing's own lines. Cash-flow lines carry their cash direction: an outflow is negative. Each period links to its filing; a figure's period, report date and tag are in its tooltip.
| Figure | Mar 2017 | Mar 2018 | Mar 2019 | Mar 2020 | Mar 2021 | Mar 2022 | Mar 2023 | Mar 2024 | Mar 2025 | Mar 2026 |
|---|---|---|---|---|---|---|---|---|---|---|
| Balance sheet detail | ||||||||||
| Trade receivables (JPY) | 3.83B | 3.59B | 3.33B | 3.21B | 3.06B | 5.07B | 5.44B | 5.21B | 5.66B | 6.14B |
| ↳ YoY growth | +2.5% | -6.3% | -7.2% | -3.7% | -4.9% | +66.0% | +7.2% | -4.2% | +8.6% | +8.4% |
| ↳ 5y CAGR | -4.0% | +5.8% | +8.6% | +9.3% | +12.0% | +15.0% | ||||
| Cash and deposits (JPY) | 11.9B | 15B | 22.4B | 42.4B | 56B | 62.2B | 73.1B | 84.9B | 90.6B | 105B |
| Intangible assets (JPY) | 2.08B | 2.78B | 2.75B | 2.63B | 2.79B | 3.01B | 3.58B | 3.97B | 4.57B | 3.82B |
| Cash flow detail | ||||||||||
| Operating cash flow (JPY) | 4.79B | 5.94B | 5.03B | 16.1B | 13B | 14.1B | 16.8B | 13.1B | 15B | 19.6B |
| Purchases of property, plant and equipment (JPY) | -80M | -23.7M | -62.2M | -127M | -27M | -16M | -4M | -21M | -45M | -515M |
| Purchases of intangible assets (JPY) | -1.67B | -2.06B | -1.86B | -1.72B | -1.81B | -1.95B | -2.49B | -2.5B | -2.94B | -2.95B |
| Change in receivables (cash effect) (JPY) | -93.5M | 241M | -427M | 120M | 158M | 522M | -182M | 120M | -226M | -236M |
| Change in inventories (cash effect) (JPY) | -150M | -916M | 406M | -106M | -589M | -1.06B | 1.09B | 253M | -182M | -575M |
| Change in payables (cash effect) (JPY) | 821M | -155M | 97.5M | 158M | -148M | -612M | 199M | 102M | -48M | -494M |
| Dividends paid (cash effect) (JPY) | -383M | -384M | -385M | -641M | -641M | -1.03B | -1.03B | -1.28B | -1.28B | -1.54B |
| Share buybacks (cash effect) (JPY) | — | -95,000 | -417,000 | -123,000 | 0.00 | 0.00 | 0.00 | 0.00 | 0.00 | 0.00 |
| Income taxes paid (cash effect) (JPY) | -1.43B | -1.8B | -1.87B | -994M | -5.01B | -4.5B | -5.34B | -6.22B | -5.58B | -6.04B |
| Operating cash flow before change in receivables (JPY) | 4.88B | 5.7B | 5.46B | 16B | 12.8B | 13.6B | 17B | 12.9B | 15.2B | 19.9B |
| Free cash flow (OCF - PPE - intangibles) (JPY) | 3.04B | 3.85B | 3.11B | 14.2B | 11.2B | 12.1B | 14.3B | 10.5B | 12B | 16.2B |
| Income detail | ||||||||||
| Research and development expense (JPY) | 1.08B | 974M | 1B | 812M | 1.26B | 1.02B | 1.28B | 657M | 487M | 465M |
| ↳ 5y CAGR | -2.3% | -1.1% | +5.6% | -8.1% | -9.7% | -18.0% | ||||
| Total comprehensive income (JPY) | 4.31B | 4.55B | 6.19B | 9.29B | 10.9B | 12.1B | 13.4B | 11.7B | 12.3B | 15.2B |
| Comprehensive income to owners (JPY) | 4.31B | 4.55B | 6.19B | 9.29B | 10.9B | 12.1B | 13.4B | 11.7B | 12.3B | 15.2B |
| Reported | Jun 23, 2017 | Jun 22, 2018 | Jun 26, 2019 | Jun 26, 2020 | Jun 25, 2021 | Jun 27, 2022 | Jun 28, 2023 | Jun 26, 2024 | Jun 27, 2025 | Jun 24, 2026 |
Sign up to see institutional holdings
Sign UpPodcast Mentions
Sign up to see podcast mentions and sentiment
Sign UpTimely disclosures published on TDnet, newest first, titles as filed in Japanese. The link opens the disclosure on TDnet. Filings with EDINET (periodic reports, extraordinary reports, offerings, holding and buy-back reports), newest first, titles as filed in Japanese. The link opens the filing on EDINET. Press releases from the company's own website, newest first.
-
2026年09月14日
-
2026年07月31日

===============================================================================================================
26.10.01 スマイルゼミ 高校生コース
スマートフォン専用アプリ「SMILE ZEMI Pocket」を
2026年12月より提供開始 ~スキマ時間を有効活用し、その場で学習の「わからない」を解決~
株式会社ジャストシステム(本社:東京都港区、代表取締役社長:関灘 恭太郎)は、「スマイルゼミ 高校生コース」において、スキマ時間を活用し、学校の課題やわからない問題をその場で解決するスマートフォン専用アプリ「SMILE ZEMI Pocket (スマイルゼミ ポケット)」を 2026年12月より提供開始します。
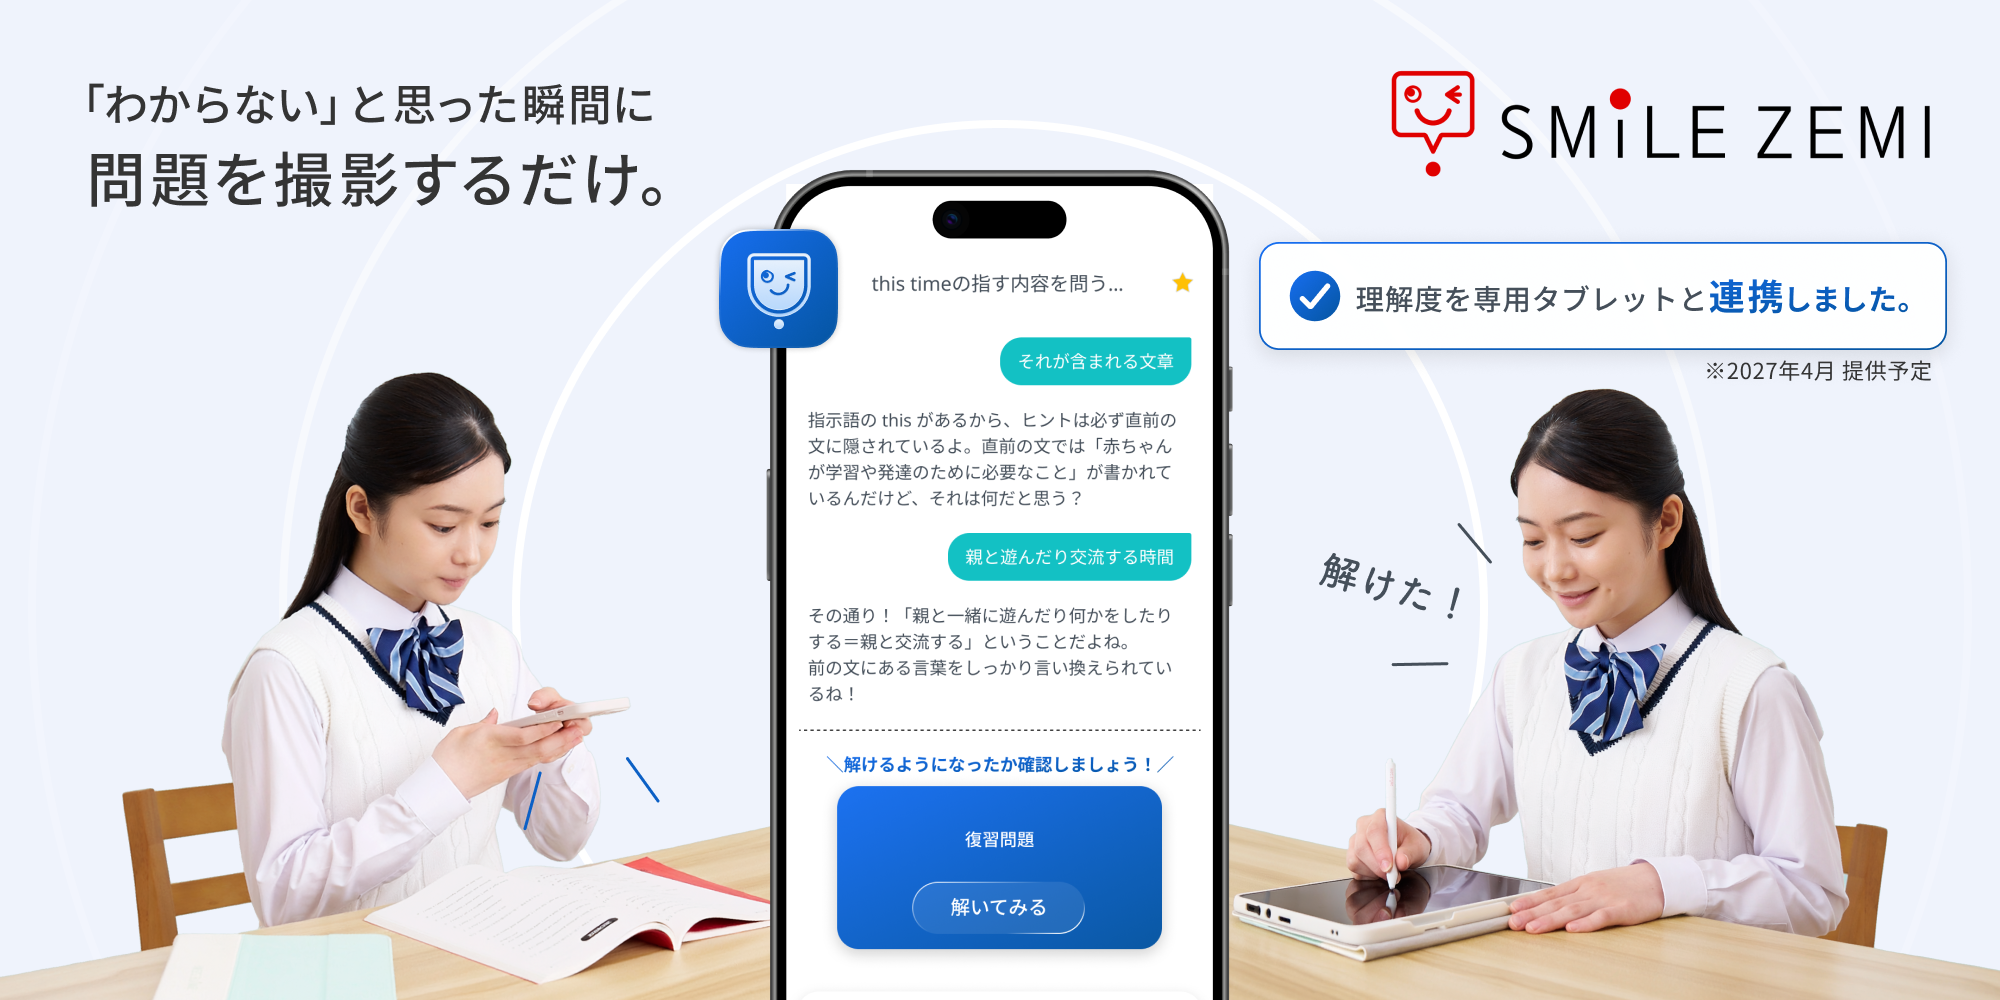
「SMILE ZEMI Pocket」は、「わからない」と思った瞬間に問題を撮影するだけで、スマイルゼミ独自の学習アシストAIが段階的にヒントを提示し、対話を通じて解決へ導きます。対話内容から苦手を抽出し、復習問題を自動で生成するため、スマートフォンひとつで疑問の解消から理解度チェックまで行えます。
24時間365日学習アシストAIで「わからない」を解決
主要7教科(数学・英語・国語・理科・地理歴史・公民・情報)に対応。わからない問題をスマートフォンで撮影して、24時間いつでも質問ができます。学習に特化したスマイルゼミ独自の学習アシストAIが、わからないところを丁寧に解説。単に答えを教えるのではなく考え方まで指導するため、自分の力で答えを導けるようになり、テスト結果に直結する学習を可能とします。
対話から苦手を抽出し、確認問題で即座に理解度チェック
対話内容から理解不足や弱点を即座に分析し、一人ひとりに合わせた確認問題が自動生成されるため、その場で理解度チェックが可能です。また、生成された問題はアプリの「復習画面」に蓄積されるため、過去につまずいた単元へいつでも再挑戦し、苦手科目を克服できます。
タブレットとの連携で、定期テスト対策や日々の学習をパーソナライズ
2027年4月より、「SMILE ZEMI Pocket」と専用タブレットの連携機能を提供します。スマートフォンでの対話内容と、タブレットに設定した定期テストの範囲から、優先的に取り組むべき対策問題を厳選して提示します。さらに、対話から分析した傾向をもとに、スマイルゼミの学習時にも一人ひとりに合った教え方で解説し、効率的な成績アップをサポートします。
本アプリは、高校入試を控える「スマイルゼミ 中学生コース」3年生の会員にも2026年12月より提供を開始します。入試直前の疑問解消から高校入学準備まで、切れ目なくサポートします。
AIを活用したタブレット型通信教育「スマイルゼミ」
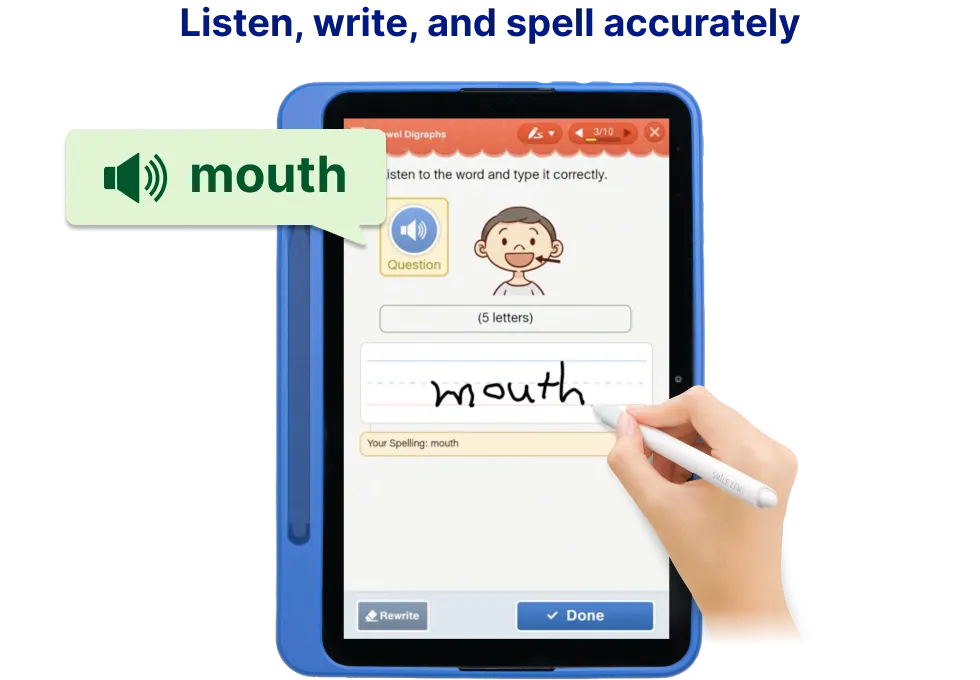
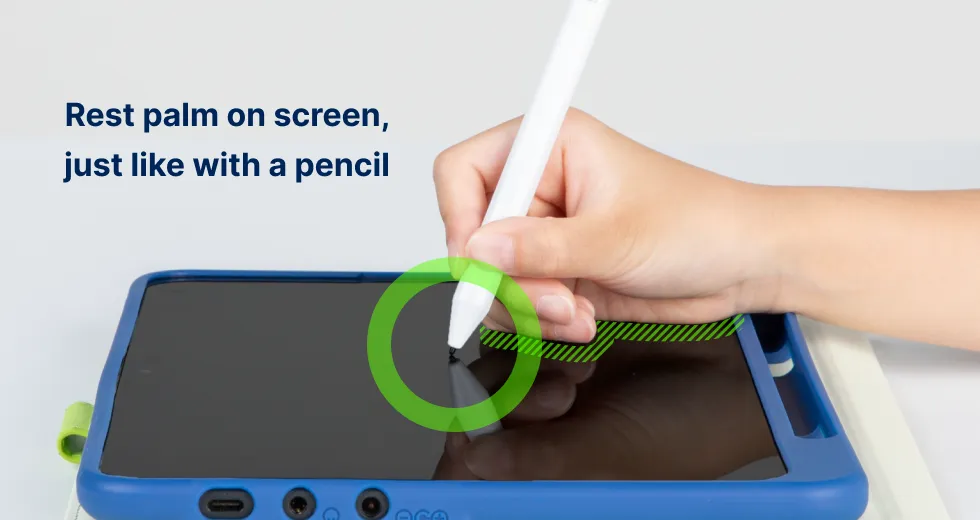
「スマイルゼミ」は、2012年に開講した、専用タブレットで学ぶ、幼児・小学生・中学生・高校生向けの通信教育です。すべてのコースで、紙と鉛筆のように「書く学び」、AIを活用した「対話による学び」によって、質の高い学習を実現します。また、「教科書準拠」の教材により学校の進度に合わせた学びを提供しています。2023年には、米国の幼児・小学生向けHome Learning Service「Smile Zemi」も開講しました。
- 記載された社名および商品名は各社の商標または登録商標です。
関連情報


© JustSystems Corporation update 2026.10.01




Prompts
Click prompts to add them under the company line, click again to take one out, then copy the result into your AI chat. Shared by Asian Century Stocks and Uncovered Thai Stocks. Thank you.
ETFs Holding Justsystems Corporation
Exchange-traded funds whose newest published daily portfolio holds one of the company's listings, largest weight first.
| ETF | Weight in ETF | Shares | Market value | As of |
|---|---|---|---|---|
| DFIS | 0.02% | 40,400 | $ 1.187M | Nov 12, 2026 |
| AVDS | 0.02% | 2,400 | $ 72.171K | Nov 16, 2026 |
| AVSD | 0.01% | 700 | $ 21.05K | Nov 16, 2026 |
| DFSI | 0.01% | 2,600 | $ 76.423K | Nov 12, 2026 |
| DFIC | 0.01% | 31,601 | $ 928.86K | Nov 12, 2026 |
| DFAX | 0.00% | 18,800 | $ 552.595K | Nov 12, 2026 |
| DFAI | 0.00% | 16,100 | $ 473.233K | Nov 12, 2026 |
| AVDE | 0.00% | 21,500 | $ 646.532K | Nov 16, 2026 |