株式会社クレスコ https://www.cresco.co.jp/ 〒108-6026 東京都港区港南2-15-1 品川インターシティA棟 26階 TEL : 03-5769-8011 統合報告書 2026 人が想い描く未来、 その先へ CONTENTS ごあいさつ 統合報告書 2026 イントロダクショ ン ESG 報告 ごあいさつ…
株式会社クレスコ
https://www.cresco.co.jp/
〒108-6026
東京都港区港南2-15-1 品川インターシティA棟 26階
TEL : 03-5769-8011
統合報告書 2026
人が想い描く未来、
その先へ
CONTENTS
ごあいさつ
統合報告書 2026
イントロダクショ ン
ESG 報告
ごあいさつ ……………………………………… 01
理念体系
マネジメント体制
………………………………………… 02
……………………………… 34
人が想い描く未来、その先へ
経営基盤の強化(ガバナンス) ………………… 36
クレスコは1988年の創業以来、ITソリューションのリーディングカンパニーとして、社会の発展に貢献
At a glance …………………………………… 06
経営基盤の強化(社会) ………………………… 40
しています(2026年4⽉1⽇現在、グループ会社14社、連結従業員3,602名)
。2023年に初の統合報告書を
トップメッセージ ……………………………… 10
経営基盤の強化(環境) ………………………… 42
発行し、当社グループの事業活動とサステナビリティへの取り組みを広くご理解いただく機会を得ました。
価値創造の軌跡
………………………………… 04
生成AI時代の成長ストーリー ………………… 16
ご閲覧いただいたみなさま、誠にありがとうございました。
経営戦略担当メッセージ ……………………… 18
2030年に向けた経営ビジョン「 CRESCO Group Ambition 2030」の第二ステージである新中期経営計画
価値創造と経営戦略
価値創造プロセス
価値創造の源泉
……………………………… 20
………………………………… 22
りやすくお伝えすることを目指しました。特に、以下の点に注力しています。
非財務サマリー(単体) ………………………… 46
拠点/グループ会社 …………………………… 48
特集当社のマテリアリティと中期経営計画との連動 … 26
価値創造の中期経営計画 ………………… 27
中期経営計画7つの戦略の取り組み状況 …… 28
キャッシュアロケーション方針 ……… 29
生成AIの取り組み ………………………… 30
事業別概況
この統合報告書では、当社グループの事業活動とサステナビリティ への取り組みを、より深く、より分か
財務サマリー(連結) …………………………… 44
価値創造ストーリー/マテリアリティ(重要課題)……… 24
事業環境認識
「中期経営計画2026」は、2年目を終え、最終年度に入っています。
デー タ編
会社概要/株式情報
…………………………… 49
「CRESCO Group
Ambition 2030」
に基づく経営戦略
「中期経営計画2026」
で定めた成長戦略
情報開示の充実
…………………………………… 32
……………………………………… 33
当社グルー プは 、統合報告書を通じて 、ステー クホルダーの皆様との対話をさらに
深め 、時代の先を見据え 、私たちの社会を一歩ずつ前に進めていく事業活動を行う
編集方針
本制作に寄せて
参考ガイドライン
統合報告書2026年版では、2024年度からスタートした「中期
統合報告書の編集にあたり 、国際統合報告評議会(IIRC)が提
経営計画2026」の 、7つの成長戦略への取り組み状況に加え 、
唱する「国際統合報告<IR>フレームワーク」や 、経済産業省
生成AI時代の成長戦略、キャッシュアロケーション方針、また
が提唱する「価値協創のための統合的開示・対話ガイダンス」
これらの実例につき、特集ページでご紹介しています。中計
を参照しています。
主体へと進化を続ける所存で す 。
今後と も 、変わ ら ぬ ご愛顧と ご支援を賜りま す よ う お願い申し上げます 。
2026が目指すもの、その先にある
「CRESCO Group Ambition
2030」
実現までの道筋、クレスコグループが作ろうとしている
“わくわくする未来”を読み取っていただければ幸いです。
報告対象期間
見通しに関する特記事項
2025年4⽉1⽇~2026年3⽉31⽇
当報告書に記載している将来の業績に関する予想、計画、見通
※⼀部対象期間外の情報も掲載しています。
報告対象範囲
株式会社クレスコおよびグループ会社
しなどは、現在入手可能な情報に基づき当社の経営者が合理的
と判断したものです。実際の業績はさまざまな要因の変化に
より 、記載の予想、計画、見通しとは大きく異なる可能性があ
ります。
代表取締役会長
根元浩幸
代表取締役社長執行役員
冨永宏
CRESCO | 統合報告書 2 0 2 6
0 1
理念体系
私たちクレスコグループは「人の想い描く力に、限界はない」と信じています。
「未来のその先」へ向けて新たなものを生み出し、
新たな価値を創り出していくため、以下のとおりに理念体系をまとめ、そこから中長期のビジョンや経営計画、マテリアリティ
を導き出しました。最高のテクノロジーと、人との絆で、“わくわくする未来”を描いていきます。
社名の由来
クレスコ憲章
企業活動の成長が世界の人々 の幸福に可能な限り最大の貢献
⼀、クレスコ は人間中心、実力本位の会社である
をすること、そして、そこに働く人々 がともに喜びと誇りを
⼀、クレスコ は自由、若さ、夢をもつ会社である
もち、自己の能力を最高に発揮できることが企業の使命である
⼀、クレスコ は最高の技術を発揮する会社である
と考え 、ラテン語で「成長する」という意味を持つ「CRESCO」
⼀、クレスコ は皆が経営する会社である
を社名としています。
⼀、クレスコ は世界で生きる会社である
CRESCO Group Ambition 2030
人が想い描く未来、その先へ
クレスコグループは最高のテクノロジーと絆で
“わくわくする未来”を創造します
中期経営計画2026
▶P27
5つのマテリアリティ(重要課題)
▶P24
経営理念
グループビジョン
DX・イノベー
ションによる
持続的な社会の
実現
グループ行動指針
ITを通じた
地球環境への貢献
安全なデジタル
社会の確立
CRESCO Group 行動指針
さらなる高みへ
お客様と真摯に向き合い、より大きな価値を共創する
常に技術と品質を追求し、研鑽を重ねる
勇敢に進もう
自らの可能性を信じ、新たな価値を求めて挑戦する
困難に立ち向かい、粘り強く最後までやり遂げる
多様な人財が
働きがいを持って
活躍できる
機会の創出
継続的な
ガバナンスの
点検と向上による
価値提供の維持
もっと面白く
自由な発想と技術力で、社会に感動をもたらす成長を楽しみ、
チームで最大のパフォーマンスを発揮する
0 2
CRESCO | 統合報告書 2 0 2 6
CRESCO | 統合報告書 2 0 2 6
0 3
価値創造の軌跡
本社(港区三田)
、芝センター、
田町センターおよびワイヤレス
ソリューションセンターを統合し、
港区港南へ移転
クレスコは1988 年の創業以来、ラテン語で「成長する」という意味を持つ社名「 CRESCO」のもと 、多彩な ITサー ビス・デ
ジタルソリュー ショ ンを展開す る こ と で 、さ ま ざ ま な社会課題の解決に取り組ん で ま い り ま し た 。こ れまで培ってきた
ブランドロゴ変更、
東証プライム市場移行
経営資源や強みを活かし 、クレスコだからこそできる価値を社会に提供し、持続可能な社会の実現と、経営ビジョ ン
「人が
想い描く未来、そ の先へ」の実現を目指し ま す 。
2026年3月期
子会社11社
持分法適用会社2社
組み込みソフトウェア開発会社と
ITシステム構築会社が合併して、
「クレスコ」が誕生
店頭市場に株式公開、あわせて
資本金を7億5,870万円に増資
東京証券取引所市場第2部に上場
通商産業省によるシステム
インテグレーション登録企業となる
子会社2社
東京証券取引所市場第1部に上場
2026年4月1日時点
131
111
CRESCO
Group
■子会社売上高(億円)
■単体売上高(億円)
■
連結従業員数(人)
13
3
1
4
CRESCO
3
システムのエンドユーザーに徹底して食い込み、エ
ンドユーザー の本当のニーズを理解したうえで最
適なソリューションを提供していくというもの。
スタッフを従来の2倍に増員、組織体制を見直し役
割を明確化、スタッフの持つ情報を全社で共有する
システムを導入するなど、組織的かつ戦略的な営業
活動を展開した。
技術研究所はクレスコの“未来の強み ”と、それ
を生み出し続ける仕組みを作り出すことを目
的に、2012年に創設された。昨今では、お客様
の現場の課題を先端技術でお客様と一緒に解決
する「共同研究」や 、大学などの研究機関との
「産学連携」も推進し 、機械学習・画像解析を用
いた、医療領域関連の研究に力を入れている。
4
次世代クレスコが成功するか否かはスタート初年度
からの3年間で決まるという考えのもと、M&Aを推
進。次世代クレスコ実施前の2010年3月末の子会社
4社、持分法適用会社2社から 、次世代クレスコ終了
時の2015年3 月末には子会社9社、持分法適用会社
4社に拡大。
IT
メインフレーム
04
CRESCO | 統合報告書 2026
インターネット
CRESCO Group
クラウド、ビッグデータ、モビリティ、
ソーシャル技術
従来「ソフトウェア開発事業」と「組み込み型ソフトウェア開
発事業」の2つを報告セグメントとしていたが 、2022年3 月
期を初年度とする「中期経営計画2023」の遂行にあたり 、デ
ジ タ ル ソ リュ ーション 事業 の 本格的 な 成長 を 目指 して 、
2022年3月期から 、報告セグメントを「 ITサービス事業」と
「デジタルソリューション事業」の2つへ変更。
デジタル革命(DX)Society5.0、
インダストリー4.0︓IoT 、ビッグデータ、
人工知能(AI )
、ロボット
CRESCO | 統合報告書 2026
05
At a glance
最高のテクノロジー と絆で “わくわくする未来”を創造する
独立系の「システムインテグレー ター 」
クレスコは、AI( 人工知能)やクラウドなどの先端技術を含むIT 開発技術と高品質なサー ビスで、世の中のさまざまな仕組みづくりを手がける独立系の「システムインテグレー ター 」です 。
システムの土台となるプラッ トフォー ム構築技術、事業や業務をデジタル化するアプリケー ショ ン開発技術、情報家電や車載機器などをコントロー ルする組み込み開発技術といっ た、
幅広いIT 領域の技術を駆使し、激変するデジタル変革をリー ドしています 。
クレスコグルー プの ビジネス
強み
クレスコグルー プの成長戦略
リレー ショ ン& パー トナー シッ プ
最高の技術と品質
組み込みシステム
開発
デジタルソリュー ショ ン
AI&Data
プラットフォーム
構築
セキュリティ
IoT
アプリケーション
開発
Robotics
UI/UX
開発体制/
開発手法
クラウド
ナー へと進化することを目指します。同時に 、コアビジネスの
さ ま ざ ま な企業の活動や み な さ ま の生活を支え て い ま す
サー ビス
I
T
クレスコグループは 、顧客企業の成長を実現する戦略的パート
強い経営基盤
発展およびより強固な経営基盤の構築を推進します。そのため
に、7つの戦略を打ち出しました。
7つの戦略
運輸・旅客
顧客とともに持続的に成長し、社会を前進させるために
1
人財
顧客の成長実現のため、オファリングを強化し、
共創型モデルへ
2
0 6
CRESCO | 統合報告書 2 0 2 6
品質リーダーシップ発揮
共創型モデルとデジタルソリューション拡張を見据えた
全方位型品質管理強化
3
旅行・ホテル
人的資本経営推進
人財ポートフォリオを構築し、個人・組織の力を最大化
4
医療・
ヘルスケア
技術・デジタルソリューションの拡張
先端技術など優位性の継続探索・獲得と顧客価値への転換
5
事業連携促進
ケイパビリティを繋ぎ合わせ、
独自のビジネスエコシステムを構築
6
銀行・保険
デジタル変革実現
デジタル変革で業務を効率化し、
創造的で高付加価値な企業へ
7
経営基盤
共創型モデルの確立
自動車・
エレクトロニクス
グループ一体経営
各社の独自性と効率性を追求し、事業シナジーを創出
CRESCO | 統合報告書 2 0 2 6
0 7
At a glance
ー
ー
%
ー
●コンサルティング
●IT企画
3 1%
(
1
2026年3⽉期
業
)
1
60
200
20
(
2025 年 3 ⽉期
3
% [ 2026年3⽉期]
20
14.3%
15.1%
0
2026 年 3 ⽉期
)
( )
15
(
)
646.7
40
2024 年 3 ⽉期
16.4%
業
の
66.0
59.8
51.2
2024 年 3 ⽉期
(
2025 年 3 ⽉期
)
男性
4000
3000
2000
5
1000
・
2025 年 3 ⽉期
0
2026 年 3 ⽉期
)
ロ
財
・
AIを活用した人財マッチングシステ
運輸向け配達員専用端末、貨物追跡シ
家電(スマートフォン、テレビ、カメ
ム の 開発 や 、営業支援・ス タッフ 募
ステム、作業・輸送管理支援、SNS連
ラ、AIスピーカーなど )
の設計・開発
集・契約管理等の業務支援システム
携機能や 、航空機の座席予約、料金決
2026 年 3 ⽉期
女性
女性比率
3,088
780
3,264
2,308
25.3%
26.0%
・
2024 年
・
メガバンクやネット銀行、生損保のア
医大との共同研究による眼科領域にお
国内旅行販売システム、旅行会社向け
プリケーションやクラウドを含めた
けるAIを活用した画像診断や、医療機
商品造成・場貸サイト開発、AIを活用
プラットフォーム開発、データ分析
器メーカーとの協業による製品開発
したホテル部屋割りシステム
業務支援
3,602
財
934
848
2,416
・
・
2,668
(
)
(
)
1株当たり当期
1株当たり
当
当
1
1
3月期
1
25.9%
2025 年
3
3
1
業
60
2026 年
40
11.0%
40
12.0%
43
12.6%
46
3月期
の指標
た
ー
を
(
)
( )
Pt [ 2026年3⽉期]
[ 2026年3⽉期]
30
3月期
ERP導入関連サービス、
開発品質向上サービス
(TrustCodeHub等)
車載表示機器のデジタル化やデジタル
50
2024 年 3 ⽉期
(
Robotics関連サービス
(UiPath等)
、
—
済システム
[2026年4⽉1⽇時点]
10
0
クラウド関連サービス
(Creage等)
、
ューシ
80
400
0
自動車、輸送機器、機械、エレクトロニクス、その他
[2026年3⽉期]
800
587.6
銀行、保険、その他
%
%
527.5
建設・不動産、旅行・ホテル、医療・ヘルスケア、その他
ュー シ
お客様のDX実現を支援する製品・
サービスからなるソリューション群
[2026年3⽉期]
600
情報・通信、広告、流通サービス、運輸、
人財紹介・人財派遣、公共、資源・エネルギー、
●開発・保守の総合サービス
%
1
ー
80
64.4
65.8
66.5
2024 年 3 ⽉期
2025 年 3 ⽉期
2026 年 3 ⽉期
60
40
20
20
10
3
0
2024 年 3 ⽉期
2025 年 3 ⽉期
2026 年 3 ⽉期
0
(注)2024年7⽉1⽇付で普通株式1株につき2株の割合で株式分割を行っております。前連結会計年度の期首に当該株式分割が行われたものと仮定して、1株当たり当期純利益を
算定しております。
0 8
CRESCO | 統合報告書 2 0 2 6
CRESCO | 統合報告書 2 0 2 6
0 9
トッ プメッ セー ジ
代表取締役社長執行役員
冨永宏
1 0
CRESCO | 統合報告書 2 0 2 6
What's next?
技術と品質をベースに、生成AI時代における
お客様の経営戦略を的確に理解し、
その実現に貢献する、戦略パートナーとして
事業を拡大します。
CRESCO | 統合報告書 2 0 2 6
1 1
トッ プメッ セー ジ
成長を支える競争力
l クレスコの持続的な成長を支える強みとは。
ばならないと感じるのは、お客様の経営戦略を的確に理解し、
私たちは、創業以来、38年間変わることなくひたむきに
現在、その比率はまだ低く 、
「我々 の」経営戦略として非常に
お客様にサービスを提供してきた結果、きわめて多くリピー
重要だという認識のもと 、育成戦略や採用戦略を推進してい
トのお客様を擁しています。金融や旅行業、そして自動車業
かなければならないと考えています。
界など幅広い業種・業態におよび 、それぞれのお客様の経営
戦略、成長戦略を実現するためにITを使いたいというニー
ズは引き続き強いとみています。お客様は業界の中で確実に
かつ実現に貢献できるエンジニアを増やしていくことです。
l 生成AI時代をどのように捉えていますか。
生き抜いていかなければならない、グローバルな戦いの中
AI 、特にアンソロピックの登場など、生成AIがSIあるいは
でも勝たなければなりません。自動車を例に挙げれば、海
IT系のビジネスを破壊するエンジンになっ てしまうのでは
外のメーカーより先進的な技術、製品開発を実現していかな
と世の中で言われています。SIerの仕事がなくなるのではな
ければなりません。ITでこうした企業の経営をしっかり支
いか 、と。私たちから見れば 、決してそんなことは起こりま
えていくというビジネスへのニーズは、まだまだ旺盛で
せん。私たちは、お客様向けにシステムを実稼働させる、これ
す。私たちのグループ会社14社(2026年4⽉1⽇時点)
の状況
をサービスインと称していますが、ものづくりも含めてサー
を見ても、単体同様にやはり伸びており、今後もこの状態は
ビスを提供しています。生成AIの影響で、確かにそのプロセ
が、お客様の、例えば自動車や金融ビジネスといった業界ごと
続くだろうと見ています。
スの中でやり方はかなり変わっていくと認識しています。プ
採用時に、ビジネスのフラグ付けをした人財の10年後をイ
の戦略、そしてその企業特有のマネジメント戦略まで学ぶ必
メージするとどうなるでしょうか。私たちSIerの仕事は、シ
この10年間を振り返ると、ITに対するお客様のニーズ、あ
ログラミングなどの工程が省力化される部分はもちろんあり
要があり、エンジニアの教育の仕方は、従来とはかなり異なっ
ますし、全体の納期も短縮されるでしょう。その⼀方で、生成
ステムを作り上げて提供し 、お客様のビジネスのスタートを
るいはITに対する向き合い方に変化が現れています。10年
たものになっています。
AIをツールとして使いこなすためのエンジニア、AIからの
しっかり見守って、その後もさらに改善を重ねていくことで
前は、ITはお客様から見ればコストだったのですが、ここ数
生成AIに関する勉強の機会として、社内でさまざまなコン
アウトプットを検証するエンジニアは 、より⼀層重視されて
す。それが 、⼀つのプロジェクトです。プロジェクトをしっ
年はITがお客様の業績を伸ばしていくための⼀つのツール
テンツが制作され、社員に共有されています。あわせて、お客
いきます 。私たちの業務においても 、AIを新たなツ ー ルと
かり遂行するためには、ヒト、モノ、カネをしっかりマネジメ
になっているという感覚があります。現在では、生成AIやさ
様とともにビジネス勉強会を開催し 、お客様のIT理解と私た
して活用しながら 、さらに 、AIを前提とした「 AI駆動開発」、
ン ト する 必要 があります。そこで 、プ ロ ジェク ト マ ネー
まざまなソリューションによる自動化、業務効率化のツール
ちのビジネス理解の促進を図っています。このように、今後、
Trust Code Hub(品質向上ツール)
を活用した品質担保を推
ジャーという役割が非常に重要になってきます。最初にビジ
を駆使しながら、ITを使っ て事業を進化させ、業績を伸ばし
社内教育の形態はさらに変化していきます。
たいというニーズが、⼀層の高まりを見せています。
進し、より良いサービスをお客様に提供していくことが重要
ネスのフラグ付けをした人財に、たとえエンジニアのスキル
このような環境のもとで、我々自身、今、⼀番変わらなけれ
だと考えています。
成長を支える人財戦略
また、当社の採用基準についても、現在、応募者の特性に応
が十分備わっていなくとも、プロジェクトマネジメントの能
じてビジネス人財、エンジニア人財とフラグを立てる試みを
力がより求められる時代になっていくと思います。なお、中
始めています。採用の段階から 、この人はエンジニアに向い
途採用はさらに激しい人財の奪い合いになっていますが、即
ているのか、あるいはビジネスに向いているのかを見ていこ
戦力として非常に成功している例も多く 、私たちは中途採用
うというものです。私たちは従来、技術と品質重視の会社と
にも注力していく考えです。
言われ 、私たちもそうした自負を持っ て活動してきました。
採用現場においてアピールするクレスコの優位性は、やは
l 生成AI時代の人財戦略について教えてください。
しかし 、エンジニア色の強い人のみを採用する時代は終わり
り技術と品質がベースになります。そこに志向がマッチする
新卒でいうと22歳で入社し 、以前は28歳ぐらいまでは基礎
を迎えつつあると感じています。現在でも採用は 、文系が半
人は、当社と非常に相性がいいと思います。加えて、お客様に
からコーディング等の技術を身に着ける期間でしたが、今で
分、理系の中でも情報系が3割となっています。ただ、そうし
近いところで仕事ができるというところもうまくマッチす
当社グループの人財は、90%がエンジニアで構成されてい
は22、23歳ぐらいから、上流工程およびプロジェクトマネジ
た区別はもはや必要ないのかもしれないとも感じます。若い
ると考えています。かつて、私が採用担当だった当時、多くの
ます。私自身もシステムエンジニア出身です。入社してすぐ
メントに必要とされる、お客様としっかりと会話する能力を
時からお客様を訪問して、多様なお客様のビジネスをしっ か
大学を訪ねる中で、これだ ! と思いついたのは、私たちの「ク
の段階から、プログラミングの勉強から始まり、お客様と⼀緒
身に着けるようになっています。テクノロジーの勉強は必要
り勉強し 、お客様と対話できる人が必要なのです。情報系で
レスコ憲章」です。これを見て「⼀緒にやりたい」という思い
になっ てさまざまなものづくりに携わっ てきました。ただ
ですが、同時にお客様の業務を理解し、グローバルに幅広い情
しっかり勉強してきた人たちは、技術に対する集中力は素晴
を持つ人は、やはり当社との相性がよかったのです。特に、若
し 、今の若い世代の方たちは 、プログラミングやものづくり
報収集にも努め、各人がスピーディーに成長していかなけれ
らしいのですが、お客様との対話力という点ではかなり訓練
い人たちは憲章にある「自由」
「若さ」
「夢」などのキーワード
にかける時間がかなり短くなっ ていると思います。例えば、
ばなりません。エンジニアという言葉に引きずられがちです
が必要だという人も多いのです。
によって、自由に仕事ができる企業文化を感じ取って、
「⼀緒
に働きたい」と当社にマッチする度合いが高くなります。
1 2
CRESCO | 統合報告書 2 0 2 6
CRESCO | 統合報告書 2 0 2 6
1 3
トッ プメッ セー ジ
l クレスコならではの人財戦略とは。
現在、IT人財市場は、エンジニアを採用したい企業の増加に
より、極めて売り手優位の環境となっ ています。ユーザー系
エンジニアがお客様の隣にいて対話できるということ自体
企業、これは私たちのお客様ですが、そうした企業で、AI
が、私たちのきわめて大きな強みです。そこにビジネスのフ
の進展もあり、自前でIT業務を行うことに対するハードルが
ラグを付けた人財を増やすと、その特色が薄れてしまう懸念
下がってきています。IT人財を囲い込んで自分たちでで
があるかもしれません。現在でも、新卒社員のうちの多くが
きる部分は内製化する方針に変化し、我々 としては採用難を
エンジニア採用ですが、普通に昇格すると28歳ぐらいでエン
きわめて身近に感じています。また 、⼀方でSIerは幅広いビ
ジニアを卒業し 、プロジェクトマネージャー あるいはスペ
ジネスを手掛け 、データをしっ かり分析して 、AIを駆使して
シャリストという職位づけになります。スペシャリストはそ
お客様にサービスを提供しており、そうしたエンジニアは金
のままエンジニアとして技術を追求します。その⼀方でプロ
融でも自動車分野でも活躍できるので 、幅広い分野で仕事を
ジェクトマネージャーは、お客様と⼀緒にプロジェクトを作
したいという人たちはSIerを目指します。また、私たちの
り上げ 、最後まで推進していく役割を担っ ており 、この層を
ような独立系SIerは世界中から
ま
まな優れた技術を
しっかりと拡大していくことは、私たちにとってきわめて重
し 、自分たちで勉強したものをお客様に提供できます。
要な人財戦略となっ ています。そこでも、強みの基盤となる
ここはかなり自由度が高く、その点でも独立系は強みを有
のは技術と品質であることに変わりはありません。
しています。
人財が生み出す企業価値
持続的な企業価値向上に向けて
AIの活用は必然でしょう。しかし、中身を理解せず、ブラッ
積極的に送り出したら、自ら提案書を作成して、しっかり業績
l
クボックス化したものを作って、それをそのまま提出してい
を上げていきました。さらに 、チームの中心に据えると 、さ
います。投資するテーマ、案件をしっ かり見定めて 、その投
の経営課題の解決に寄与するソリューションや、お客様のビ
いわけはありません。AIを使っ たアウトプットを検証する
らに高い能力を発揮したのです。世界のさまざまなソリュー
資対効果の検証も確実に実施します。当社はキャッシュある
ジネスを成長させるために必要なソリューションの提案・導
ためのスキル、技術力が必須であり、これが今後の重要なテー
ションや製品情報を捉えて活用することで、トップエンジニ
いは有価証券を持ちすぎ、というご指摘をいただくこともあ
入支援を進めるものです。現在、当社はITサービス事業の3
マとなります。AIの台頭により、SIer事業を展開するための
ア兼コンサルタントとしてお客様に非常に評価されて 、何度
りますが 、そうした資金を投資に充て 、より成長を確実なも
つのサブセグメント
(製造、エンタープライズ、金融)それぞ
エンジニアあるいは技術部門に求められる技術力のハードル
も表彰されるまでに成長しました。お客様に高く評価された
のとしていく計画です。とりわけ成長戦略においては、この
れが 全体 の30%程度 の 比率 にな っ ています。デ ジ タ ル ソ
は下がっています。利便性が高まるにつれて、生成AIが作成
結果ですが 、すべての技術まで押さえていたわけではなく 、
2 ~3年の動向を見極めながら 、M&Aを意識した成長投資を
リューション事業は、現在、全体の10%程度の比率となっ て
したものの内容を私たちがすべて理解しなければならない
プロジェクトマネージャーとしての能力に優れていたからこ
実行していきます。また 、人財育成への投資も非常に重要な
おり 、これを2030年には25%にまで高めていく計画です。
のかと言えば 、それは年を経ていくうちに変化していき 、必
そできたのだと思います。お客様の中に入って、仲良くなり、
キーポイントで、資金をしっかり活用して成長に回していく
お客様のデジタルソリューションに対するニーズは非常に高
ずしもすべてを理解する必要はなくなっ てくると考えてい
それこそ宴会やゴルフも⼀緒に出掛ける 、さらにお客様の企
というサイクルを意識した経営を進めており、取締役会でも
く 、新しい戦略、経営戦略を 、スピード感をもっ て実現した
ます。そういう意味では、クレスコとしてのアウトプットに
画会議にまで参加して実績をしっかり積み上げたことが、お
活発に議論しています。CRESCO Group Ambition 2030で
い、早くスタートしたい、というお客様も多く、私たちのビジ
問題がなければ 、それを適切に検証し 、お客様のプラット
客様の経営側にまで伝わり 、クレスコの価値を高めてくれま
は、2030年の売上高1,000億円を目標としていますが、現状、
ネスチャンスも拡大しています。こうしたニーズを捉え、対
フォームに合致させる作業は、いずれAIが担う時代が来るの
した。これはボトムからの信頼が会社の成長につながっ て
オーガニックだけでは目標に届きません。従って、ここ5年、
応力を強化していくために、デジタルソリューションに強み
だと思います。
いっ た好例ですが 、お客様と⼀緒の勉強会などもその下地を
10年の戦略を踏まえ、毎年1、2社のM&Aを遂行し、グループ
を有する企業をM&Aの対象としながら 、さらなる事業強化、
作ったのだと考えています。お客様はテクノロジーを勉強し
価値の向上を図っていく考えです。その際のシナジーも重要
成長を目指していきます。すでに、2030年の目標1,000億円
たい。⼀方、私たちはビジネスを学ぶ。お互いの知識を融合す
で 、グループに参加した企業の価値をクレスコグループの力
達成に向けての次期中期経営計画も準備しており 、技術と品
ることが重要です。生成AI時代においては、こうした取り組
でどう向上させていくかも重要なテーマの⼀つだと認識して
質、そして蓄積してきた豊富な実績を活かし 、これまでにも
みをもっと拡大していかなければ、勝ち残れないと思います。
います。
増して、着実で確実な成長をお約束したいと思います。ステー
l 生成AI時代に求められる人財像とは。
l クレスコで人財はどのように成長しますか。
私たちは、人財が最重要の企業です。それを、私自身が実感
させられたのは 、私が10数年前に採用を担当した事例で 、
キャリア採用した当時25歳くらいの、今で言う第二新卒の社
員です。ビジネス視点が高く 、入社してまもなくお客様先に
企業価値向上に向けた資本政策を
教えてください。
財務方針としては 、資本コストを重視した経営を推進して
l
2030年に向けた成長戦略とコミットメントを
お願いします。
現中計で拡大中のデジタルソリューション事業は 、お客様
クホルダーの皆様には、今後とも変わらぬご支援をお願いい
たします。
1 4
CRESCO | 統合報告書 2 0 2 6
CRESCO | 統合報告書 2 0 2 6
1 5
生成AI 時代の成長ストー リー
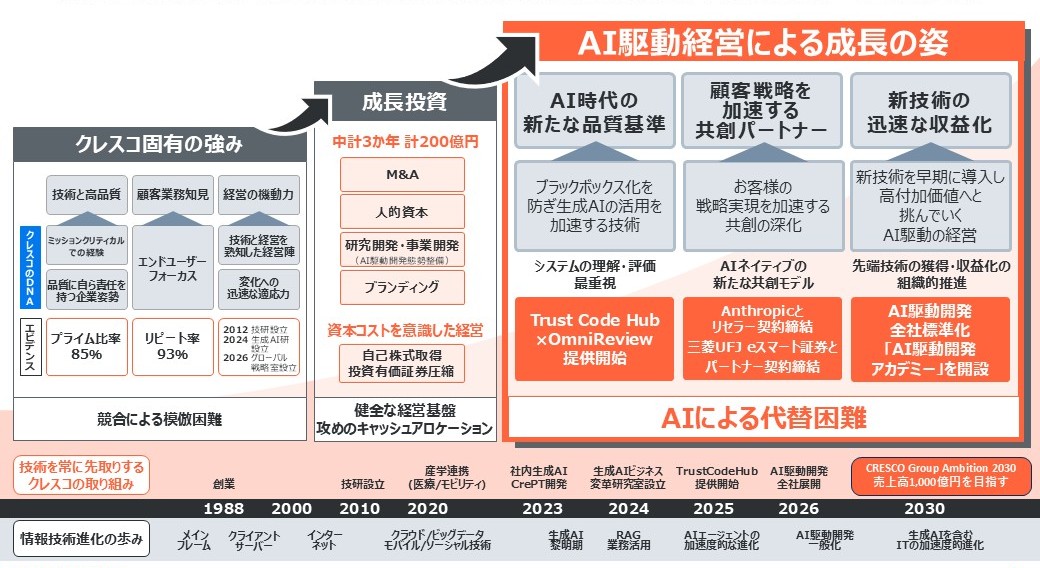
生成 AI 時代に 、新た な品質基準で成長するクレスコ
AI駆動経営による成⻑の姿
〜「 AIに代替さ れ る側」で は な く「 AIでさらなる価値を創出する側」へ〜
成⻑投資
クレスコ固有の強み
中計3か年計200億円
中計
M&A
技術と⾼品質
ク
レ
ス
コ
の
D
N
A
!
"
$
%
ミッションクリティカル
での経験
品質に⾃ら責任を
持つ企業姿勢
顧客業務知⾒
経営の機動⼒
エンドユーザー
フォーカス
プライム⽐率
85%
⼈的資本
技術と経営を
熟知した経営陣
研究開発・事業開発
変化への
迅速な適応⼒
ブランディング
(AI駆動開発態勢整備)
資本コストを意識した経営
2012 技研設⽴
2024 ⽣成AI研
設⽴
2026 グローバル
戦略室設⽴
リピート率
93%
⾃⼰株式取得
投資有価証券圧縮
創業
1988
情報技術進化の歩み
メイン
フレーム
2000
クライアント
サーバー
技研設⽴
産学連携
(医療/モビリティ)
2010
2020
インター
ネット
クラウド/ビッグデータ
モバイル/ソーシャル技術
新技術の
迅速な収益化
ブラックボックス化を
防ぎ⽣成AIの活⽤を
加速する技術
お客様の
戦略実現を加速する
共創の深化
新技術を早期に導⼊し
⾼付加価値へと
挑んでいく
AI駆動の経営
システムの理解・評価
最重視
AIネイティブの
新たな共創モデル
先端技術の獲得・収益化の
組織的推進
Trust Code Hub
×OmniReview
提供開始
Anthropicと
AI駆動開発
リセラー契約締結
全社標準化
三菱UFJ eスマート証券と (ガイドラインとプロセス
パートナー契約締結
の全社標準化)
AIによる代替困難
社内⽣成AI
CrePT開発
2023
⽣成AI
黎明期
⽣成AIビジネス TrustCodeHub
変⾰研究室設⽴
提供開始
2024
RAG
業務活⽤
2025
AIエージェントの
加速度的な進化
AI駆動開発
全社展開
2026
AI駆動開発
⼀般化
CRESCO Group Ambition 2030
売上⾼1,000億円を⽬指す
2030
⽣成AIを含む
ITの加速度的進化
生成 AIは「脅威」ではなく
「成長ドライバー 」
AI 時代に こ そ評価さ れ る 、
クレスコの「 DNA 」
全社で の AI 駆動開発の確立と
「品質の担保」
攻め の キャッ シュ アロケー ショ ンと
次世代 SIモデルへ の進化
当社は、生成AIを「人や技術を置き換える存在」とは捉えて
当社の立ち位置は定量面でも明確です 。プライム比率85%
当社は生成AI黎明期である2023年から社内生成AI「 CrePT」
生成AIという構造変化に対し、当社は守りに入りません 。
おりません 。創業以来、ミッションクリティカルな領域で磨
という数字は、パートナー任せにせず自ら品質に責任を持つ
を開発し、実務で使える形での活用を積み上げてまいりまし
健全な財務基盤を背景に、
「中期経営計画2026」3か年で総額
いてきた「高い技術力」と「品質への責任」を、より高い次元へ
企業姿勢を表しています 。また、リピート率93%という実績
た。現在ではAIを個人のスキルに留めず、
「 Trust Code Hub」
200 億円規模の成長投資(M&A 、人的資本、研究開発、AI 駆
押し上げるための技術と位置付けております 。AI 単体で価
は、お客様から「また任せたい」と評価される事業基盤の証で
などを通じてAI生成コードを⼀貫した基準で評価・検証し 、
動開発標準化など )
を進めます 。同時に、自己株式取得や投資
値が生まれるのではなく、
「業務を深く理解する力」
「品質に
す 。生成AI時代においては「誰が成果物を評価するのか」
「こ
品質を担保しながらAIを使う開発モデルを確立しておりま
有価証券の圧縮など、資本コストを意識した経営も並行して
最後まで責任を持つ姿勢」
「技術と経営が近い意思決定力」と
のシステムを本当に理解しているのは誰か」という問いがこ
す 。失敗が許されない領域で価値を創出してきたクレスコだ
推進しております 。当社が目指すのは、高い品質基準のもと
いった、AIや競合には代替・模倣されない「人と組織の力」こ
れまで以上に重要になります 。当社は、お客様がシステムを
からこそ 、ブラ ッ クボ ッ クス化を防ぎ 、システムを理解・評
でお客様の戦略実現を加速させる「共創パートナー」です 。新
そが真の価値を生み出します 。
深く理解し評価できるよう、中核として支え続けることで、
価する力を中核に据え続けることが可能です 。
技術を早期に取り込み 、高付加価値へと転換させることで 、
AI 時代において確固たるポジショ ンを築いています 。
1 6
顧客戦略を
加速する
共創パートナー
健全な経営基盤
攻めのキャッシュアロケーション
競合による模倣困難
技術を常に先取りする
クレスコの取り組み
AI
AI時代の
新たな品質基準
CRESCO | 統合報告書 2 0 2 6
次世代のSI 事業モデルへと進化し続けます 。
CRESCO | 統合報告書 2 0 2 6
1 7
経営戦略担当メッ セー ジ
「共創型モデル」の進化を加速し、デジタルソリューション事業
の拡大に取り組むとともに、生成AI時代に活躍する
人財育成と採用戦略の多角化を進めます。
での仕事を求める現場の人財ニーズにも応えています。なお、
取締役常務執行役員
経営戦略担当
グローバル人財とグローバル戦略については 、インドの理系
寺村孝幸
l 中計2026の2年目を振り返って
ハイスペック人財獲得の強化、ベトナムでのオフショア事業に
2025年度にモビリティに特化したモビリティDXビジネス
加えて、アライアンスやM&Aを含めたAIに強いスタートアッ
本部を設立し 、銀行セグメントに次ぐ第二のセグメントとし
プとの連携も模索しています。今後は、インドや北米でのビジ
て成長を目指しています。直近の動向を見ると 、自動車メー
ネス展開を計画しており、現地での採用活動も積極的に実施し
カーでBEV(Battery Electric Vehicle:電気自動車)
の延期に
ています。
よるビジネスプランの変更が生じており、2025年度は非常に
近年は採用の早期化に加え 、生成AI時代のキャリアやスキ
大変な1年になると予想していました。⼀方で 、BEV以外の
ルへの不安を抱える学生も増えています。こうした状況を踏
自動車販売は非常に好調に推移しており 、ソフトウェアに
まえ、私たちは従来の新卒採用に加えて、通年採用やグローバ
よっ て車を進化させる事業は 、今後も着実に進展していきま
ル人財、他業界からの社会人採用も検討しています。また、生
す。私たちは、現在、名古屋大学との産学連携を通じてOSDVI
成AIがコーディングをサポートすることによって、従来より
(Open SDV Initiative)活動を推進し、自動運転領域での人財
もITスキル習得のハードルが下がっていますが、そのような
育成を強化しており 、今後、社会の進化にも寄与していきた
リューション
「 Trust Code Hub」は、生成AIが出力するコード
時代においても、お客様の言葉を論理的に分析して、それを生
いと考えています。また、この分野における大手自動車メー
の品質チェック、セキュリティ や脆弱性の分析を行うプラッ
成AIのプロンプトとして入力できるエンジニアの存在が 、よ
カーへの社員教育サービスも提供しています。
中期計画2年目の2026年度は、私たちの⼀丁目⼀番地に位
トフォームで、生成AI時代に必要なツールソリューションと
り重要になってきていると考えています。最終的に、お客様と
置する共創型モデルの進展に取り組みました。クレスコの主要
して、お客様に提供するものです。さらに、品質管理の強化策
きちんとコミュニケーションができ、お客様のことを理解で
なお客様と協働しお客様の企業価値を共創していくスタイル
として 、QMS(クオリティマネジメントシステム)
の強化を図
きるエンジニアが求められているのです。
のビジネスは、想定以上の進化を遂げています。お客様のシス
ります。特に 、内部監査を徹底し 、マネジメントシステムが適
l
テム開発内製化支援や新技術に関する共同勉強会の開催など
切に機能しているか、形骸化していないかをチェックしてい
を通じ、
「お客様とともに、お客様のビジネスを考え」、その実
ます。この結果、2025年度は、クレスコ単体では大きな品質問
現に貢献しており、従来の受託型ビジネスから大きく変容した
題は発生しませんでした。
l デジタルソリューションおよびDX戦略の進展
人的資本や技術力など非財務資本を増強し、
一人当たり売上高を引き上げる
当社は 、投資家の皆様からキャッシュ をどのように使うの
かというご指摘をよく受けます。 M&Aへの活用はもちろん、
デジタルソリューション事業は、現在、当社グループ売上高
やはり私たちのビジネスの根幹は人だと認識しており 、人財
ただし、2025年度はグループ会社で大型プロジェクトでの
の10%を占めるに至りましたが、利益ベースではさらに大幅
投資に積極的に充てていく考えです。その認識のもと、非財務
ライム受託比率85% 、顧客リピート率93%という高い顧客評
品質問題が発生しました。これらの問題は、グループ各社の成
な伸びを示しています。従来のRPAやクラウドソリューショ
資本の財務転換戦略として、人財育成への投資と⼀人当たりの
価に寄与しており 、お客様との取引が長期にわたり継続して
長に伴い、より大型で、かつ難易度の高いプロジェクトに挑戦
ンに加え 、前述した「 Trust Code Hub」が今後の成長エンジン
売上高の連動策を進めています。具体的には、人財育成投資お
いることが、私たちにとっ て大きな武器となっ ています。ま
する機会が増えたことに伴うものと分析しています。対策と
として期待されています。生成AI時代の品質担保という観点
よび採用活動への投資、給与制度の見直しを含む人事制度改革
た、お客様自身が、少子高齢化をはじめとする厳しいビジネス
して、クレスコから技術スタッフをグループ会社に派遣し、品
で 、この「 Trust Code Hub」を私たちのソリューションとし
が重要なテーマとなっています。2025年度に実施した人事制
環境に対応するための変革を迫られる中で、私たちが生成AI
質問題の抑止と解決に向け支援を実施しています。
て、強力に推進していく計画です。生成AI時代に真に必要なプ
度改革により、エンゲージメントサーベイで従業員の制度面に
l
ラットフォームとして、マーケット、業種、業態を問わず、さ
関する満足度が向上しました。また、採用と人財流出防止の両
まざまなお客様にプラットフォームを提供していきます。
面から待遇改善についても積極的に取り組み、平均5%の昇給
2030年にはデジタルソリューション事業が当社グループ売上
率を継続し 、住宅手当の支給期間を「入社後3年間」
から「30歳
全体の4分の1を占めることを目指しており、M&Aや自社オリ
まで」に拡張するなど、若い世代のニーズに応える制度改革を
当社ビジネスを担う人的資本の充実については、質と量の2
ジナルサービスの開発を通じて拡大を図っていく計画です。こ
実施しています(世帯主を対象とした住宅手当制度等)
。
つの課題があります。質に関しては、生成AIビジネス変革研究
れにより、ストック型収益を拡大するビジネスモデルを構築し
室を中心とした教育プログラムを展開しており 、生成AIのエ
ていきます。
と評価しています。共創型モデルの進展は、クレスコ単体のプ
やそれを活用するDXの知見を持ってお客様のビジネス変革を
支援していることも、当社の強みとなっ ています。あらゆる
産業のお客様からビジネス変革をさらに進めたいという声が
寄せられており、
「共に考えてほしい」というオファー の増加
は、私たちのビジネスチャンスの拡大に繋がっています。
l
1 8
l モビリティDX事業の展開と課題
適正なプロジェクト利益率の確保と
品質担保の両立
生成AI時代に活躍する人財育成と、
採用戦略の多角化
さらに、長期的な視点での人財戦略については、お客様のビ
ジネスや業界をより深く理解し、DXやAIの活用によってお客
ンジニアのレベル判定も含めて、全社員をAI駆動開発に対応で
なお、当社グループのDX戦略として、社内DX化と組織統合を
様の収益向上に貢献できる人財の育成が重要であると認識し
きるエンジニアとして育成しています。量に関しては、採用に
検討しています。社内DX化については、2025年度に基幹システ
ています。今後は 、FDE(フォワード・デプロイド・エンジニ
生成AIの利用が⼀般化する時代になっ ても、生成AIのアウ
おいてグローバル人財の採用、リファラル採用の強化、ハイス
ムを変更し、BI整備に順次取り組んでいます。また、管理部門の
ア)
のような上流工程に対応できる人財の拡大を目指していく
トプットがすべて正解というわけではないため、アウトプッ
ペックなエンジニアのキャリア採用に加え、当社OB・OGで構
DX化をAIエージェント活用も含めて強化しており、将来的には
考えです。
トをいかにレビューし、結果の品質をどう担保するのかが、今
成するアルムナイ活用によって、あらゆる角度から強化を図っ
社内DXとお客様DXの各推進組織を統合することで、より効果
後、重要になっていきます。2025年にリリースした当社のソ
ています。特に、インド人財の発掘については、より上流工程
的なDX推進の実現を目指します。
CRESCO | 統合報告書 2 0 2 6
CRESCO | 統合報告書 2 0 2 6
1 9
IT
OUTCOME
報
.
2. IT
3.
INPUT
2030
1,000
会
OUTPUT
年
334
IT
69.9
IT
P24
3,602
IT
年
6,446
年
2026
8
P27
107
会
267
14
4
10
1
2
1
5
会
3
6
7
ー
等
ー
等
ー
等
の
年
員
674,557 kWh
268,000
P24
P40
/
20
CRESCO |
2026
P36
/
P02
CRESCO |
2026
21
価値創造ストー リー/ マテリアリティ( 重要課題)
クレスコはIT開発技術と高品質なサービスで、世の中のさまざまな仕組みを作り、価値を生み出すシステムインテグレーター
です 。2030 年の「ありたい姿」とそこまでの道のりをロー ドマッ プに描き 、成長を続けます 。そして 、高度に発展したデジ
タル社会を実現し、持続的な発展・安定をもたらすことを目指し経営しています 。
サステナビリティ に関す る基本方針
社会にもたらす価値:当社グルー プにお けるサステナビリティ経営
これまで取り組んできた顧客とのパートナーシップを土台に、誰ひとり取り残さないデジタル社会を構築します。
「企業活動の成長が世界の人々の幸福に可能な限り最大の貢献をすること、そしてそこに働く人々がともに
喜びと誇りをもち、自己の能力を最高に発揮できること」は企業の使命であると考え、また、人間はみな平等
であるという立場から、発揮する能力以外の性別、学歴、血縁、人種、国籍、宗教等すべての差別を無くし、技
術の追求を中心とした自由で、活気のある経営を行いたいと考え、創業以来、これを実践してきております。
証
高度に発展した
デジタル社会
私たちクレスコグル ー プはその実践を通じて豊かな社会づくりに貢献し 、ESG(環境・社会・ガバナンス)
の観点でさまざまな事業活動、企業活動に取り組むことによって「持続可能な社会」の実現と私たちクレスコ
環境
の
グリーンテクノロジーの普
券
データ活用による
体価値向上
グルー プの成長を目指してまいります 。
2
自動運転やEV化
オートメーション
安
顧客の事業を通じた
社会課題への貢献
セキュアで
が保たれた生活
IT・技術を中心とする提供
価値と顧客の事業を掛け合
わせて、社会課題の解決に
貢献する
銀行
金融
2022 年4 ⽉25 ⽇
顧客
株式会社クレスコ
代表取締役社長執行役員
生
保
2
証券
/ 運輸 / 旅客
人財
製造
冨永宏
1
共存共
自動車
による
成長
旅行 / 不動産
医療
ヘルスケア
ー
エレクトロ
ニクス
デジタル社会の
持続的な発展・安定
1
当社グループが持続的に成
長するには顧客の成長が不
可⽋であり、パートナーと
して顧客の成長を実現する
当社グルー プのマテリアリティ(重要課題)
エネル
エンター
プライズ
デジタル
ソリューション
IT・技術
デジタル社会への移行が進
む中で、誰⼀人取り残さな
い安全かつ持続的な発展を
推進する
データアナリティクス・クラウド・AI
ロ ティクス・アジャイル・セキュリティ
「当社グループにとっての重要度」と「ステークホルダーにとっての重要度」の双方が高い5つのテーマを「優先して取り組むべき課題」
と位置づけ、取り組んでいます。選定は、社会重要度と事業影響の二軸評価に基づきます。
プロセス
課題抽出
二軸評価
5テーマ集約/取締役会承認・年次見直し
CRESCO Group
Ambition 2030
人が想い描く未来、その先へ
クレスコグループは最高のテクノロジーと絆で
“わくわくする未来”を創造します
ITを通じた
地球環境への貢献
2 4
CRESCO | 統合報告書 2 0 2 6
継続的な
ガバナンスの
点検と向上による
価値提供の維持
経
営
基
盤
の
さ
ら
な
る
強
化
ITを通じた
地球環境への貢献
グリーンテクノロジーの普及(GX)
を通じて、顧客とともに脱炭素社会
を実現
安全なデジタル
社会の確立
社会全体におけるセキュリティ向
上に貢献し、安全・安心でレジリエ
ントな社会を実現
多様な人財が
働きがいを持って
活躍できる
機会の創出
変革に挑戦する次世代を担う人財
を育成し、多様な人財がイキイキと
働ける働きがいのある職場環境を
構築
継続的な
ガバナンスの
点検と向上による
価値提供の維持
強固な企業統治の仕組みを構築し、
企業価値を高め続ける事業運営体
制を確立
IT・技術を通じて顧客の競争優位性を創出し、ともに社会を前進させるデジタル価値創造企業を目指します。
CRESCO Group
Ambition 2030
ステージ
3
顧客の競争位性
の創出
デジタル価値創造企業
世 を
に価値創造し
持続的に発展
中期経営計画 2026
ステージ
2
戦略パートナー
顧客の成長をリード
共創型モデルへシフトし
IT・技術で顧客の成長を実現
す
多様な人財が
働きがいを持って
活躍できる
機会の創出
安全なデジタル
社会の確立
社会全体のデジタル化を推進し、誰
もが必要な技術・デジタルサービ
スにアクセスできる環境に寄与
ルー
DX・イノベー
ションによる
持続的な社会の
実現
事
業
を
通
じ
た
社
会
課
題
解
決
顧客にもたらす価値:価値創造のロー ドマッ プ
DX ・ イノベー
ションによる
持続的な社会の
実現
ステージ
1
顧客の IT 基盤整
これまでのクレスコ
顧客の多様な
IT・開発ニーズに対応
マテリアリティ
(重要課題)
を
抽出し、取り組みを開始
2024 年
2026 年
2030 年
CRESCO | 統合報告書 2 0 2 6
2 5
特集
当社のマテリアリティと中期経営計画との連動
価値創造の中期経営計画
当社は 、持続的な企業価値向上に向けて 、ステークホルダー の視点と社会環境の変化を踏まえたマテリアリティ
2030年の「ありたい姿」に向けて価値創造するため、第2ステージとして、2024年スタートの「中期経営計画2026」
(重要課題)を特定し、中期経営計画と連動した取り組みを推進しています。
を策定しました。第1ステージで生み出した価値を振り返るとともに、これからの戦略をひもときます。
マテリアリティ の特定プロセス
「中期経営計画2026」の開始とその位置づけ
社会課題・社内外の意見を踏ま え た候補抽出
当社グループは、2030年までに売上高1,000億円企業になることを目指します。
そこに向け、2024年から始まった「中期経営計画2026」では「挑戦」のテーマのもと、
売上高700億円(※)達成を目標に戦略を策定しています。
※2026年5⽉8⽇発表の2027年3⽉期業績予想において、2026年度の売上高目標を715億円に上方修正しました。
売上高
1,000億円
715億円に
重要性評価(ステー クホルダー影響×自社への影響)
を目指す
上方修正
売上高
700億円
デジタル
ソリューション
到達
経営会議に よ る決定・中期経営計画と の整合
売
上
高
エンター
プライズ
飛躍
開示と継続的見直し
金融
挑戦
変革
I
T
製造
区分
マテリアリティ(重要課題)
主な対応戦略(中計との連動)
顧客と共創する新たな価値の提供
新サービス・ソリューション創出、DX推進
AIの活用・デジタル定着
生成AI活用・CrePT開発・内製化強化
技術基盤強化
技術力の向上
研究開発戦略、技術ブランディング
組織・人財基盤強化
人財育成・多様性・エンゲージメント
教育体系整備、DE&I推進、柔軟な働き方
顧客信頼
顧客本位のサービス・提供価値
品質向上、顧客満足度調査の活用
環境・社会責任
サステナビリティ推進
脱炭素対応、GHG排出削減、環境配慮のシステム開発
コンプライアンス・統制
企業倫理・ガバナンスの強化
グループ経営管理、リスクマネジメント
情報セキュリティ
サイバーリスク対応
セキュリティ対策、ISMS 、CSIRT運用
社会価値の向上
社会的信頼の向上
ブランド価値向上、透明性の高い情報開示
事業年度
2021
2022
2023
中計 2023
2026
2027
2028
2029
2030
中計 2030
「中期経営計画2026」の詳細は当社ウェ ブサイトをご覧ください ▼
https://www.cresco.co.jp/ja/ir/operation/plan.html
中期経営計画2026
2 年目の進捗
「中期経営計画2026(2024 ~2026年度)」は2年目を終えました。2026年3⽉期は、売上高646億円と着実に進捗しました。⼀方、営業
今後の見直し方針
マテリアリティは社会・環境変化に応じて定期的に見直し、ステークホルダーとの対話を通じて開示内容の進化を図っていきます。
CRESCO | 統合報告書 2 0 2 6
2025
中計 2026
事業機会の創出
2 6
2024
利益は営業利益率の改善に課題が残り、66億円と期初予想を下回りました。ROEは16.4%となり、中期経営計画の目標(15%以上)
を上
回りました。最終年度は収益性の改善を図り、計画達成を目指します。
2024年3月期実績
中計2026目標
(2027年3月期)
700億円
2026年3月期実績
68.6%
連結売上高
527億円
連結営業利益額
51億円
80億円
66億円
連結営業利益率
9.7%
11.5%
10.2%
(最終計画値との差)
ROE
14.3%
15%以上
16.4%
(最終計画値との差)
(⇒2026.5.8、
715億円に上方修正)
646億円
進捗率
(3年増収計画額に
対する進捗率)
51.7%
(3年増益計画額に
対する進捗率)
▲1.3%pt
+1.4%pt
CRESCO | 統合報告書 2 0 2 6
2 7
特集
中期経営計画 7 つ の戦略の取り組み状況
キャッシュアロケーション方針
「中期経営計画2026」において、当社は3年間で創出するキャッシュのうち200億円を成長投資と株主還元に最適
成長戦略
2025年度の取り組み状況
主な課題
配分する基本方針を掲げ、資本コストを意識した経営のもと企業価値の向上を推進しています。その進捗として、
2024・2025年度累計で132億円の投資を実行しました。具体的には、株主還元方針の変更に伴い2026年3月期
の普通配当を年間64円(配当性向約50%水準)に増配したほか、次期(2027年3月期)においてもさらなる増配や
(※1)
( ※2)
自社株買いにより還元を一層強化してまいります。
1
共創型モデル
の確立
・戦略パートナーが3社増(計5社)
・アカウント別戦略で社員1人当たり利益額が向上
・次期候補アカウントへの
アプローチと共創推進の加速
※1
※2
2026年5⽉8⽇、1百万株または20億円を上限に自己株式取得を発表し、実施中。
(2026年9⽉18⽇現在)
2026年7⽉31⽇、中間配当における1株あたり10円の「上場30年記念配当」の実施を発表。
24・25年度累計
キャッシュイン
2
品質リーダーシップ
発揮
・レビューや内部監査の強化により、
不採算(赤字)
プロジェクトが大幅に減少
アロケーション
・数値面にとどまらない
「ビジネス品質」自体の向上
49 億円
株主還元
3
人的資本
経営推進
・新卒・外国籍採用目標を達成し退職率も改善
・エンゲージメント向上施策を展開
事業からの
キャッシュイン
・高度専門人財の確保・育成と、
投資
エンゲージメントのさらなる
向上
37 億円
M&A
4
5
技術・デジタル
ソリューション
(DS)
の拡張
事業連携促進
・継続的なコード改善でソフト
・DSビジネスの拡張により、重点技術領域
およびDSの売上・利益率の目標を大幅達成
ウェア品質向上を実現する
人的資本
手元資金
「 Trust Code Hub」提供開始
・国内初のSonarQubeゴールド
研究開発
事業開発
リセラーパートナー認定
・アライアンスパートナーとの連携実績創出や、
大学等との関係性強化(社外発信)
を実施
ブランディング
保有資産最適化
資金調達
・事業本部ごとのビジネス
パートナー(BP)戦略の
26年度までの
の実現
6
デジタル変革実現
生成AI適用など社内DXを推進。
28 億円
16 億円
2 億円
再構築。
•連結売上の2ケタ成長
・データ分析基盤の構築や、開発プロセスへの
132億円
・生成AIの本格導入
(業務への組み込み )
と
各種DX施策の定着。
•生産性向上、デジタル
ソリューション比率の
拡大に伴い収益性は
改善見込み
•財務健全性を保持で
きる範囲における
3年間で
財務レバレッジの
200億円
•不足するケイパビリティの獲得、および事業
引き上げ
構造の転換を図るための戦略的M&Aの遂行
•戦略パートナー化に向けた
7
グループ一体経営
・グループ間連携による大型案件受注や、
M&A(2社グループ入り )
を実行
・コーポレート共通化業務の
計画実行と、基幹システム
のグループ展開
•株主還元の強化・安定化
高度専門人財の確保、育成の強化
-配当性向50%水準へ
•研究開発・自社デジタルソリューション開発、
引き上げ(2025年5⽉発表)
およびデジタル変革推進に係る開発
•業績目標の達成度に
応じた配当性向の向上
2 8
CRESCO | 統合報告書 2 0 2 6
CRESCO | 統合報告書 2 0 2 6
2 9
特集
生成AIの取り組み
当社は、
「中期経営計画2026」の成長戦略を推進すべく、生成AIの全社的活用に取り組んでいます。自社での実践
で徹底的に培っ た生成AIのノウハウと、創業以来鍛え上げた技術を融合させ、AI時代の新たな品質基準へと進化
させています。これらの強みをお客様の価値へと転換し 、実際のプロジェクトにおけるAI駆動開発を通じて 、
お客様の戦略実現とビジネス変革を加速させる「共創パートナー 」としての成長を目指します。
生成AIを活用した顧客事例
「自社で使い倒す」社内実践と人財育成
「まずは自社で徹底的に使い倒す」方針のもと 、自社開発の生成AIチャットサービス
「 CrePT」の運用等を開始し 、
「 CrePT」その他生成
事例 1
(2026年4⽉~7⽉)
。また、全社員を「 AI駆動開発」に対応でき
AI利用率(※)は開発部門で94.1% 、管理部門で95.3%となっています。
リバースエンジニアリングによる設計書の自動作成を実現しています。
古いシステムのドキュメントを逆生成する案件において、開発工程に生成AIを活用しました。AIエージェントが初版で「完成度90%」
の設計書を自動作成し、残りの10%を当社のエンジニアが仕上げることで、作業の大幅な効率化と保守体制の構築を実現しています。
設計書
(初版)
ソースコードリポジトリ
残りの仕上げ・
レビュー
設計書
(完全版)
るエンジニアへと育成すべく「生成AIリテラシー講座」を実施し、受講率は95%を超えています。
※業務において生成AIを利用している従業員の割合
開発部門
生成AI利用率
設計書サンプル
AIエージェント
フロントエンド/
技術スタック情報
完成度
90%
エンジニア
完成度
100%
94.1%
管理部門
「生成AI
リテラシー講座」
95.3%
95%超
生成AI利用率
受講率
AIが9 割を自動生成し、エンジニアが1 割の高度な仕上げを行うことで、
保守不能だっ たシステムの再構築を劇的なスピー ドで実現
AI 時代の新たな品質基準「 Trust Code Hub」
生成AIの導入による開発スピード向上に伴い、出力されるコードの信頼性担保が不可⽋です。当社は、AI生成コードを⼀貫した基準で
事例 2
ヤクルト本社様データベース移行案件(マイグレーション)
既存システムを次世代システムへ移行する際、約3,500本のSQL変換に生成AIを活用しました。アセスメント段階で非互換要素を洗
い出し、AIが下書きを量産し人間がレビューを行う体制を構築したことで、⼀部開発工程の効率化を実現しました。
3 0
CRESCO | 統合報告書 2 0 2 6
評価・検証するプラットフォーム
「 Trust Code Hub」の提供を開始しました。スイスSonar社のプラットフォームを活用しており、
国内初の「 SonarQubeゴールドリセラーパートナー 」に認定されています。2026年8⽉には 、多視点AIレビュー機能「OmniReview」
を加え、上流から下流まで⼀気通貫で品質と生産性の向上を実現します。
CRESCO | 統合報告書 2 0 2 6
3 1
事業環境認識
経営環境
事業別概況
●新型コロナウイルス感染症の影響は収束しつつあるが、資源・人手不足による
調達コスト上昇圧力が継続
●顧客企業はITによる生産性向上投資を加速
●情報サー ビス産業全体にとっ てプラスの影響が継続
IT サー ビス事業
エンター プライズ
203.11
売上高
240 億 08 百万円(前年同期比 8.9
)
%
対処すべき課題
1
IT エンジニアの確保と育成
対処すべき課題
4
不採算プロジェ クトの発生防止
対策
対策
●採用活動強化、M&A 、ニアショ ア/
オフショ ア強化によるエンジニア数増
●原因究明と再発防止のための仕組みや体制の構築
32 億 96 百万円(前年同期比 31.9
Point
「情報・通信・広告」分野におけるアプリケーション開発支援業務の
増加。利益は、売上高と同様の要因に加え、前年同期に発生した「人
財紹介・人財派遣」分野の不採算プロジェクトの収束が影響。
147.40
)
%
セグメント利益
22 億 08 百万円(前年同期比 7.7
グルー プ連携を軸に し た顧客へ の
提案活動
生産性の向上
製造
対策
対策
●グルー プ統括本部を中心に 、役員・営業・開発間の
交流機会を増やし、顧客ニー ズに迅速対応
●ITリテラシー教育、デジタルソリュー ショ ン活用
による間接コスト抑制
●グルー プシナジー最大化体制を構築
●アジャ イル開発、RPA /生成AI 導入促進に よ る
開発効率向上・製造コスト抑制
5
2024 年 3 ⽉期
売上高(億円)
3 2
売上高
22.08
139 億 28 百万円(前年同期比 6.3
)
%
139.28
18.7
18.2
27.86
24.54
25 億 34 百万円(前年同期比 9.0
2026 年 3 ⽉期
セグメント利益率(%)
148.66
17.7
セグメント利益
2025 年 3 ⽉期
25.34
)
%
Point
「機械・エレクトロニクス」分野におけるメーカー の製品開発プロ
ジェクトの中止・延期の影響。利益は、売上高と同様の要因。
2024 年 3 ⽉期
2025 年 3 ⽉期
セグメント利益(億円)
2026 年 3 ⽉期
セグメント利益率(%)
対処すべき課題
6
デジタルソリュー ショ ン事業の
売上高の増加と収益性の向上成長
サステナビリティ経営お よ び
人的資本経営の推進
対策
対策
●イベント、勉強会、技術コミュ ニティ活動による
ブランディ ング強化
●2022 年度に策定した「サステナビリティに関する
基本方針」に基づき、持続可能な社会の実現に
向けた行動を推進
CRESCO | 統合報告書 2 0 2 6
23.92
セグメント利益(億円)
138.55
売上高(億円)
●自社ソリュー ショ ン開発、提携先企業発掘による
利益率向上
12.7
Point
対処すべき課題
3
174.27
1 3 .9
20.73
対処すべき課題
対処すべき課題
2026 年 3 ⽉
セグメント利益率(%)
14.1
)
%
銀行分野における増加の⼀方、保険分野での減少により全体では
横這い。利益は、
「その他」分野において⼀部の連結子会社で発生し
た不採算プロジェクト発生が影響。
2
2025 年 3 ⽉
セグメント利益(億円)
171.65
174 億 27 百万円(前年同期比 1.5
●給与見直し 、テレワー ク環境整備、労働環境改善
に よ る従業員エンゲー ジメント向上
2024 年 3 ⽉
売上高(億円)
金融
売上高
●人財育成プログラム刷新によるすべ ての
グルー プ社員の業務水準の底上げ
3 2.9 6
24.98
20.73
)
%
13 .7
1 1 .3
1 0 .2
セグメント利益
240.08
220.50
●「中期経営計画2026」でマテリアリティを明記し 、
適時適切に情報開示
デジタルソリュー ショ ン事業
93.12
売上高
93 億 12 百万円(前年同期比 99.1
%
)
セグメント利益
8 億 15 百万円(前年同期比 388.1
%
38.47
)
Point
製品・ライセンスの販売及び導入支援の大幅な増加に加え 、株式会
社高木システム、株式会社エイプス、株式会社アイエステクノポート
の連結効果。利益は、売上高と同様の要因。
5.9
8.8
46.77
8.15
3.6
2.25
1.67
2024 年 3 ⽉期
2025 年 3 ⽉期
売上高(億円)
セグメント利益(億円)
2026 年 3 ⽉期
セグメント利益率(%)
CRESCO | 統合報告書 2 0 2 6
3 3
マネジメント体制
●主スキル ○ 副スキル
2026年度の新体制
氏名
役職
根元浩幸
代表取締役会長
冨永宏
代表取締役
社長執行役員
寺村孝幸
宮本大地
分野
DX・IT
品質管理
人事・人財開発
財務・会計
法務・リスク管理
マーケティング・
広報
●
●
●
○
●
○
●
—
●
●
●
○
○
—
取締役
常務執行役員
●
●
●
○
○
—
取締役
(非常勤)
●
●
●
○
●
—
●
客観的な視点で当社の現況を評価す る と と も
に 、取締役会において取締役会の実効性、広報
戦略等について助言、支援を行うこと
○
○
取締役会において 、特に人財活用や育成の観点
における客観的な視点での当社への助言や支援
を行うこと
●
●
客観的な視点で当社の現況を評価し 、取締役会
に お い て事業活動に関す る助言、支援を行う
こと
○
—
●
独立し た中立的な立場か ら の 、取締役会に お
け る経営計画の策定の助言、進捗状況の確認、
取締役の監視を行う こ と
委員
●
社外
社外取締役
委員長
佐藤幸恵
社外
社外取締役
委員
●
佐野 み ゆ き
社外
社外取締役
委員
●
取締役
常勤監査等委員
●
●
○
○
●
社外
社外取締役
監査等委員
●
前川昌之
社外
社外取締役
監査等委員
●
○
舘充保
社外
社外取締役
監査等委員
●
○
●
●
平野健一
常務執行役員
事業部門担当
兼金融ビジネス本部長
平澤淳
執行役員
経営企画本部長
髙津聡
常務執行役員
事業部門担当
兼 エンター プライズビジネス本部長
村田勝徳
執行役員
地域イノベー ショ ン本部長
小鹿稔
執行役員
コー ポレー トサー ビス本部長
吉田真樹
執行役員
モビリティDXビジネス本部長
兼第二モビリティソリューション事業部長
留奥修
執行役員
特命プロジェ クト担当
黒木哲也
執行役員
デジタルモダナイゼー ショ ン本部長
大山田博彦
執行役員
インダストリアルビジネス本部長
澤田高志
執行役員
経営企画本部副本部長
兼 グロー バル戦略室長
執行役員
デジタルモダナイゼーション本部副本部長
兼 Creage ビジネス事業部長
CRESCO | 統合報告書 2 0 2 6
●
●
「取締役の選任理由・活動状況」について詳しくは当社ウェ ブサイトをご覧ください ▶
3 4
●
●
佐藤治夫
佐藤佳奈
社外取締役に期待される役割
企業経営
福井順一
髙石哲
執行役員
報酬
委員会
●
○
●
国際性
専門性
●
公認会計士・
税理士
取締役会において 、取締役会の監督機能の強化
への貢献、およ び財務、M&A 、会計、税務に関
する専門的立場からの助言・支援を行うこと
●
弁護士
社外取締役に期待される機能:法的見地および
客観的な視点か ら 、取締役の職務執行の監査・
監督を行うこと
分野
定義
企業経営
企業経営に関する経験
DX・IT
DX・IT 、システムに関する知識またはシステム開発部門での実務経験
品質管理
品質マネジメントに関する知識または品質管理部門での実務経験
人事・人財開発
人事、労務、採用に関する知識または人事部門での実務経験
財務・会計
財務や会計に関する知識または経理部門での実務経験
法務・リスク管理
企業法務やリスクマネジメントに関する知識または法務部門での実務経験
マー ケティ ング・広報
市場、経済環境・動向に関する知識また は広報・マー ケティ ング部門での実務経験
国際性
グロー バルビジネスに関する経験
専門性
士業、事業関連性のある保有資格
CRESCO | 統合報告書 2 0 2 6
3 5
2026
4
36
CRESCO |
2025
CRESCO |
2026
37
監査等委員会
報酬委員会
にお
し
て
に
再生可能エネルギー由来の電力メニューへの切替等により対前年度比で減少しております。
(3月期)
2016
2017
2018
2019
2020
2021
2022
2023
2024
2025
2026
業績状況
64,676
13,110
6,605
6,980
5,279
10.2
15.3
16.4
財政状況
47,899
33,479
キャッシュ・フロー
5,331
2
-1,319
-3,995
15,263
1株当たり指標
64.00
828.81
129.82
49.3
財務情報の詳細は有価証券報告書をご覧ください ▶
44
CRESCO | 統合報告書 2026
CRESCO | 統合報告書 2026
45
再生可能エネルギー由来の電力メニューへの切替等により対前年度比で減少しております。
拠点/グルー プ会社
会社概要/株式情報
(2026年4⽉1⽇現在)
1
1
6
株式会社クレスコ
CRESCO LTD.
1
業
連結 : 3,602名
単体 : 1,678名
業
情報システムに関する
・コンサルティングおよびソリューションサービス業務
・設計、開発業務
・運用管理、保守業務
・調査、分析、評価および技術支援業務
25億1,487万5,803円
株
グループ参画:2010年4⽉
議決権所有割合:100%
株
シ
株
グループ参画:2020年4⽉
議決権所有割合:100%
フ
ーシ
グループ参画:2026年4⽉
議決権所有割合:100%
グループ参画:1999年8⽉
議決権所有割合:100%
(※2026年4⽉1⽇付で全発行済株式を
取得し、完全子会社化)
1
株
1
・
キュー
グループ参画:2016年9⽉
議決権所有割合:100%
4
1
株
・
ロ ー
株
1
株
ー
2
株
グループ参画:2012年4⽉
議決権所有割合:33.4%
ロ
ー
株
〒108-6026
東京都港区港南2-15-1
品川インターシティA棟 26階
業
〒060-0003
北海道札幌市中央区北三条西3-1-44
ヒューリックスクエア札幌 9階
7
情報
(
の
)
グループ参画:2019年9⽉
議決権所有割合:100%
シー
ー
発行済株式総数
42,000,000株
株
(自己株式数1,605,551株を含む)
株主数
14,699名
株
有株
当
の
状況
(
株)
株
(
有限会社イワサキコーポレーション
72,584
17.96
⽇本マスタートラスト信託銀行株式会社(信託口)
44,068
10.90
浦崎雅博
25,109
6.21
クレスコ従業員持株会
13,640
3.37
岩﨑俊雄
12,240
3.03
)
グループ参画:2015年10⽉
議決権所有割合:100%
(2026年4⽉1⽇時点)
株主総会
〒450-0002
愛知県名古屋市中村区名駅3-19-14
第2名古屋三交ビル 7階
監査等委員会
取締役会
内部監査室
会
長
社
長
業
〒541-0053
大阪府大阪市中央区本町4-3-9
本町サンケイビル 14階
業
常務会
2
グル ー プ
サー ビス本部
コ ー ポレ ー ト
サー ビス本部
ヒュー マンリソー ス統括部
コー ポレー トサー ビス統括部
DXビジネス事業部
ビジネス事業部
先端技術事業部
福岡事業所
札幌事業所
C
r
e
a
g
e
経営企画本部
品質・プロセス
統括本部
デジタル
モダナイゼー ショ ン
本部
地域イノベー ショ ン
本部
2
モビリティ ソリュー ショ ン事業部
第
1
モビリティ ソリュー ショ ン事業部
第
2
ビジネスソリュー ショ ン事業部
第
1
ビジネスソリュー ショ ン事業部
第
2
金融ソリュー ショ ン事業部
第
1
金融ソリュー ショ ン事業部
第
66
技術研究所
社長室
77
5
1
11
D
X
インダストリアル
ビジネス本部
〒812-0011
福岡県福岡市博多区博多駅前1-7-22
第14岡部ビル 7階
4
CRESCO | 統合報告書 2026
136,000,000株
業
8
48
発行可能株式総数
7
3
8
況
(2026年3⽉末時点)
モビリティ
ビジネス本部
〒940-0066
新潟県長岡市東坂之上町3-2-6
⽇本生命長岡ビル 6階
株
4674
エンター プライズ
ビジネス本部
8
業
ー
金融ビジネス本部
3
6
証券
株
シ
グループ参画:2012年12⽉
議決権所有割合:100%
グループ参画:2024年4⽉
議決権所有割合:100%
1
・
5
ッ ・
東京証券取引所 プライム市場
8
グループ参画:2021年7⽉
議決権所有割合:100%
グループ参画:2013年4⽉
議決権所有割合:100%
1
グループ参画:2012年4⽉
議決権所有割合:100%
ュ
株
1988年(昭和63年)4⽉1⽇
・ ー・
ューシ
株
(2026年4⽉1⽇現在)
CRESCO | 統合報告書 2026
49








 (1,527KB)