Asia Pacific(English) Search Contact Us menu close About DIC About DIC A Message from the President The DIC Way Corporate Data Board of Directors DIC's Global Network Principal Subsidiaries and Affiliates in Japan Principal Subsidiaries and…

About DIC
Business & Products
Packaging & Graphic
Packaging & Graphic
Printing Material
Packaging Material
Color & Display
Color & Display
Color Material
Functional Products
Functional Products
Synthetic Resins and Chemicals
Functional Products
Compounds and Colorants
New Business / Developed Products
New Business / Developed Products
Sustainability
R&D
News
2026
Site Search
Language Selection
DIC Steps Up Collaboration with the European Physical AI Ecosystem to Create New Businesses in this Promising Area —European CVC base organizes an international event to accelerate the exploration of opportunities for collaboration and investment in physical AI—
- Management & IR
- News Release
Aug. 7, 2026
#CVC #AIロボティクス #フィジカルAI #戦略投資 #CVC投資
-
Share This Page:
-
Share
-
Share
-

Tokyo, Japan—DIC Corporation has positioned physical AI as a key growth area, together with semiconductors and batteries, under Phase 2 of its long-term management plan, DIC Vision 2030.
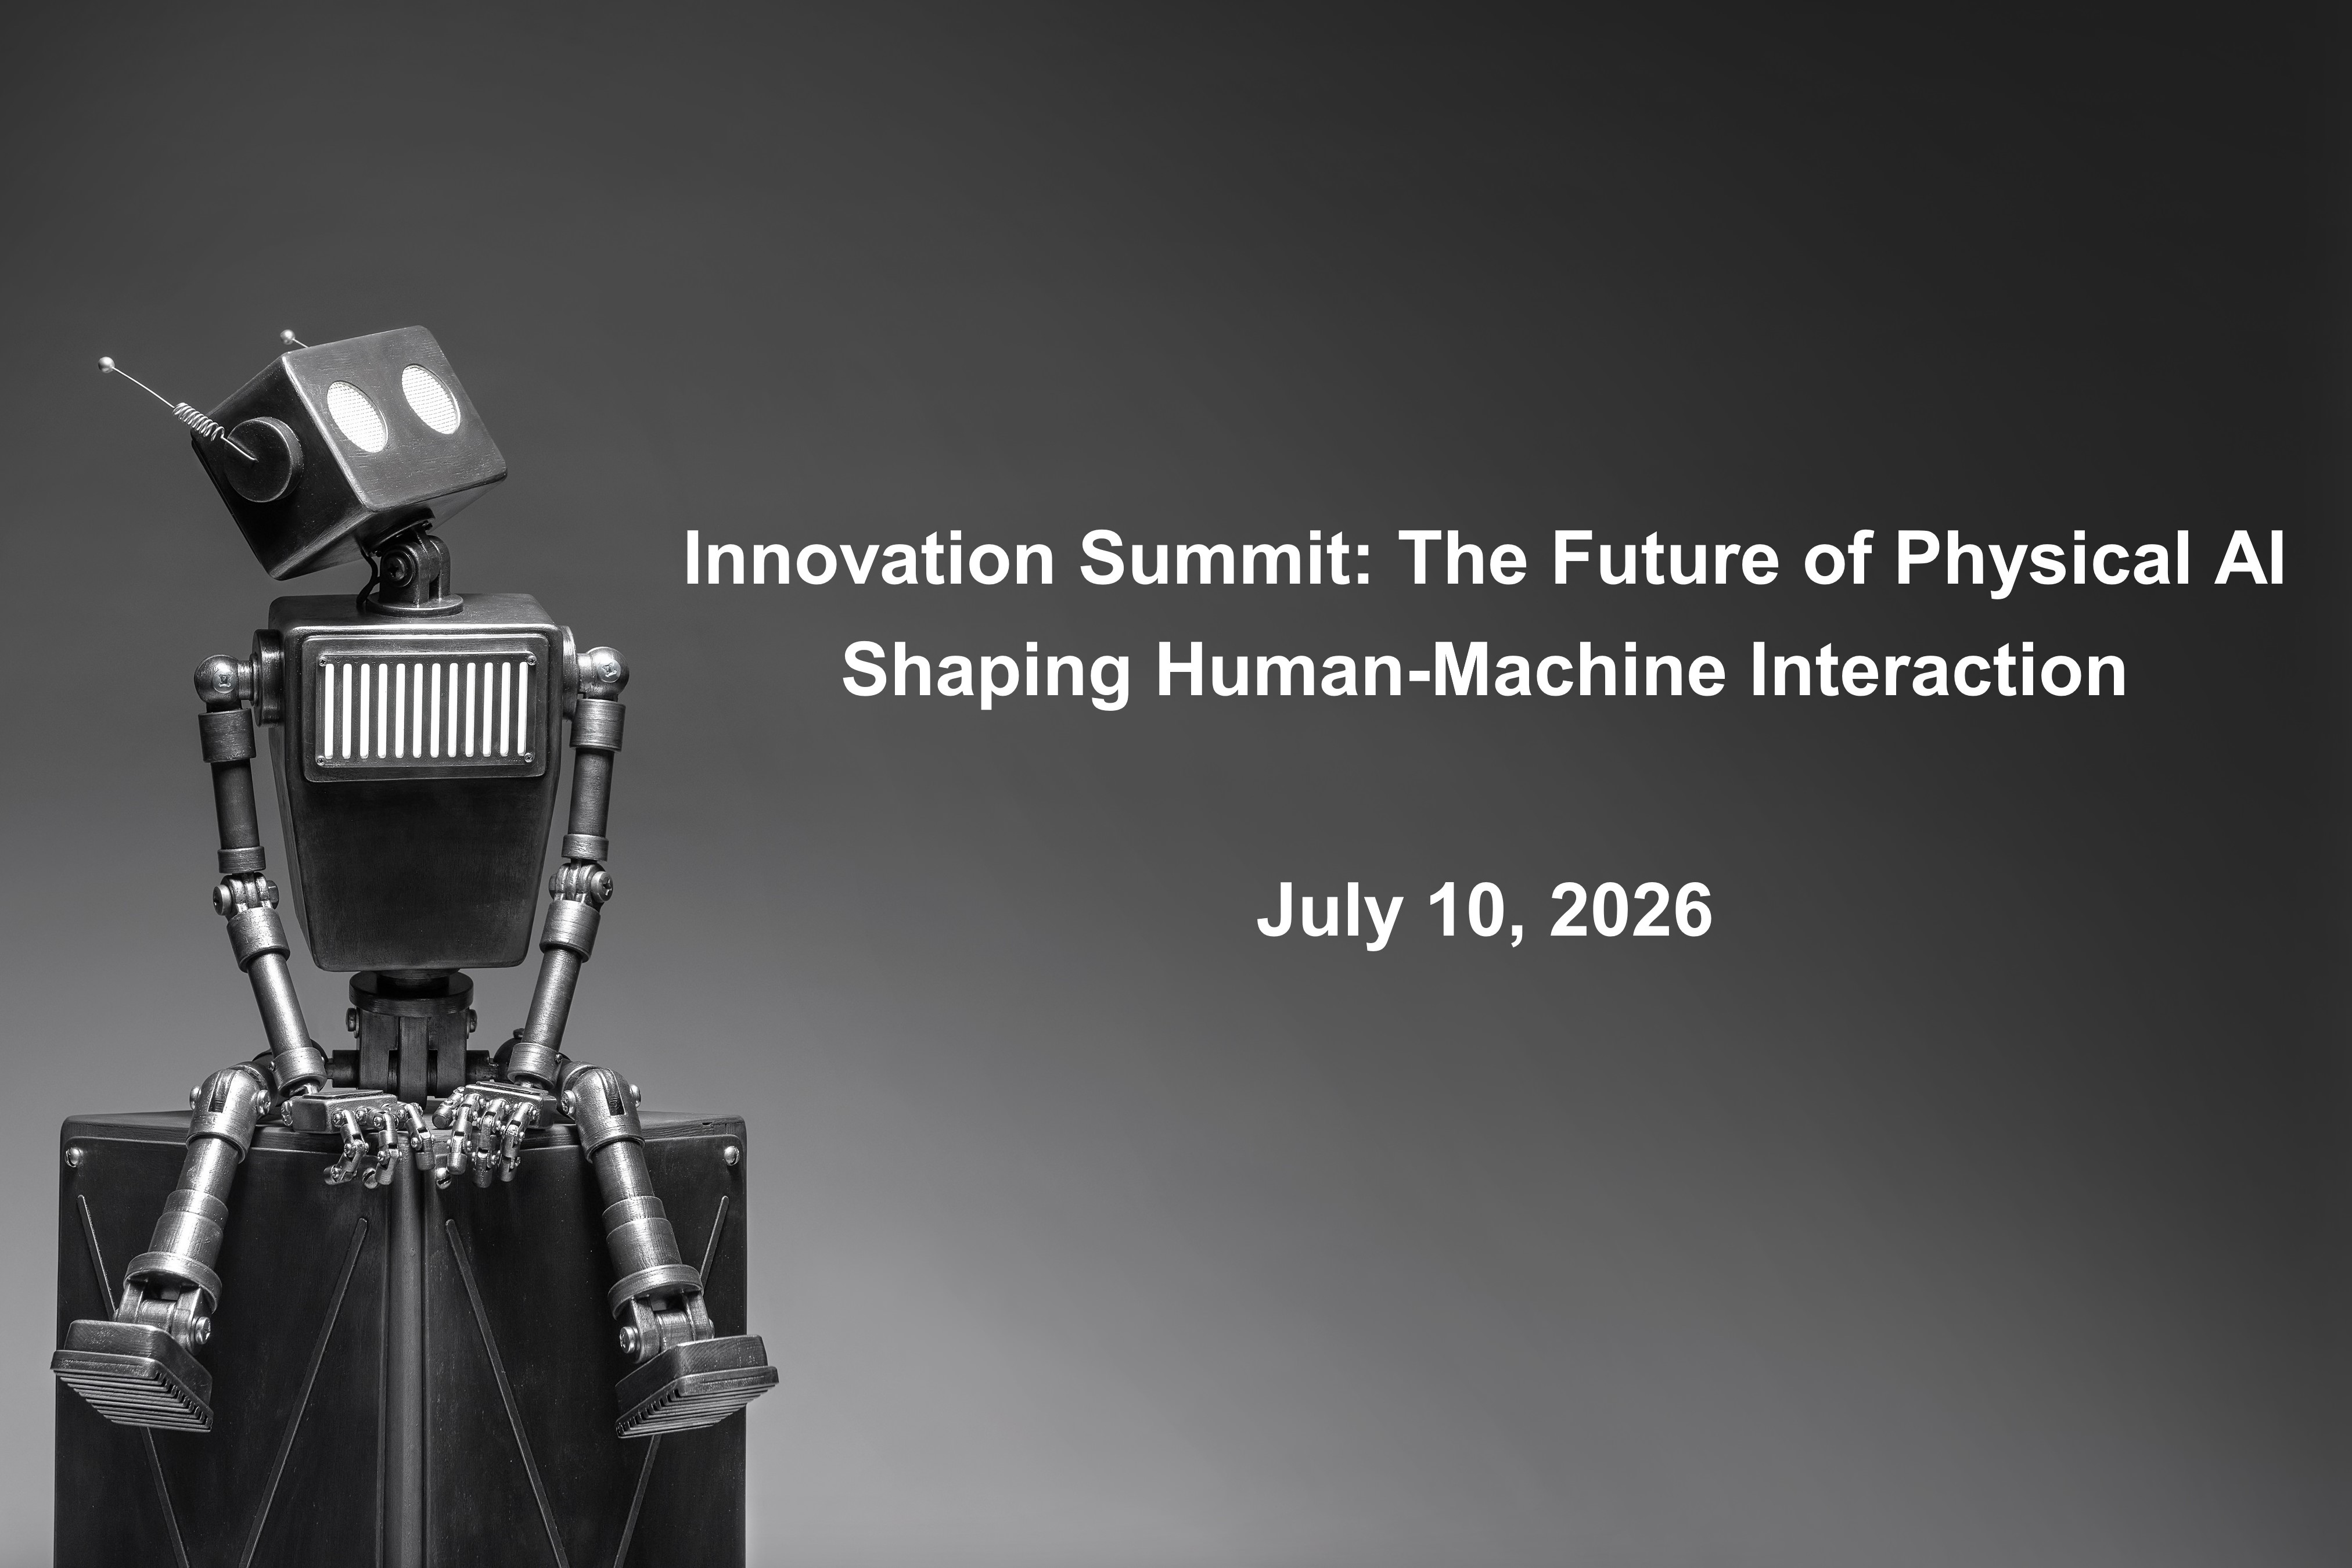
In an initiative spearheaded by its European corporate venture capital (CVC) base, DIC D2S Ventures AG, DIC recently hosted an international event focused on physical AI titled "Innovation Summit 2026 - The Future of Physical AI
—Shaping Human–Machine Interaction,” at Google Cloud in Zurich, Switzerland, in cooperation with strategic partner Emerald Technology Ventures.

Innovation Summit 2026 venue in Zurich

Keynote presentation by Takashi Ikeda, DIC’s Group CEO
The Innovation Summit was attended by a total of 92 individuals, primarily from Europe, representing startups, venture capital and CVC firms, established corporations, government and other public sector entities, and universities and research institutions, among others. The event served as a forum for sharing insights on the latest physical AI technologies and market trends, as well as for exploring opportunities for future collaboration and strategic investments.
Physical AI, which uses AI to control robots and automated systems in the physical world, is attracting attention as a branch of AI that will dramatically reshape diverse industries, including manufacturing, logistics, and infrastructure maintenance, in the years ahead.
DIC recognizes the advance toward an AI-integrated society as constituting a significant social change and seeks to capitalize on its competitive advantages, notably its materials technologies, in conjunction with physical AI technologies, to develop new businesses that encompass services and solutions extending beyond mere materials.
At the Innovation Summit, Emerald, Google DeepMind, and Google Cloud gave presentations on the latest trends in and the outlook for physical AI, while six leading European startups (Embotech, Verity, Sewts, ANYbotics, Voliro Airborne Robotics, and Mimic Robotics) showcased their cutting-edge technologies and business strategies in multiple areas, including autonomous logistics, digital transformation in warehousing, deformable object handling, the maintenance and inspection of equipment and infrastructure, and robotic hands. A panel discussion and networking session, with the stated theme of “Building Human-Centred Physical AI,” featured lively discussions on topics such as the challenge of forging a society in which people and AI work together, corporate transformation and approaches to joining forces with startups.
This event enabled DIC to reinforce its alliance with the European physical AI ecosystem, as well as to expand its innovation network to include promising startups and investors. Going forward, the Company will continue to probe concrete initiatives such as collaborations, joint demonstrations, and strategic investments to accelerate the creation of new businesses in the area of physical AI.

Scene from the Panel Discussion
Executive comments
Takashi Ikeda, Representative Director, President and Group CEO, DIC Corporation
Physical AI is an important branch of AI with the potential to bring new value to people and to society at large. This is also a crucial growth area for DIC and we will promote a variety of related initiatives, guided by our Direct to Society business creation mechanism, throughout Phase 2 of DIC Vision 2030. The Innovation Summit marked a milestone in our effort to step up collaboration with the European physical AI ecosystem through DIC D2S Ventures. Moving forward, we will continue to take on the challenge of generating new value by integrating our long-cultivated materials technologies with physical AI through collaborations with startups, venture capital firms and others, thereby further augmenting global open innovation.
DIC has positioned DIC D2S Ventures as its innovation hub in Europe and, thanks to the strategic partnership with Emerald, as well as by working with and investing in startups, DIC will drive the development of new business opportunities in the field of physical AI. Looking ahead, DIC aims to hasten the development and launch of new businesses by combining its key competitive advantages, notably its materials technologies, with advanced physical AI technologies.
– Ends –
Related press releases
DIC to Hold International Physical AI Innovation Summit in Switzerland (June 2026)
https://www.dic-global.com/en/news/2026/event/20260616070903.html
DIC Establishes Investment Management Subsidiary DIC D2S Ventures in European Deep Tech Hub (May 2026)
https://www.dic-global.com/en/news/2026/ir/20260512170513.html
DIC Enters into a Partnership with Switzerland-Based Emerald to Accelerate Business Creation in the Physical AI Domain (February 2026)
https://www.dic-global.com/en/news/2026/ir/20260213145018.html
About Emerald Technology Ventures
Emerald Technology Ventures is an independent venture capital firm founded in 2000 in Zurich, Switzerland, with superior expertise in the industrial technology, materials and cleantech sectors. With offices across Europe, North America and Asia, Emerald has a proven track record spanning startup sourcing, investment and growth support. The firm possesses extensive knowledge and global networks in areas such as sensors, robotics, advanced materials and industrial digital transformation, and is highly regarded for its support of open innovation initiatives with corporate partners. DIC and Emerald have built a relationship of trust through prior investments in funds and joint research, and this new strategic partnership will establish an even deeper collaborative framework in the realm of physical AI.