� � ���� ᖺ �� ᭶㸴᪥� ྛ� ♫ྡ� ᪥ᮏሬᩱᰴᘧ♫� ௦⾲⪅ྡ� ௦⾲ྲྀ⥾ᙺ♫㛗� 㔛�㝯ᖾ� � 㸦ࢥ࣮ࢻ␒ྕ㸸����� ᮾドࣉ࣒ࣛ㸧� ၥྜࡏඛ� � ྲྀ⥾ᙺᖖົᇳ⾜ᙺဨ�� ⟶⌮ᮏ㒊㛗වሬᩱᴗᮏ㒊㛗�Ọ㔝�㐩ᙪ� 㸦7(/�������������㸧� ♫ྡ� ⚄ᮾሬᩱᰴᘧ♫� ௦⾲⪅ྡ� ௦⾲ྲྀ⥾ᙺ♫㛗ᇳ⾜ᙺဨ�ᑠᆏ�ఀ▱㑻� � 㸦ࢥ࣮ࢻ␒ྕ㸸����� ᮾドࢫࢱࣥࢲ࣮ࢻ㸧� ၥྜࡏඛ�…
�
�
���� ᖺ �� ᭶㸴᪥�
ྛ�
♫ྡ�
᪥ᮏሬᩱᰴᘧ♫�
௦⾲⪅ྡ�
௦⾲ྲྀ⥾ᙺ♫㛗� 㔛�㝯ᖾ�
�
㸦ࢥ࣮ࢻ␒ྕ㸸����� ᮾドࣉ࣒ࣛ㸧�
ၥྜࡏඛ�
�
ྲྀ⥾ᙺᖖົᇳ⾜ᙺဨ��
⟶⌮ᮏ㒊㛗වሬᩱᴗᮏ㒊㛗�Ọ㔝�㐩ᙪ�
㸦7(/�������������㸧�
♫ྡ�
⚄ᮾሬᩱᰴᘧ♫�
௦⾲⪅ྡ�
௦⾲ྲྀ⥾ᙺ♫㛗ᇳ⾜ᙺဨ�ᑠᆏ�ఀ▱㑻�
�
㸦ࢥ࣮ࢻ␒ྕ㸸����� ᮾドࢫࢱࣥࢲ࣮ࢻ㸧�
ၥྜࡏඛ�
ᇳ⾜ᙺဨ�⏬࣭⤒⌮ᐊᢸᙜ�ᯇᮏ�ఙ�
�
� 7(/������������� ��
�
�
᪥ᮏሬᩱᰴᘧ♫ࡼࡿ⚄ᮾሬᩱᰴᘧ♫ࡢᏊ♫㛵ࡍࡿ�
ᰴᘧዎ⣙⥾⤖㸦⡆᫆ᰴᘧ㸧ࡢ࠾▱ࡽࡏ�
�
᪥ᮏሬᩱᰴᘧ♫㸦௨ୗࠕ᪥ᮏሬᩱࠖ࠸࠸ࡲࡍࠋ㸧ཬࡧ⚄ᮾሬᩱᰴᘧ♫㸦௨ୗࠕ⚄ᮾሬᩱࠖ
࠸࠸ࠊ᪥ᮏሬᩱ⚄ᮾሬᩱࢆ⥲⛠ࡋ࡚ࠊ௨ୗࠕ୧♫ࠖ࠸࠸ࡲࡍࠋ
㸧ࡣࠊᮏ᪥㛤ദࡢ୧♫ࡢྲྀ⥾ᙺ
Ỵ㆟ࡼࡾࠊࡑࢀࡒࢀࠊ᪥ᮏሬᩱࢆᰴᘧぶ♫ࠊ⚄ᮾሬᩱࢆᰴᘧᏊ♫ࡍࡿᰴ
ᘧ㸦௨ୗࠕᮏᰴᘧࠖ࠸࠸ࡲࡍࠋ㸧ࢆᐇࡍࡿࡇࢆỴᐃࡋࠊᮏ᪥ࠊ୧♫㛫࡛ᰴᘧዎ⣙㸦௨
ୗࠕᮏᰴᘧዎ⣙ࠖ࠸࠸ࡲࡍࠋ㸧ࢆ⥾⤖࠸ࡓࡋࡲࡋࡓࡢ࡛ࠊୗグࡢ࠾ࡾ࠾▱ࡽࡏ࠸ࡓࡋࡲࡍࠋ�
࡞࠾ࠊᮏᰴᘧࡣࠊ᪥ᮏሬᩱ࠾࠸࡚ࡣࠊ♫ἲ㸦ᖹᡂ �� ᖺἲᚊ➨ �� ྕࠋࡑࡢᚋࡢᨵṇࢆྵࡳ
ࡲࡍࠋ௨ୗྠࡌ࡛ࡍࠋ㸧➨ ��� ᮲➨㸰㡯ࡢつᐃᇶ࡙ࡁࠊᰴ⥲ࡢỴ㆟ࡼࡿᢎㄆࢆᚲせࡋ࡞࠸⡆
᫆ᰴᘧࡢᡭ⥆ࡼࡾࠊࡲࡓࠊ⚄ᮾሬᩱ࠾࠸࡚ࡣࠊ���� ᖺ㸯᭶ �� ᪥㛤ദணᐃࡢ⚄ᮾሬᩱࡢ⮫ᰴ
⥲ࡢỴ㆟ࡼࡿᮏᰴᘧዎ⣙ࡢᢎㄆࢆᚓࡓୖ࡛ࠊ���� ᖺ㸰᭶ �� ᪥ࢆຠຊⓎ⏕᪥ࡋ࡚⾜ࢃࢀ
ࡿணᐃ࡛ࡍࠋ�
ࡲࡓࠊᮏᰴᘧࡢຠຊⓎ⏕᪥㸦���� ᖺ㸰᭶ �� ᪥㸦ணᐃ㸧㸧ඛ❧ࡕࠊ⚄ᮾሬᩱࡢᬑ㏻ᰴᘧ㸦௨ୗ
ࠕ⚄ᮾሬᩱᰴᘧࠖ࠸࠸ࡲࡍࠋ㸧ࡣࠊ���� ᖺ㸰᭶ �� ᪥ᰴᘧ♫ᮾிドๆྲྀᘬᡤ㸦௨ୗࠕᮾிドๆྲྀ
ᘬᡤࠖ࠸࠸ࡲࡍࠋ
㸧ࢫࢱࣥࢲ࣮ࢻᕷሙ࠾࠸࡚ୖሙᗫṆ㸦᭱⤊㈙᪥ࡣ ���� ᖺ㸰᭶ �� ᪥㸧࡞ࡿண
ᐃ࡛ࡍࠋ�
�
��
グ�
㸯㸬 ᮏᰴᘧࡢ┠ⓗ�
᪥ᮏሬᩱࡣࠊ���� ᖺ㸵᭶ �� ᪥ࠊ᪥ᮏ㟁ụᰴᘧ♫㸦⌧ᅾࡢၟྕࡣᰴᘧ♫ࢪ࣮࢚ࢫ࣭ࣘ
ࢧࢥ࣮࣏࣮ࣞࢩࣙࣥ㸧ࡢሬᩱ㒊㛛ࡀศ㞳⊂❧ࡋ࡚Ⓨ㊊࠸ࡓࡋࡲࡋࡓࠋ�
᪥ᮏሬᩱࡢࢢ࣮ࣝࣉࡣࠊᮏ᪥Ⅼ࠾࠸࡚ࠊ᪥ᮏሬᩱࠊᏊ♫ �� ♫ཬࡧ㛵㐃♫㸳♫࡛ᵓ
ᡂࡉࢀ࡚࠾ࡾࡲࡍ㸦௨ୗࠕ᪥ᮏሬᩱࢢ࣮ࣝࣉࠖ⥲⛠ࡋࡲࡍࠋ
㸧ࠋ᪥ᮏሬᩱࢢ࣮ࣝࣉࡣࠊሬᩱࠊ
↷᫂ᶵჾཬࡧ⺯ගⰍᮦ➼ࡢ〇㐀࣭㈍ࢆ࡞ෆᐜࡋࠊࡉࡽྛᴗ㛵㐃ࡍࡿ≀ὶཬࡧࡑࡢ
ࡢࢧ࣮ࣅࢫ➼ࡢᴗάືࢆᒎ㛤ࡋ࡚࠾ࡾࠊᅜෆሬᩱᴗࠊᾏእሬᩱᴗࠊ↷᫂ᶵჾᴗࠊ⺯ගⰍ
ᮦᴗཬࡧࡑࡢᴗࡢ㸳ࡘࡢᴗࢭࢢ࣓ࣥࢺࢆ᭷ࡋ࡚࠾ࡾࡲࡍࠋ�
᪥ᮏሬᩱࡣࠊ���� ᖺ㸳᭶ �� ᪥ ���� ୰ᮇ⤒Ⴀィ⏬㸦����㹼����㸧ࢆබ⾲ࡋࠊሬᩱᴗᇶ┙
ࡢᣑࡢࡓࡵࠊෆ㒊ᡂ㛗ຍ࠼࡚ࠊእ㒊ࡢࣜࢯ࣮ࢫࢆ⋓ᚓ࣭ά⏝ࡍࡿࡇࢆᇶᮏ᪉㔪ࡋ࡚࠾
ࡾࡲࡍࠋ�
�
୍᪉ࠊ⚄ᮾሬᩱࡣࠊ���� ᖺࠕ⚄ᡞ࣎ࣝἜࠖࢆ⌧ᅾࡢ⚄ᡞᕷℿ༊ሬᩱ〇㐀ᡤࡋ࡚㛤タࡋࡓ
ࡇࢆᴗࡢጞࡵࡋࠊ���� ᖺ㸲᭶ᮾὒሬᩱ〇㐀ᰴᘧ♫ྜేࡋࠊ
ࠕ⚄ᮾሬᩱᰴᘧ♫ࠖࢆタ
❧࠸ࡓࡋࡲࡋࡓࠋ⚄ᮾሬᩱࡢࢢ࣮ࣝࣉࡣࠊᮏ᪥⌧ᅾ࠾࠸࡚ࠊ⚄ᮾሬᩱࠊᏊ♫㸵♫ཬࡧ㛵㐃
♫㸳♫࡛ᵓᡂࡉࢀ㸦௨ୗࠕ⚄ᮾሬᩱࢢ࣮ࣝࣉࠖ⥲⛠ࡋࡲࡍࠋ㸧
ࠊሬᩱࠊᡂရࡢ〇㐀㈍ࢆ࡞
ᴗࡋ࡚࠾ࡾࡲࡍࠋ�
⚄ᮾሬᩱࢢ࣮ࣝࣉࡣࠊ㧗࠸ᢏ⾡Ỉ‽ᡴࡕࡉࢀࡓ㧗ရ㉁ࠊ㧗ᶵ⬟ࠊ⎔ቃᑐᛂᆺࡢሬᩱ〇ရ࣭
ࢥ࣮ࢸࣥࢢᮦᩱࢧ࣮ࣅࢫࢆ㢳ᐈᚿྥࡢ⤌⧊ࢆ㏻ࡌ࡚ᥦ౪ࡋ࡚࠸ࡃࡇࢆᇶᮏ᪉㔪ࡋ࡚࠾ࡾ
ࡲࡍࠋ�
�
᪥ᮏሬᩱ⚄ᮾሬᩱࡢ㛵ಀ࡛ࡍࡀࠊ ᪥ᮏሬᩱࡀ⚄ᮾሬᩱᰴᘧࢆᑐ㇟ࡋ࡚ ���� ᖺ㸰᭶
㸵᪥㛤ጞࡋࡓබ㛤㈙ࡅ㸦௨ୗࠕᮏබ㛤㈙ࡅࠖ࠸࠸ࡲࡍࠋ㸧
ࠊཬࡧ ᙜヱබ㛤㈙ࡅࡢᡂ
❧ᚋࠊ⚄ᮾሬᩱࢆⓎ⾜♫ࡋࠊ᪥ᮏሬᩱࢆᘬཷேࡍࡿ➨୕⪅ᙜቑ㈨㸦௨ୗࠕᮏ➨୕⪅
ᙜቑ㈨ࠖ࠸࠸ࡲࡍࠋ
㸧ࡢᐇ㸦���� ᖺ㸱᭶ �� ᪥ቑ㈨㸧ࡢ⤖ᯝࠊ⚄ᮾሬᩱࡣ᪥ᮏሬᩱ
ࡢᏊ♫࡞ࡾࡲࡋࡓ㸦௨ୗࠕᮏ㐃⤖Ꮚ♫ࠖ࠸࠸ࡲࡍࠋ㸧
ࠋ࡞࠾ࠊᮏබ㛤㈙ࡅࡣࠊ㈙➼
ࡢ౯᱁㸦௨ୗࠕᮏබ㛤㈙౯᱁ࠖ࠸࠸ࡲࡍࠋ㸧ࢆᮏ㐃⤖Ꮚ♫බ⾲᪥ࡢ┤㏆ࡢ⚄ᮾሬᩱᰴᘧ
ࡢᕷሙᰴ౯ࡼࡾ୍ᐃ⛬ᗘࢹࢫ࢝࢘ࣥࢺࡋࡓ౯᱁�
㸦ᬑ㏻ᰴᘧ㸯ᰴࡘࡁ �� 㸧ࡋ࡚ᐇࡋ࡚࠾
ࡾࠊ⚄ᮾሬᩱࡣ୍⯡ᰴᑐࡋ࡚ࠊᮏබ㛤㈙ࡅࡢᛂເࡣಶࠎࡢᰴุ᩿ጤࡡࡿࡋࠊ⤖ᯝࠊ
୍⯡ᰴࡼࡿᮏබ㛤㈙ࡅࡢᛂເࡣ࠶ࡾࡲࡏࢇ࡛ࡋࡓࠋᮏ㐃⤖Ꮚ♫Ⅼ࠾࠸࡚ࡣࠊ
᪥ᮏሬᩱࡣࠊ⚄ᮾሬᩱࡢᏊ♫ࢆᑗ᮶ⓗ࡞㑅ᢥ⫥ࡢ୍ࡘࡋ࡚ㄆ㆑ࡋࠊࡑࡢྍ⬟ᛶࡘ࠸
࡚㆟ㄽࢆࡋ࡚࠸ࡓࡶࡢࡢࠊලయⓗ࡞ᐇ᪉㔪ࡸᮇ➼ࡘ࠸࡚ពᛮỴᐃࢆ⾜ࡗ࡚࠾ࡽࡎࠊᮏᰴᘧ
ࡣࠊᮏ㐃⤖Ꮚ♫ࡣ୍㐃ࡢྲྀᘬࡢ㛵ಀࡣ࠶ࡾࡲࡏࢇࠋ�
᪥ᮏሬᩱࡼࡿ⚄ᮾሬᩱࡢ㐃⤖Ꮚ♫௨㝆ࠊ᪥ᮏሬᩱཬࡧ⚄ᮾሬᩱࡣࠊ୧♫࡚⥾⤖ࢆ
ࡋࡓ ���� ᖺ㸰᭶㸴᪥ࡢぬ᭩ᚑࡗ࡚ࠊ୧♫㛫࡛ྜពࡉࢀࡓᴗົᥦᦠ➼㛵ࡍࡿ㡯ࢆ᥎㐍ࡋ࡚
ࡲ࠸ࡾࡲࡋࡓࠋ�
�
��
ࡋࡋ࡞ࡀࡽࠊ㐃⤖Ꮚ♫ᚋᴗົᥦᦠ➼㛵ࡍࡿ㡯ࢆ᥎㐍ࡍࡿ୰࡛ࠊぶᏊୖሙࡢ㛵ಀ࡛
ࡣࠊᑡᩘᰴࡢ┈ࡢ㓄៖ࡢほⅬࡽࠊಶู⟇ࡈࡢ┈┦⟶⌮ཬࡧពᛮỴᐃᡭ⥆ᙜึ
ࡢᐃ௨ୖࡢ㛫ཬࡧ⟶⌮㈇ᢸࢆせࡍࡿࡇࡀ᫂ࡽ࡞ࡾࡲࡋࡓࠋࡲࡓࠊ୧♫ࡀୖሙᴗࡋ
࡚ࡑࢀࡒࢀࡢෆ㒊⤫ไࠊ┘ᰝཬࡧ㛤♧➼ࡢయไࢆ⥔ᣢࡍࡿ㔜ᵓ㐀ࡶࠊᡭ⥆ཬࡧ⟶⌮ࢥࢫࢺࡢቑ
ຍせᅉ࡞ࡗ࡚࠾ࡾࡲࡍࠋࡇࡢࡓࡵࠊ⌧Ⅼ࠾࠸࡚ᴗົᥦᦠࡼࡿຠᯝࡣ㢧ᅾࡋ࡚࠸ࡿࡶࡢ
ࡢࠊ౫↛ࡋ࡚㝈ᐃⓗ࡛࠶ࡾࠊ᭦࡞ࡿࢩࢼࢪ࣮ࡢᐇ⌧ࡢࡓࡵࡣࠊᵓ㐀ᨵ㠉ཬࡧ⤒Ⴀ㈨※ࡢ᭱㐺
㓄ศࢆ㎿㏿㐍ࡵࡿࡇࡀㄢ㢟࡞ࡗ࡚࠾ࡾࡲࡍࠋຍ࠼࡚ࠊᅜෆሬᩱᕷሙࡢᡂ⇍ཬࡧཎᮦᩱࢥࢫ
ࢺ➼ࡢୖ᪼ࡀ⥆ࡃ୰ࠊ⚄ᮾሬᩱࡢ┈ຊࡢᅇࡣ࡞࠾㏵ୖ࠶ࡾࠊྠ♫༢⊂࡛ࡣࠊ➇தຊࡢ⥔ᣢ࣭
ᙉᚲせ࡞タഛᢞ㈨ཬࡧ◊✲㛤Ⓨᢞ㈨ࢆ༑ศࡘᶵືⓗ⾜࠺ࡇࡣไ⣙ࡀ࠶ࡿㄆ㆑ࡋ࡚
࠾ࡾࡲࡍࠋ᪥ᮏሬᩱࡣࠊࡇࢀࡽࡢㄢ㢟ࢆ㋃ࡲ࠼ࠊ⚄ᮾሬᩱࡢᢏ⾡ຊཬࡧᴗᇶ┙ࢆάࡋࡘࡘࠊ
ࢢ࣮ࣝࣉయ࡛⤒Ⴀ㈨※ࡢ᭱㐺㓄ศࢆᅗࡾࠊ┈ຊࡢྥୖᣢ⥆ⓗᡂ㛗ࢆᐇ⌧ࡍࡿࡓࡵࠊ㈨ᮏ㛵
ಀࡢぢ┤ࡋࢆྵࡴᵓ㐀ᨵ㠉ࡘ࠸᳨࡚ウࢆ㔜ࡡ࡚ࡲ࠸ࡾࡲࡋࡓࠋ�
ࡑࡢ⤖ᯝࠊ᪥ᮏሬᩱࡣࠊ⚄ᮾሬᩱࡀୖሙ♫ࡋ࡚⊂❧ࡋࡓᴗ㐠Ⴀࢆ⥆ࡅࡿࡼࡾࡶࠊ᪥
ᮏሬᩱࡼࡿᏊ♫ࢆ⾜࠺ࡇࡀᚲせ࡛࠶ࡿࡢุ᩿⮳ࡾࠊ���� ᖺ㸵᭶ �� ᪥᪥ᮏ
ሬᩱࡽ⚄ᮾሬᩱᑐࡋ࡚ᮏᰴᘧࡢᥦ㸦௨ୗࠕᮏᥦࠖ࠸࠸ࡲࡍࠋ㸧ࢆ⾜࠸ࡲࡋࡓࠋ�
�
⚄ᮾሬᩱࡣࠊぶ♫࡛࠶ࡿ᪥ᮏሬᩱࡽࡢᮏᥦࢆཷࡅ࡚ࠊᮏᰴᘧಀࡿලయⓗ࡞᳨ウ
ࢆ㛤ጞࡍࡿࡇ࠸ࡓࡋࡲࡋࡓࠋࡲࡓࠊ⚄ᮾሬᩱࡣࠊᮏᰴᘧ㛵ࡍࡿලయⓗ࡞᳨ウࢆ㛤ጞࡍ
ࡿ㝿ࡋࠊ⚄ᮾሬᩱࡢྲྀ⥾ᙺ࠾࠸࡚ࠊᮏᰴᘧࡢ㠀ࢆᑂ㆟ཬࡧỴ㆟ࡍࡿඛ❧ࡗ࡚ࠊᮏ
ᰴᘧ࡛ࡣᵓ㐀ⓗ࡞┈┦ࡢၥ㢟ࡀ⏕ࡌᚓࡿࡓࡵࠊ⚄ᮾሬᩱࡢᑡᩘᰴࡢⓙᵝࡢಖㆤࢆ┠ⓗ
ࡋ࡚ࠊᮏᰴᘧ࠾ࡅࡿẚ⋡ࡢබṇᛶࡢᢸಖࠊពᛮỴᐃࡢ㐣⛬࠾ࡅࡿពᛶࡢ㝖ཬ
ࡧ┈┦ᅇ㑊ࡢほⅬࡽࠊᮏᰴᘧࡢබṇᛶࢆᢸಖࡍࡿᥐ⨨ࡢ୍ࡘࡋ࡚ࠊ���� ᖺ㸶᭶ �� ᪥
ࠊ᪥ᮏሬᩱࡽࡢ⊂❧ᛶཬࡧᮏᰴᘧࡢᡂྰࡽࡢ⊂❧ᛶࢆ᭷ࡍࡿጤဨࡽᵓᡂࡉࢀࡿ⚄
ᮾሬᩱᖖタࡢ⊂❧ᙺဨጤဨ㸦௨ୗࠕᮏ⊂❧ᙺဨጤဨࠖ࠸࠸ࡲࡍࠋヲ⣽ࡘ࠸࡚ࡣࠊୗグ㸱㸬
ࠕ㸦㸲㸧බṇᛶࢆᢸಖࡍࡿࡓࡵࡢᥐ⨨㸦┈┦ࢆᅇ㑊ࡍࡿࡓࡵࡢᥐ⨨ࢆྵࡴࠋ
㸧
ࠖグ㍕ࡢ࠾ࡾ
࡛ࡍࠋ㸧ࢆᮏᰴᘧಀࡿㅎၥᶵ㛵⨨ࡅࠊලయⓗ᳨ウྥࡅࡓయไࢆᩚഛ࠸ࡓࡋࡲࡋࡓࠋ�
�
ᮏᰴᘧࡼࡾࠊぶᏊୖሙక࠺ᑡᩘᰴࡢ┈ࡢ㓄៖ཬࡧ┈┦⟶⌮㉳ᅉࡍࡿไ⣙
ࢆ㍍ῶࡋࠊ㛗ᮇⓗ࡞どⅬ࡛୧♫ࡢ⤒Ⴀ㈨※ࢆ୍యⓗά⏝ࡍࡿࡶࠊࢢ࣮ࣝࣉయࡢほⅬ
ࡽࡢ⤒Ⴀ㈨※ࡢ᭱㐺㓄ศཬࡧ㎿㏿࡞ពᛮỴᐃࡀྍ⬟࡞ࡿ࠸࠺࣓ࣜࢵࢺࢆࠊ୧♫ࡶாཷࡍ
ࡿࡇࡀ࡛ࡁࡿ⪃࠼࡚࠾ࡾࡲࡍࠋලయⓗࡣࠊ◊✲㛤Ⓨࠊ⏕⏘ࠊㄪ㐩ࠊ㈍ࠊ≀ὶཬࡧ⟶⌮ࡢ
ྛ㡿ᇦ࡛୧♫ࡢ⤒Ⴀ㈨※ࢆ⤌ࡳྜࢃࡏࠊ⏕⏘యไཬࡧタഛᢞ㈨ࡢ᭱㐺ࠊඹྠ㉎㈙ࠊ≀ὶຠ⋡
୪ࡧᅾᗜ᭱㐺➼ࢆ㐍ࡵࡿࡇ࡛ࠊ㔜」ᢞ㈨ཬࡧ⟶⌮ࢥࢫࢺࢆᢚไࡋ࡞ࡀࡽࠊᡂ㛗ᢞ㈨ࢆᣑ
ࡉࡏࡿࡇ࡛┈ᛶࡢྥୖࢆᅗࡾࡲࡍࠋࡲࡓࠊ᪥ᮏሬᩱࡣࠊ⚄ᮾሬᩱࡀᙉࡳࢆᣢࡘᕤᴗ⏝ሬᩱ
㸦㟁╔࣭⢊య㸧ࢆᵓ㐀≀ሬᩱḟࡄᰕࡍࡿᴗ࣏࣮ࢺࣇ࢛ࣜ࢜ࡢぢ┤ࡋࢆ᪤ᐇࡋ࡚࠾ࡾࠊ
ࡑࡢලయྥࡅ࡚ࠊ୧♫ࡀ᭷ࡍࡿ〇ရࠊᢏ⾡ࠊ㈍㊰ཬࡧ㢳ᐈᇶ┙ࢆ᭷ຠά⏝ࡍࡿࡇ࡛ࠊྠศ
㔝࠾ࡅࡿ➇தຊཬࡧ┈ຊࡢྥୖࢆ┠ᣦࡋࡲࡍࠋ࠶ࢃࡏ࡚ࠊ୧♫〇ရࡢࢡࣟࢫࢭࣝཬࡧ᪂つ⏝
㏵ࡢ㛤ᣅࢆ᳨ウࡍࡿࡶࠊ⚄ᮾሬᩱࡢ᪤Ꮡࡢᾏእྜᘚᴗࣃ࣮ࢺࢼ࣮ࡢᥦᦠࢆ῝ࡉࡏࠊ
��
≉ᮾ༡ࢪࢆ୰ᚰࡋࡓᴗ㡿ᇦࡢᣑࢆ┠ᣦࡋࡲࡍࠋࡉࡽࠊࢩࢫࢸ࣒ࡢ⤫ྜ࣭ඹྠ⏝
ཬࡧ㔜」ࡍࡿ⟶⌮ᶵ⬟ࡢᩚ⌮➼ࢆẁ㝵ⓗ㐍ࡵࡿࡇ࡛ࠊ㈨㔠ࡸேⓗࣜࢯ࣮ࢫ࣭㛫ࢆฟࡋࠊ
ࡑࢀࡽࢆ◊✲㛤Ⓨࠊタഛᢞ㈨ཬࡧேᮦ⫱ᡂ࣭☜ಖࡾྥࡅࡲࡍࠋࡇࢀࡼࡾࠊ⚄ᮾሬᩱࡢᢏ⾡ࠊ
ࣈࣛࣥࢻࠊேᮦཬࡧ㢳ᐈᑐᛂຊࢆ⥔ᣢࡋ࡞ࡀࡽࠊ୰㛗ᮇⓗ࡞ᵓ㐀ᨵ㠉ཬࡧᣢ⥆ⓗᡂ㛗ࡢᐇ⌧ࡀྍ
⬟࡞ࡿ⪃࠼࡚࠾ࡾࡲࡍࠋ�
�
࡞࠾ࠊᮏᰴᘧࢆ㏻ࡌ࡚⚄ᮾሬᩱࡣୖሙᗫṆ࡞ࡿࡓࡵࠊ୍⯡ⓗୖሙᴗࡀாཷ࡛ࡁࡿ࢚
ࢡࢸࣇࢼࣥࢫࡼࡿከᵝ࡞㈨㔠ㄪ㐩ᡭẁࡢ☜ಖࠊ♫ⓗ࡞ಙ⏝ຊࡸ▱ྡᗘྥୖక࠺᥇
⏝άືࡢዲᙳ㡪ࠊィ┘ᰝࢆ㏻ࡌࡓ㈈ົሗࡢಙ㢗ᛶࡢྥୖ࡞ࡢⅬࢆᚓࡽࢀ࡞ࡃ࡞ࡾࡲࡍࠋ
�
ࡋࡋࠊᮏᰴᘧࡢᐇᚋ࠾࠸࡚ࡶࠊ⚄ᮾሬᩱࡣᮾドࣉ࣒ࣛᕷሙୖሙࡍࡿ᪥ᮏሬᩱ
ࡢᏊ♫ࡋ࡚ࠊ᪥ᮏሬᩱࢢ࣮ࣝࣉࡢಙ⏝ຊࠊ▱ྡᗘࠊ㈨㔠ㄪ㐩ຊཬࡧᴗᇶ┙ࢆᘬࡁ⥆
ࡁά⏝ࡍࡿࡇࡀ࡛ࡁࡲࡍࠋࡲࡓࠊ᪥ᮏሬᩱࢢ࣮ࣝࣉࢆ㏻ࡌࡓ㈨㔠ㄪ㐩ࠊ⤒Ⴀ㈨※ࡢ㓄ศࠊ᥇
⏝࣭ேᮦ⫱ᡂࠊࢥࣥࣉࣛࣥࢫཬࡧࣜࢫࢡ⟶⌮యไࡢ┦ά⏝ࡀྍ⬟࡞ࡿࠊୖሙ⥔ᣢ
క࠺㛤♧࣭⟶⌮ᴗົࡢ㈇ᢸࢆ㍍ῶࡋࠊฟࡉࢀࡓ㈨㔠ࠊேᮦཬࡧ㛫ࢆᡂ㛗ᢞ㈨ࡾྥࡅࡿࡇ
ࡀྍ⬟࡞ࡾࡲࡍࠋࡑࡢࡓࡵࠊ୧♫ࡣࠊ⚄ᮾሬᩱࡢୖሙᗫṆక࠺ᙳ㡪ࡣ㝈ᐃⓗ࡛࠶ࡿ⪃࠼
࡚࠾ࡾࡲࡍࠋ�
�
ࡲࡓࠊ୧♫ࡣࠊᏊ♫ࡢ᪉ἲࡋ࡚ᮏᰴᘧࢆ㑅ᢥࡍࡿࡇࡀᮃࡲࡋ࠸ุ᩿࠸ࡓࡋ
ࡲࡋࡓࠋࡍ࡞ࢃࡕࠊᮏᰴᘧࡢᑐ౯ࡋ࡚ࠊ᪥ᮏሬᩱࡢᬑ㏻ᰴᘧ㸦௨ୗࠕ᪥ᮏሬᩱᰴᘧࠖ
࠸࠸ࡲࡍࠋ
㸧ࡀ⚄ᮾሬᩱࡢᑡᩘᰴࡢⓙᵝࡉࢀࡿࡇࡼࡾࠊ⚄ᮾሬᩱࡢᑡᩘᰴࡀ᪥
ᮏሬᩱᰴᘧࢆಖ᭷ࡋࠊᏊ♫ᚋฟࡉࢀࡿࢩࢼࢪ࣮ཬࡧᴗᡂ㛗ࡢᡂᯝࢆࠊ᪥ᮏሬᩱ
ࡢᰴࡋ࡚ாཷ࠸ࡓࡔࡃᶵࢆᥦ౪࡛ࡁࡿࡶࡢ⪃࠼࡚࠾ࡾࡲࡍࠋࡲࡓࠊ᪥ᮏሬᩱᰴᘧࡣὶ
ືᛶࡀ㧗ࡃࠊᕷሙ࡛ྲྀᘬࡍࡿࡇ࡛ࠊ㝶ࠊ⌧㔠ࡍࡿࡇࡶྍ⬟࡛࠶ࡿࡇࡽࠊᰴᘧࡀ
㐺ษ࡛࠶ࡿ⪃࠼࡚࠾ࡾࡲࡍࠋ�
�
௨ୖࡢⅬࢆ㋃ࡲ࠼ࡓ⤖ᯝࠊ᪥ᮏሬᩱࡋ࡚ࡣࠊᮏᰴᘧࡼࡾ᪥ᮏሬᩱࡀ⚄ᮾሬᩱࢆ
Ꮚ♫ࡍࡿࡇࡀࠊ᪥ᮏሬᩱཬࡧ⚄ᮾሬᩱ᪉ࡢᴗ౯್ࡢ⥔ᣢྥୖ㈨ࡍࡿ᭱ၿࡢ⟇࡛
࠶ࡿࡢ⤖ㄽ⮳ࡾࡲࡋࡓࠋࡲࡓࠊ⚄ᮾሬᩱࡋ࡚ࡶࠊ୧♫ࡢᴗ౯್ཬࡧᰴඹྠࡢ┈ࡢྥ
ୖࡢほⅬࡽࠊᰴᘧࡀ᭱ၿࡢ⟇࡛࠶ࡿࡢ⤖ㄽ⮳ࡾࡲࡋࡓࠋ�
௨ୖࡢ࠾ࡾࠊ୧♫࠾࠸࡚ៅ㔜᳨ウࢆ㔜ࡡࡓ⤖ᯝࠊᮏᰴᘧࡼࡗ࡚⚄ᮾሬᩱࡀ᪥ᮏ
ሬᩱࡢᏊ♫࡞ࡿࡇࡀࠊ୧♫ࡢᴗ౯್ࡢ⥔ᣢྥୖ㈨ࡍࡿࡶࡢ࡛࠶ࡿࡢㄆ㆑୍࡛⮴
ࡋࡲࡋࡓࠋࡑࡢୖ࡛ࠊᮏᰴᘧಀࡿᙜẚ⋡ࢆྵࡴㅖ᮲௳ࡘ࠸࡚ࡢ༠㆟ࢆ⤒࡚ྜព⮳ࡾࠊ
ᮏ᪥ࠊ୧♫ࡢྲྀ⥾ᙺ࠾࠸࡚ࠊ᪥ᮏሬᩱࡀ⚄ᮾሬᩱࢆᏊ♫ࡍࡿࡇࢆ┠ⓗࡋࡓᮏ
ᰴᘧࡢᐇࢆỴ㆟ࡋࠊ࠶ࢃࡏ࡚ᮏᰴᘧዎ⣙ࢆ⥾⤖࠸ࡓࡋࡲࡋࡓࠋ�
�
㸰㸬 ᮏᰴᘧࡢせ᪨�
㸯 ᮏᰴᘧࡢ᪥⛬�
��
ᮏᰴᘧዎ⣙⥾⤖ࡢྲྀ⥾ᙺỴ㆟᪥㸦୧♫㸧�
���� ᖺ �� ᭶㸴᪥㸦㔠㸧�
ᮏᰴᘧዎ⣙⥾⤖᪥㸦୧♫㸧�
���� ᖺ �� ᭶㸴᪥㸦㔠㸧�
⮫ᰴ⥲ᇶ‽᪥බ࿌᪥㸦⚄ᮾሬᩱ㸧�
���� ᖺ �� ᭶㸴᪥㸦㔠㸧㸦ணᐃ㸧�
⮫ᰴ⥲ᇶ‽᪥㸦⚄ᮾሬᩱ㸧�
���� ᖺ �� ᭶ �� ᪥㸦ᅵ㸧
㸦ணᐃ㸧�
ᮏᰴᘧዎ⣙ᢎㄆ⮫ᰴ⥲㛤ദ᪥㸦⚄ᮾሬᩱ㸧�
���� ᖺ㸯᭶ �� ᪥㸦㔠㸧㸦ணᐃ㸧�
᭱⤊㈙᪥㸦⚄ᮾሬᩱ㸧�
���� ᖺ㸰᭶ �� ᪥㸦㔠㸧㸦ணᐃ㸧�
ୖሙᗫṆ᪥㸦⚄ᮾሬᩱ㸧�
���� ᖺ㸰᭶ �� ᪥㸦᭶㸧㸦ணᐃ㸧�
ᮏᰴᘧࡢᐇணᐃ᪥㸦ຠຊⓎ⏕᪥㸧�
���� ᖺ㸰᭶ �� ᪥㸦ᮌ㸧㸦ணᐃ㸧�
㸦ὀ㸯㸧
᪥ᮏሬᩱ࠾࠸࡚ࡣࠊ♫ἲ➨ ��� ᮲➨㸰㡯ࡢつᐃᇶ࡙ࡁࠊᰴ⥲ࡢỴ㆟ࡼࡿᢎ
ㄆࢆᚲせࡋ࡞࠸⡆᫆ᰴᘧࡢᡭ⥆ࡼࡾᮏᰴᘧࢆ⾜࠺ணᐃ࡛ࡍࠋ�
㸦ὀ㸰㸧
ୖグ᪥⛬ࡣࠊᮏᰴᘧಀࡿᡭ⥆㐍⾜ୖࡢᚲせᛶࡑࡢࡢ⏤ࡼࡗ࡚ᚲせ࡞ࡿሙྜ
ࡣࠊ୧♫ࡢྜពࡼࡾኚ᭦ࡉࢀࡿࡇࡀ࠶ࡾࡲࡍࠋୖグ᪥⛬ኚ᭦ࡀ⏕ࡌࡓሙྜࡣࠊ
㏿ࡸබ⾲࠸ࡓࡋࡲࡍࠋ�
�
㸰 ᮏᰴᘧࡢ᪉ᘧ�
ᮏᰴᘧࡣࠊ᪥ᮏሬᩱࢆᰴᘧぶ♫ࠊ⚄ᮾሬᩱࢆᰴᘧᏊ♫ࡍࡿᰴᘧ
࡛ࡍࠋᮏᰴᘧࡣࠊ᪥ᮏሬᩱ࠾࠸࡚ࡣࠊ♫ἲ➨ ��� ᮲➨㸰㡯ࡢつᐃᇶ࡙ࡁࠊᰴ
⥲ࡢỴ㆟ࡼࡿᢎㄆࢆᚲせࡋ࡞࠸⡆᫆ᰴᘧࡢᡭ⥆ࡼࡾࠊ
ࡲࡓࠊ
⚄ᮾሬᩱ࠾࠸࡚ࡣ ����
ᖺ㸯᭶ �� ᪥㛤ദணᐃࡢ⮫ᰴ⥲ࡢỴ㆟ࡼࡿᮏᰴᘧዎ⣙ࡢᢎㄆࢆཷࡅࡓୖ࡛ ���� ᖺ
㸰᭶ �� ᪥ࢆຠຊⓎ⏕᪥ࡋ࡚⾜࠺ணᐃ࡛ࡍࠋ�
�
㸱 ᮏᰴᘧಀࡿᙜ࡚ࡢෆᐜ�
᪥ᮏሬᩱ�
⚄ᮾሬᩱ�
㸦ᰴᘧぶ♫㸧�
㸦ᰴᘧᏊ♫㸧�
ᮏᰴᘧಀࡿᙜẚ⋡�
㸯�
�������
ᮏᰴᘧࡼࡾࡍࡿ
᪥ᮏሬᩱࡢᬑ㏻ᰴᘧ㸸��������� ᰴ㸦ணᐃ㸧�
�
ᰴᘧᩘ�
㸦ὀ㸯㸧
ᰴᘧࡢᙜẚ⋡�
⚄ᮾሬᩱᰴᘧ㸯ᰴᑐࡋ࡚ࠊ᪥ᮏሬᩱᰴᘧ ������ ᰴࢆᙜ࠸ࡓࡋࡲࡍࠋ
ࡓࡔࡋࠊ
ᇶ‽㸦௨ୗᐃ⩏ࡋࡲࡍࠋ㸧࠾࠸࡚᪥ᮏሬᩱࡀಖ᭷ࡍࡿ⚄ᮾሬᩱᰴᘧࡘ࠸࡚ࡣࠊ
ᮏᰴᘧࡼࡿᰴᘧࡢᙜ࡚ࡣ⾜࠸ࡲࡏࢇࠋ࡞࠾ࠊୖグࡢᮏᰴᘧಀࡿᙜẚ⋡
㸦௨ୗࠕᮏᰴᘧẚ⋡ࠖ࠸࠸ࡲࡍࠋ
㸧ࡣࠊ⟬ᐃࡢ᰿ᣐ࡞ࡿㅖ᮲௳㔜࡞ኚ᭦ࡀ
⏕ࡌࡓሙྜࠊ୧♫㛫࡛༠㆟ࡋࠊྜពࡢୖࠊኚ᭦ࡍࡿࡇࡀ࠶ࡾࡲࡍࠋ�
㸦ὀ㸰㸧
ᮏᰴᘧࡼࡾࡍࡿ᪥ᮏሬᩱᰴᘧࡢᩘ�
��
᪥ᮏሬᩱࡣࠊᮏᰴᘧ㝿ࡋ࡚ࠊᮏᰴᘧࡼࡾ᪥ᮏሬᩱࡀ⚄ᮾሬᩱࡢⓎ⾜῭
ᰴᘧ㸦ࡓࡔࡋࠊ᪥ᮏሬᩱࡀಖ᭷ࡍࡿ⚄ᮾሬᩱᰴᘧࢆ㝖ࡁࡲࡍࠋ㸧ࡢ࡚ࢆྲྀᚓࡍࡿ
Ⅼࡢ┤๓㸦௨ୗࠕᇶ‽ࠖ࠸࠸ࡲࡍࠋ㸧࠾ࡅࡿ⚄ᮾሬᩱࡢᰴࡢⓙᵝ㸦ࡓࡔࡋࠊ
௨ୗࡢ⮬ᕫᰴᘧࡀᾘ༷ࡉࢀࡓᚋࡢᰴࢆ࠸࠸ࠊ᪥ᮏሬᩱࢆ㝖ࡁࡲࡍࠋ㸧ᑐࡋࠊࡑࡢ
ಖ᭷ࡍࡿ⚄ᮾሬᩱᰴᘧ௦࠼࡚ࠊࡑࡢಖ᭷ࡍࡿ⚄ᮾሬᩱᰴᘧࡢᩘࡢྜィ ������ ࢆ
ࡌ࡚ᚓࡓᰴᩘࡢ᪥ᮏሬᩱᰴᘧࢆ࠸ࡓࡋࡲࡍࠋ�
ࡲࡓࠊ᪥ᮏሬᩱࡀࡍࡿᰴᘧࡢ࡚ࡣࠊ᪥ᮏሬᩱࡀᮏ᪥Ⅼ࡛ಖ᭷ࡍࡿ⮬ᕫᰴᘧ
ཬࡧ᪥ᮏሬᩱࡀᮏ᪥௨㝆᪂ࡓྲྀᚓࡍࡿ⮬ᕫᰴᘧࡢ୍㒊ࢆᙜࡍࡿணᐃ࡛ࡍࡀࠊ
௬㊊ࡍࡿሙྜࡣࠊ᪥ᮏሬᩱࡣࠊᮏᰴᘧࡼࡿᰴᘧࡢ㝿ࡋࠊᙜヱ㊊
ศ┦ᙜࡍࡿᩘࡢᬑ㏻ᰴᘧࢆ᪂ࡓⓎ⾜ࡍࡿணᐃ࡛ࡍࠋ�
࡞࠾ࠊ⚄ᮾሬᩱࡣࠊᮏᰴᘧࡢຠຊⓎ⏕᪥ࡢ๓᪥ࡲ࡛㛤ദࡍࡿ⚄ᮾሬᩱࡢྲྀ⥾ᙺ
Ỵ㆟ࡼࡾࠊᇶ‽ࡢ┤๓ࡢⅬ࠾࠸࡚ಖ᭷ࡋ࡚࠸ࡿ⮬ᕫᰴᘧ㸦ᮏᰴᘧ㛵ࡋ࡚
࡞ࡉࢀࡿࠊ♫ἲ➨ ��� ᮲➨㸯㡯ᐃࡵࡿᑐᰴࡢᰴᘧ㈙ྲྀㄳồಀࡿᰴᘧࡢ㈙ྲྀ
ࡾࡼࡗ࡚⚄ᮾሬᩱࡀྲྀᚓࡍࡿ⮬ᕫᰴᘧࢆྵࡳࡲࡍࠋ
㸧ࡢ࡚ࢆࠊᇶ‽ࡢ┤๓ࡢⅬ
ࢆࡶࡗ࡚ᾘ༷ࡍࡿணᐃ࡛ࡍࠋᮏᰴᘧࡼࡗ࡚ᙜࡍࡿᰴᘧᩘࡣࠊ⚄ᮾሬᩱࡢ⮬
ᕫᰴᘧࡢྲྀᚓࠊᾘ༷➼ࡢ⌮⏤ࡼࡾࠊᚋಟṇࡉࢀࡿྍ⬟ᛶࡀ࠶ࡾࡲࡍࠋ�
㸦ὀ㸱㸧
༢ඖᮍ‶ᰴᘧࡢྲྀᢅ࠸�
ᮏᰴᘧక࠸ࠊ᪥ᮏሬᩱࡢ༢ඖᮍ‶ᰴᘧ㸦��� ᰴᮍ‶ࡢᰴᘧ㸧ࢆಖ᭷ࡍࡿࡇ
࡞ࡿ⚄ᮾሬᩱࡢᰴࡢⓙᵝࡘ࠸࡚ࡣࠊᮏᰴᘧࡢຠຊⓎ⏕᪥௨㝆ࠊ♫ἲ➨ ��� ᮲
➨㸯㡯୪ࡧ᪥ᮏሬᩱࡢᐃḰཬࡧᰴᘧྲྀᢅつ๎ࡢᐃࡵࡿࡇࢁࡼࡾࠊࡑࡢಖ᭷ࡍ
ࡿ༢ඖᮍ‶ᰴᘧࢆ㈙࠸ྲྀࡿࡇࢆ᪥ᮏሬᩱᑐࡋ࡚ㄳồࡍࡿࡇࡀ࡛ࡁࡲࡍࠋ࡞࠾ࠊ
㔠⼥ၟရྲྀᘬᕷሙ࠾࠸࡚༢ඖᮍ‶ᰴᘧࢆ༷ࡍࡿࡇࡣ࡛ࡁࡲࡏࢇࠋ�
㸦ὀ㸲㸧
㸯ᰴ‶ࡓ࡞࠸➃ᩘࡢྲྀᢅ࠸�
ᮏᰴᘧక࠸ࠊ㸯ᰴ‶ࡓ࡞࠸➃ᩘࡢ᪥ᮏሬᩱᰴᘧࡢࢆཷࡅࡿࡇ࡞ࡿ
⚄ᮾሬᩱࡢᰴࡢⓙᵝ㛵ࡋ࡚ࡣࠊ♫ἲ➨ ��� ᮲ࡑࡢࡢ㛵㐃ἲ௧ࡢᐃࡵᚑ࠸ࠊ
ࡑࡢ➃ᩘࡢྜィᩘ㸦ࡑࡢྜィᩘ㸯‶ࡓ࡞࠸➃ᩘࡀ࠶ࡿሙྜࡣษࡾᤞ࡚ࡿࡶࡢࡋ
ࡲࡍࠋ
㸧┦ᙜࡍࡿ᪥ᮏሬᩱᰴᘧࢆ༷ࡋࠊࡿ༷௦㔠ࢆࡑࡢ➃ᩘᛂࡌ࡚ᙜヱ
ᰴࡢⓙᵝ࠸ࡓࡋࡲࡍࠋ�
�
㸲 ᮏᰴᘧక࠺᪂ᰴண⣙ᶒཬࡧ᪂ᰴண⣙ᶒ♫മ㛵ࡍࡿྲྀᢅ࠸�
⚄ᮾሬᩱࡣࠊ᪂ᰴண⣙ᶒཬࡧ᪂ᰴண⣙ᶒ♫മࢆⓎ⾜ࡋ࡚࠸࡞࠸ࡓࡵࠊヱᙜ㡯ࡣ࠶ࡾࡲࡏࢇࠋ�
�
㸱㸬 ᮏᰴᘧಀࡿᙜ࡚ࡢෆᐜࡢ᰿ᣐ➼�
㸯 ᙜ࡚ࡢෆᐜࡢ᰿ᣐཬࡧ⌮⏤�
᪥ᮏሬᩱཬࡧ⚄ᮾሬᩱࡣࠊᮏᰴᘧẚ⋡ࡢỴᐃᙜࡓࡗ࡚බṇᛶཬࡧጇᙜᛶࢆ☜ಖࡍࡿࡓ
ࡵࠊࡑࢀࡒࢀูಶࠊ୧♫ࡽ⊂❧ࡋࡓ➨୕⪅⟬ᐃᶵ㛵ཬࡧྛ✀ࢻࣂࢨ࣮ࢆ㑅ᐃࡋࡲࡋࡓࠋ
᪥ᮏሬᩱࡣࠊࣇࢼࣥࢩ࣭ࣕࣝࢻࣂࢨ࣮ཬࡧ➨୕⪅⟬ᐃᶵ㛵ࡋ࡚ᰴᘧ♫୕⳻㹓㹄㹈
㖟⾜ࢥ࣮࣏࣮ࣞࢺሗႠᴗ㒊㈈ົ㛤Ⓨᐊ㸦௨ୗࠕ୕⳻㹓㹄㹈㖟⾜㈈ົ㛤Ⓨᐊࠖ࠸࠸ࡲࡍࠋ㸧ࢆࠊ
��
ἲົࢻࣂࢨ࣮ࡋ࡚ࣥࢲ࣮ࢯ࣭ࣥẟ࣭ᖖἲᚊົᡤእᅜἲඹྠᴗཬࡧᘚㆤኈἲே
ࣥࢲ࣮ࢯ࣭ࣥẟ࣭ᖖἲᚊົᡤ�
㸦௨ୗࠊ⥲⛠ࡋ࡚�
ࠕࣥࢲ࣮ࢯ࣭ࣥẟ࣭ᖖἲᚊົᡤࠖ
࠸࠸ࡲࡍࠋ㸧ࢆ㑅ᐃࡋࠊ⚄ᮾሬᩱࡣࣇࢼࣥࢩ࣭ࣕࣝࢻࣂࢨ࣮ཬࡧ➨୕⪅⟬ᐃᶵ㛵ࡋ࡚㹈
㹟㹮㹟㹬� 㹀㹪㹳㹣� 㹋㸤㸿ࢻࣂࢨ࣮ࣜᰴᘧ♫㸦௨ୗࠕ㹈㹀㹋㸿ࠖ࠸࠸ࡲࡍࠋ
㸧ࢆࠊἲົ
ࢻࣂࢨ࣮ࡋ࡚ᘚㆤኈἲேỤᶫἲᚊົᡤ㸦௨ୗࠕỤᶫἲᚊົᡤࠖ࠸࠸ࡲࡍࠋ㸧ࢆࠊ
ィ࣭⛯ົࢻࣂࢨ࣮ࡋ࡚㹀㹂㹍� 㹁㹟㹌� 㹄㸿㹑ྜྠ♫ࢆ㑅ᐃࡋࠊᮏ᱁ⓗ࡞᳨ウࢆ㛤ጞ
࠸ࡓࡋࡲࡋࡓࠋ�
᪥ᮏሬᩱ࠾࠸࡚ࡣࠊୗグ㸦㸲㸧
ࠕබṇᛶࢆᢸಖࡍࡿࡓࡵࡢᥐ⨨㸦┈┦ࢆᅇ㑊ࡍࡿࡓࡵࡢ
ᥐ⨨ࢆྵࡴࠋ㸧ࠖグ㍕ࡢ࠾ࡾࠊ᪥ᮏሬᩱࡢࣇࢼࣥࢩ࣭ࣕࣝࢻࣂࢨ࣮ཬࡧ➨୕⪅⟬ᐃ
ᶵ㛵࡛࠶ࡿ୕⳻㹓㹄㹈㖟⾜㈈ົ㛤Ⓨᐊࡽ ���� ᖺ �� ᭶㸳᪥࡛ྲྀᚓࡋࡓᰴᘧẚ⋡⟬ᐃ᭩ࠊ
ἲົࢻࣂࢨ࣮࡛࠶ࡿࣥࢲ࣮ࢯ࣭ࣥẟ࣭ᖖἲᚊົᡤࡽࡢຓゝࠊ᪥ᮏሬᩱࡀ⚄ᮾሬ
ᩱᑐࡋ࡚ ���� ᖺ㸶᭶ୗ᪪ࡽ �� ᭶୰᪪ࡅ࡚ᐇࡋࡓࢹ࣮࣭ࣗࢹࣜࢪ࢙ࣥࢫࡢ⤖ᯝ➼ࢆ
㋃ࡲ࠼࡚ࠊៅ㔜༠㆟᳨࣭ウࡋࡓ⤖ᯝࠊᮏᰴᘧẚ⋡ࡣጇᙜ࡛࠶ࡾࠊ᪥ᮏሬᩱࡢᰴࡢⓙᵝࡢ
┈㈨ࡍࡿࡢ⤖ㄽ⮳ࡗࡓࡓࡵࠊᮏᰴᘧẚ⋡ࡼࡾᮏᰴᘧࢆ⾜࠺ࡇࡀጇᙜ࡛࠶ࡿ
ุ᩿࠸ࡓࡋࡲࡋࡓࠋ�
�
᪉ࠊ⚄ᮾሬᩱ࠾࠸࡚ࡣࠊୗグ㸦㸲㸧
ࠕබṇᛶࢆᢸಖࡍࡿࡓࡵࡢᥐ⨨㸦┈┦ࢆᅇ㑊ࡍࡿࡓ
ࡵࡢᥐ⨨ࢆྵࡴࠋ㸧ࠖグ㍕ࡢ࠾ࡾࠊ⚄ᮾሬᩱࡢࣇࢼࣥࢩ࣭ࣕࣝࢻࣂࢨ࣮ཬࡧ➨୕⪅⟬
ᐃᶵ㛵࡛࠶ࡿ㹈㹀㹋㸿ࡽ ���� ᖺ �� ᭶㸳᪥࡛ྲྀᚓࡋࡓᰴᘧẚ⋡⟬ᐃ᭩ࠊἲົࢻࣂࢨ
࣮࡛࠶ࡿỤᶫἲᚊົᡤࡽࡢຓゝࠊ⚄ᮾሬᩱࡀ᪥ᮏሬᩱᑐࡋ࡚ ���� ᖺ㸶᭶ୗ᪪ࡽ ��
᭶୰᪪ࡅ࡚ᐇࡋࡓࢹ࣮࣭ࣗࢹࣜࢪ࢙ࣥࢫࡢ⤖ᯝࠊ᪥ᮏሬᩱࡢ㛫࡛ᐖ㛵ಀࢆ᭷ࡋ࡞
࠸⊂❧ࡋࡓጤဨࡢࡳࡽᵓᡂࡉࢀࡿᮏ⊂❧ᙺဨጤဨࡽࡢᣦ♧ࠊຓゝཬࡧ ���� ᖺ �� ᭶㸳᪥
࡛ཷ㡿ࡋࡓ⟅⏦᭩㸦ヲ⣽ࡘ࠸࡚ࡣࠊୗグ�
㸦㸲㸧
ࠕබṇᛶࢆᢸಖࡍࡿࡓࡵࡢᥐ⨨㸦┈┦ࢆᅇ㑊
ࡍࡿࡓࡵࡢᥐ⨨ࢆྵࡴࠋ
㸧ࠖࢆࡈཧ↷ࡃࡔࡉ࠸ࠋ
㸧ࡢෆᐜ➼ࢆ㋃ࡲ࠼࡚ࠊៅ㔜༠㆟᳨࣭ウࢆ࠸ࡓࡋ
ࡲࡋࡓࠋࡑࡢ⤖ᯝࠊᮏᰴᘧẚ⋡ࡣጇᙜ࡛࠶ࡾࠊ⚄ᮾሬᩱࡢᰴࡢⓙᵝࡢ┈㈨ࡍࡿࡢุ
᩿⮳ࡗࡓࡓࡵࠊ⚄ᮾሬᩱࡣࠊᮏᰴᘧẚ⋡ࡼࡾᮏᰴᘧࢆ⾜࠺ࡇࡀጇᙜ࡛࠶ࡿุ᩿
࠸ࡓࡋࡲࡋࡓࠋ�
�
௨ୖࡢ࠾ࡾࠊ᪥ᮏሬᩱཬࡧ⚄ᮾሬᩱࡣࠊ୧♫ࡀࡑࢀࡒࢀࡢࣇࢼࣥࢩ࣭ࣕࣝࢻࣂࢨ
࣮ཬࡧ➨୕⪅⟬ᐃᶵ㛵ࡽᥦฟࢆཷࡅࡓᰴᘧẚ⋡ࡢ⟬ᐃ⤖ᯝࢆཧ⪃ࠊࡑࢀࡒࢀࡀ┦ᡭ᪉
ᑐࡋ࡚ᐇࡋࡓࢹ࣮࣭ࣗࢹࣜࢪ࢙ࣥࢫࡢ⤖ᯝ➼ࢆ㋃ࡲ࠼࡚ៅ㔜᳨ウࡋࠊ୧♫ࡢ㈈ົ≧ἣ࣭㈨
⏘≧ἣ࣭ᑗ᮶ࡢぢ㏻ࡋ➼ࡢせᅉࢆ⥲ྜⓗ຺ࡋࡓୖ࡛ࠊ΅࣭༠㆟ࢆ㔜ࡡ࡚ࡲ࠸ࡾࡲࡋࡓࠋࡑࡢ
⤖ᯝࠊ᪥ᮏሬᩱཬࡧ⚄ᮾሬᩱࡣࠊᮏᰴᘧẚ⋡ࡣጇᙜ࡛࠶ࡾࠊࡑࢀࡒࢀࡢᰴࡢⓙᵝࡢ┈
㈨ࡍࡿࡢุ᩿⮳ࡗࡓࡓࡵࠊᮏᰴᘧẚ⋡ࡼࡾᮏᰴᘧࢆ⾜࠺ࡇࡀጇᙜ࡛࠶ࡿุ
᩿࠸ࡓࡋࡲࡋࡓࠋࡲࡓࠊ᪥ᮏሬᩱཬࡧ⚄ᮾሬᩱࡣࠊᮏᰴᘧẚ⋡ࡢ๓ᥦ࡞ࡿ⚄ᮾሬᩱࡢᰴ
ᘧ౯್ࡀࠊ
㸦㸧ᮏබ㛤㈙౯᱁�
㸦ᬑ㏻ᰴᘧ㸯ᰴࡘࡁ �� 㸧
ࠊཬࡧ㸦㸧ᮏ➨୕⪅ᙜቑ㈨ࡢ㝿
ࡢ㸯ᰴᙜࡓࡾࡢⓎ⾜౯㢠㸦��� 㸧ࢆୖᅇࡿࡇࡶᮏᰴᘧẚ⋡ࡢጇᙜᛶࢆࡅࡿࡶࡢ࡛࠶ࡿ
⪃࠼࡚࠾ࡾࡲࡍࠋ�
��
�
࡞࠾ࠊᮏᰴᘧẚ⋡ࡣࠊᮏᰴᘧዎ⣙ᚑ࠸ࠊ⟬ᐃࡢᇶ♏࡞ࡿㅖ᮲௳㔜࡞ኚ᭦ࡀ⏕
ࡌࡓሙྜࡣࠊ୧♫㛫࡛༠㆟ࡋࠊྜពࡢୖࠊኚ᭦ࡍࡿࡇࡀ࠶ࡾࡲࡍࠋ�
�
㸰 ⟬ᐃ㛵ࡍࡿ㡯�
ձ
⟬ᐃᶵ㛵ࡢྡ⛠୪ࡧୖሙ♫ཬࡧ┦ᡭ♫ࡢ㛵ಀ�
᪥ᮏሬᩱࡢ➨୕⪅⟬ᐃᶵ㛵࡛࠶ࡿ୕⳻㹓㹄㹈㖟⾜㈈ົ㛤Ⓨᐊࠊ⚄ᮾሬᩱࡢ➨୕⪅⟬ᐃᶵ㛵࡛
࠶ࡿ㹈㹀㹋㸿ࡣ࠸ࡎࢀࡶࠊ᪥ᮏሬᩱཬࡧ⚄ᮾሬᩱࡽ⊂❧ࡋࡓ⟬ᐃᶵ㛵࡛࠶ࡾࠊ᪥ᮏሬᩱཬ
ࡧ⚄ᮾሬᩱࡢ㛵㐃ᙜ⪅ヱᙜࡏࡎࠊᮏᰴᘧ㛵ࡋ࡚グ㍕ࡍࡁ㔜せ࡞ᐖ㛵ಀࢆ᭷ࡋࡲࡏ
ࢇࠋ�
୕⳻㹓㹄㹈㖟⾜㈈ົ㛤Ⓨᐊࡢሗ㓘ࡣࠊᮏᰴᘧࡢᡂ❧➼ࢆ᮲௳ᨭᡶࢃࢀࡿᡂຌሗ㓘ࡀྵ
ࡲࢀ࡚࠾ࡾࡲࡍࡀࠊ᪥ᮏሬᩱࡣࠊྠ✀ࡢྲྀᘬ࠾ࡅࡿ୍⯡ⓗ࡞ᐇົ័⾜➼ࡶ຺ࡍࢀࡤࠊᮏᰴ
ᘧࡢᡂ❧➼ࢆ᮲௳ᨭᡶࢃࢀࡿᡂຌሗ㓘ࡀྵࡲࢀ࡚࠸ࡿࡇࢆࡶࡗ࡚⊂❧ᛶࡀྰᐃࡉࢀࡿࢃ
ࡅ࡛ࡣ࡞࠸ุ᩿ࡋ࡚࠾ࡾࡲࡍࠋ�
࡞࠾ࠊἲேࡋ࡚ࡢ୕⳻㹓㹄㹈㖟⾜ࡣࠊ᪥ᮏሬᩱཬࡧ⚄ᮾሬᩱᑐࡋ࡚㖟⾜ྲྀᘬࡢ୍⎔ࡋ
࡚⼥㈨ྲྀᘬ➼ࢆ⾜ࡗ࡚࠾ࡾࠊࡲࡓࠊ᪥ᮏሬᩱᑐࡋ࡚ࡣᰴࡓࡿᆅࢆ᭷ࡋ࡚࠸ࡿࡇࡽࠊ
ἲேࡋ࡚ࡢ୕⳻㹓㹄㹈㖟⾜ࡣ᪥ᮏሬᩱཬࡧ⚄ᮾሬᩱᐖ㛵ಀࢆ᭷ࡋ࡚࠸ࡿࡶࡢࡢࠊྠ⾜ࡣࠊ
㖟⾜ἲ➨ �� ᮲ࡢ㸱ࡢ㸰➨㸯㡯ཬࡧ㖟⾜ἲ⾜つ๎➨ �� ᮲ࡢ �� ࡢ㸱ࡢ㸱➼ࡢ㐺⏝ἲ௧ᚑࡗࡓἲ
ⓗ⩏ົࡋ࡚ࠊ⾜ෆ࠾ࡅࡿሗ㝸ቨᥐ⨨➼ࠊ㐺ษ࡞┈┦⟶⌮యไࢆᵓ⠏ࡋࠊࡘࠊᐇࡋ࡚
࠾ࡾࠊ⟬ᐃᶵ㛵ࡋ࡚ࡢ୕⳻㹓㹄㹈㖟⾜㈈ົ㛤Ⓨᐊࡣࠊ⼥㈨ཬࡧฟ㈨ࢆ⾜࠺ྠ⾜ࡢู㒊⨫ࡣ⊂
❧ࡋࡓ❧ሙࡽࠊ᪥ᮏሬᩱᰴᘧཬࡧ⚄ᮾሬᩱᰴᘧࡢᰴᘧ౯್ࡢศᯒࢆ⾜࠺ࡇࡀ࡛ࡁࡿయไࢆ
ᵓ⠏ࡋ࡚࠸ࡿࡶࡢ⪃࠼ࡽࢀࡿࡓࡵࠊ᪥ᮏሬᩱཬࡧ⚄ᮾሬᩱࡣࠊ୕⳻㹓㹄㹈㖟⾜㈈ົ㛤Ⓨᐊ
࠾࠸࡚㐺ษ࡞ᘢᐖ㜵Ṇᥐ⨨ࡀㅮࡌࡽࢀ࡚࠸ࡿࡶࡢุ᩿ࡋ࡚࠾ࡾࡲࡍࠋ�
ࡑࡢࡓࡵࠊ᪥ᮏሬᩱࡣ୕⳻㹓㹄㹈㖟⾜㈈ົ㛤Ⓨᐊᑐࡋ࡚୧♫ࡢᰴᘧ౯್ࡢ⟬ᐃࢆ౫㢗ࡍࡿ
ࡇ㛵ࡋ࡚ࠊබṇᛶࡢほⅬࡽၥ㢟ࡣ࡞࠸⪃࠼ࡽࢀࡿࡇࡽࠊ᪥ᮏሬᩱࡣ୕⳻㹓㹄㹈㖟
⾜㈈ົ㛤Ⓨᐊࢆ୧♫ࡽ⊂❧ࡋࡓ➨୕⪅⟬ᐃᶵ㛵ࡋ࡚㑅ᐃ࠸ࡓࡋࡲࡋࡓࠋ�
ࡲࡓࠊᮏᰴᘧಀࡿ㹈㹀㹋㸿ᑐࡍࡿሗ㓘ࡣࠊᮏᰴᘧࡢᡂ❧➼ࢆ᮲௳ᨭᡶࢃࢀࡿ
ᡂຌሗ㓘ࡀྵࡲࢀ࡚࠾ࡾࡲࡍࡀࠊྠ✀ࡢྲྀᘬ࠾ࡅࡿ୍⯡ⓗ࡞ᐇົ័⾜ࡸᮏᰴᘧࡀᡂ❧
࡞ࡗࡓሙྜ⚄ᮾሬᩱ┦ᛂࡢ㔠㖹ⓗ㈇ᢸࡀ⏕ࡌࡿሗ㓘య⣔ࡢ㠀➼ࢆ຺ࡋࡲࡍࠊᮏᰴᘧ
ࡢࢆ᮲௳ᨭᡶࢃࢀࡿᡂຌሗ㓘ࡀྵࡲࢀ࡚࠸ࡿࡇࢆࡶࡗ࡚ࠊ⊂❧ᛶࡀྰᐃࡉࢀࡿࡶࡢ࡛
ࡣ࡞࠸ุ᩿ࡋ࡚࠾ࡾࡲࡍࠋ�
࡞࠾ࠊ㹈㹀㹋㸿ࡢࢢ࣮ࣝࣉᴗ࡛࠶ࡿᰴᘧ♫ࡳࡎ㖟⾜㸦௨ୗࠕࡳࡎ㖟⾜ࠖ࠸࠸ࡲࡍࠋ㸧
ࡣࠊ᪥ᮏሬᩱཬࡧ⚄ᮾሬᩱᑐࡋ࡚ࠊ㏻ᖖࡢ㖟⾜ྲྀᘬࡢ୍⎔ࡋ࡚⼥㈨ྲྀᘬ➼ࢆᐇࡋ࡚࠾ࡾ
ࡲࡍࡀࠊᮏᰴᘧ㛵ࡋ࡚᪥ᮏሬᩱཬࡧ⚄ᮾሬᩱࡢ┈┦ಀࡿ㔜せ࡞ᐖ㛵ಀࢆ᭷ࡋ
࡚࠾ࡾࡲࡏࢇࠋ㹈㹀㹋㸿ࡼࢀࡤࠊ㹈㹀㹋㸿ࡣࠊࡳࡎ㖟⾜ࡢ㛫ࡢሗ㝸ቨᥐ⨨➼ࡢ㐺ษ࡞
┈┦ᅇ㑊ࡢࡓࡵࡢయไࢆᵓ⠏ࡋࠊࡘᐇࡋ࡚࠾ࡾࠊࡳࡎ㖟⾜ࡢ㈚ே➼ࡢᆅࡣ⊂❧ࡋ
ࡓ❧ሙ࡛ᰴᘧẚ⋡ࡢ⟬ᐃࢆ⾜ࡗ࡚࠸ࡿࡢࡇ࡛ࡍࠋ�
᪥ᮏሬᩱཬࡧ⚄ᮾሬᩱࡣࠊ㹈㹀㹋㸿ࡳࡎ㖟⾜ࡢ㛫࠾࠸࡚㐺ษ࡞ᘢᐖ㜵Ṇᥐ⨨ࡀㅮࡌ
��
ࡽࢀ࡚࠸ࡿࡇࠊ⚄ᮾሬᩱ㹈㹀㹋㸿ࡣ୍⯡ྲྀᘬඛྠᵝࡢྲྀᘬ᮲௳࡛ࡢྲྀᘬࢆᐇࡋ࡚࠸ࡿࡓ
ࡵࠊᮏᰴᘧ࠾ࡅࡿࣇࢼࣥࢩ࣭ࣕࣝࢻࣂࢨ࣮ཬࡧ➨୕⪅⟬ᐃᶵ㛵ࡋ࡚ࡢ⫋ົࢆ⾜
࠺࠶ࡓࡾ༑ศ࡞⊂❧ᛶࡀ☜ಖࡉࢀ࡚࠸ࡿࡇࡽࠊ⚄ᮾሬᩱࡀ㹈㹀㹋㸿ᑐࡋ࡚᪥ᮏሬᩱᰴ
ᘧཬࡧ⚄ᮾሬᩱᰴᘧࡢᰴᘧ౯್⟬ᐃࢆ౫㢗ࡍࡿࡇ㛵ࡋ≉ẁࡢၥ㢟ࡣ࡞࠸ุ᩿ࡋ࡚࠾ࡾࡲࡍࠋ
�
�
ղ
⟬ᐃࡢᴫせ�
㸦L㸧୕⳻㹓㹄㹈㖟⾜㈈ົ㛤Ⓨᐊࡼࡿ⟬ᐃ�
୕⳻㹓㹄㹈㖟⾜㈈ົ㛤Ⓨᐊࡣࠊ᪥ᮏሬᩱࡘ࠸࡚ࡣࠊྠ♫ᰴᘧࡀᮾிドๆྲྀᘬᡤࣉ࣒ࣛ
ᕷሙୖሙࡋ࡚࠾ࡾࠊᕷሙᰴ౯ࡀᏑᅾࡍࡿࡇࡽࠊᕷሙᰴ౯ศᯒࢆ᥇⏝ࡋ࡚⟬ᐃࢆ⾜࠸ࡲࡋ
ࡓࠋࡲࡓࠊ⚄ᮾሬᩱࡘ࠸࡚ࡣࠊྠ♫ᰴᘧࡀᮾிドๆྲྀᘬᡤࢫࢱࣥࢲ࣮ࢻᕷሙୖሙࡋ࡚࠾ࡾࠊ
ᕷሙᰴ౯ࡀᏑᅾࡍࡿࡇࡽࠊᕷሙᰴ౯ศᯒࢆࠊᑗ᮶ࡢᴗάືࡢ≧ἣࢆホ౯ᫎࡍࡿࡓࡵ
㹂㹁㹄ศᯒࢆ⟬ᐃᡭἲࡋ࡚⏝࠸࡚ࠊᰴᘧ౯್ࡢ⟬ᐃࢆ⾜࠸ࡲࡋࡓࠋ�
ྛホ౯᪉ἲࡼࡿ᪥ᮏሬᩱᰴᘧ㸯ᰴ࠶ࡓࡾࡢᰴᘧ౯್ࢆ㸯ࡋࡓሙྜࡢᰴᘧẚ⋡ࡢ⟬
ᐃ⤖ᯝࡣ௨ୗࡢ࠾ࡾ࡞ࡾࡲࡍࠋ�
᥇⏝ᡭἲ
᪥ᮏሬᩱ
ᕷሙᰴ౯ศᯒ
ᰴᘧẚ⋡ࡢ⟬ᐃ⤖ᯝ�
⚄ᮾሬᩱ
ᕷሙᰴ౯ศᯒ
�����㹼������
㹂㹁㹄ศᯒ
�����㹼������
࡞࠾ࠊᕷሙᰴ౯ศᯒࡘ࠸࡚ࡣࠊ���� ᖺ �� ᭶㸳᪥ࢆ⟬ᐃᇶ‽᪥ࡋ࡚ࠊ⟬ᐃᇶ‽᪥ࡢ⤊್
ཬࡧ⟬ᐃᇶ‽᪥ࡲ࡛ࡢ㸯᭶ࠊ㸱᭶ཬࡧ㸴᭶ࡢྛᮇ㛫ࡢ⤊್༢⣧ᖹᆒ್ࢆࡑࢀࡒࢀ᥇⏝࠸
ࡓࡋࡲࡋࡓࠋ�
୕⳻㹓㹄㹈㖟⾜㈈ົ㛤Ⓨᐊࡣࠊᰴᘧẚ⋡ࡢ⟬ᐃ㝿ࡋ࡚ࠊබ㛤ሗཬࡧ୕⳻㹓㹄㹈㖟⾜
㈈ົ㛤Ⓨᐊᥦ౪ࡉࢀࡓ୍ษࡢሗࡀṇ☜ࡘ࡛࠶ࡿࡇࢆ๓ᥦࡋ࡚࠾ࡾࠊ⊂⮬ࡑࢀ
ࡽࡢṇ☜ᛶཬࡧᛶࡘ࠸࡚ࡢ᳨ドࡣ⾜ࡗ࡚࠾ࡾࡲࡏࢇࠋ୧♫ཬࡧࡑࡢ㛵ಀ♫ࡢ㈨⏘ཪࡣ
㈇മ㸦㔠⼥ὴ⏕ၟရࠊ⡙እ㈨⏘ཬࡧ㈇മࠊࡑࡢࡢഅⓎമົࢆྵࡳࡲࡍࠋ
㸧ࡘ࠸࡚ࠊಶูࡢ㈨
⏘ཬࡧ㈇മࡢศᯒཬࡧホ౯ࢆྵࡵࠊ⊂⮬ホ౯ࠊ㚷ᐃཪࡣᰝᐃࢆ⾜ࡗ࡚࠾ࡽࡎࠊ➨୕⪅ᶵ㛵
ࡢ㚷ᐃཪࡣᰝᐃࡢ౫㢗ࡶ⾜ࡗ࡚࠾ࡾࡲࡏࢇࠋ⚄ᮾሬᩱࡢ㈈ົண
࠸࡚ࡣࠊ⚄ᮾሬᩱࡢ⤒Ⴀ㝕ࡼࡾ⌧Ⅼ࡛ᚓࡽࢀࡿ᭱ၿࡢண
ࡑࡢᑗ᮶㛵ࡍࡿሗࡘ
ุ᩿ᇶ࡙ࡁྜ⌮ⓗ᳨ウཪ
ࡣసᡂࡉࢀࡓࡇࢆ๓ᥦࡋ࡚࠾ࡾࡲࡍࠋ୕⳻㹓㹄㹈㖟⾜㈈ົ㛤Ⓨᐊࡢ⟬ᐃࡣ ���� ᖺ �� ᭶㸳
᪥ࡲ࡛୕⳻㹓㹄㹈㖟⾜㈈ົ㛤Ⓨᐊࡀධᡭࡋࡓሗཬࡧ⤒῭᮲௳ࢆᫎࡋࡓࡶࡢ࡛ࡍࠋ࡞࠾ࠊ
୕⳻㹓㹄㹈㖟⾜㈈ົ㛤Ⓨᐊࡢ⟬ᐃࡣࠊ᪥ᮏሬᩱࡢྲྀ⥾ᙺࡀᮏᰴᘧẚ⋡ࢆ᳨ウࡍࡿࡓࡵ
ࡢཧ⪃㈨ࡍࡿࡇࢆ၏୍ࡢ┠ⓗࡋ࡚࠾ࡾࠊᮏᰴᘧẚ⋡ࡢබṇᛶࡘ࠸࡚ពぢࢆ⾲᫂ࡍ
ࡿࡶࡢ࡛ࡣ࠶ࡾࡲࡏࢇࠋ࡞࠾ࠊ୕⳻㹓㹄㹈㖟⾜㈈ົ㛤Ⓨᐊࡀ㹂㹁㹄ศᯒࡼࡿ⟬ᐃࡢ᰿ᣐࡋ
ࡓ⚄ᮾሬᩱࡢ㈈ົண
ࡘ࠸࡚ࠊᑐ๓ᖺᗘẚ㍑࠾࠸࡚┈ཪࡣࣇ࣮࣭ࣜ࢟ࣕࢵࢩ࣭ࣗࣇ࣮ࣟ
ࡢᖜ࡞ቑῶࢆぢ㎸ࢇ࡛࠸ࡿᴗᖺᗘࡀྵࡲࢀ࡚࠾ࡾࡲࡍࠋලయⓗࡣࠊ⚄ᮾሬᩱࡣࠊཎᮦᩱ
౯᱁➼ࡢ㧗㦐ࡼࡿ㈍౯᱁ࡢᘬࡁୖࡆࠊ✚ᴟⓗ࡞᪂つ㛤Ⓨᣑ㈍ࡢᐇ⌧ࠊᴗົຠ⋡ᨵၿక
࠺┈⋡ࡢྥୖࠊୖമᶒࡢᅇᮇ㛫▷⦰ࡢྲྀࡾ⤌ࡳࡼࡾࠊ���� ᖺ㸱᭶ᮇཬࡧ ���� ᖺ㸱
᭶ᮇ࠾ࡅࡿႠᴗ┈ࠊ୪ࡧ ���� ᖺ㸱᭶ᮇ࠾ࡅࡿࣇ࣮࣭ࣜ࢟ࣕࢵࢩ࣭ࣗࣇ࣮ࣟࡣᖜ࡞ቑ
��
ῶࢆぢ㎸ࢇ࡛࠾ࡾࡲࡍࠋ࡞࠾ࠊᙜヱ㈈ົண
ࡣࠊᮏᰴᘧࡢᐇࢆ๓ᥦࡋ࡚࠾ࡾࡲࡏࢇࠋ�
�
㸦LL㸧㹈㹀㹋㸿ࡼࡿ⟬ᐃ�
㹈㹀㹋㸿ࡣࠊ᪥ᮏሬᩱࡘ࠸࡚ࡣࠊྠ♫ᰴᘧࡀᮾிドๆྲྀᘬᡤࣉ࣒ࣛᕷሙୖሙࡋ࡚࠾
ࡾࠊᕷሙᰴ౯ࡀᏑᅾࡍࡿࡇࡽࠊᕷሙᰴ౯ᇶ‽ἲࢆ᥇⏝ࡋ࡚⟬ᐃࢆ⾜࠸ࡲࡋࡓࠋ�
ࡲࡓࠊ⚄ᮾሬᩱࡘ࠸࡚ࡣࠊྠ♫ᰴᘧࡀᮾிドๆྲྀᘬᡤࢫࢱࣥࢲ࣮ࢻᕷሙୖሙࡋ࡚࠾ࡾࠊ
ᕷሙᰴ౯ࡀᏑᅾࡍࡿࡇࡽࠊᕷሙᰴ౯ᇶ‽ἲࢆࠊᑗ᮶ࡢᴗάືࡢ≧ἣࢆホ౯ᫎࡍࡿࡓ
ࡵ㹂㹁㹄ἲࢆ⟬ᐃᡭἲࡋ࡚⏝࠸࡚ࠊᰴᘧ౯್ࡢ⟬ᐃࢆ⾜࠸ࡲࡋࡓࠋ�
ྛホ౯᪉ἲࡼࡿ᪥ᮏሬᩱᰴᘧ㸯ᰴ࠶ࡓࡾࡢᰴᘧ౯್ࢆ㸯ࡋࡓሙྜࡢᰴᘧẚ⋡ࡢ⟬
ᐃ⤖ᯝࡣ௨ୗࡢ࠾ࡾ࡞ࡾࡲࡍࠋ�
᥇⏝ᡭἲ
᪥ᮏሬᩱ
ᕷሙᰴ౯ᇶ‽ἲ
ᰴᘧẚ⋡ࡢ⟬ᐃ⤖ᯝ�
⚄ᮾሬᩱ
ᕷሙᰴ౯ᇶ‽ἲ
������㹼�������
㹂㹁㹄ἲ
������㹼�������
࡞࠾ࠊᕷሙᰴ౯ᇶ‽ἲࡘ࠸࡚ࡣࠊ���� ᖺ �� ᭶㸳᪥ࢆ⟬ᐃᇶ‽᪥ࡋ࡚ࠊ⟬ᐃᇶ‽᪥ࡢ⤊
್ཬࡧ⟬ᐃᇶ‽᪥ࡲ࡛ࡢ㸯᭶ࠊ㸱᭶ཬࡧ㸴᭶ࡢྛᮇ㛫ࡢ⤊್༢⣧ᖹᆒ್ࢆࡑࢀࡒࢀ᥇⏝
࠸ࡓࡋࡲࡋࡓࠋ�
㹂㹁㹄ἲ࡛ࡣࠊ⚄ᮾሬᩱࡀ⌧Ⅼ࡛ྜ⌮ⓗண ྍ⬟࡞ᮇ㛫ࡲ࡛సᡂࡋࡓ ���� ᖺ㸱᭶ᮇ
ࡽ ���� ᖺ㸱᭶ᮇࡲ࡛ࡢᴗィ⏬㸦௨ୗࠊ
ࠕᮏᴗィ⏬ࠖ࠸࠸ࡲࡍ㸧࠾ࡅࡿ㈈ົண ࠊ⚄ᮾ
ሬᩱࡢ ���� ᖺ㸱᭶ᮇ➨㸯ᅄ༙ᮇ࠾ࡅࡿ㈈ົሗࠊ୍⯡බ㛤ࡉࢀࡓㅖሗࢆ๓ᥦࡋࠊ����
ᖺ㸱᭶ᮇ➨㸱ᅄ༙ᮇ௨㝆ぢ㎸ࡲࢀࡿᑗ᮶࢟ࣕࢵࢩࣗ�
࣭ࣇ࣮ࣟࢆࠊ୍ᐃࡢᘬ⋡࡛⌧ᅾ౯್
ࡾᘬࡃࡇࡼࡗ࡚ᴗ౯್ࡸᰴᘧ౯್ࢆホ౯ࡋ࡚࠾ࡾࡲࡍࠋ࡞࠾ࠊᮏᰴᘧࡼࡾᐇ⌧
ࡍࡿࡇࡀᮇᚅ࡛ࡁࡿࢩࢼࢪ࣮ຠᯝࡣ⌧Ⅼලయⓗぢ✚ࡶࡿࡇࡀᅔ㞴࡛࠶ࡿࡓࡵࠊᙜヱ
㈈ົண ࡣࠊᙜヱࢩࢼࢪ࣮ຠᯝࢆ⧊ࡾ㎸ࢇ࡛࠸࡞࠸⚄ᮾሬᩱ༢⊂ࡢィ⏬ࢆ๓ᥦࡋ࡚సᡂࡋ࡚
࠾ࡾࡲࡍࠋ㹂㹁㹄ἲ࠾ࡅࡿ⥅⥆౯್ࡢ⟬ᐃࡘ࠸࡚ࡣࠊỌஂᡂ㛗ἲࢆ᥇⏝ࡋ࡚࠾ࡾࡲࡍࠋල
యⓗࡣࠊᘬ⋡ࡣຍ㔜ᖹᆒ㈨ᮏࢥࢫࢺࢆ᥇⏝ࡋࠊ����㸣㹼����㸣ࢆ⏝ࡋ࡚࠾ࡾࡲࡍࠋࡲࡓࠊ
⥅⥆౯್ࡢ⟬ᐃ࠶ࡓࡗ࡚ࡣᐃ⋡ᡂ㛗ࣔࢹࣝࢆ᥇⏝ࡋ࡚࠾ࡾࠊእ㒊⎔ቃ➼ࢆ⥲ྜⓗ຺ࡋ࡚
Ọஂᡂ㛗⋡ࢆ����ڸ㸣㹼����㸣ࡋࡓୖ࡛ࠊ⥅⥆౯್ࢆ ����� ⓒ㹼����� ⓒ⟬ᐃࡋ
࡚࠾ࡾࡲࡍࠋ࡞࠾ࠊᚲせ㐠㌿㈨㔠㸦⚄ᮾሬᩱ࠾ࡅࡿ㐣ཤࡢ㈨㔠⧞ࡾᐇ⦼➼ࢆ⥲ྜⓗ⪃៖ࡋ
⟬ฟࡋ࡚࠾ࡾࡲࡍࠋ㸧ࢆ᥍㝖ࡋࡓవ⌧㡸㔠ࠊ୍㒊ࡢ᭷౯ドๆ➼ࢆࠊᰴᘧ౯್⟬ᐃ㔜せ࡞ᙳ
㡪ࢆཬࡰࡍ㠀ᴗ⏝㈨⏘ࡋ࡚ィୖࡋ࡚࠾ࡾࡲࡍࠋ�
ᮏᴗィ⏬ࡣࠊᮏᰴᘧࡢ᳨ウ࠶ࡓࡗ࡚⚄ᮾሬᩱࡀసᡂࡋࡓࡶࡢ࡛ࡍࠋᮏᴗィ⏬ࡣࠊ
���� ᖺ㸱᭶ᮇ➨㸰ᅄ༙ᮇࡲ࡛ࡢᴗ⦼ࢆ຺ࡋࡓୖ࡛ࠊᚋࡢᴗᡂ㛗ᚲせ࡞ᴗᢞ㈨ࢆຍ
ࡋ࡚┈ண ࡸᢞ㈨ィ⏬ࢆసᡂࡋࡓࡶࡢ࡛࠶ࡾࠊලయⓗ࡞㈈ົண ࡢసᡂ㐣⛬࠾࠸࡚᪥
ᮏሬᩱࡀ㛵ࡋࡓᐇࡣࡈࡊ࠸ࡲࡏࢇࠋࡲࡓࠊᮏᴗィ⏬ࡘ࠸࡚ࡣࠊୗグࠕ
㸦㸲㸧බṇᛶࢆᢸ
ಖࡍࡿࡓࡵࡢᥐ⨨㸦┈┦ࢆᅇ㑊ࡍࡿࡓࡵࡢᥐ⨨ࢆྵࡴࠋ
㸧
ࠖࡢࠕճ⚄ᮾሬᩱ࠾ࡅࡿᐖ㛵
ಀࢆ᭷ࡋ࡞࠸⊂❧ᙺဨጤဨࡢㅎၥཬࡧ⟅⏦᭩ࡢྲྀᚓࠖグ㍕ࡢ࠾ࡾࠊᮏ⊂❧ᙺဨጤဨ
ࡀࠊࡑࡢෆᐜཬࡧసᡂ⤒⦋㸦ᮏᴗィ⏬ࡢෆᐜࡢಟṇཬࡧᙜヱಟṇࡢ⤒⦋ࢆྵࡳࡲࡍࠋ௨ୗྠ
���
ࡌ࡛ࡍࠋ㸧ࢆ☜ㄆࡢୖࠊᢎㄆࡋ࡚࠾ࡾࡲࡍࠋ�
࡞࠾ࠊ㹈㹀㹋㸿ࡀ㹂㹁㹄ἲ࡛⟬ᐃࡢ๓ᥦࡋࡓ⚄ᮾሬᩱࡢ㈈ົண
ࡣ௨ୗࡢ࠾ࡾ࡛࠶ࡾࠊ
ᙜヱ㈈ົண ࠾࠸࡚ࡣࠊᖜ࡞ቑῶ┈ཬࡧࣇ࣮࣭ࣜ࢟ࣕࢵࢩ࣭ࣗࣇ࣮ࣟࡢᖜ࡞ቑῶࡀぢ㎸
ࡲࢀࡿᴗᖺᗘࡀྵࡲࢀ࡚࠾ࡾࡲࡍࠋලయⓗࡣࠊ⚄ᮾሬᩱࡣࠊཎᮦᩱ౯᱁➼ࡢ㧗㦐ࡼࡿ㈍
౯᱁ࡢᘬࡁୖࡆࠊ✚ᴟⓗ࡞᪂つ㛤Ⓨᣑ㈍ࡢᐇ⌧ࠊᴗົຠ⋡ᨵၿక࠺┈⋡ࡢྥୖࠊ┤㏆
ࡢୖമᶒࡢᅇᮇ㛫▷⦰ࡢྲྀࡾ⤌ࡳཬࡧᅾᗜỈ‽ࡢ㐺ṇࡼࡾࠊ
���� ᖺ㸱᭶ᮇཬࡧ ����
ᖺ㸱᭶ᮇ࠾ࡅࡿႠᴗ┈ࠊ୪ࡧ ���� ᖺ㸱᭶ᮇ࠾ࡅࡿࣇ࣮࣭ࣜ࢟ࣕࢵࢩ࣭ࣗࣇ࣮ࣟࡀ๓
ᮇẚ࡛ ��㸣௨ୖቑຍࡍࡿࡇࢆぢ㎸ࢇ࡛࠾ࡾࡲࡍࠋࡲࡓࠊୖമᶒࡢᅇᮇ㛫▷⦰ࡢྲྀࡾ⤌
ࡳཬࡧᅾᗜỈ‽ࡢ㐺ṇࡢᐃ╔క࠸ࠊ���� ᖺ㸱᭶ᮇ࠾ࡅࡿࣇ࣮࣭ࣜ࢟ࣕࢵࢩ࣭ࣗࣇ࣮ࣟࡀ
๓ᮇẚ࡛ ��㸣௨ୖῶᑡࡍࡿࡇࢆぢ㎸ࢇ࡛࠾ࡾࡲࡍࠋ�
�
���� ᖺ㸱᭶ᮇ�
ୖ㧗�
���� ᖺ㸱᭶ᮇ�
���� ᖺ㸱᭶ᮇ�
�������
�������
�������
����
����
����
㹃㹀㹇㹒㹂㸿�
������
������
������
ࣇ࣮࣭ࣜ࢟ࣕࢵࢩ࣭ࣗࣇ
������
����
����
Ⴀᴗ┈�
࣮ࣟ�
�
㹈㹀㹋㸿ࡣࠊୖグᰴᘧẚ⋡ࡢ⟬ᐃ㝿ࡋ࡚ࠊබ㛤ሗཬࡧ㹈㹀㹋㸿ᥦ౪ࡉࢀࡓሗ➼
ࢆཎ๎ࡋ࡚ࡑࡢࡲࡲ᥇⏝ࡋࠊࡑࢀࡽࡢ㈨ᩱཬࡧሗ➼ࡀࠊ࡚ṇ☜ࡘ࡞ࡶࡢ࡛࠶ࡿࡇ
ࢆ๓ᥦࡋ࡚࠾ࡾࠊ⊂⮬ࡑࢀࡽࡢṇ☜ᛶཬࡧᛶࡢ᳨ドࢆ⾜ࡗ࡚࠾ࡽࡎࠊࡲࡓࡑࡢ⩏ົ
ࢆ㈇࠺ࡶࡢ࡛ࡣ࠶ࡾࡲࡏࢇࠋࡲࡓࠊ㹈㹀㹋㸿ࡣ୧♫ཬࡧࡑࡢ㛵ಀ♫ࡢ㈨⏘ཬࡧ㈇മ㸦ࢹࣜࣂ
ࢸࣈྲྀᘬࠊ⡙እ㈨⏘ཬࡧ㈇മࠊࡑࡢഅⓎമົࢆྵࡳࡲࡍࠋ㸧㛵ࡋ࡚⊂⮬ࡢホ౯㺃ᰝᐃࢆ⾜
ࡗ࡚࠾ࡽࡎࠊ➨୕⪅ᶵ㛵ࡢ㚷ᐃཪࡣᰝᐃࡢ౫㢗ࡶ⾜ࡗ࡚࠾ࡾࡲࡏࢇࠋ㹈㹀㹋㸿ࡣࠊ⚄ᮾሬᩱ
ࡽᥦ౪ࡉࢀࡓᴗィ⏬ࠊ㈈ົண
Ⅼ࡛ྍ⬟࡞᭱ၿࡢண
ࡑࡢᑗ᮶㛵ࡍࡿሗࡀࠊ⚄ᮾሬᩱࡢ⤒Ⴀ㝕ࡼࡿ⌧
ཬࡧุ᩿ᇶ࡙ࡁࠊྜ⌮ⓗసᡂࡉࢀࡓࡇࢆ๓ᥦࡋ࡚࠾ࡾࡲࡍࠋ㹈
㹀㹋㸿ࡣࠊ⚄ᮾሬᩱࡢᴗィ⏬ࡢṇ☜ᛶࠊጇᙜᛶཬࡧᐇ⌧ྍ⬟ᛶࡘ࠸࡚⊂⮬᳨ドࡍࡿࡇ
࡞ࡃࡇࢀࡽࡢሗ౫ᣐࡋ࡚࠾ࡾࡲࡍࠋ㹈㹀㹋㸿ࡢᰴᘧẚ⋡ࡢ⟬ᐃࡣࠊ���� ᖺ �� ᭶㸳᪥
ࡲ࡛㹈㹀㹋㸿ࡀධᡭࡋࡓሗཬࡧ⤒῭᮲௳ࢆᫎࡋࡓࡶࡢ࡛ࡍࠋ࡞࠾ࠊ㹈㹀㹋㸿ࡢ⟬ᐃࡣࠊ
⚄ᮾሬᩱࡢྲྀ⥾ᙺࡀᰴᘧẚ⋡ࢆ᳨ウࡍࡿࡓࡵࡢཧ⪃㈨ࡍࡿࡇࢆ၏୍ࡢ┠ⓗࡋ࡚࠾
ࡾࡲࡍࠋ�
�
㸱 ୖሙᗫṆ࡞ࡿぢ㎸ࡳཬࡧࡑࡢ⏤�
ᮏᰴᘧࡼࡾࠊࡑࡢຠຊⓎ⏕᪥㸦���� ᖺ㸰᭶ �� ᪥㸦ணᐃ㸧㸧ࢆࡶࡗ࡚ࠊ⚄ᮾሬᩱࡣ᪥ᮏ
ሬᩱࡢᏊ♫࡞ࡾࠊ⚄ᮾሬᩱᰴᘧࡣ ���� ᖺ㸰᭶ �� ᪥࡛ୖሙᗫṆ㸦᭱⤊㈙᪥ࡣ ���� ᖺ
㸰᭶ �� ᪥㸧࡞ࡿணᐃ࡛ࡍࠋୖሙᗫṆᚋࡣࠊ⚄ᮾሬᩱᰴᘧࢆᮾிドๆྲྀᘬᡤࢫࢱࣥࢲ࣮ࢻᕷሙ
࠾࠸࡚ྲྀᘬࢆࡍࡿࡇࡀ࡛ࡁ࡞ࡃ࡞ࡾࡲࡍࠋ�
⚄ᮾሬᩱᰴᘧࡀୖሙᗫṆ࡞ࡗࡓᚋࡶࠊᮏᰴᘧࡼࡾ⚄ᮾሬᩱࡢᰴࡢⓙᵝࡾᙜ࡚ࡽ
ࢀࡿ᪥ᮏሬᩱᰴᘧࡣᮾிドๆྲྀᘬᡤࣉ࣒ࣛᕷሙୖሙࡋ࡚࠾ࡾࠊᮏᰴᘧࡢຠຊⓎ⏕᪥௨
���
ᚋࡶ㔠⼥ၟရྲྀᘬᡤᕷሙ࡛ࡢྲྀᘬࡀྍ⬟࡛࠶ࡿࡇࡽࠊᇶ‽࠾࠸࡚⚄ᮾሬᩱᰴᘧࢆ �����
ᰴ௨ୖಖ᭷ࡋࠊᮏᰴᘧࡼࡾ᪥ᮏሬᩱᰴᘧࡢ༢ඖᰴᘧᩘ࡛࠶ࡿ ��� ᰴ௨ୖࡢ᪥ᮏሬᩱᰴ
ᘧࡢᙜ࡚ࢆཷࡅࡿ⚄ᮾሬᩱࡢᰴࡢⓙᵝᑐࡋ࡚ࡣࠊᘬࡁ⥆ࡁᰴᘧࡢὶືᛶࢆᥦ౪࡛ࡁࡿࡶࡢ
⪃࠼࡚࠾ࡾࡲࡍࠋ�
᪉ࠊᇶ‽࠾࠸࡚ࠊ����� ᰴᮍ‶ࡢ⚄ᮾሬᩱᰴᘧࢆಖ᭷ࡍࡿ⚄ᮾሬᩱࡢᰴࡢⓙᵝࡣࠊ
᪥ᮏሬᩱᰴᘧࡢ༢ඖᰴᘧᩘ࡛࠶ࡿ ��� ᰴ‶ࡓ࡞࠸᪥ᮏሬᩱᰴᘧࡀࡾᙜ࡚ࡽࢀࡲࡍࠋ�
ࡑࡢࡼ࠺࡞༢ඖᮍ‶ᰴᘧࢆ㔠⼥ၟရྲྀᘬᡤᕷሙ࠾࠸࡚༷ࡍࡿࡇࡣ࡛ࡁࡲࡏࢇࡀࠊ༢ඖᮍ
‶ᰴᘧࢆಖ᭷ࡍࡿࡇ࡞ࡿᰴࡢⓙᵝࡣࠊ᪥ᮏሬᩱᑐࡋࠊࡑࡢಖ᭷ࡍࡿ༢ඖᮍ‶ᰴᘧࢆ㈙
࠸ྲྀࡿࡇࢆㄳồࡍࡿࡇࡀྍ⬟࡛ࡍࠋヲ⣽ࡘ࠸࡚ࡣࠊୖグ㸰�㸦㸱㸧ࠕᮏᰴᘧಀࡿᙜ
࡚ࡢෆᐜࠖ
㸦ὀ㸱㸧
ࠕ༢ඖᮍ‶ᰴᘧࡢྲྀᢅ࠸ࠖࢆࡈཧ↷ࡃࡔࡉ࠸ࠋࡲࡓࠊᮏᰴᘧక࠸㸯ᰴ‶
ࡓ࡞࠸➃ᩘࡀ⏕ࡌࡓሙྜ࠾ࡅࡿ➃ᩘࡢྲྀᢅ࠸ࡢヲ⣽ࡘ࠸࡚ࡣࠊୖグ㸰�㸦㸱㸧ࠕᮏᰴᘧ
ಀࡿᙜ࡚ࡢෆᐜࠖ
㸦ὀ㸲㸧
�
ࠕ㸯ᰴ‶ࡓ࡞࠸➃ᩘࡢྲྀᢅ࠸ࠖࢆࡈཧ↷ࡃࡔࡉ࠸ࠋ࡞࠾ࠊ᪥ᮏሬᩱ
�
ࡣࠊ༢ඖᮍ‶ᰴᘧࡘ࠸࡚ࠊᰴࡢⓙᵝ࠾ࡅࡿ㈙ቑ㟂せ୪ࡧ᪥ᮏሬᩱ⏕ࡌ࠺ࡿᰴᘧົ
ཬࡧ⟶⌮ࢥࢫࢺ➼ࡢࢆ⪃៖ࡢୖࠊᚋࠊ♫ἲ➨ ��� ᮲ᐃࡵࡿ༢ඖᮍ‶ᰴᘧࡢΏㄳồࢆ
ᑟධࡍࡿྰࡘ࠸᳨࡚ウࡍࡿணᐃ࡛ࡍࠋ�
⚄ᮾሬᩱࡢᰴࡢⓙᵝࡣࠊ᭱⤊㈙᪥࡛࠶ࡿ ���� ᖺ㸰᭶ �� ᪥㸦ணᐃ㸧ࡲ࡛ࡣࠊᮾிドๆྲྀᘬ
ᡤࢫࢱࣥࢲ࣮ࢻᕷሙ࠾࠸࡚ࠊࡑࡢಖ᭷ࡍࡿ⚄ᮾሬᩱᰴᘧࢆᚑ᮶࠾ࡾྲྀᘬࡍࡿࡇࡀ࡛ࡁࡿࠊ
ᇶ‽ࡲ࡛♫ἲࡑࡢ㛵ಀἲ௧ᐃࡵࡿ㐺ἲ࡞ᶒࢆ⾜ࡍࡿࡇࡀ࡛ࡁࡲࡍࠋ�
�
㸲 බṇᛶࢆᢸಖࡍࡿࡓࡵࡢᥐ⨨㸦┈┦ࢆᅇ㑊ࡍࡿࡓࡵࡢᥐ⨨ࢆྵࡴࠋ㸧�
୧♫ࡣࠊ᪥ᮏሬᩱࡀ᪤⚄ᮾሬᩱᰴᘧ ���������� ᰴ㸦���� ᖺ㸱᭶ �� ᪥⌧ᅾࡢⓎ⾜῭ᰴᘧᩘ
㸦���������� ᰴ㸧ࡽ⚄ᮾሬᩱࡢ⮬ᕫᰴᘧᩘ㸦������ ᰴ㸧ࢆ᥍㝖ࡋࡓᰴᘧᩘ㸦���������� ᰴ㸧
༨ࡵࡿྜ࡚ �����㸣㸧ࢆಖ᭷ࡋࠊ⚄ᮾሬᩱࡀ᪥ᮏሬᩱࡢ㐃⤖Ꮚ♫ヱᙜࡍࡿࡇࡽࠊᮏ
ᰴᘧ㝿ࡋ࡚ࡣࠊ┈┦ࢆᅇ㑊ࡋ࡚බṇᛶࢆᢸಖࡍࡿᚲせࡀ࠶ࡿุ᩿ࡋࠊ௨ୗࡢ࠾ࡾ
බṇᛶࢆᢸಖࡍࡿࡓࡵࡢᥐ⨨㸦┈┦ࢆᅇ㑊ࡍࡿࡓࡵࡢᥐ⨨ࢆྵࡳࡲࡍࠋ
㸧ࢆᐇࡋ࡚࠾ࡾࡲࡍࠋ
�
�
ձ
⊂❧ࡋࡓ➨୕⪅⟬ᐃᶵ㛵ࡽࡢ⟬ᐃ᭩ࡢྲྀᚓ�
᪥ᮏሬᩱཬࡧ⚄ᮾሬᩱࡣࠊᮏᰴᘧ࠾ࡅࡿᰴᘧẚ⋡ࡢ⟬ᐃᙜࡓࡗ࡚බṇᛶࢆᮇࡍ
ࡓࡵࠊ᪥ᮏሬᩱࡣࠊ᪥ᮏሬᩱཬࡧ⚄ᮾሬᩱࡽ⊂❧ࡋࡓ➨୕⪅⟬ᐃᶵ㛵࡛࠶ࡿ୕⳻㹓㹄㹈㖟
⾜㈈ົ㛤Ⓨᐊࢆ㑅ᐃࡋࠊ���� ᖺ �� ᭶㸳᪥࡛ࠊᰴᘧẚ⋡㛵ࡍࡿ⟬ᐃ᭩ࢆྲྀᚓࡋࠊࡲࡓࠊ⚄
ᮾሬᩱࡣࠊ᪥ᮏሬᩱཬࡧ⚄ᮾሬᩱࡽ⊂❧ࡋࡓ➨୕⪅⟬ᐃᶵ㛵࡛࠶ࡿ㹈㹀㹋㸿ࢆ㑅ᐃࡋࠊ����
ᖺ �� ᭶㸳᪥࡛ࠊᰴᘧẚ⋡㛵ࡍࡿ⟬ᐃ᭩ࢆྲྀᚓ࠸ࡓࡋࡲࡋࡓࠋ�
ྛ⟬ᐃ᭩ࡢᴫせࡣୖグ㸦㸰㸧ࠕ⟬ᐃ㛵ࡍࡿ㡯ࠖࢆࡈཧ↷ࡃࡔࡉ࠸ࠋ�
࡞࠾ࠊ୧♫ࡣࠊ࠸ࡎࢀࡶྛ➨୕⪅⟬ᐃᶵ㛵ࡽࠊᮏᰴᘧࡢᰴᘧẚ⋡ࡀ᪥ᮏሬᩱཪࡣ
⚄ᮾሬᩱࡢᰴࡗ࡚㈈ົⓗぢᆅࡼࡾබṇ࡛࠶ࡿ᪨ࡢពぢ᭩㸦ࣇ࢙ࢿࢫ࣭࢜ࣆࢽ࢜ࣥ㸧ࢆྲྀ
ᚓࡋ࡚࠾ࡾࡲࡏࢇࠋ�
�
ղ
⊂❧ࡋࡓἲᚊົᡤࡽࡢຓゝ�
���
᪥ᮏሬᩱࡣࠊᮏᰴᘧ㛵ࡍࡿἲົࢻࣂࢨ࣮ࡋ࡚ࠊࣥࢲ࣮ࢯ࣭ࣥẟ࣭ᖖἲᚊ
ົᡤࢆ ���� ᖺ㸵᭶㑅௵ࡋࠊᮏᰴᘧࡢㅖᡭ⥆ཬࡧྲྀ⥾ᙺࡢពᛮỴᐃࡢ᪉ἲ࣭㐣⛬➼ࡘ࠸
࡚ἲⓗ࡞ほⅬࡽຓゝࢆᚓ࡚࠾ࡾࡲࡍࠋ࡞࠾ࠊࣥࢲ࣮ࢯ࣭ࣥẟ࣭ᖖἲᚊົᡤࡣࠊ᪥ᮏሬ
ᩱཬࡧ⚄ᮾሬᩱࡢ㛵㐃ᙜ⪅ࡣヱᙜࡏࡎࠊᮏᰴᘧ㛵ࡋ࡚㔜せ࡞ᐖ㛵ಀࢆ᭷ࡋࡲࡏࢇࠋ�
᪉ࠊ⚄ᮾሬᩱࡣࠊᮏᰴᘧ㛵ࡍࡿἲົࢻࣂࢨ࣮ࡋ࡚ࠊỤᶫἲᚊົᡤࢆ ���� ᖺ
㸶᭶㑅௵ࡋࠊᮏᰴᘧࡢㅖᡭ⥆ཬࡧྲྀ⥾ᙺࡢពᛮỴᐃࡢ᪉ἲ࣭㐣⛬➼ࡘ࠸࡚ἲⓗ࡞ほⅬ
ࡽຓゝࢆᚓ࡚࠾ࡾࡲࡍࠋ࡞࠾ࠊỤᶫἲᚊົᡤࡣࠊ᪥ᮏሬᩱཬࡧ⚄ᮾሬᩱࡢ㛵㐃ᙜ⪅
ࡣヱᙜࡏࡎࠊᮏᰴᘧ㛵ࡋ࡚㔜せ࡞ᐖ㛵ಀࢆ᭷ࡋࡲࡏࢇࠋ�
�
ճ
⚄ᮾሬᩱ࠾ࡅࡿᐖ㛵ಀࢆ᭷ࡋ࡞࠸⊂❧ᙺဨጤဨࡢㅎၥཬࡧ⟅⏦᭩ࡢྲྀᚓ�
㸦ϸ㸧ㅎၥ➼ࡢ⤒⦋��
⚄ᮾሬᩱࡣࠊ���� ᖺ㸵᭶ �� ᪥ࠊ᪥ᮏሬᩱࡽᮏᥦࢆཷࡅࠊᮏᰴᘧ㛵ࡍࡿලయⓗ࡞
᳨ウࢆ㛤ጞࡍࡿ㝿ࡋࠊྲྀ⥾ᙺ࠾࠸࡚ࠊᮏᰴᘧࡢ㠀ࢆᑂ㆟ཬࡧỴ㆟ࡍࡿඛ❧ࡗ࡚ࠊ
ᮏᰴᘧಀࡿྲྀ⥾ᙺࡢពᛮỴᐃៅ㔜ࢆᮇࡋࠊࡲࡓࠊྲྀ⥾ᙺࡢពᛮỴᐃ㐣⛬࠾ࡅࡿ
ពᛶཬࡧ┈┦ࡢ࠾ࡑࢀࢆ㝖ࡋࠊࡑࡢබṇᛶࢆᢸಖࡍࡿࡶࠊྲྀ⥾ᙺ࠾࠸࡚ᮏ
ᰴᘧࢆ⾜࠺᪨ࡢỴᐃࢆࡍࡿࡇࡀ⚄ᮾሬᩱࡢ୍⯡ᰴࡗ࡚බṇ࡞ࡶࡢ࡛࠶ࡿ࠸࠼ࡿ
࠺ࡘ࠸࡚ࡢពぢࢆྲྀᚓࡍࡿࡇࢆ┠ⓗࡋ࡚ࠊ���� ᖺ㸶᭶ �� ᪥㛤ദࡢ⚄ᮾሬᩱࡢྲྀ
⥾ᙺỴ㆟ࡼࡾࠊ᪥ᮏሬᩱཬࡧᮏᰴᘧࡢᡂྰࡽ⊂❧ࡋࡓᶔᑿᙪẶ㸦⚄ᮾሬᩱ♫እ
ྲྀ⥾ᙺව⊂❧ᙺဨ㸧
ࠊ▮ᫀᏊẶ㸦⚄ᮾሬᩱ♫እྲྀ⥾ᙺව⊂❧ᙺဨ㸧ࠊ᪥₲୍㑻Ặ㸦⚄ᮾሬᩱ♫
እ┘ᰝᙺව⊂❧ᙺဨ㸧ࠊ᱔ᒣ❶ྖẶ㸦⚄ᮾሬᩱ♫እ┘ᰝᙺව⊂❧ᙺဨ㸧ࡢ㸲ྡࡼࡾᵓᡂࡉࢀࡿ
ᮏ⊂❧ᙺဨጤဨࢆᮏᰴᘧಀࡿㅎၥᶵ㛵⨨ࡅࠊᮏ⊂❧ᙺဨጤဨᑐࡋࠊ
㸦㹟㸧ᮏ
ᰴᘧࡢ┠ⓗࡢྜ⌮ᛶ㸦ᮏᰴᘧࡀ⚄ᮾሬᩱࡢᴗ౯್ྥୖ㈨ࡍࡿࢆྵࡳࡲࡍࠋ㸧
ࠊ
㸦㹠㸧
ᮏᰴᘧࡢྲྀᘬ᮲௳㸦ᮏᰴᘧಀࡿẚ⋡ࡀබṇ࡞ࡶࡢ࡞ࡗ࡚࠸ࡿࢆྵࡳࡲࡍࠋ
㸧
ࡢබṇᛶ࣭ጇᙜᛶࠊ
㸦㹡㸧ᮏᰴᘧࡢᡭ⥆ࡢබṇᛶࠊ
㸦㹢㸧ୖグ㸦㹟㸧ࡽ㸦㹡㸧ࢆ㋃ࡲ࠼ࠊᮏ
ᰴᘧࡀ୍⯡ᰴࡗ࡚බṇ࡛࠶ࡿ㸦௨ୗࠕᮏㅎၥ㡯ࠖ࠸࠸ࡲࡍࠋ
㸧ࡘ࠸࡚ㅎၥࡋࠊ
ࡇࢀࡽࡢⅬࡘ࠸࡚ࡢ⟅⏦᭩ࢆ⚄ᮾሬᩱྲྀ⥾ᙺᥦฟࡍࡿࡇࢆጤკࡋࡲࡋࡓࠋ࡞࠾ࠊᮏ⊂
❧ᙺဨጤဨࡣࠊ⚄ᮾሬᩱࡀ᪥ᮏሬᩱࡢ㐃⤖Ꮚ♫࡞ࡗࡓక࠸ࠊ���� ᖺ㸳᭶ �� ᪥ࡢ
⚄ᮾሬᩱྲྀ⥾ᙺỴ㆟ᇶ࡙ࡁタ⨨ࡉࢀࡓᖖタࡢᶵ㛵࡛ࡍࠋ⚄ᮾሬᩱࡋ࡚ࡣࠊᮏ⊂❧ᙺဨጤ
ဨࡀࠊ᪥ᮏሬᩱཬࡧࡑࡢࢢ࣮ࣝࣉ♫⚄ᮾሬᩱᑡᩘᰴࡢ㛫┈┦ࡀ⏕ࡌࡿྍ⬟ᛶ
ࡀ࠶ࡿ㔜せ࡞ྲྀᘬ࣭⾜Ⅽࡘ࠸࡚ࠊᑡᩘᰴಖㆤࡢほⅬࡽᑂ㆟᳨࣭ウࢆ⾜࠺ࡇࢆ┠ⓗࡍ
ࡿᶵ㛵࡛࠶ࡿࡇ➼ࡽࠊᮏᰴᘧࡘ࠸࡚ࡶᮏ⊂❧ᙺဨጤဨㅎၥࡍࡿࡇࡀ㐺ษ࡛࠶
ࡿุ᩿ࡋࡲࡋࡓࠋ�
ࡲࡓࠊᮏ⊂❧ᙺဨጤဨࡢጤဨࡢ㑅ࡼࡾᮏ⊂❧ᙺဨጤဨࡢጤဨ㛗ࡋ࡚ᶔᑿᙪẶࡀ
㑅ᐃࡉࢀࡲࡋࡓࠋ࡞࠾ࠊᮏ⊂❧ᙺဨጤဨࡢጤဨࡢሗ㓘ࡣࠊᮏᰴᘧࡢᡂྰཬࡧ⟅⏦ෆᐜ
ࢃࡽࡎᨭᡶࢃࢀࡿᅛᐃሗ㓘ࡢࡳ࡛࠶ࡾࠊᮏᰴᘧࡢᡂ❧➼ࢆ᮲௳ᨭᡶࢃࢀࡿᡂຌሗ㓘
ࡣྵࡲࢀ࡚࠾ࡾࡲࡏࢇࠋ��
ຍ࠼࡚ࠊ⚄ᮾሬᩱࡣࠊ⚄ᮾሬᩱྲྀ⥾ᙺ࠾࠸࡚ࠊᮏᰴᘧ㛵ࡍࡿពᛮỴᐃࢆ⾜࠺㝿
ࡋ࡚ࠊ⟅⏦᭩㸦௨ୗࠕᮏ⟅⏦᭩ࠖ࠸࠺ࠋ㸧࠾࠸࡚♧ࡉࢀࡓᮏ⊂❧ᙺဨጤဨࡢពぢࢆ᭱㝈
���
ᑛ㔜ࡍࡿࡶࡢࡋࠊᮏ⊂❧ᙺဨጤဨࡀᮏᰴᘧࡢᐇཪࡣྲྀᘬ᮲௳ࢆጇᙜ࡛࡞࠸ุ᩿ࡋ
ࡓሙྜࡣࠊ⚄ᮾሬᩱྲྀ⥾ᙺࡣࠊᮏᰴᘧ㈶ྠࡋ࡞࠸ࡶࡢࡍࡿ᪨ࢆỴ㆟ࡋ࡚࠾ࡾࡲࡍࠋ��
࠶ࢃࡏ࡚ࠊ⚄ᮾሬᩱࡣࠊᮏ⊂❧ᙺဨጤဨᑐࡋ࡚ࠊ
㸦㸧⚄ᮾሬᩱࡢᙺ⫋ဨࡽࠊᮏᰴᘧ
ࡢ᳨ウཬࡧุ᩿ᚲせ࡞ሗࢆཷ㡿ࡍࡿᶒ㝈㸦ᮏ⊂❧ᙺဨጤဨࡢฟᖍࢆせồࡍࡿᶒ㝈ࢆ
ྵࡳࡲࡍࠋ
㸧ࠊ
㸦㸧ᮏᰴᘧࡢྲྀᘬ᮲௳ཬࡧ΅㐣⛬ᐇ㉁ⓗ㛵ࡍࡿᶒ㝈㸦⚄ᮾሬᩱᑐ
ࡋ࡚ពぢࢆ㏙ཪࡣᣦ♧ⱝࡋࡃࡣせㄳࢆ⾜࠺ࡇཬࡧᮏ⊂❧ᙺဨጤဨ⮬ࡽ᪥ᮏሬᩱ΅
ࢆ⾜࠺ࡇࢆྵࡳࡲࡍࠋ
㸧ࠊ
㸦࢘㸧⚄ᮾሬᩱࡀ㑅௵ࡋࡓ⚄ᮾሬᩱࡢእ㒊ᑓ㛛ᐙࢻࣂࢨ࣮ࢆᢎㄆ
㸦㏣ㄆࢆྵࡳࡲࡍࠋ
㸧ࡍࡿᶒ㝈ࠊ
㸦࢚㸧⚄ᮾሬᩱࡢ㈝⏝㈇ᢸ࠾࠸࡚ࠊ⚄ᮾሬᩱࡢእ㒊ᑓ㛛ᐙ
ࢻࣂࢨ࣮ຓゝࢆồࡵࡿᶒ㝈ࠊ
㸦࢜㸧⚄ᮾሬᩱࡢ㈝⏝㈇ᢸ࠾࠸࡚ࠊᚲせᛂࡌࠊ⮬ࡽࡢእ㒊
ᑓ㛛ᐙࢻࣂࢨ࣮ࢆ㑅௵ࡋࠊຓゝࢆồࡵࡿᶒ㝈ࠊ
㸦࢝㸧ࡑࡢࠊᮏ⊂❧ᙺဨጤဨࡢ⫋ົࢆ⿵
ຓࡍࡿ⪅ࡢᢎㄆ➼ࠊᮏ⊂❧ᙺဨጤဨࡀᮏᰴᘧ㛵ࡍࡿ᳨ウཬࡧุ᩿㝿ࡋ࡚ᚲせㄆࡵ
ࡿ㡯ࡘ࠸࡚ࡢᶒ㝈ࢆࡍࡿࡇࢆỴ㆟ࡋ࡚࠾ࡾࡲࡍࠋ�
�
㸦Ϲ㸧᳨ウࡢ⤒⦋�
ᮏ⊂❧ᙺဨጤဨࡣࠊ���� ᖺ㸷᭶㸰᪥ࡽ ���� ᖺ �� ᭶㸳᪥ࡲ࡛ࠊྜィ �� ᅇࢃࡓࡗ࡚
㛤ദࡋࡓࠊሗ㞟ࢆ⾜࠸ࠊᚲせᛂࡌ࡚㝶༠㆟➼ࢆ⾜࠺➼ࡋ࡚ࠊᮏㅎၥ㡯ࡘ࠸࡚
ៅ㔜᳨ウࢆ⾜࠸ࡲࡋࡓࠋ�
ලయⓗࡣࠊᮏ⊂❧ᙺဨጤဨࡣࠊ⚄ᮾሬᩱࡀ㑅௵ࡋࡓ࣮࣭ࣜ࢞ࣝࢻࣂࢨ࣮࡛࠶ࡿỤ
ᶫἲᚊົᡤࠊࣇࢼࣥࢩ࣭ࣕࣝࢻࣂࢨ࣮ව➨୕⪅⟬ᐃᶵ㛵࡛࠶ࡿ㹈㹀㹋㸿ཬࡧィ࣭
⛯ົࢻࣂࢨ࣮࡛࠶ࡿ�㹀㹂㹍� 㹁㹟㹌� 㹄㸿㹑ྜྠ♫ࡘ࠸࡚ࠊ࠸ࡎࢀࡶ⊂❧ᛶཬࡧᑓ㛛
ᛶၥ㢟ࡀ࡞࠸ࡇࢆ☜ㄆࡋࠊࡑࡢ㑅௵ࢆᢎㄆ࠸ࡓࡋࡲࡋࡓࠋࡑࡢୖ࡛ࠊ᪥ᮏሬᩱཬࡧ⚄ᮾ
ሬᩱ୧♫ࡽࠊᮏᰴᘧࡢ┠ⓗࠊᮏᰴᘧ⮳ࡿ⫼ᬒ࣭⤒⦋ࠊᮏᰴᘧࡼࡾฟࡉࢀ
ࡿࢩࢼࢪ࣮ࡢෆᐜࠊᮏᰴᘧᚋࡢ⤒Ⴀ᪉㔪ࠊᚑᴗဨࡢྲྀᢅ࠸➼ࡘ࠸࡚ㄝ᫂ࢆཷࡅࠊ㉁ᛂ
⟅ࢆ⾜࠸ࡲࡋࡓࠋࡲࡓࠊ⚄ᮾሬᩱࡽࡣࠊᮏᴗィ⏬ࡢసᡂᡭ⥆ཬࡧෆᐜࡘ࠸࡚ࡶㄝ᫂ࢆཷ
ࡅࠊ㉁ᛂ⟅ࢆ⾜࠸ࡲࡋࡓࠋຍ࠼࡚ࠊ⚄ᮾሬᩱࡢ➨୕⪅⟬ᐃᶵ㛵࡛࠶ࡿ㹈㹀㹋㸿ࡽࠊ⚄ᮾሬ
ᩱᰴᘧࡢᰴᘧ౯್ࡢ⟬ᐃ᪉ἲཬࡧ⟬ᐃ⤖ᯝࡢㄝ᫂ࢆཷࡅࠊ㉁ᛂ⟅ࢆ⾜࠸ࡲࡋࡓࠋࡉࡽࠊ⚄
ᮾሬᩱࡢ࣮࣭ࣜ࢞ࣝࢻࣂࢨ࣮࡛࠶ࡿỤᶫἲᚊົᡤࡽࠊᮏᰴᘧಀࡿ⚄ᮾሬᩱࡢ
ྲྀ⥾ᙺࡢពᛮỴᐃࡢ᪉ἲ࣭㐣⛬➼ࠊᮏ⊂❧ᙺဨጤဨࡢ㐠⏝ࡑࡢࡢᮏᰴᘧಀࡿᡭ⥆
㠃ࡢබṇᛶࢆᢸಖࡍࡿࡓࡵࡢᥐ⨨ཬࡧ┈┦ࢆᅇ㑊ࡍࡿࡓࡵࡢᥐ⨨㛵ࡋ࡚ຓゝࢆཷࡅ࡚࠾
ࡾࡲࡍࠋᮏ⊂❧ᙺဨጤဨࡣࠊ୧♫ࡢ㛫࠾ࡅࡿᮏᰴᘧಀࡿ༠㆟࣭΅ࡢ⤒⦋ཬࡧෆᐜ
ࡘ࠸࡚㐺ሗ࿌ࢆཷࡅࡓୖ࡛ࠊ᪥ᮏሬᩱࡽᰴᘧẚ⋡ࡘ࠸࡚ࡢ᭱⤊ⓗ࡞ᥦࢆཷ
ࡅࡿࡲ࡛」ᩘᅇࢃࡓࡾ΅ࡢ᪉㔪➼ࡘ࠸࡚༠㆟ࢆ⾜࠸ࠊ⚄ᮾሬᩱពぢࡍࡿ࡞ࡋ࡚ࠊ
᪥ᮏሬᩱࡢ΅㐣⛬ᐇ㉁ⓗ㛵ࡋ࡚࠾ࡾࡲࡍࠋ�
ᮏ⊂❧ᙺဨጤဨࡣࠊࡿᡭ⥆ࢆ⤒࡚ࠊᮏㅎၥ㡯ࡘ࠸࡚ៅ㔜༠㆟ཬࡧ᳨ウࢆ⾜࠸ࠊ
ᮏᰴᘧࡢᐇࢆỴᐃࡍࡿࡇࡀ⚄ᮾሬᩱࡢ୍⯡ᰴࡗ࡚බṇ࡞ࡶࡢ࡛࠶ࡿ᪨ࡢ⟅⏦᭩
ࢆࠊ���� ᖺ �� ᭶㸳᪥࡛ࠊጤဨဨࡢ୍⮴࡛ࠊ⚄ᮾሬᩱࡢྲྀ⥾ᙺᑐࡋ࡚ᥦฟࡋ࡚࠾ࡾࡲ
ࡍࠋᙜヱ⟅⏦᭩ࡢෆᐜࡘ࠸࡚ࡣࠊูῧࡢ ���� ᖺ �� ᭶㸳᪥ࠕ⟅⏦᭩ࠖࢆࡈཧ↷ࡃࡔࡉ࠸ࠋ�
�
���
մ
⚄ᮾሬᩱ࠾ࡅࡿᐖ㛵ಀࢆ᭷ࡋ࡞࠸ྲྀ⥾ᙺဨࡢᢎㄆཬࡧ┘ᰝᙺဨࡢ␗㆟ࡀ࡞࠸᪨ࡢព
ぢ�
⚄ᮾሬᩱࡣࠊỤᶫἲᚊົᡤࡽᚓࡓἲⓗຓゝࠊ㹈㹀㹋㸿ࡽྲྀᚓࡋࡓ⚄ᮾሬᩱᰴᘧࡢᰴᘧ
౯್㛵ࡍࡿ⟬ᐃ᭩ࡢෆᐜࠊᮏ⊂❧ᙺဨጤဨࡽධᡭࡋࡓᮏ⟅⏦᭩ࠊᮏ⊂❧ᙺဨጤဨࡀ᪥
ᮏሬᩱࡢ㛫࡛ᐇࡋࡓ」ᩘᅇࢃࡓࡿ⥅⥆ⓗ࡞༠㆟ࡢෆᐜཬࡧࡑࡢࡢ㈨ᩱࢆ㋃ࡲ࠼ࠊ᪥ᮏ
ሬᩱࡼࡿᮏᰴᘧࡀ⚄ᮾሬᩱࡢᴗ౯್ࡢྥୖ㈨ࡍࡿࠊᰴᘧẚ⋡ࢆྵࡴᮏᰴᘧ
ಀࡿྲྀᘬ᮲௳ࡀබṇ࡞ࡶࡢࡘ࠸࡚ៅ㔜ᑂ㆟᳨࣭ウࢆ⾜ࡗࡓ⤖ᯝࠊ���� ᖺ �� ᭶㸴᪥㛤ദ
ࡢ⚄ᮾሬᩱࡢྲྀ⥾ᙺ࠾࠸࡚ࠊᮏᰴᘧዎ⣙ࢆ⥾⤖ࡍࡿࡇࢆỴ㆟ࡋ࡚࠾ࡾࡲࡍࠋ�
ୖグࡢ⚄ᮾሬᩱࡢྲྀ⥾ᙺ࠾࠸࡚ࡣࠊ⚄ᮾሬᩱࡀ᪥ᮏሬᩱࡢᏊ♫࡛࠶ࡾࠊᮏᰴᘧࡀ
ᵓ㐀ⓗ࡞┈┦ࡢၥ㢟ཬࡧሗࡢ㠀ᑐ⛠ᛶࡢၥ㢟ࡀ㢮ᆺⓗᏑᅾࡍࡿྲྀᘬヱᙜࡍࡿࡇ㚷
ࡳࠊ⚄ᮾሬᩱࡢྲྀ⥾ᙺ࠾ࡅࡿᑂ㆟ཬࡧỴ㆟ࡀࡇࢀࡽࡢၥ㢟ࡼࡿᙳ㡪ࢆཷࡅࡿ࠾ࡑࢀࢆ㝖
ࡍࡿほⅬࡽࠊ⚄ᮾሬᩱࡢྲྀ⥾ᙺ㸳ྡࡢ࠺ࡕࠊ���� ᖺ㸱᭶ࡲ࡛᪥ᮏሬᩱᅾ⡠ࡋ࡚࠸ࡓ୰㇂ᫀ
ᖾẶࢆ㝖ࡃ㸲ྡࡢྲྀ⥾ᙺࡼࡾᑂ㆟ࡢୖࠊဨ୍⮴ࡼࡾୖグỴ㆟ࢆ⾜ࡗ࡚࠾ࡾࡲࡍࠋࡲࡓࠊୖ
グྲྀ⥾ᙺࡣࠊ⚄ᮾሬᩱࡢ┘ᰝᙺ㸲ྡࡢ࠺ࡕࠊ⌧ᅾ᪥ᮏሬᩱᅾ⡠ࡋ࡚࠸ࡿ୕ᾆྐᮁẶࢆ㝖
ࡃ㸱ྡဨࡀฟᖍࡋࠊ࠸ࡎࢀࡶୖグỴ㆟ࢆ⾜࠺ࡇࡘ࠸࡚␗㆟ࡀ࡞࠸᪨ࡢពぢࢆ㏙࡚࠾ࡾࡲ
ࡍࠋ�
�
յ
⚄ᮾሬᩱ࠾ࡅࡿ⊂❧ࡋࡓ᳨ウయไࡢᵓ⠏�
⚄ᮾሬᩱࡣࠊ᪥ᮏሬᩱࡽ⊂❧ࡋࡓ❧ሙ࡛ࠊᮏᰴᘧಀࡿ᳨ウࠊ΅ཬࡧุ᩿ࢆ⾜࠺య
ไࢆ♫ෆᵓ⠏࠸ࡓࡋࡲࡋࡓࠋලయⓗࡣࠊ⚄ᮾሬᩱࡣࠊ���� ᖺ㸵᭶ �� ᪥ࠊ᪥ᮏሬᩱࡼࡾᮏ
ᥦࢆཷ㡿ࡋࡓ᪥௨㝆ࠊᮏᰴᘧ㛵ࡍࡿ᳨ウ㸦⚄ᮾሬᩱᰴᘧࡢᰴᘧ౯್ࡢ⟬ᐃࡢᇶ♏࡞ࡿ
ᴗィ⏬ࡢసᡂࢆྵࡳࡲࡍࠋ㸧୪ࡧ᪥ᮏሬᩱࡢ༠㆟ཬࡧ΅ࢆ⾜࠺యไࢆᵓ⠏࠸ࡓࡋࡲࡋࡓࠋ
�
ᮏ⊂❧ᙺဨጤဨࡣࠊ���� ᖺ㸷᭶㸰᪥㛤ദࡢ➨㸯ᅇ⊂❧ᙺဨጤဨ࠾࠸࡚ࠊỤᶫἲᚊົ
ᡤࡢຓゝࢆ㋃ࡲ࠼ࠊᮏᰴᘧࡘ࠸࡚♫ෆ᳨࡛ウࠊ΅ཬࡧุ᩿ࢆ⾜࠺࠶ࡓࡾࠊ⚄ᮾሬᩱࡢ
ྲྀ⥾ᙺࡢ࠺ࡕ ���� ᖺ㸱᭶ࡲ࡛᪥ᮏሬᩱᅾ⡠ࡋ࡚࠸ࡓ୰㇂ᫀᖾẶཬࡧ⚄ᮾሬᩱࡢ┘ᰝᙺࡢ࠺
ࡕ⌧ᅾ᪥ᮏሬᩱᅾ⡠ࡋ࡚࠸ࡿ୕ᾆྐᮁẶ୪ࡧ᪥ᮏሬᩱࡽ⚄ᮾሬᩱฟྥࡋ࡚࠸ࡿᚑᴗ
ဨࡘ࠸࡚ࡣࠊᮏᰴᘧ㛵ࡋ࡚ᐖ㛵ಀࢆ᭷ࡍࡿ⪃࠼ࡽࢀࡿࡇࡽࠊᮏᰴᘧ㛵ࡍ
ࡿ᳨ウࠊ᪥ᮏሬᩱࡢ༠㆟ཬࡧ΅ࡣ୍ษཧຍࡋ࡞࠸ࡇࡍࡿ᪨ࢆ☜ㄆ࠸ࡓࡋࡲࡋࡓࠋ�
ࡇࢀࡽࡢྲྀᢅ࠸ࢆྵࡵ࡚ࠊ⚄ᮾሬᩱࡢ᳨ウయไ⊂❧ᛶࠊබṇᛶࡢほⅬࡽၥ㢟ࡀ࡞࠸ࡇ
ࡘ࠸࡚ࠊᮏ⊂❧ᙺဨጤဨࡢᢎㄆࢆᚓ࡚࠾ࡾࡲࡍࠋ�
�
ն
ࡢ㈙⪅ࡼࡿ㈙ᥦࡢᶵࡢ☜ಖ㸦࣐࣮ࢣࢵࢺ࣭ࢳ࢙ࢵࢡ㸧�
᪥ᮏሬᩱཬࡧ⚄ᮾሬᩱࡣࠊ⚄ᮾሬᩱࡀ᪥ᮏሬᩱ௨እࡢ㈙ᥦ⪅㸦௨ୗࠕᑐᢠⓗ㈙ᥦ
⪅ࠖ࠸࠸ࡲࡍࠋ
㸧᥋ゐࡍࡿࡇࢆ⚗Ṇࡍࡿࡼ࠺࡞ྲྀᘬಖㆤ᮲㡯ࢆྵࡴྜព➼ࠊᑐᢠⓗ㈙ᥦ
⪅ࡀ⚄ᮾሬᩱࡢ㛫࡛᥋ゐࡍࡿࡇࢆไ㝈ࡍࡿࡼ࠺࡞ෆᐜࡢྜពࢆ୍ษ⾜ࡗ࡚࠾ࡾࡲࡏࢇࠋ�
ࡲࡓࠊᮏᰴᘧዎ⣙ࢆᢎㄆࡍࡿࡓࡵࡢ⚄ᮾሬᩱࡢ⮫ᰴ⥲ࡣࠊᮏᰴᘧዎ⣙ࡢ⥾⤖ࡀ
බ⾲ࡉࢀ࡚ࡽ⣙㸰ࣨ᭶ᚋ࡛࠶ࡿ ���� ᖺ㸯᭶ �� ᪥㛤ദணᐃ࡛࠶ࡾࠊࡢᴗ㈙ࡢẚ
ࡋ࡚ࡶࠊᑐᢠⓗ㈙ᥦ⪅ࡼࡿᶵࡀ༑ศ☜ಖࡉࢀ࡚࠸ࡿ⪃࠼࡚࠾ࡾࡲࡍࠋ�
���
�
㸲㸬 ᮏᰴᘧࡢᙜ♫ࡢᴫせ㸦ู㏵グ㍕ࡀ࠶ࡿሙྜࢆ㝖ࡁࠊ���� ᖺ㸱᭶ �� ᪥⌧ᅾ㸧�
�
�
ᰴᘧぶ♫�
ᰴᘧᏊ♫�
㸦㸯㸧� ྡ⛠�
᪥ᮏሬᩱᰴᘧ♫�
⚄ᮾሬᩱᰴᘧ♫�
㸦㸰㸧� ᡤᅾᆅ�
㜰ᕷ୰ኸ༊ᖹ㔝⏫ᅄ┠㸰␒㸱ྕ�
㸦ὀ㸧�
௦⾲ྲྀ⥾ᙺ♫㛗� 㔛�㝯ᖾ�
㸦㸱㸧� ௦ ⾲ ⪅ ࡢ ᙺ
⫋࣭Ặྡ�
㸦㸲㸧� ᴗෆᐜ�
㸦㸳㸧� ㈨ᮏ㔠�
㸦㸴㸧� タ❧ᖺ᭶᪥�
රᗜ┴ᑽᓮᕷ༡ሯཱྀ⏫භ┠ �� ␒ ��
ྕ�
௦⾲ྲྀ⥾ᙺ♫㛗ᇳ⾜ᙺဨ� �
ᑠᆏ�ఀ▱㑻�
ሬᩱࠊࢪ࢙ࢵࢺࣥࢡࡢ〇㐀࣭㈍ࠊ ሬᩱࠊ᥋╔ࠊ㢦ᩱࠊྜᡂᶞ⬡ࡑࡢ
ྛ✀ሬᶵჾ⨨ࡢ㈍ࠊሬᕤ➼� ྛ✀ᡂရ➼ࡢ〇㐀࣭ຍᕤ࣭㈙ࠊሬ
ᕤࡑࡢྛ✀ᘓタᕤࡢタィ࣭
ᕤ࣭⟶⌮➼�
����� ⓒ�
����� ⓒ�
���� ᖺ � ᭶ �� ᪥�
���� ᖺ � ᭶ �� ᪥�
㸦㸵㸧� Ⓨ⾜῭ᰴᘧᩘ� 㸦ᬑ㏻ᰴᘧ㸧�
���������� ᰴ�
㸦㸶㸧� Ỵ⟬ᮇ�
㸱᭶ᮎ�
㸦㸷㸧� ᚑᴗဨᩘ�
㸦��㸧� せྲྀᘬඛ�
㸦ᬑ㏻ᰴᘧ㸧�
���������� ᰴ�
㸱᭶ᮎ�
㸦㐃⤖㸧����� ே�
ࢲࢽࢵ࢝ᰴᘧ♫�
ྡ⚄ᰴᘧ♫�
㸦��㸧� せྲྀᘬ㖟⾜� ᰴᘧ♫୕⳻㹓㹄㹈㖟⾜ࠊ�
ᰴᘧ♫ᶓ㖟⾜�
㸦��㸧� ᰴཬࡧᣢ ᪥ᮏ࣐ࢫࢱ࣮ࢺࣛࢫࢺಙ
ᰴẚ⋡�
ク㖟⾜ᰴᘧ♫㸦ࡑࡢಙ
クཱྀ㸧�
ࢲࢽࢵ࢝ᰴᘧ♫�
᪥ᮏ࣐ࢫࢱ࣮ࢺࣛࢫࢺಙ
ク㖟⾜ᰴᘧ♫㸦ᢞ㈨ಙク
ཱྀ㸧�
ᰴᘧ♫ᓥὠ〇సᡤ�
⏣㑔�ᗣ⚽�
᫂Ᏻ⏣⏕ಖ㝤┦
♫㸦ᖖ௵௦⌮ே�ᰴᘧ♫
᪥ᮏ࢝ࢫࢺࢹ㖟⾜㸧�
ᐩᅜ⏕ಖ㝤┦♫㸦ᖖ
௵௦⌮ே�ᰴᘧ♫᪥ᮏ࢝
ࢫࢺࢹ㖟⾜㸧�
'17 ྲྀᘬ㛵ಀᣢᰴ�
ᮾிᾏୖ᪥ືⅆ⅏ಖ㝤ᰴ
ᘧ♫�
୕⳻㹓㹄㹈ಙク㖟⾜ᰴᘧ
♫�
㸦��㸧� ᙜ♫㛫ࡢ㛵ಀ�
���
㸦㐃⤖㸧��� ே�
ᮾᘓクࣃ࣮ࢺࢼ࣮ࢬओࠊ�
⚄ᮾࢡࢧࣝࢱࢥ࣮ࢸࣥࢢࢩࢫࢸ
࣒ࢬओ�
ᰴᘧ♫୕⳻㹓㹄㹈㖟⾜ࠊ�
ᰴᘧ♫୕ఫ㖟⾜�
᪥ᮏሬᩱᰴᘧ♫�
����㸣�
�����㸣�
����㸣� ⚄ᮾሬᩱྲྀᘬඛᣢᰴ�
����㸣�
୰ᓥ�ಙ�
����㸣�
����㸣�
����㸣� 㜰ᮏ�㔜�
����㸣�
����㸣� ⚄ᮾሬᩱ♫ဨᣢᰴ�
����㸣�
㓇�୍�
����㸣�
����㸣�
㧗▼�ᩥኵ�
����㸣�
����㸣�
����㸣� ᴦኳドๆᰴᘧ♫�
����㸣�
㹁㸿㹁㹃㹇㹑� 㹀㸿㹌㹉�
㹄㹍㹐㸦㹌㹐㸧㸫� 㹌㹍㹌�
����㸣� 㹒㹐㹃㸿㹒㹗�
㸦ᖖ௵௦⌮ே㸧�
㤶 ୖᾏ㖟⾜ᮾிᨭᗑ�
ᰴᘧ♫ 6%, ドๆ�
����㸣�
����㸣�
����㸣�
㈨ᮏ㛵ಀ�
ேⓗ㛵ಀ�
ྲྀᘬ㛵ಀ�
᪥ᮏሬᩱࡣࠊ⚄ᮾሬᩱࡢⓎ⾜῭ᰴᘧᩘ㸦���������� ᰴ㸧ࡽ⮬ᕫᰴᘧᩘ
㸦������ ᰴ㸧ࢆ᥍㝖ࡋࡓᰴᘧᩘࡢ �����㸣┦ᙜࡍࡿ ���������� ᰴࡢᰴᘧࢆ
ಖ᭷ࡋ࡚࠾ࡾࠊ⚄ᮾሬᩱࡢぶ♫࡛࠶ࡾࡲࡍࠋ�
᪥ᮏሬᩱࡢᇳ⾜ᙺဨ㸯ྡࡀࠊ⚄ᮾሬᩱࡢ┘ᰝᙺᑵ௵ࡋ࡚࠾ࡾࡲࡍࠋࡲࡓࠊ
⚄ᮾሬᩱࡣࠊ���� ᖺ �� ᭶ �� ᪥⌧ᅾࠊ᪥ᮏሬᩱࡼࡾ㸯ྡࢆฟྥ⪅ࡋ࡚ཷ
ࡅධࢀ࡚࠾ࡾࡲࡍࠋ�
᪥ᮏሬᩱ⚄ᮾሬᩱࡢ㛫ࡣࠊሬᩱࡢධ࣭㈍ࡢྲྀᘬ㛵ಀࡀ࠶ࡾࡲࡍࠋ�
㛵㐃ᙜ⪅ ⚄ᮾሬᩱࡣ᪥ᮏሬᩱࡢ㐃⤖Ꮚ♫࡛࠶ࡾࠊ୧♫ࡣ┦㛵㐃ᙜ⪅ヱᙜ
ࡢヱᙜ≧ἣ�
ࡋࡲࡍࠋ�
㸦��㸧� ᭱㏆㸱ᖺ㛫ࡢ⤒Ⴀᡂ⦼ཬࡧ㈈ᨻ≧ែ�
Ỵ⟬ᮇ�
᪥ᮏሬᩱ㸦㐃⤖㸧�
���� ᖺ�
㸱᭶ᮇ�
⚄ᮾሬᩱ㸦㐃⤖㸧�
���� ᖺ�
㸱᭶ᮇ�
���� ᖺ�
㸱᭶ᮇ�
���� ᖺ�
㸱᭶ᮇ�
���� ᖺ�
㸱᭶ᮇ�
���� ᖺ�
㸱᭶ᮇ�
㐃⤖⣧㈨⏘�
�������
�������
�������
�������
�������
�������
㐃⤖⥲㈨⏘�
��������
��������
��������
�������
�������
�������
���������
���������
���������
�������
�������
�������
�������
�������
�������
�������
�������
�������
������
������
������
����ڹ
����
����
������
������
������
����ڹ
����
����
������
������
������
����ڹ
���ڹ
����ڹ
�������
�������
������
������ڹ
�����ڹ
������ڹ
������
������
������
�����
�����
�����
㸯ᰴᙜࡓࡾ㐃⤖⣧㈨
⏘㸦㸧�
㐃⤖ୖ㧗�
㐃⤖Ⴀᴗ┈ཪࡣ�
Ⴀᴗᦆኻ�
㐃⤖⤒ᖖ┈ཪࡣ�
⤒ᖖᦆኻ�
ぶ♫ᰴᖐᒓࡍ
ࡿ㐃⤖ᙜᮇ⣧┈ཪ
ࡣᙜᮇ⣧ᦆኻ㸦ڹ㸧�
㸯ᰴᙜࡓࡾ㐃⤖ᙜᮇ
⣧┈ཪࡣᙜᮇ⣧ᦆ
ኻ㸦ڹ㸧㸦㸧�
㸯ᰴᙜࡓࡾ㓄ᙜ㔠
㸦㸧�
㸦༢㸸ⓒࠋ≉グࡋ࡚࠸ࡿࡶࡢࢆ㝖ࡃࠋ㸧�
㸦ὀ㸧ᮏ᪥Ⅼࠋ࡞࠾ࠊ᪥ᮏሬᩱࡣࠊ���� ᖺ㸷᭶ �� ᪥ࡼࡾࠊᮏᗑᡤᅾᆅࢆ㜰ᕷ୰ኸ༊༡⯪ሙ୍
┠ �� ␒ �� ྕࡽ㜰ᕷ୰ኸ༊ᖹ㔝⏫ᅄ┠㸰␒㸱ྕኚ᭦ࡋ࡚࠾ࡾࡲࡍࠋ�
�
㸳㸬 ᮏᰴᘧᚋࡢ≧ἣ�
�
ᰴᘧぶ♫�
㸦㸯㸧�ྡ⛠�
᪥ᮏሬᩱᰴᘧ♫�
㸦㸰㸧�ᡤᅾᆅ�
㜰ᕷ୰ኸ༊ᖹ㔝⏫ᅄ┠㸰␒㸱ྕ�
㸦㸱㸧�௦⾲⪅ࡢᙺ⫋࣭Ặྡ� ௦⾲ྲྀ⥾ᙺ♫㛗� 㔛�㝯ᖾ�
㸦㸲㸧�ᴗෆᐜ�
ሬᩱࠊࢪ࢙ࢵࢺࣥࢡࡢ〇㐀࣭㈍ࠊྛ✀ሬᶵჾ⨨ࡢ㈍ࠊሬ
ᕤ➼�
㸦㸳㸧�㈨ᮏ㔠�
����� ⓒ�
㸦㸴㸧�Ỵ⟬ᮇ�
㸱᭶ᮎ�
㸦㸵㸧�⣧㈨⏘�
⌧Ⅼ࡛ࡣ☜ᐃࡋ࡚࠾ࡾࡲࡏࢇࠋ�
���
㸦㸶㸧�⥲㈨⏘�
⌧Ⅼ࡛ࡣ☜ᐃࡋ࡚࠾ࡾࡲࡏࢇࠋ�
�
㸴㸬 ィฎ⌮ࡢᴫせ�
ᮏᰴᘧࡣࠊᴗ⤖ྜ㛵ࡍࡿィᇶ‽࠾ࡅࡿඹ㏻ᨭ㓄ୗࡢྲྀᘬ➼ヱᙜࡍࡿぢ㎸ࡳ࡛ࡍࠋ
�
�
㸵㸬 ᚋࡢぢ㏻ࡋ�
ᮏᰴᘧࡼࡿ᪥ᮏሬᩱཬࡧ⚄ᮾሬᩱࡢᴗ⦼ࡢᙳ㡪ࡘࡁࡲࡋ࡚ࡣࠊ⌧ᅾ⢭ᰝ୰࡛࠶ࡾ
ࡲࡍࡀࠊᚋࠊᴗ⦼ணಟṇࡢᚲせᛶཪࡣබ⾲ࡍࡁ㡯ࡀ⏕ࡌࡓሙྜࡣࠊ㏿ࡸ㛤♧࠸ࡓࡋ
ࡲࡍࠋ�
�
㸶㸬㹋㹀㹍➼㛵ࡍࡿ㡯�
㸯 ୍⯡ᰴࡗ࡚බṇ࡛࠶ࡿࡇ㛵ࡍࡿᮏ⊂❧ᙺဨጤဨࡢពぢ�
ᮏᰴᘧࡣࠊ⚄ᮾሬᩱࡗ࡚ࠊᨭ㓄ᰴ㸦ぶ♫㸧࡛࠶ࡿ᪥ᮏሬᩱࡢྲྀᘬ࡛࠶ࡿࡇ
ࡽࠊ᭷౯ドๆୖሙつ⛬➨ ��� ᮲つᐃࡉࢀࡿࠕ㹋㹀㹍➼ಀࡿ㑂Ᏺ㡯ࠖࡀ㐺⏝ࡉࢀࡲࡍࠋࡑ
ࡢࡓࡵࠊ⚄ᮾሬᩱࡣࠊᮏ⊂❧ᙺဨጤဨࡽ ���� ᖺ �� ᭶㸳᪥࡛ࠊᮏᰴᘧࡢᐇࢆỴᐃࡍ
ࡿࡇࡀ⚄ᮾሬᩱࡢ୍⯡ᰴࡗ࡚බṇ࡞ࡶࡢ࡛࠶ࡿ᪨ࡢពぢࢆྲྀᚓࡋ࡚࠸ࡲࡍࠋ�
ヲ⣽ࡣࠊᙜヱពぢࡢෆᐜࡀグ㍕ࡉࢀࡓῧ㈨ᩱ㸦���� ᖺ �� ᭶㸳᪥ࠕ⟅⏦᭩ࠖ
㸧ࢆࡈཧ↷ࡃࡔ
ࡉ࠸ࠋ�
�
㸰 ᑡᩘᰴࡢಖㆤࡢ᪉⟇㛵ࡍࡿᣦ㔪ࡢ㐺ྜ≧ἣ�
᪥ᮏሬᩱࡣ⚄ᮾሬᩱࡢᨭ㓄ᰴ㸦ぶ♫㸧࡛࠶ࡾࠊᮏᰴᘧࡣࠊ⚄ᮾሬᩱࡗ࡚ᨭ㓄ᰴ
ࡢྲྀᘬ➼ヱᙜࡋࡲࡍࠋ�
⚄ᮾሬᩱࡀࠊ���� ᖺ㸴᭶ �� ᪥㛤♧ࡋࡓࢥ࣮࣏࣮ࣞࢺ࣭࢞ࣂࢼࣥࢫሗ࿌᭩࡛♧ࡋ࡚࠸ࡿࠕᨭ
㓄ᰴࡢྲྀᘬ➼ࢆ⾜࠺㝿࠾ࡅࡿᑡᩘᰴࡢಖㆤࡢ᪉⟇㛵ࡍࡿᣦ㔪ࠖ࠾࠸࡚ࠊࠕᙜ♫ࡀぶ
♫ཬࡧࡑࡢࢢ࣮ࣝࣉ♫⾜࠺ྲྀᘬࡘ࠸࡚ࡣࠊぶ♫ࡢ┈ࢆඃඛࡍࡿࡇ࡛ࠊᙜ♫ᑡᩘᰴ
ࡢ┈ࢆᲠᦆࡍࡿ┈┦ࡢࣜࢫࢡࡀ࠶ࡿࡇࡽࠊᙜ♫ࡢᑡᩘᰴಖㆤࡢほⅬࡽࠊࡑࡢබ
ṇᛶཬࡧྜ⌮ᛶࢆ☜ಖࡍࡿࡓࡵࠊ���� ᖺ � ᭶ �� ᪥㛤ദࡢᙜ♫ྲྀ⥾ᙺ࠾࠸࡚ࠊྲྀ⥾ᙺࡢ
௵ពࡢㅎၥᶵ㛵࡛࠶ࡿࠕ⊂❧ᙺဨጤဨࠖࢆタ⨨ࡍࡿࡇࢆỴ㆟࠸ࡓࡋࡲࡋࡓࠋᙜ♫ࡣࠊ⊂❧ᙺ
ဨጤဨࡢ⟅⏦ᇶ࡙ࡁࠊᙜ♫ࡢᴗ౯್ࡀᦆ࡞ࢃࢀ࡞࠸ࡼ࠺ࠊ㐺ษពᛮỴᐃࢆ⾜࠸ࡲࡍࠋࠖ
ࡋ࡚࠾ࡾࡲࡍࠋ�
ࡇࡢⅬࠊ⚄ᮾሬᩱࡣࠊᮏᰴᘧ࠾࠸࡚ࠊୖグ㸱㸬
ࠕ㸦㸲㸧බṇᛶࢆᢸಖࡍࡿࡓࡵࡢᥐ⨨㸦
┈┦ࢆᅇ㑊ࡍࡿࡓࡵࡢᥐ⨨ࢆྵࡴࠋ
㸧ࠖࡢ࠾ࡾࠊ⚄ᮾሬᩱࡢ♫እᙺဨ࡛ᵓᡂࡉࢀࡿᮏ⊂❧ᙺဨ
ጤဨ࠾࠸࡚ᑂ㆟ࡋࠊᮏ⟅⏦᭩ࢆ⚄ᮾሬᩱࡢྲྀ⥾ᙺᥦฟࡍࡿ࡞ࠊᮏᰴᘧࡢබṇᛶࢆ
ᢸಖࡍࡿࡓࡵࡢᥐ⨨㸦┈┦ࢆᅇ㑊ࡍࡿࡓࡵࡢᥐ⨨ࢆྵࡳࡲࡍࠋ㸧ࢆㅮࡌ࡚࠾ࡾࠊࡿᑐᛂ
ࡣࠊୖグᣦ㔪㐺ྜࡋ࡚࠸ࡿࡶࡢ⪃࠼࡚࠾ࡾࡲࡍࠋ�
�
㸱 බṇᛶࢆᢸಖࡍࡿࡓࡵࡢᥐ⨨ཬࡧ┈┦ࢆᅇ㑊ࡍࡿࡓࡵࡢᥐ⨨㛵ࡍࡿ㡯��
ୖグ㸱㸬
ࠕ㸦㸲㸧බṇᛶࢆᢸಖࡍࡿࡓࡵࡢᥐ⨨㸦┈┦ࢆᅇ㑊ࡍࡿࡓࡵࡢᥐ⨨ࢆྵࡴࠋ
㸧ࠖࢆࡈ
���
ཧ↷ࡃࡔࡉ࠸ࠋ�
௨ୖ�
�
���
㸦ཧ⪃㸧ᙜᮇ㐃⤖ᴗ⦼ணཬࡧ๓ᮇ㐃⤖ᐇ⦼�
᪥ᮏሬᩱ㸦༢㸸ⓒ㸧�
�
㐃⤖Ⴀᴗ┈�
㐃⤖⤒ᖖ┈�
ぶ♫ᰴᖐᒓ
ࡍࡿᙜᮇ⣧┈�
��������
������
������
������
�������
������
������
������
㐃⤖Ⴀᴗ┈�
㐃⤖⤒ᖖ┈�
ぶ♫ᰴᖐᒓ
ࡍࡿᙜᮇ⣧┈�
�������
����
����
����
�������
����
����
����ڹ
㐃⤖ୖ㧗�
ᙜᮇᴗ⦼ண�
㸦���� ᖺ㸱᭶ᮇ㸧�
๓ᮇᐇ⦼�
㸦���� ᖺ㸱᭶ᮇ㸧�
�
⚄ᮾሬᩱ㸦༢㸸ⓒ㸧�
�
ᙜᮇᴗ⦼ண�
㸦���� ᖺ㸱᭶ᮇ㸧�
๓ᮇᐇ⦼�
㸦���� ᖺ㸱᭶ᮇ㸧�
㐃⤖ୖ㧗�
�
㸦ཧ⪃㸧���� ᖺ �� ᭶㸳᪥ࠕ⟅⏦᭩ࠖ㸦ูῧ㸧�
���
⚄ᮾሬᩱᰴᘧ♫� ྲྀ⥾ᙺ� ᚚ୰�
�
⟅� ⏦� ᭩�
�
���� ᖺ �� ᭶ � ᪥�
�
⚄ᮾሬᩱᰴᘧ♫� ⊂❧ᙺဨጤဨ�
�
ጤ� ဨ� 㛗� � � ᶔ� ᑿ� � ᙪ�
�
ጤ� � � ဨ� � � ▮� � ᫀ� Ꮚ�
�
ጤ� � � ဨ� � � ᪥� ₲� ୍� 㑻�
�
ጤ� � � ဨ� � � ᱔� ᒣ� ❶� ྖ�
�
�
��
�
➨ �� ᮏ⊂❧ᙺဨጤဨᑐࡍࡿㅎၥ㡯�
ᰴᘧ♫ᮾிドๆྲྀᘬᡤ㸦௨ୗࠕᮾிドๆྲྀᘬᡤࠖ࠸࠺ࠋ㸧ࢫࢱࣥࢲ࣮ࢻᕷሙୖሙࡉ
ࢀ࡚࠸ࡿ⚄ᮾሬᩱᰴᘧ♫㸦௨ୗࠕ⚄ᮾሬᩱࠖ࠸࠺ࠋ㸧ࡣࠊ᪥ᮏሬᩱᰴᘧ♫㸦௨ୗࠕ
᪥ᮏሬᩱࠖ࠸࠺ࠋ㸧ࡽࠊ᪥ᮏሬᩱࢆᰴᘧぶ♫ࡋࠊ⚄ᮾሬᩱࢆᰴᘧ
Ꮚ♫ࡍࡿᰴᘧ㸦௨ୗࠕᮏᰴᘧࠖ࠸࠺ࠋ㸧ࡢᥦ㸦௨ୗࠕᮏᥦࠖ࠸࠺ࠋ㸧
ࢆཷࡅࡓࠋ�
ᮏᰴᘧࡣࠊ᪥ᮏሬᩱࡀࠊ⚄ᮾሬᩱࡢᬑ㏻ᰴᘧ㸦௨ୗࠕ⚄ᮾሬᩱᰴᘧࠖ࠸࠺ࠋ㸧
���������� ᰴ㸦���� ᖺ � ᭶ �� ᪥⌧ᅾࡢⓎ⾜῭ᰴᘧᩘ㸦���������� ᰴ㸧ࡽ⚄ᮾሬᩱࡢ⮬
ᕫᰴᘧᩘ㸦������ ᰴ㸧ࢆ᥍㝖ࡋࡓᰴᘧᩘ㸦���������� ᰴ㸧༨ࡵࡿྜ࡚ �����㸣㸧ࢆ
ಖ᭷ࡋࠊ⚄ᮾሬᩱࡀ᪥ᮏሬᩱࡢ㐃⤖Ꮚ♫ヱᙜࡍࡿࡇࡽࠊ࠸ࢃࡺࡿࠕᨭ㓄ᰴࡼ
ࡿᚑᒓ♫ࡢ㈙ࠖヱᙜࡋࠊ୍⯡ᰴࡗ࡚බṇ࡞ࡶࡢ࡛࠶ࡿࡇ㛵ࡋࠊ≉ูጤဨ
ࡼࡿពぢ᭩ࡢධᡭࢆ⾜࠺ࡇࡀᚲせ࡞ࡿྲྀᘬ㸦ᮾிドๆྲྀᘬᡤ᭷౯ドๆୖሙつ⛬➨ ���
᮲➨ � 㡯ᰕ᭩㸧ヱᙜࡍࡿࠋ�
ࡑࡇ࡛ࠊ⚄ᮾሬᩱࡣࠊᮏᰴᘧࡢ㠀ࢆᑂ㆟ཬࡧỴ㆟ࡍࡿඛ❧ࡗ࡚ࠊᮏᰴᘧಀ
ࡿྲྀ⥾ᙺࡢពᛮỴᐃៅ㔜ࢆᮇࡋࠊࡲࡓࠊྲྀ⥾ᙺࡢពᛮỴᐃ㐣⛬࠾ࡅࡿពᛶཬࡧ
┈┦ࡢ࠾ࡑࢀࢆ㝖ࡋࠊࡑࡢබṇᛶࢆᢸಖࡍࡿࡶࠊྲྀ⥾ᙺ࠾࠸࡚ᮏᰴᘧࢆ
⾜࠺᪨ࡢỴᐃࢆࡍࡿࡇࡀ⚄ᮾሬᩱࡢ୍⯡ᰴࡗ࡚බṇ࡞ࡶࡢ࡛࠶ࡿ࠸࠼ࡿ࠺
ࡘ࠸࡚ࡢពぢࢆྲྀᚓࡍࡿࡇࢆ┠ⓗࡋ࡚ࠊ���� ᖺ � ᭶ �� ᪥㛤ദࡢ⚄ᮾሬᩱྲྀ⥾ᙺ
Ỵ㆟ࡼࡾࠊᙜ⫋ࡽ � ྡࡼࡾᵓᡂࡉࢀࡿᮏ⊂❧ᙺဨጤဨࢆᮏᰴᘧಀࡿㅎၥᶵ㛵
⨨ࡅࠊᮏ⊂❧ᙺဨጤဨᑐࡋࠊᮏㅎၥ㡯㸦௨ୗ࡛ᐃ⩏ࡍࡿࠋ㸧ࡘ࠸࡚ㅎၥࡋࠊ
ᮏㅎၥ㡯ࡘ࠸࡚ࡢ⟅⏦᭩ࢆ⚄ᮾሬᩱྲྀ⥾ᙺᥦฟࡍࡿࡇࢆጤკࡋࡓࠋ�
ࡲࡓࠊ⚄ᮾሬᩱࡣࠊୖグྲྀ⥾ᙺ࠾࠸࡚ࠊᮏᰴᘧ㛵ࡍࡿពᛮỴᐃࢆ⾜࠺㝿ࡋ࡚ࠊ
ᮏ⟅⏦᭩࠾࠸࡚♧ࡉࢀࡓᮏ⊂❧ᙺဨጤဨࡢពぢࢆ᭱㝈ᑛ㔜ࡍࡿࡶࡢࡋࠊᮏ⊂❧ᙺ
ဨጤဨࡀᮏᰴᘧࡢᐇཪࡣྲྀᘬ᮲௳ࢆጇᙜ࡛࡞࠸ุ᩿ࡋࡓሙྜࡣࠊ⚄ᮾሬᩱྲྀ
⥾ᙺࡣࠊᮏᰴᘧ㈶ྠࡋ࡞࠸ࡶࡢࡍࡿ᪨ࢆỴ㆟ࡋ࡚࠸ࡿࠋ�
⚄ᮾሬᩱࡀࠊୖグྲྀ⥾ᙺỴ㆟ᇶ࡙ࡁࠊᮏ⊂❧ᙺဨጤဨᑐࡋ࡚ㅎၥࡋࡓ㡯㸦௨ୗ
ࠕᮏㅎၥ㡯ࠖ࠸࠺ࠋ
㸧ࡣࠊ௨ୗࡢ࠾ࡾ࡛࠶ࡿࠋ�
ձ ᮏᰴᘧࡢ┠ⓗࡢྜ⌮ᛶ㸦ᮏᰴᘧࡀ⚄ᮾሬᩱࡢᴗ౯್ྥୖ㈨ࡍࡿࢆྵ
ࡴࠋ㸧�
ղ ᮏᰴᘧࡢྲྀᘬ᮲௳㸦ᮏᰴᘧಀࡿẚ⋡ࡀබṇ࡞ࡶࡢ࡞ࡗ࡚࠸ࡿࢆྵ
ࡴࠋ㸧ࡢබṇᛶ࣭ጇᙜᛶ�
ճ ᮏᰴᘧࡢᡭ⥆ࡢබṇᛶ�
մ ୖグձࡽճࢆ㋃ࡲ࠼ࠊᮏᰴᘧࡀ୍⯡ᰴࡗ࡚බṇ࡛࠶ࡿ�
�
࠶ࢃࡏ࡚ࠊ⚄ᮾሬᩱࡣࠊᮏ⊂❧ᙺဨጤဨᑐࡋ࡚ࠊ
㸦㸧⚄ᮾሬᩱࡢᙺ⫋ဨࡽࠊᮏᰴ
ᘧࡢ᳨ウཬࡧุ᩿ᚲせ࡞ሗࢆཷ㡿ࡍࡿᶒ㝈㸦ᮏ⊂❧ᙺဨጤဨࡢฟᖍࢆせồࡍ
��
�
ࡿᶒ㝈ࢆྵࡴࠋ㸧
ࠊ
㸦㸧ᮏᰴᘧࡢྲྀᘬ᮲௳ཬࡧ΅㐣⛬ᐇ㉁ⓗ㛵ࡍࡿᶒ㝈㸦⚄ᮾ
ሬᩱᑐࡋ࡚ពぢࢆ㏙ཪࡣᣦ♧ⱝࡋࡃࡣせㄳࢆ⾜࠺ࡇཬࡧᮏ⊂❧ᙺဨጤဨ⮬ࡽ᪥
ᮏሬᩱ΅ࢆ⾜࠺ࡇࢆྵࡴࠋ㸧
ࠊ
㸦࢘㸧⚄ᮾሬᩱࡀ㑅௵ࡋࡓ⚄ᮾሬᩱࡢእ㒊ᑓ㛛ᐙࢻࣂ
ࢨ࣮ࢆᢎㄆ㸦㏣ㄆࢆྵࡴࠋ㸧ࡍࡿᶒ㝈ࠊ
㸦࢚㸧⚄ᮾሬᩱࡢ㈝⏝㈇ᢸ࠾࠸࡚ࠊ⚄ᮾሬᩱࡢእ
㒊ᑓ㛛ᐙࢻࣂࢨ࣮ຓゝࢆồࡵࡿᶒ㝈ࠊ
㸦࢜㸧⚄ᮾሬᩱࡢ㈝⏝㈇ᢸ࠾࠸࡚ࠊᚲせᛂ
ࡌࠊ⮬ࡽࡢእ㒊ᑓ㛛ᐙࢻࣂࢨ࣮ࢆ㑅௵ࡋࠊຓゝࢆồࡵࡿᶒ㝈ࠊ
㸦࢝㸧ࡑࡢࠊᮏ⊂❧ᙺ
ဨጤဨࡢ⫋ົࢆ⿵ຓࡍࡿ⪅ࡢᢎㄆ➼ࠊᮏ⊂❧ᙺဨጤဨࡀᮏᰴᘧ㛵ࡍࡿ᳨ウཬࡧ
ุ᩿㝿ࡋ࡚ᚲせㄆࡵࡿ㡯ࡘ࠸࡚ࡢᶒ㝈ࢆࡍࡿࡇࢆỴ㆟ࡋ࡚࠸ࡿࠋ�
�
➨ �� ᮏ⊂❧ᙺဨጤဨ᳨࡚ウࡋࡓ㈨ᩱ➼�
ᮏ⊂❧ᙺဨጤဨࡣࠊᮏㅎၥ㡯ᑐࡍࡿ⟅⏦㸦௨ୗࠕᮏ⟅⏦ࠖ࠸࠺ࠋ㸧ࢆ⾜࠺࠶ࡓ
ࡾࠊ௨ୗࡢྛ⾜Ⅽࢆ⾜ࡗࡓࠋ�
�� ᮏ⊂❧ᙺဨጤဨ࠾࠸࡚㓄ࡉࢀࡓྛ✀᭩㢮㸦௨ୗࠕᮏ᳨ウ㈨ᩱࠖ࠸࠺ࠋ㸧ࡢ᳨
ウ�
�� ᪥ᮏሬᩱᑐࡍࡿࠊᮏᰴᘧࡢ⫼ᬒ࣭┠ⓗࠊ᪥ᮏሬᩱࡢ㐃⤖Ꮚ♫࡞ࡗ࡚
௨㝆ࡢ⚄ᮾሬᩱࡢ⤒Ⴀㄢ㢟ཬࡧᨵၿ᪉㔪ࠊᮏᰴᘧࡼࡗ࡚ぢ㎸ࡲࢀࡿࢩࢼࢪ࣮
ཬࡧ࣓ࣜࢵࢺ࣭ࢹ࣓ࣜࢵࢺࡢෆᐜࠊᮏᰴᘧࡢྲྀᘬ᮲௳ࠊᮏᰴᘧᚋࡢ⤒Ⴀ᪉
㔪㸦ᚑᴗဨࡢྲྀᢅ࠸ࢆྵࡴࠋ㸧➼㛵ࡍࡿ㡯ࡢࣄࣜࣥࢢ�
�� ⚄ᮾሬᩱᑐࡍࡿࠊ-DSDQ�%OXH�0 $ ࢻࣂࢨ࣮ࣜᰴᘧ♫㸦௨ୗࠕ-%0$ࠖ࠸࠺ࠋ㸧
ࡼࡿᰴᘧẚ⋡⟬ᐃࡢ๓ᥦ࡞ࡗࡓᴗィ⏬㸦௨ୗࠕᮏᴗィ⏬ࠖ࠸࠺ࠋ㸧ࡢ
ෆᐜ࣭Ỵᐃᡭ⥆ࠊ⚄ᮾሬᩱࡢᴗ⎔ቃࠊᴗᡓ␎ࠊ⌧ᅾࡢ⤒Ⴀㄢ㢟ࠊᮏᰴᘧࡢ
ྲྀᘬ᮲௳ࠊᮏᰴᘧᚋࡢ⤒Ⴀ᪉㔪ࡑࡢ᪥ᮏሬᩱࡢᥦෆᐜ➼㛵ࡍࡿ㡯ࡢ
ࣄࣜࣥࢢ�
�� -%0$ ᑐࡍࡿࠊᰴᘧẚ⋡ࡢ⟬ᐃ⤖ᯝ㛵ࡍࡿ㡯ࡢࣄࣜࣥࢢ�
�� ᘚㆤኈἲேỤᶫἲᚊົᡤ㸦௨ୗࠕỤᶫἲᚊົᡤࠖ࠸࠺ࠋ㸧ᑐࡍࡿࠊ᪥
ᮏሬᩱࡢἲົࢹ࣮࣭ࣗࢹࣜࢪ࢙ࣥࢫࡢ⤖ᯝ㛵ࡍࡿ㡯ࡘ࠸࡚ࡢ㉁ᛂ⟅�
�� %'2� &D1� )$6 ྜྠ♫ᑐࡍࡿࠊ᪥ᮏሬᩱࡢ㈈ົ࣭⛯ົࢹ࣮࣭ࣗࢹࣜࢪ࢙ࣥࢫ
ࡢ⤖ᯝ㛵ࡍࡿ㡯ࡘ࠸࡚ࡢ㉁ᛂ⟅�
�� ���� ᖺ � ᭶ � ᪥ࡽ ���� ᖺ �� ᭶ � ᪥ࡲ࡛ࠊྜィ �� ᅇࢃࡓࡿᮏ⊂❧ᙺဨጤဨ
ࡢ㛤ദࠊྠጤဨ࠾ࡅࡿヲ⣽࡞ᑂ㆟᳨࣭ウࠊ୪ࡧ᪥㛫࠾ࡅࡿ㟁Ꮚ࣓࣮ࣝ➼
ࢆ㏻ࡌࡓពぢ⾲᫂ࠊሗཬࡧሗ㞟�
�� ࡑࡢࠊᮏ⟅⏦ࢆ⾜࠺࠶ࡓࡾྜ⌮ⓗᚲせཪࡣ㐺ᙜ⪃࠼ࡓ᭩㢮➼ࡢ᳨ウ�
�
➨ �� ᮏ⊂❧ᙺဨጤဨࡢពぢ�
ᮏ⊂❧ᙺဨጤဨࡣࠊጤဨဨࡢ୍⮴ࡼࡾࠊᮏㅎၥ㡯㛵ࡋ࡚௨ୗࡢពぢࢆ⟅⏦ࡍࡿࠋ�
�
��
�
ձ ᮏᰴᘧࡢ┠ⓗࡣྜ⌮ⓗ࡛࠶ࡾࠊᮏᰴᘧࡣ⚄ᮾሬᩱࡢᴗ౯್ྥୖ㈨ࡍࡿ
ㄆࡵࡽࢀࡿࠋ�
ղ ᮏᰴᘧࡢྲྀᘬ᮲௳㸦ᮏᰴᘧಀࡿẚ⋡ࢆྵࡴࠋ㸧ࡣබṇ࣭ጇᙜ࡛࠶ࡿ
ㄆࡵࡽࢀࡿࠋ�
ճ ᮏᰴᘧ⮳ࡿ΅㐣⛬➼࠾࠸࡚ࡣྲྀᘬ᮲௳ࡢබṇࡉࢆᢸಖࡍࡿࡓࡵࡢᡭ⥆ࡀ
༑ศㅮࡌࡽࢀ࡚࠾ࡾࠊᮏᰴᘧࡢᡭ⥆ࡣබṇ࡛࠶ࡿㄆࡵࡽࢀࡿࠋ�
մ ୖグձࡽճࢆ㋃ࡲ࠼ࠊᮏᰴᘧࡣ⚄ᮾሬᩱࡢ୍⯡ᰴࡗ࡚බṇ࡞ࡶࡢ࡛࠶ࡿ
ㄆࡵࡽࢀࡿࠋ�
�
➨�
ᮏ⊂❧ᙺဨጤဨࡢពぢࡢ⌮⏤�
�� ᮏᰴᘧࡢ┠ⓗࡢྜ⌮ᛶ㸦ᮏᰴᘧࡀ⚄ᮾሬᩱࡢᴗ౯್ྥୖ㈨ࡍࡿࢆྵ
ࡴࠋ㸧�
ᮏ⊂❧ᙺဨጤဨࡣࠊ⚄ᮾሬᩱࡢᴗ⎔ቃཬࡧ⤒Ⴀㄢ㢟ࠊᮏᰴᘧࡢᐇࡼࡗ
࡚ぢ㎸ࡲࢀࡿ࣓ࣜࢵࢺ㸦ᮏᰴᘧᐇᚋணᐃࡍࡿ⟇㸧
ࠊࢹ࣓ࣜࢵࢺ➼ࡘ࠸࡚ࠊ
⚄ᮾሬᩱཬࡧ᪥ᮏሬᩱᑐࡋ࡚㉁ࢆ⾜ࡗࡓࠋࡑࢀࡽࡢෆᐜࢆࡲࡵࡿࠊᴫせ௨
ୗࡢ࠾ࡾ࡛࠶ࡿࠋ࡞࠾ࠊ⚄ᮾሬᩱཬࡧ᪥ᮏሬᩱࡽㄝ᫂ࢆཷࡅࡓෆᐜࡘ࠸࡚ࠊ
ྜ⌮࡞Ⅼࡣ≉ẁㄆࡵࡽࢀ࡞࠸ࠋ�
�
⚄ᮾሬᩱࡢᴗ⎔ቃཬࡧ⤒Ⴀㄢ㢟�
⚄ᮾሬᩱࡣࠊ���� ᖺࠕ⚄ᡞ࣎ࣝἜࠖࢆ⌧ᅾࡢ⚄ᡞᕷℿ༊ሬᩱ〇㐀ᡤࡋ࡚
㛤タࡋࡓࡇࢆᴗࡢጞࡵࡋࠊ���� ᖺ � ᭶ᮾὒሬᩱ〇㐀ᰴᘧ♫ྜేࡋࠊ
ࠕ⚄ᮾሬᩱᰴᘧ♫ࠖࢆタ❧ࡋࡓࠋ⚄ᮾሬᩱࡢࢢ࣮ࣝࣉࡣࠊᮏ᪥⌧ᅾ࠾࠸࡚ࠊ⚄
ᮾሬᩱࠊᏊ♫ � ♫ཬࡧ㛵㐃♫ � ♫࡛ᵓᡂࡉࢀ㸦௨ୗࠕ⚄ᮾሬᩱࢢ࣮ࣝࣉࠖ⥲
⛠ࡍࡿࠋ㸧ࠊሬᩱࠊᡂရࡢ〇㐀㈍ࢆ࡞ᴗࡋ࡚࠸ࡿࠋ⚄ᮾሬᩱࢢ࣮ࣝࣉࡣࠊ
㧗࠸ᢏ⾡Ỉ‽ᡴࡕࡉࢀࡓ㧗ရ㉁ࠊ㧗ᶵ⬟ࠊ⎔ቃᑐᛂᆺࡢሬᩱ〇ရ࣭ࢥ࣮ࢸࣥ
ࢢᮦᩱࢧ࣮ࣅࢫࢆ㢳ᐈᚿྥࡢ⤌⧊ࢆ㏻ࡌ࡚ᥦ౪ࡋ࡚࠸ࡃࡇࢆᇶᮏ᪉㔪ࡋ࡚
࠸ࡿࠋ�
⚄ᮾሬᩱࢢ࣮ࣝࣉࡢᴗ㡿ᇦ࡛࠶ࡿሬᩱᴗࡣࠊᅜෆᕷሙࡢ⦆ࡸ࡞⦰ᑠࡀ⥆
ࡃᐃࡉࢀࡿ୍᪉࡛ࠊ⚄ᮾሬᩱࡀ ���� ᖺ � ᭶ �� ᪥ࠕᙜ♫〇ࡢ୍㒊〇ရಀ
ࡿ㐺ษ⾜Ⅽ㛵ࡍࡿㄪᰝሗ࿌᭩බ⾲ࡢ࠾▱ࡽࡏ࡛ࠖබ⾲ࡋࡓࠊ⚄ᮾሬᩱ࡛〇㐀ࡍ
ࡿỈ㐨⏝ࢲࢡࢱࣝ㗪㕲⟶ྜᡂᶞ⬡ሬᩱ㸦⟶⏝㸧ಀࡿබ┈♫ᅋἲே᪥ᮏỈ㐨༠
ࡢㄆドつ᱁㸦-::$�.���㸧㛵ࡍࡿ㐺ษ⾜Ⅽࡢබ⾲ࠊࡑࡢᚋࡢබⓗつ᱁ࡢㄆド
Ṇ࣭ྲྀᾘࡋࡼࡾኻࢃࢀࡓྲྀᘬඛࡽࡢಙ㢗ࢆᅇࡍࡿࡣࠊ࡞࠾㛫ࢆせࡍࡿ
࠸ࢃࡊࡿࢆᚓ࡞࠸≧ἣ࠶ࡿࠋ�
ࡑࡢࡼ࠺࡞୰ࠊ᪥ᮏሬᩱࡣࠊ ᪥ᮏሬᩱࡀ⚄ᮾሬᩱᰴᘧࢆᑐ㇟ࡋ࡚ ����
ᖺ � ᭶ � ᪥㛤ጞࡋࡓබ㛤㈙ࡅ㸦௨ୗࠕᮏබ㛤㈙ࡅࠖ࠸࠺ࠋ㸧ࠊཬࡧ ᙜヱ
බ㛤㈙ࡅࡢᡂ❧ᚋࠊ⚄ᮾሬᩱࢆⓎ⾜♫ࡋࠊ᪥ᮏሬᩱࢆᘬཷேࡍࡿ➨୕
��
�
⪅ᙜቑ㈨㸦௨ୗࠕᮏ➨୕⪅ᙜቑ㈨ࠖ࠸࠺ࠋ㸧ࢆᐇ㸦���� ᖺ � ᭶ �� ᪥ቑ
㈨㸧ࡍࡿࡇ࡛ࠊ⚄ᮾሬᩱࢆ㐃⤖Ꮚ♫ࡋࡓ㸦௨ୗࠕᮏ㐃⤖Ꮚ♫ࠖ࠸
࠺ࠋ㸧ࠋ�
⚄ᮾሬᩱࡋ࡚ࡣࠊሬᩱᴗ⏺ࡢྠᴗ♫࡛࠶ࡿ᪥ᮏሬᩱࢢ࣮ࣝࣉࡢചୗຍ
ࢃࡿࡇࡣࠊ⚄ᮾሬᩱࡢሬᩱᴗ⏺࡛ࡢࣉࣞࢮࣥࢫࡢྥୖᐤࡋࠊ▷ᮇⓗࡣඹ㏻
ࡍࡿཎᮦᩱࡢ୍ᒙࡢ᭷㉎㈙ࠊ୰㛗ᮇⓗࡣྠ♫ࡢᥖࡆࡿ⏕⏘タഛࡢ᪂㝞௦ㅰ➼
࠾࠸࡚ຠᯝࡀ࠶ࡿ⪃࠼࡚࠸ࡓࡢࡇ࡛࠶ࡿࠋຍ࠼࡚ࠊ⚄ᮾሬᩱࡋ࡚ࡣࠊ
6'*V 㐩ᡂྥࡅࡓྲྀ⤌ࡳࡢ୍⎔ࡋ࡚ࠊ���� ᖺ௨㝆ࠊ⎔ቃᑐᛂᆺሬᩱࡢ㛤Ⓨࢆࡼ
ࡾ୍ᒙಁ㐍ࡍࡿணᐃ࡛࠶ࡗࡓࡇࢁࠊ᪥ᮏሬᩱࢢ࣮ࣝࣉࡢചୗຍࢃࡿࡇ࡛ࠊ
⚄ᮾሬᩱࡢᢏ⾡㛤Ⓨຊࡢ᭦࡞ࡿྥୖࡀぢ㎸ࡵࠊྠሬᩱࡢ〇ရ㛤Ⓨࡶຍ㏿࡛ࡁࡿࡢ
࡛ࡣ࡞࠸⪃࠼࡚࠸ࡓࡢࡇ࡛࠶ࡿࠋ�
᪥ᮏሬᩱࡼࡿ⚄ᮾሬᩱࡢ㐃⤖Ꮚ♫௨㝆ࠊ᪥ᮏሬᩱཬࡧ⚄ᮾሬᩱࡣࠊ୧
♫࡚⥾⤖ࢆࡋࡓ ���� ᖺ � ᭶ � ᪥ࡢぬ᭩ᚑࡗ࡚ࠊ୧♫㛫࡛ྜពࡉࢀࡓᴗົᥦ
ᦠ➼㛵ࡍࡿ㡯ࢆ᥎㐍ࡋ࡚ࡁࡓࠋࡑࡢ⤖ᯝࡋ࡚ࠊ⚄ᮾሬᩱࡢ㐃⤖ୖ㧗ࡣ ����
ᖺ � ᭶ᮇࡢ ������ ⓒࡽ ���� ᖺ � ᭶ᮇࡢ ������ ⓒࠊႠᴗ┈ࡣ ���
ⓒࡽ ��� ⓒᨵၿࡋ࡚࠸ࡿࠋࡲࡓࠊ���� ᖺ � ᭶ᮇ➨ � ᅄ༙ᮇࡶࠊୖ
㧗 ����� ⓒࠊႠᴗ┈ �� ⓒࠊ⤒ᖖ┈ ��� ⓒࠊぶ♫ᰴᖐᒓࡍ
ࡿᅄ༙ᮇ⣧┈ ��� ⓒ࡞ࡾࠊ๓ᖺྠᮇẚ࡛ᨵၿࡋ࡚࠸ࡿࠋ�
ࡋࡋ࡞ࡀࡽࠊ᪥ᮏሬᩱࡋ࡚ࡣࠊ㐃⤖Ꮚ♫ᚋᴗົᥦᦠ➼㛵ࡍࡿ㡯
ࢆ᥎㐍ࡍࡿ୰࡛ࠊぶᏊୖሙࡢ㛵ಀ࡛ࡣࠊᑡᩘᰴࡢ┈ࡢ㓄៖ࡢほⅬࡽࠊಶู
⟇ࡈࡢ┈┦⟶⌮ཬࡧពᛮỴᐃᡭ⥆ᙜึࡢᐃ௨ୖࡢ㛫ཬࡧ⟶⌮㈇ᢸ
ࢆせࡍࡿࡇࡀ᫂ࡽ࡞ࡗࡓࡢࡇ࡛࠶ࡿࠋࡲࡓࠊ୧♫ࡀୖሙᴗࡋ࡚ࡑࢀ
ࡒࢀࡢෆ㒊⤫ไࠊ┘ᰝཬࡧ㛤♧➼ࡢయไࢆ⥔ᣢࡍࡿ㔜ᵓ㐀ࡶࠊᡭ⥆ཬࡧ⟶⌮ࢥࢫ
ࢺࡢቑຍせᅉ࡞ࡗ࡚࠸ࡿࡢࡇ࡛࠶ࡿࠋࡇࡢⅬࡘ࠸࡚ࠊ⚄ᮾሬᩱࡋ࡚ࡶࠊ
ぶᏊୖሙಀࡿ୍⯡ᰴಖㆤࡢࡓࡵࡢᡭ⥆ࡋ࡚ࠊ���� ᖺ � ᭶ �� ᪥㛤ദࡢ⚄ᮾሬ
ᩱྲྀ⥾ᙺ࠾࠸࡚ࠊྲྀ⥾ᙺࡢ௵ពࡢㅎၥᶵ㛵࡛࠶ࡿࠕ⊂❧ᙺဨጤဨࠖࢆタ⨨
ࡍࡿࡇࢆỴ㆟ࡋࠊ���� ᖺᗘ � ᅇ㛤ദࡋ࡚࠸ࡿࡇࠊ᪥ᮏሬᩱࡢ㛫࡛ ����
ᖺ �� ᭶ �� ᪥ࠕᴗᥦᦠ㛵ࡍࡿぬ᭩ࠖࢆ⥾⤖ࡋࠊ୧♫㛫ࡢ࢞ࣂࢼࣥࢫ㛵ࡍࡿ
ྲྀࡾỴࡵࢆ⾜ࡗ࡚࠸ࡿࡇࢆㄆ㆑ࡋ࡚࠸ࡿࡢࡇ࡛࠶ࡿࠋ�
ࡇࡢࡓࡵࠊ᪥ᮏሬᩱࡋ࡚ࡣࠊ⌧Ⅼ࠾࠸࡚ᴗົᥦᦠࡼࡿຠᯝࡣ㢧ᅾࡋ
࡚࠸ࡿࡶࡢࡢࠊ౫↛ࡋ࡚㝈ᐃⓗ࡛࠶ࡾࠊ᭦࡞ࡿࢩࢼࢪ࣮ࡢᐇ⌧ࡢࡓࡵࡣࠊᵓ㐀
ᨵ㠉ཬࡧ⤒Ⴀ㈨※ࡢ᭱㐺㓄ศࢆ㎿㏿㐍ࡵࡿࡇࡀㄢ㢟࡞ࡗ࡚࠸ࡿㄆ㆑ࡋ࡚
࠸ࡿࡢࡇ࡛࠶ࡿࠋຍ࠼࡚ࠊᅜෆሬᩱᕷሙࡢᡂ⇍ཬࡧཎᮦᩱࢥࢫࢺ➼ࡢୖ᪼ࡀ⥆
ࡃ୰ࠊ⚄ᮾሬᩱࡢ┈ຊࡢᅇࡣ࡞࠾㏵ୖ࠶ࡾࠊྠ♫༢⊂࡛ࡣࠊ➇தຊࡢ⥔ᣢ࣭
ᙉᚲせ࡞タഛᢞ㈨ཬࡧ◊✲㛤Ⓨᢞ㈨ࢆ༑ศࡘᶵືⓗ⾜࠺ࡇࡣไ⣙ࡀ
࠶ࡿㄆ㆑ࡋ࡚࠸ࡿࡢࡇ࡛࠶ࡿࠋࡇࡢⅬࡘ࠸࡚ࠊ⚄ᮾሬᩱࡋ࡚ࡶࠊ᪩ᮇᐇ
��
�
⌧ࡀᮇᚅࡉࢀࡓᏳ౯㉎㈙ࡘ࠸࡚ࡣࠊࡰࢫࢣࢪ࣮ࣗࣝ࠾ࡾᮇᚅࡋࡓつᶍࡢ
ྜ⌮ࢆ㐩ᡂࡍࡿࡇࡀ࡛ࡁࡓㄆ㆑ࡋ࡚࠸ࡿࡶࡢࡢࠊ࠼ࡤࠊ⏕⏘᭱㐺ࡘ࠸
࡚ࡣࠊᐇົୖࡢࡍࡾྜࢃࡏᐃ௨ୖࡢ㛫ࢆせࡋࡓ⤖ᯝࠊ⏕⏘ཷጤクࡘ࠸࡚ࡣ
���� ᖺヨసࡀ㛤ጞࡉࢀࡓࡤࡾ࡛࠶ࡾࠊၟရࡢࢡࣟࢫࢭࣝࡘ࠸࡚ࡶᩘရ┠
ࡲࡗ࡚࠸ࡿ➼ࠊᮇᚅࡉࢀࡓᡂᯝࡢ୍㒊ࢆ⚄ᮾሬᩱࡢ┈ࡋ࡚ாཷࡍࡿࡇ
ࡀ࡛ࡁ࡚࠸࡞࠸ㄆ㆑ࡋ࡚࠸ࡿࡢࡇ࡛࠶ࡿࠋࡲࡓࠊ⚄ᮾሬᩱࡣࠊ⏕⏘ᩘ㔞ࡀ
ῶᑡࡋࠊேဨయไࡶ⦰ᑠࡍࡿ୰ࠊရ㉁ࣇ࣮ࢫࢺయไࡢᵓ⠏ࢆ㐍ࡵࡿࡶࠊ〇
ရ㛤Ⓨࠊᣑ㈍άືࠊᴗົࣉࣟࢭࢫࡢᨵၿཬࡧࢥࢫࢺ๐ῶྲྀࡾ⤌ࢇ࡛࠾ࡾࠊࡇࢀࡽ
ࡢྲྀ⤌ࡳࡼࡿᡂᯝࡀ⌧ࢀࡘࡘ࠶ࡿࡶࡢࡢࠊ⌧Ⅼ࡛ࡣ࡞࠾༑ศ࡞Ỉ‽ࡣ⮳ࡗ
࡚࠸࡞࠸ࡇࠊタഛࡢప✌ാࡢᑐᛂཬࡧ⪁ᮙࡋࡓタഛࡢ᭦᪂ࡀᚲせ࡛࠶ࡿࡇ
ࠊ୪ࡧᑗ᮶ࡢᡂ㛗ྥࡅࡓ◊✲㛤Ⓨᢞ㈨ࡀ㝈ᐃⓗ࡛࠶ࡿࡇࡘ࠸࡚ࡶࠊᚋ
ྲྀࡾ⤌ࡴࡁㄢ㢟ࡋ࡚ㄆ㆑ࡋ࡚࠸ࡿࡢࡇ࡛࠶ࡿࠋ�
�
�
ᮏᰴᘧࡼࡗ࡚ぢ㎸ࡲࢀࡿ࣓ࣜࢵࢺ㸦ᮏᰴᘧᐇᚋணᐃࡍࡿ⟇㸧�
᪥ᮏሬᩱࡣࠊᮏᰴᘧࡼࡾࠊぶᏊୖሙక࠺ᑡᩘᰴࡢ┈ࡢ㓄៖ཬࡧ
┈┦⟶⌮㉳ᅉࡍࡿไ⣙ࢆ㍍ῶࡋࠊ㛗ᮇⓗ࡞どⅬ࡛୧♫ࡢ⤒Ⴀ㈨※ࢆ୍యⓗ
ά⏝ࡍࡿࡶࠊࢢ࣮ࣝࣉయࡢほⅬࡽࡢ⤒Ⴀ㈨※ࡢ᭱㐺㓄ศཬࡧ㎿㏿࡞
ពᛮỴᐃࡀྍ⬟࡞ࡿ࠸࠺࣓ࣜࢵࢺࢆࠊ୧♫ࡶாཷࡍࡿࡇࡀ࡛ࡁࡿ⪃
࠼࡚࠸ࡿࡢࡇ࡛࠶ࡿࠋලయⓗࡣࠊ௨ୗࡢ࣓ࣜࢵࢺࢆᐃࡋ࡚࠸ࡿࡢࡇ࡛
࠶ࡾࠊ⚄ᮾሬᩱࡋ࡚ࡶࠊ௨ୗࡢ࣓ࣜࢵࢺ␗ㄽࡣ࡞࠸ࡢࡇ࡛࠶ࡿࠋ�
� ㄪ㐩࣭≀ὶࡢඹྠࠊ⏕⏘࣭タഛᢞ㈨ࡢ᭱㐺➼�
◊✲㛤Ⓨࠊ⏕⏘ࠊㄪ㐩ࠊ㈍ࠊ≀ὶཬࡧ⟶⌮ࡢྛ㡿ᇦ࡛୧♫ࡢ⤒Ⴀ㈨※ࢆ⤌ࡳྜ
ࢃࡏࠊ⏕⏘యไཬࡧタഛᢞ㈨ࡢ᭱㐺ࠊඹྠ㉎㈙ࠊ≀ὶຠ⋡୪ࡧᅾᗜ᭱㐺➼
ࢆ㐍ࡵࡿࡇ࡛ࠊ㔜」ᢞ㈨ཬࡧ⟶⌮ࢥࢫࢺࢆᢚไࡋ࡞ࡀࡽࠊᡂ㛗ᢞ㈨ࢆᣑࡉࡏࡿ
ࡇ࡛┈ᛶࡢྥୖࢆᅗࡿࠋ�
�
� ◊✲㛤Ⓨ࣭ᢏ⾡ሗࡢඹ᭷ࠊ㈍⥙࣭㢳ᐈᇶ┙ࡢ┦ά⏝➼�
᪥ᮏሬᩱࡣࠊ⚄ᮾሬᩱࡀᙉࡳࢆᣢࡘᕤᴗ⏝ሬᩱ㸦㟁╔࣭⢊య㸧ࢆᵓ㐀≀ሬᩱ
ḟࡄᰕࡍࡿᴗ࣏࣮ࢺࣇ࢛ࣜ࢜ࡢぢ┤ࡋࢆ᪤ᐇࡋ࡚࠾ࡾࠊࡑࡢලయྥ
ࡅ࡚ࠊ୧♫ࡀ᭷ࡍࡿ〇ရࠊᢏ⾡ࠊ㈍㊰ཬࡧ㢳ᐈᇶ┙ࢆ᭷ຠά⏝ࡍࡿࡇ࡛ࠊྠศ㔝
࠾ࡅࡿ➇தຊཬࡧ┈ຊࡢྥୖࢆ┠ᣦࡍࠋ�
�
࢘� ᾏእᴗཬࡧ -9 ࣃ࣮ࢺࢼ࣮ࡢ㐃ᦠ➼�
୧♫〇ရࡢࢡࣟࢫࢭࣝཬࡧ᪂つ⏝㏵ࡢ㛤ᣅࢆ᳨ウࡍࡿࡶࠊ⚄ᮾሬᩱࡢ᪤
Ꮡࡢᾏእྜᘚᴗࣃ࣮ࢺࢼ࣮ࡢᥦᦠࢆ῝ࡉࡏࠊ≉ᮾ༡ࢪࢆ୰ᚰࡋࡓ
ᴗ㡿ᇦࡢᣑࢆ┠ᣦࡍࠋ�
��
�
�
࢚� ㈈ົࠊ,7ࠊேࠊἲົ➼ࡢ⟶⌮ᶵ⬟ࡢຠ⋡➼�
ࢩࢫࢸ࣒ࡢ⤫ྜ࣭ඹྠ⏝ཬࡧ㔜」ࡍࡿ⟶⌮ᶵ⬟ࡢᩚ⌮➼ࢆẁ㝵ⓗ㐍ࡵࡿࡇ
࡛ࠊ㈨㔠ࡸேⓗࣜࢯ࣮ࢫ࣭㛫ࢆฟࡋࠊࡑࢀࡽࢆ◊✲㛤Ⓨࠊタഛᢞ㈨ཬࡧேᮦ
⫱ᡂ࣭☜ಖࡾྥࡅࡿࠋࡇࢀࡼࡾࠊ⚄ᮾሬᩱࡢᢏ⾡ࠊࣈࣛࣥࢻࠊேᮦཬࡧ㢳ᐈ
ᑐᛂຊࢆ⥔ᣢࡋ࡞ࡀࡽࠊ୰㛗ᮇⓗ࡞ᵓ㐀ᨵ㠉ཬࡧᣢ⥆ⓗᡂ㛗ࡢᐇ⌧ࡀྍ⬟࡞ࡿࠋ�
�
�
ᮏᰴᘧࡢᐇࡼࡗ࡚⏕ࡌᚓࡿࢹ࣓ࣜࢵࢺ�
ᮏᰴᘧࢆ㏻ࡌ࡚⚄ᮾሬᩱࡣୖሙᗫṆ࡞ࡿࡓࡵࠊ୍⯡ⓗୖሙᴗࡀாཷ
࡛ࡁࡿ࢚ࢡࢸࣇࢼࣥࢫࡼࡿከᵝ࡞㈨㔠ㄪ㐩ᡭẁࡢ☜ಖࠊ♫ⓗ࡞ಙ⏝
ຊࡸ▱ྡᗘྥୖక࠺᥇⏝άືࡢዲᙳ㡪ࠊ㔠⼥ၟရྲྀᘬἲᇶ࡙ࡃ┘ᰝࢆ㏻ࡌ
ࡓ㈈ົሗࡢಙ㢗ᛶࡢྥୖ࡞ࡢⅬࢆᚓࡽࢀ࡞ࡃ࡞ࡿࠋ�
ࡋࡋࠊ᪥ᮏሬᩱࡋ࡚ࡣࠊᮏᰴᘧࡢᐇᚋ࠾࠸࡚ࡶࠊ⚄ᮾሬᩱࡣᮾி
ドๆྲྀᘬᡤࣉ࣒ࣛᕷሙୖሙࡍࡿ᪥ᮏሬᩱࡢᏊ♫ࡋ࡚ࠊ᪥ᮏሬᩱ
ࢢ࣮ࣝࣉࡢಙ⏝ຊࠊ▱ྡᗘࠊ㈨㔠ㄪ㐩ຊཬࡧᴗᇶ┙ࢆᘬࡁ⥆ࡁά⏝ࡍࡿࡇࡀ࡛
ࡁࡿࡢࡇ࡛࠶ࡿࠋࡲࡓࠊ᪥ᮏሬᩱࢢ࣮ࣝࣉࢆ㏻ࡌࡓ㈨㔠ㄪ㐩ࠊ⤒Ⴀ㈨※ࡢ㓄
ศࠊ᥇⏝࣭ேᮦ⫱ᡂࠊࢥࣥࣉࣛࣥࢫཬࡧࣜࢫࢡ⟶⌮యไࡢ┦ά⏝ࡀྍ⬟࡞
ࡿࠊୖሙ⥔ᣢక࠺㛤♧࣭⟶⌮ᴗົࡢ㈇ᢸࢆ㍍ῶࡋࠊฟࡉࢀࡓ㈨㔠ࠊேᮦཬ
ࡧ㛫ࢆᡂ㛗ᢞ㈨ࡾྥࡅࡿࡇࡀྍ⬟࡞ࡿࡢࡇ࡛࠶ࡿࠋࡑࡢࡓࡵࠊ᪥
ᮏሬᩱࡋ࡚ࡣࠊ⚄ᮾሬᩱࡢୖሙᗫṆక࠺ᙳ㡪ࡣ㝈ᐃⓗ࡛࠶ࡿ⪃࠼࡚࠸ࡿ
ࡢࡇ࡛࠶ࡿࠋࡇࡢⅬࡘ࠸࡚ࠊ⚄ᮾሬᩱࡋ࡚ࡶࠊୖሙᗫṆࡼࡿලయⓗ࡞ᠱᛕ
ࡣ≉࡞࠸ࡢࡇ࡛࠶ࡾࠊྲྀᘬඛᑐࡋ࡚ࡶᑀ࡞ㄝ᫂ࢆᑾࡃࡋ࡚⌮ゎࢆᚓࡿ
ࡼ࠺ດࡵࡿணᐃ࡛࠶ࡿࡢࡇ࡛࠶ࡿࠋ�
�
�
᳨ウ�
ᮏ⊂❧ᙺဨጤဨࡣࠊୖグࡢ⚄ᮾሬᩱࡢᴗ⎔ቃཬࡧ⤒Ⴀㄢ㢟ࢆ㋃ࡲ࠼ࡓᮏᰴ
ᘧࡢ┠ⓗࡢྜ⌮ᛶࠊཬࡧࡇࢀࡽࢆ㋃ࡲ࠼ࡓ⚄ᮾሬᩱࡢᴗ౯್ྥୖࡢྍ⬟ᛶ
➼ࡘ࠸࡚ࠊヲ⣽࡞᳨ウࢆᐇࡋࡓࠋලయⓗࡣࠊᮏ⊂❧ᙺဨጤဨࡣࠊ⌧ᅾࡢ⚄
ᮾሬᩱࡢᴗ⎔ቃཬࡧ⤒Ⴀㄢ㢟ࢆ㋃ࡲ࠼ࠊ୧♫ࡀᐃࡋ࡚࠸ࡿᴗ౯್ྥୖ⟇ࡀ
ࡢ⛬ᗘලయⓗࡘᐇ㊶ⓗ࡛࠶ࡿࠊࡑࢀࢆᐇ⾜ࡍࡿࡓࡵᮏᰴᘧࢆᐇࡍ
ࡿᚲせᛶࡀ࠶ࡿࠊᮏᰴᘧࡢᐇࡼࡾ⚄ᮾሬᩱࡢᴗୖࡢࡼ࠺࡞࣓ࣜࢵ
ࢺ࣭ࢹ࣓ࣜࢵࢺࡀ࠶ࡾࠊࡑࡢ⛬ᗘࡣࡢࡼ࠺ᐃࡉࢀࡿ➼ࢆྵࡵ࡚ࠊ⥲ྜⓗ
᳨ドࢆ⾜ࡗࡓࠋ�
ࡑࡢ⤖ᯝࠊᮏ⊂❧ᙺဨጤဨࡋ࡚ࠊୖグࡢ୧♫ࡀᐃࡋ࡚࠸ࡿᮏᰴᘧࡢព
⩏ཬࡧ┠ⓗࡣ≉ྜ⌮࡞Ⅼࡣ࡞ࡃࠊࡲࡓࠊ୧♫ࡀ⚄ᮾሬᩱࡢᴗ౯್ྥୖ⟇
ࡋ࡚ᐃࡋ࡚࠸ࡿྛ⟇ཬࡧ࣓ࣜࢵࢺ࣭ࢹ࣓ࣜࢵࢺࡘ࠸࡚ࡶ≉ẁྜ⌮࡞Ⅼࡣ
��
�
ㄆࡵࡽࢀࡎࠊ࠸ࡎࢀࡶྜ⌮ⓗ࡞᳨ウࡢ⤖ᯝࡋ࡚ṇᙜᛶࡀㄆࡵࡽࢀࡿุ᩿ࡍࡿ
⮳ࡗࡓࠋ�
�
�
ᑠᣓ�
௨ୖࡢࡼ࠺࡞Ⅼࢆ㋃ࡲ࠼ࠊᮏ⊂❧ᙺဨጤဨ࠾࠸࡚ៅ㔜༠㆟ཬࡧ᳨ウࡋࡓ
⤖ᯝࠊᮏᰴᘧࡢ┠ⓗࡣྜ⌮ⓗ࡛࠶ࡾࠊᮏᰴᘧࡣ⚄ᮾሬᩱࡢᴗ౯್ྥୖ
㈨ࡍࡿㄆࡵࡽࢀࡿุ᩿ࡍࡿ⮳ࡗࡓࠋ�
�
�� ᮏᰴᘧࡢྲྀᘬ᮲௳㸦ᮏᰴᘧಀࡿẚ⋡ࡀබṇ࡞ࡶࡢ࡞ࡗ࡚࠸ࡿࢆ
ྵࡴࠋ㸧ࡢබṇᛶ࣭ጇᙜᛶ�
�
-%0$ ࡼࡿᰴᘧẚ⋡⟬ᐃ᭩�
⚄ᮾሬᩱࡣࠊ᪥ᮏሬᩱཬࡧ⚄ᮾሬᩱࡽ⊂❧ࡋࡓ➨୕⪅⟬ᐃᶵ㛵࡛࠶ࡿ -%0$
ࡽᰴᘧẚ⋡⟬ᐃ᭩㸦௨ୗࠕᮏᰴᘧẚ⋡⟬ᐃ᭩ࠖ࠸࠺ࠋ㸧ࢆྲྀᚓࡋ࡚࠸
ࡿࡇࢁࠊᮏ⊂❧ᙺဨጤဨࡣࠊᮏᰴᘧẚ⋡⟬ᐃ᭩࠾࠸࡚⏝࠸ࡽࢀࡓ⟬ᐃ᪉
ἲ➼ࡘ࠸࡚ヲ⣽࡞ㄝ᫂ࢆཷࡅࡓࠋ�
ᮏᰴᘧẚ⋡⟬ᐃ᭩ࡼࢀࡤࠊ᪥ᮏሬᩱࡢᰴᘧ౯್ࡢ⟬ᐃ࠶ࡓࡗ࡚ࡣࠊྠ
♫ࡀᮾிドๆྲྀᘬᡤࣉ࣒ࣛᕷሙୖሙࡋ࡚࠾ࡾࠊᕷሙᰴ౯ࡀᏑᅾࡍࡿࡇࡽࠊ
ᕷሙᰴ౯ᇶ‽ἲࢆ᥇⏝ࡋ࡚࠸ࡿࡢࡇ࡛࠶ࡿࠋ᪉࡛ࠊ⚄ᮾሬᩱࡢᰴᘧ౯್ࡢ⟬
ᐃ࠶ࡓࡗ࡚ࡣࠊྠ♫ࡀᮾிドๆྲྀᘬᡤࢫࢱࣥࢲ࣮ࢻᕷሙୖሙࡋ࡚࠾ࡾࠊᕷሙᰴ
౯ࡀᏑᅾࡍࡿࡇࡽࠊᕷሙᰴ౯ᇶ‽ἲࢆ᥇⏝ࡋࠊࡲࡓࠊᑗ᮶ࡢᴗάືࡢ≧ἣࢆ
ホ౯ᫎࡍࡿࡓࡵࠊࢹࢫ࢝࢘ࣥࢸࢵࢻ࣭࢟ࣕࢵࢩ࣭ࣗࣇ࣮ࣟἲ㸦௨ୗࠕ'&) ἲࠖ
࠸࠺ࠋ㸧ࢆ᥇⏝ࡋ࡚࠸ࡿࡢࡇ࡛࠶ࡿࠋ�
ᮏᰴᘧẚ⋡⟬ᐃ᭩ࡼࢀࡤࠊ᪥ᮏሬᩱࡢᬑ㏻ᰴᘧ㸦௨ୗࠕ᪥ᮏሬᩱᰴᘧࠖ
࠸࠺ࠋ㸧� ᰴᙜࡓࡾࡢᰴᘧ౯್ࢆ � ࡋࡓሙྜࡢホ౯ࣞࣥࢪࡣࠊᕷሙᰴ౯ᇶ‽ἲ
ࡼࢀࡤ ������㹼������ࠊ'&) ἲࡼࢀࡤ ������㹼������ ࡉࢀ࡚࠸ࡿࠋ�
࡞࠾ࠊᮏ⊂❧ᙺဨጤဨࡣࠊᮏᰴᘧẚ⋡⟬ᐃ᭩ෆ࡛⏝࠸ࡽࢀ࡚࠸ࡿྛ♫ࡢᰴ
ᘧ౯್ࡢ⟬ᐃ᪉ἲ➼ࡘ࠸࡚ࠊ-%0$ ࡽࠊホ౯ᡭἲࡢ㑅ᢥࠊᘬ⋡ࡢ⟬ᐃ᰿ᣐࠊ
㠀ᴗ⏝㈨⏘ࡢ⪃࠼᪉➼ࡘ࠸࡚ㄝ᫂ࢆཷࡅࡿࡶࠊ㉁ᛂ⟅ࢆ⾜ࡗࡓࠋࡑࡢ
⤖ᯝࠊ୍⯡ⓗ࡞ホ౯ᐇົ↷ࡽࡋ࡚ྜ⌮࡞Ⅼࡣㄆࡵࡽࢀࡎࠊྜ⌮ⓗ࡞ࡶࡢ࡛࠶ࡿ
ࡇࢆ☜ㄆࡋࡓࠋ�
ࡲࡓࠊᮏ⊂❧ᙺဨጤဨࡣࠊ'&) ἲࡼࡿ⟬ᐃࡢᇶ♏࡞ࡿᮏᴗィ⏬ࡢసᡂ᪉
ἲ࣭సᡂ㐣⛬ཬࡧෆᐜ㸦ᖜ࡞ቑῶ┈ཬࡧࣇ࣮࣭ࣜ࢟ࣕࢵࢩ࣭ࣗࣇ࣮ࣟࡢᖜ࡞ቑ
ῶࢆぢ㎸ࢇ࡛࠸ࡿᴗᖺᗘࡀྵࡲࢀ࡚࠸ࡿ⌮⏤ࠊ⫼ᬒཬࡧྜ⌮ᛶࢆྵࡴࠋ㸧ࡘ࠸
࡚ࡶࠊ⚄ᮾሬᩱཬࡧ -%0$ ࡽヲ⣽࡞ㄝ᫂ࢆཷࡅࠊ㉁ᛂ⟅ࢆ⾜ࡗࡓࠋࡑࡢ⤖ᯝࠊ
ᮏᴗィ⏬ࡢసᡂ᪉ἲ࣭సᡂ㐣⛬ពᛶࢆࢃࡏࡿⅬࡑࡢබṇᛶࢆᐖࡍࡿࡼ
࠺࡞ࡣㄆࡵࡽࢀࡎࠊࡑࡢෆᐜࡘ࠸࡚ࡶ⚄ᮾሬᩱࡢᴗࡢᐇែཬࡧᑗ᮶ࡢぢ
��
�
㏻ࡋࢆ㋃ࡲ࠼ࡓྜ⌮ⓗ࡞ࡶࡢ࡛࠶ࡿࡇࢆ☜ㄆࡋࠊᮏᴗィ⏬ࢆᢎㄆࡋ࡚࠸ࡿࠋ�
�
�
ᮏᰴᘧẚ⋡ࡘ࠸࡚�
� ᮏᰴᘧẚ⋡ࡢጇᙜᛶ�
ᮏᰴᘧ࠾ࡅࡿᙜẚ⋡㸦�㸸������ࠋ௨ୗࠕᮏᰴᘧẚ⋡ࠖ࠸࠺ࠋ㸧
ࡣࠊ⚄ᮾሬᩱᰴᘧ � ᰴᑐࡋ࡚᪥ᮏሬᩱᰴᘧ ������ ᰴࢆᙜࡍࡿࡶࡢ࡛
࠶ࡿࠋᮏᰴᘧẚ⋡ࡣࠊᕷሙᰴ౯ᇶ‽ἲࡼࡿ⟬ᐃ⤖ᯝࡢࣞࣥࢪࡢ⠊ᅖෆ࠶
ࡾࠊࡲࡓࠊ'&) ἲࡼࡿ⟬ᐃ⤖ᯝࡢࣞࣥࢪࡢ୰ኸ್ࢆ㉸࠼ࡿỈ‽࡞ࡗ࡚࠸ࡿࡇ
ࡀㄆࡵࡽࢀࡿࠋ�
ḟࠊᮏᰴᘧẚ⋡ࡢࣉ࣑࣒ࣞ㛵ࡋࠊ���� ᖺ �� ᭶ � ᪥㸦௨ୗࠕᇶ‽᪥ࠖ
࠸࠺ࠋ㸧࠾ࡅࡿᮾிドๆྲྀᘬᡤ࠾ࡅࡿ᪥ᮏሬᩱᰴᘧࡢ⤊್ᮏᰴᘧ
ẚ⋡ࢆࡌ࡚ᚓࡓ್ࡀࠊᇶ‽᪥ࡲ࡛ࡢ⚄ᮾሬᩱᰴᘧࡢ⤊್ẚࡢ⛬ᗘࡢࣉ
࣑࣒ࣞࢆ᭷ࡍࡿࡘ࠸࡚ࡣࠊᇶ‽᪥ࡢ⤊್ᑐࡋ࡚ ����㸣ࡢࣉ࣑࣒ࣞࠊ
ᇶ‽᪥ࡲ࡛ࡢ � ࣨ᭶㛫ࡢ⤊್༢⣧ᖹᆒᑐࡋ࡚ ����㸣ࡢࣉ࣑࣒ࣞࠊᇶ‽᪥ࡲ
࡛ࡢ � ࣨ᭶㛫ࡢ⤊್༢⣧ᖹᆒᑐࡋ࡚ �����㸣ࡢࣉ࣑࣒ࣞࠊᇶ‽᪥ࡲ࡛ࡢ � ࣨ
᭶㛫ࡢ⤊್༢⣧ᖹᆒᑐࡋ࡚ �����㸣ࡢࣉ࣑࣒ࣞࡀࡉࢀ࡚࠸ࡿࠋᇶ‽᪥ࡲ࡛
ࡢ � ࣨ᭶㛫ཬࡧ � ࣨ᭶㛫ࡢ⤊್༢⣧ᖹᆒᑐࡍࡿࣉ࣑࣒ࣞࡘ࠸࡚ࡣࠊ࠸ࡎ
ࢀࡶ ��㸣ࢆ㉸࠼ࡿࣉ࣑࣒ࣞࡀࡉࢀ࡚࠾ࡾࠊ㏆ᖺࡢୖሙ♫ྠኈࡢྠ✀ࡢ
ᰴᘧ࠾ࡅࡿࣉ࣑࣒ࣞࡢỈ‽㸦ὀ㸧↷ࡽࡋ࡚ࡶ୍ᐃࡢỈ‽ホ౯ࡍ
ࡿࡇࡀ࡛ࡁࡿࠋ�
㸦ὀ㸧�⤒῭⏘ᴗ┬సᡂࡢ ���� ᖺ � ᭶ �� ᪥ࡅࠕබṇ࡞ 0 $ ࡢᅾࡾ᪉㛵ࡍࡿ
ᣦ㔪ࠖ㸦௨ୗࠕ0 $ ᣦ㔪ࠖ࠸࠺ࠋ㸧ࡀ⟇ᐃࡉࢀࡓ ���� ᖺ � ᭶ �� ᪥ࡽ
���� ᖺ � ᭶ �� ᪥ࡲ࡛බ⾲ࡉࢀࡓᨭ㓄ᰴࡼࡿୖሙ♫ྠኈࡢᰴᘧ
ࡼࡿᏊ♫㸦⌧㔠ᑐ౯ࡢᰴᘧ௳ � ௳ࠊ᠈
ሗ㐨ࡀ
࠶ࡗࡓ௳ � ௳ࢆ㝖ࡃ �� ௳㸧ಀࡿࠊୖグྠᵝࡢィ⟬ࡼࡿࣉ࣑ࣞ
࣒ࡢᖹᆒ್ࡣࠊࡑࢀࡒࢀ ����㸣㸦බ⾲᪥ࡢ๓Ⴀᴗ᪥㸧ࠊ����㸣㸦බ⾲᪥ࡢ
๓Ⴀᴗ᪥ࡲ࡛ࡢ � ࣨ᭶㛫㸧ࠊ����㸣㸦බ⾲᪥ࡢ๓Ⴀᴗ᪥ࡲ࡛ࡢ � ࣨ᭶㛫㸧
ཬࡧ ����㸣㸦බ⾲᪥ࡢ๓Ⴀᴗ᪥ࡲ࡛ࡢ � ࣨ᭶㛫㸧࡛࠶ࡗࡓࠋ�
�
᪉ࠊᇶ‽᪥⤊್ཬࡧᇶ‽᪥ࡲ࡛ࡢ � ࣨ᭶㛫ࡢ⤊್༢⣧ᖹᆒᑐࡍࡿࣉ࣑ࣞ
࣒ࡘ࠸࡚ࡣࠊࣉ࣑࣒ࣞ⮬యࡣࡉࢀ࡚࠸ࡿࡶࡢࡢࠊྠ✀ࡢࡢᰴᘧ
ẚ㍑ࡋ࡚༑ศ࡞ࣉ࣑࣒ࣞࡀࡉࢀ࡚࠸࡞࠸ࡢホ౯ࡶ⪃࠼ᚓࡿࠋࡋ
ࡋ࡞ࡀࡽࠊ௬ᮏᰴᘧࡀᐇ⾜ࡉࢀ࡞ࡗࡓሙྜࡣࠊ⚄ᮾሬᩱࡣࠊᘬࡁ⥆ࡁ
ୖሙ⥔ᣢࢆ┠ᣦࡋ࡚⤒Ⴀࣜࢯ࣮ࢫࢆᢞୗࡍࡿࡇࡀᐃࡉࢀࠊ᪉࡛ࠊձㄪ㐩࣭
≀ὶࡢඹྠࠊ⏕⏘࣭タഛᢞ㈨ࡢ᭱㐺➼ࠊղ◊✲㛤Ⓨ࣭ᢏ⾡ሗࡢඹ᭷ࠊ㈍
⥙࣭㢳ᐈᇶ┙ࡢ┦ά⏝➼ࠊճᾏእᴗཬࡧ -9 ࣃ࣮ࢺࢼ࣮ࡢ㐃ᦠ➼ࠊմ㈈ົࠊ
��
�
,7ࠊேࠊἲົ➼ࡢ⟶⌮ᶵ⬟ࡢຠ⋡➼࠸ࡗࡓᮏᰴᘧࡼࡿࢩࢼࢪ࣮ཬࡧ
࣓ࣜࢵࢺࢆாཷࡍࡿࡇࡀ࡛ࡁࡎࠊ⚄ᮾሬᩱࡢᴗ౯್ࡢ᭦࡞ࡿྥୖࢆᅗࡿࡇ
ࡀ࡛ࡁ࡞࠸ࠋࡲࡓࠊ௬ᮏᰴᘧࢆᐇ⾜ࡏࡎ⚄ᮾሬᩱࡀ⌧ᅾࡢ⤒Ⴀㄢ㢟
ᑐฎࡋ࡚࠸ࡃࡍࢀࡤࠊ⚄ᮾሬᩱࡢ୍⯡ᰴࡢ┈㈨ࡍࡿ࠸࠺ほⅬࡽ
ࡶ⢭ᰝࢆ⾜࠸࡞ࡀࡽ᥎㐍ࡍࡿᚲせࡀ࠶ࡿࡓࡵࠊពᛮỴᐃࡢᰂ㌾ᛶ࣭㎿㏿ᛶࡢほⅬ
ࡽࡶࠊᴗ⦼ࡸᰴ౯ࡀ㣕㌍ⓗྥୖࡍࡿࡇࡣᐃࡋ࡙ࡽ࠸ゝࢃࡊࡿࢆᚓ࡞
࠸ࠋࡇࢀຍ࠼࡚ࠊᮏᰴᘧࡢᑐ౯ࡣ⌧㔠࡛ࡣ࡞ࡃࠊᰴᘧࢆᑐ౯ࡋ࡚ᐇࡉ
ࢀࡿࡓࡵࠊ⚄ᮾሬᩱࡢᑡᩘᰴࡣࠊᮏᰴᘧࡼࡾࡉࢀࡿ᪥ᮏሬᩱᰴᘧ
ࢆ㏻ࡌ࡚ࠊ
㸦㓄ᙜࡑࡢࡢᰴ㑏ඖࡢாཷ➼ࡢ᪉ἲࡼࡾ㸧ᮏᰴᘧᚋࡢࢩࢼ
ࢪ࣮ຠᯝࢆாཷ࡛ࡁࡿ࠸࠼ࡿࠋ�
ࡇࡢࡼ࠺࡞᳨ウࢆ⤒࡚ࠊᮏ⊂❧ᙺဨጤဨࡋ࡚ࡣࠊᮏᰴᘧẚ⋡ಀࡿᇶ
‽᪥⤊್ཬࡧᇶ‽᪥ࡲ࡛ࡢ � ࣨ᭶㛫ࡢ⤊್༢⣧ᖹᆒᑐࡍࡿࣉ࣑࣒ࣞࡀࠊྠ
✀ࡢ♫ẚ㍑ࡋ࡚ᚲࡎࡋࡶ㧗࠸Ỉ‽࡞࠸ࡋ࡚ࡶࠊ⚄ᮾሬᩱࡢ୍⯡ᰴ
ࡀୖグࡢࡼ࠺࡞ᮏᰴᘧࡼࡿࢩࢼࢪ࣮ཬࡧ࣓ࣜࢵࢺࡢ㑏ඖࢆ༑ศཷࡅ
ࡽࢀࡿྍ⬟ᛶࡀ࠶ࡿࡢ࡛࠶ࢀࡤࠊࡑࡢࡼ࠺࡞㑅ᢥࢆࡍࡿࡇࡀ⚄ᮾሬᩱࡢ୍⯡
ᰴࡗ࡚ࡶᮃࡲࡋ࠸⪃࠼ࡿࡇࡶྜ⌮ᛶࡀ࠶ࡿุ᩿ࡋࡓࠋ�
�
� 㐃⤖Ꮚ♫ࡢ㝿ࡢྲྀᘬ᮲௳ࡢ㛵ಀ�
ᮏ㐃⤖Ꮚ♫ࡢ୍㐃ࡢᡭ⥆ࡋ࡚ᐇࡉࢀࡓᮏබ㛤㈙ࡅࡣࠊ㈙➼ࡢ౯
᱁㸦௨ୗࠕᮏබ㛤㈙౯᱁ࠖ࠸࠺ࠋ㸧ࢆᮏ㐃⤖Ꮚ♫බ⾲᪥ࡢ┤㏆ࡢ⚄ᮾ
ሬᩱᰴᘧࡢᕷሙᰴ౯ࡼࡾ୍ᐃ⛬ᗘࢹࢫ࢝࢘ࣥࢺࡋࡓ౯᱁㸦ᬑ㏻ᰴᘧ � ᰴࡘ
ࡁ �� 㸧ࡋ࡚ᐇࡋ࡚࠾ࡾࠊ⚄ᮾሬᩱࡣ୍⯡ᰴᑐࡋ࡚ࠊᮏබ㛤㈙ࡅ
ࡢᛂເࡣಶࠎࡢᰴุ᩿ጤࡡࡿࡋࠊ⤖ᯝࠊ୍⯡ᰴࡼࡿᮏබ㛤㈙ࡅࡢ
ᛂເࡣ࡞ࡗࡓࠋࡲࡓࠊᮏ㐃⤖Ꮚ♫Ⅼ࠾࠸࡚ࡣࠊ᪥ᮏሬᩱࡣࠊ⚄ᮾሬ
ᩱࡢᏊ♫ࢆᑗ᮶ⓗ࡞㑅ᢥ⫥ࡢ୍ࡘࡋ࡚ㄆ㆑ࡋࠊࡑࡢྍ⬟ᛶࡘ࠸࡚
㆟ㄽࢆࡋ࡚࠸ࡓࡶࡢࡢࠊලయⓗ࡞ᐇ᪉㔪ࡸᮇ➼ࡘ࠸࡚ពᛮỴᐃࢆ⾜ࡗ࡚
࠸࡞ࡗࡓࠋ�
ࡋࡓࡀࡗ࡚ࠊᮏᰴᘧࡣࠊᮏ㐃⤖Ꮚ♫ࡣ୍㐃ࡢྲྀᘬࡢ㛵ಀࡣ࡞ࡃࠊ
ᮏᰴᘧ࠾ࡅࡿྲྀᘬ᮲௳ᮏ㐃⤖Ꮚ♫࠾ࡅࡿྲྀᘬ᮲௳ࢆẚ㍑ࡍࡿࡇ
ࡁ࡞ᐇ┈ࡣ࡞࠸ࡶࡢ⪃࠼ࡽࢀࡿࠋࡶࡗࡶࠊᮏᰴᘧẚ⋡ࡢ๓ᥦ࡞
ࡿ⚄ᮾሬᩱࡢᰴᘧ౯್㸦ࡍ࡞ࢃࡕࠊᇶ‽᪥࠾ࡅࡿᮾிドๆྲྀᘬᡤ࠾ࡅࡿ᪥
ᮏሬᩱᰴᘧࡢ⤊್ᮏᰴᘧẚ⋡ࢆࡌ࡚ᚓࡓ್㸦������ 㸧㸧ࡀࠊ㸦㸧ᮏ
බ㛤㈙౯᱁㸦ᬑ㏻ᰴᘧ � ᰴࡘࡁ �� 㸧ࠊཬࡧ㸦㸧ᮏ➨୕⪅ᙜቑ㈨ࡢ㝿ࡢ
� ᰴᙜࡓࡾࡢⓎ⾜౯㢠㸦��� 㸧ࢆୖᅇࡿࡇࡣࠊᮏᰴᘧẚ⋡ࡢጇᙜᛶࢆ୍
ᛂࡅࡿࡶࡢࡶホ౯ࡋᚓࡿࠋ�
�
���
�
�
΅㐣⛬ࡢᡭ⥆ࡢබṇᛶ�
ᮏᰴᘧẚ⋡ಀࡿ᪥ᮏሬᩱࡢලయⓗ࡞΅㐣⛬ࡣ௨ୗࡢ࠾ࡾ࡛࠶ࡾࠊ
⚄ᮾሬᩱࡣࠊ-%0$ ࢆ❆ཱྀࡋ࡚ࠊᮏ⊂❧ᙺဨጤဨࡀ๓ᢎㄆࡋࡓ΅᪉㔪
ᚑ࠸ࠊᮏᰴᘧẚ⋡ࡘ࠸࡚ࠊ୍⯡ᰴࡢ┈ಖㆤࡢほⅬࡽࡑࡢබṇᛶࢆ☜ಖ
ࡍࡿࡓࡵࡢᐇ㉁ⓗ࡞༠㆟࣭΅ࢆ᪥ᮏሬᩱࡢ㛫࡛」ᩘᅇࢃࡓࡗ࡚⾜ࡗ࡚࠸
ࡿࠋ�
� ึᅇᥦ�
⚄ᮾሬᩱࡣࠊ᪥ᮏሬᩱࡽࠊ���� ᖺ �� ᭶ �� ᪥࡛ࠊᰴᘧẚ⋡ࢆ �㸸
������ ࡍࡿ㸦⚄ᮾሬᩱᰴᘧ � ᰴᑐࡋ࡚᪥ᮏሬᩱᰴᘧ ������ ᰴࢆᙜ
ࡍࡿ㸧᪨ࡢᥦࢆཷࡅࡓࠋࡇࢀᑐࡋࠊᮏ⊂❧ᙺဨጤဨࡣࠊᙜヱẚ⋡ࡢ๓ᥦ
࡞ࡿ⚄ᮾሬᩱࡢᰴᘧ౯್ࡀࠊ⚄ᮾሬᩱᰴᘧࡢ ���� ᖺ �� ᭶ �� ᪥ࡢ⤊್ᑐࡋ࡚
ࣉ࣑࣒ࣞࡀࡰࡉࢀ࡚࠾ࡽࡎࠊ⚄ᮾሬᩱࡢ୍⯡ᰴࡢ┈ಖㆤࡢほⅬࡽ
༑ศ࡞ෆᐜ࡞ࡗ࡚࠸࡞࠸ࡇࠊୖグẚ⋡࡛ࡢᰴᘧࢆᐇ⾜ࡋࡓሙྜࠊ⚄ᮾሬ
ᩱࡢ୍⯡ᰴࡢ┦ᙜᩘࡀ᪥ᮏሬᩱࡢ༢ඖᮍ‶ᰴ࡞ࡿࡇࡀぢ㎸ࡲࢀࠊ
ࡘࠊ᪥ᮏሬᩱࡢᐃḰࡣ♫ἲ ��� ᮲ᐃࡵࡿ༢ඖᮍ‶ᰴࡢ㈙ቑไᗘࡀᏑ
ᅾࡋ࡞࠸ࡇ➼ࡽࠊᙜヱ༢ඖᮍ‶ᰴࡣࠊᮏᰴᘧᚋᮇᚅࡉࢀࡿࢩࢼࢪ࣮
ຠᯝࡸࠊࡑࡢ⤖ᯝࡋ࡚ࡢ᪥ᮏሬᩱᰴᘧࡢ౯᱁ୖ᪼➼ࢆாཷࡍࡿᶵࢆ༑ศ
ᚓࡽࢀ࡞࠸࠾ࡑࢀࡀ࠶ࡿࡇࠊ➨୕⪅⟬ᐃᶵ㛵࡛࠶ࡿ -%0$ ࡼࡿᰴᘧẚ
⋡ࡢヨ⟬⤖ᯝ➼ࢆ㋃ࡲ࠼ࠊᙜヱᥦࡣ⚄ᮾሬᩱࡢ୍⯡ᰴࡗ࡚බṇ࡛࠶ࡿ
ุ᩿࡛ࡁ࡞࠸Ỉ‽࡛࠶ࡿ᪨ࡢពぢࢆ♧ࡋࡓࠋࡇࢀࢆཷࡅ࡚ࠊ⚄ᮾሬᩱࡣࠊ⚄ᮾ
ሬᩱᮏ⊂❧ᙺဨጤဨࡢ㐃ྡࡼࡿ ���� ᖺ �� ᭶ �� ᪥᭩㠃ࢆࡶࡗ࡚ࠊ᪥
ᮏሬᩱᑐࡋࠊᰴᘧẚ⋡ࡢᘬୖࡆཬࡧ⚄ᮾሬᩱࡢ୍⯡ᰴ⏕ࡌࡿࢹ࣓ࣜ
ࢵࢺࡢᙳ㡪ࢆᢚ࠼ࡿࡓࡵࡢᑐ⟇ࡢ⪃ࢆせㄳࡋࡓࠋ�
�
� ➨ � ᅇᥦ�
⚄ᮾሬᩱࡣࠊ᪥ᮏሬᩱࡽࠊ���� ᖺ �� ᭶ �� ᪥࡛ࠊᰴᘧẚ⋡ࢆ �㸸
������ ࡍࡿ㸦⚄ᮾሬᩱᰴᘧ � ᰴᑐࡋ࡚᪥ᮏሬᩱᰴᘧ ������ ᰴࢆᙜ
ࡍࡿ㸧᪨ࡢᥦࠊཬࡧࠊᮏᰴᘧᚋ᪥ᮏሬᩱࡢ༢ඖᮍ‶ᰴ࡞ࡿ⚄ᮾሬ
ᩱࡢ୍⯡ᰴࡣࠊ♫ἲ ��� ᮲ � 㡯➼ᇶ࡙࠸࡚༢ඖᮍ‶ᰴᘧࡢ㈙ྲྀㄳồࡼ
ࡾᕷሙᰴ౯ࢆᇶ‽ࡋࡓ౯᱁࡛౯ࡀྍ⬟࡛࠶ࡿࡇ➼ࡽࠊᮏᰴᘧ㝿
ࡋ࡚㏣ຍⓗ࡞ᑐᛂࢆᐇࡍࡿࡇࡣணᐃࡋ࡚࠸࡞࠸᪨ࡢᅇ⟅ࢆཷࡅࡓࠋࡇࢀ
ᑐࡋࠊᮏ⊂❧ᙺဨጤဨࡣࠊᙜヱẚ⋡ࡢ๓ᥦ࡞ࡿ⚄ᮾሬᩱࡢᰴᘧ౯್ࡀࠊ⚄ᮾ
ሬᩱᰴᘧࡢ ���� ᖺ �� ᭶ �� ᪥ࡢ⤊್ᑐࡋ࡚ⱝᖸࡢࣉ࣑࣒ࣞࡀࡉࢀ࡚࠸ࡿ
ࡶࡢࡢࠊᮍࡔ༑ศ࡞Ỉ‽࡞ࡗ࡚࠾ࡽࡎࠊ⚄ᮾሬᩱࡢ୍⯡ᰴࡢ┈ಖㆤࡢほⅬ
ࡽ༑ศ࡞ෆᐜ࡞ࡗ࡚࠸࡞࠸ࡇࠊᮏᰴᘧࡼࡾ᪥ᮏሬᩱࡢ༢ඖᮍ‶
ᰴ࡞ࡿ⚄ᮾሬᩱࡢ୍⯡ᰴࡀࠊᮏᰴᘧࡢຠຊⓎ⏕᪥௨㝆ࠊ༢ඖᮍ‶ᰴᘧ
���
�
ࡢ㈙ྲྀㄳồࡀ࡛ࡁࡿࡋ࡚ࡶࠊ᪥ᮏሬᩱࡢ㆟Ỵᶒࢆ⾜ࡍࡿࡇࡸࠊ㔠⼥ၟရ
ྲྀᘬᕷሙ࠾࠸࡚༢ඖᮍ‶ᰴᘧࢆ༷ࡍࡿࡇࡀ࡛ࡁࡎࠊࡲࡓࠊ༢ඖᮍ‶ᰴᘧࡢ
㈙ྲྀ౯᱁ࡣࠊᰴྡ⡙⟶⌮ேࡢㄳồ฿㐩᪥ࡢᕷሙᰴ౯ࡢ᭱⤊౯᱁ࡉࢀ࡚࠸
ࡿࡓࡵࠊ༢ඖᮍ‶ᰴࡣᚲࡎࡋࡶㄳồࡢᕷሙᰴ౯ࢆᇶ‽ࡋࡓ㈙ྲྀࡀᐇ⌧࡛
ࡁࡿࢃࡅ࡛ࡣ࡞࠸ࡇ➼ࡽࠊ༑ศ࡞Ỉ‽ࡢᰴᘧẚ⋡ࡢᥦ♧ࢆཷࡅࡿࡇ
ຍ࠼ࠊ༢ඖᮍ‶ᰴࡘ࠸࡚ࡢ㓄៖ࡀ୍ษ࡞࠸ࡼ࠺࡛࠶ࢀࡤࠊᮏᰴᘧಀ
ࡿ༠㆟ࢆ๓㐍ࡉࡏࡿࡇࡀ࡛ࡁ࡞࠸᪨ࡢពぢࢆ♧ࡋࡓࠋࡇࢀࢆཷࡅ࡚ࠊ⚄ᮾሬᩱ
ࡣࠊ⚄ᮾሬᩱᮏ⊂❧ᙺဨጤဨࡢ㐃ྡࡼࡿ ���� ᖺ �� ᭶ �� ᪥᭩㠃ࢆࡶࡗ
࡚ࠊ᪥ᮏሬᩱᑐࡋࠊᰴᘧẚ⋡ࡢᘬୖࡆཬࡧ⚄ᮾሬᩱࡢ୍⯡ᰴ⏕ࡌࡿ
ࢹ࣓ࣜࢵࢺࡢᙳ㡪ࢆᢚ࠼ࡿࡓࡵࡢᑐ⟇ࡢ⪃ࢆᗘせㄳࡋࡓࠋ�
�
࢘� ➨ � ᅇᥦ�
⚄ᮾሬᩱࡣࠊ᪥ᮏሬᩱࡽࠊ���� ᖺ �� ᭶ �� ᪥࡛ࠊձᰴᘧẚ⋡ࢆ �㸸
������ ࡍࡿ㸦⚄ᮾሬᩱᰴᘧ � ᰴᑐࡋ࡚᪥ᮏሬᩱᰴᘧ ������ ᰴࢆᙜ
ࡍࡿ㸧᪨ࠊղᰴᘧẚ⋡ࡣࠊ᪥ᮏሬᩱࡼࡿ ���� ᖺ �� ᭶ �� ᪥ࠕᴗ⦼ண
ࡢಟṇ㛵ࡍࡿ࠾▱ࡽࡏࠖ㸦௨ୗࠕ᪥ᮏሬᩱᴗ⦼ୖ᪉ಟṇࣉࣞࢫ࣮ࣜࣜࢫࠖ
࠸࠺ࠋ㸧ࢆබ⾲ᚋࡢ᪥ᮏሬᩱᕷሙᰴ౯Ỉ‽ࢆ㐺ษᫎࡋࡓࡶࡢࡋࡓ࠸᪨ࠊ
ճ���� ᖺ �� ᭶ �� ᪥ࢆ⟬ᐃᇶ‽᪥ࡋࠊ᪥ᮏሬᩱᰴᘧࡢྠ᪥⤊್ᑐࡋ࡚ୖ
グᰴᘧẚ⋡ࢆࡌ࡚⟬ฟࡉࢀࡿ⚄ᮾሬᩱࡢ � ᰴᙜࡓࡾᰴᘧ౯್ࡣࠊ⚄ᮾሬ
ᩱᰴᘧࡢྠ᪥⤊್୪ࡧ㐣ཤ � ࣨ᭶ࠊ� ࣨ᭶ཬࡧ � ࣨ᭶ࡢྛ⤊್ᖹᆒ್ᑐࡋ
࡚ࠊ࠸ࡎࢀࡶࣉ࣑࣒ࣞࢆࡋࡓỈ‽࡞ࡿ᪨ࠊմ༢ඖᮍ‶ᰴᘧࢆಖ᭷ࡍࡿࡇ
࡞ࡿ⚄ᮾሬᩱᰴࡢᑐᛂࡘ࠸࡚ࠊᙜヱᰴࡢ㑅ᢥ⫥ࢆᣑࡋࠊ౽ᛶࢆྥ
ୖࡉࡏࡿほⅬࡽࠊᮏᰴᘧࡢຠຊⓎ⏕ᚋࠊ᪥ᮏሬᩱࡢᰴࡢពぢ➼ࡶ㋃ࡲ
࠼࡚ࠊ♫ἲ ��� ᮲ᐃࡵࡿ༢ඖᮍ‶ᰴᘧࡢ㈙ቑไᗘࡢᑟධࡘ࠸᳨࡚ウࡍࡿ
᪨ࡢᥦཬࡧᅇ⟅ࢆཷࡅࡓࠋࡇࢀᑐࡋࠊᮏ⊂❧ᙺဨጤဨࡣࠊ᪥ᮏሬᩱᴗ⦼
ୖ᪉ಟṇࣉࣞࢫ࣮ࣜࣜࢫࡢබ⾲ᚋࠊ᪥ᮏሬᩱᰴᘧࡢᕷሙᰴ౯ࡀୖ᪼ࡋ࡚࠸ࡿ
ࡇࢆ㋃ࡲ࠼ࢀࡤࠊ☜᪥ᮏሬᩱࡀ♧ࡍࣉ࣑࣒ࣞࡢ⟬ᐃ᪉ἲࡼࢀࡤࠊ⚄
ᮾሬᩱᰴᘧࡢ⟬ᐃᇶ‽᪥⤊್୪ࡧ㐣ཤ � ࣨ᭶ࠊ� ࣨ᭶ཬࡧ � ࣨ᭶ࡢྛ⤊್༢⣧
ᖹᆒᑐࡋ࡚ࠊ࠸ࡎࢀࡶࣉ࣑࣒ࣞࢆࡋࡓỈ‽࡞ࡿࡶࡢࡢࠊୖグẚ⋡ࡣ
ึᅇᥦ࠾ࡅࡿᰴᘧẚ⋡ࢆᖜୗᅇࡿࡶࡢ࡛࠶ࡾࠊ➨୕⪅⟬ᐃᶵ㛵
ࡼࡿᰴᘧẚ⋡ࡢ⟬ᐃ⤖ᯝ➼ࢆ⥲ྜⓗ຺ࡍࡿࠊ⚄ᮾሬᩱࡢ୍⯡ᰴࡢ
┈ಖㆤࡢほⅬࡽ༑ศ࡞ෆᐜ࡞ࡗ࡚࠸࡞࠸ࡇࠊ᪥ᮏሬᩱࡢᅇ⟅ࡼࢀ
ࡤࠊ♫ἲ ��� ᮲ᐃࡵࡿ༢ඖᮍ‶ᰴᘧࡢ㈙ቑไᗘࡢᑟධࡘ࠸᳨࡚ウࢆ⾜࠺
ࡢࡇ࡛࠶ࡿࡶࡢࡢࠊᑟධࡢ☜ᐇᛶࡀ☜ಖ࡛ࡁ࡚࠸࡞࠸᪨ࡢពぢࢆ♧ࡋࡓࠋࡇ
ࢀࢆཷࡅ࡚ࠊ⚄ᮾሬᩱࡣࠊ⚄ᮾሬᩱᮏ⊂❧ᙺဨጤဨࡢ㐃ྡࡼࡿ ���� ᖺ ��
᭶ �� ᪥᭩㠃ࢆࡶࡗ࡚ࠊ᪥ᮏሬᩱᑐࡋࠊᰴᘧẚ⋡ࡢᘬୖࡆཬࡧ⚄ᮾሬ
���
�
ᩱࡢ୍⯡ᰴ⏕ࡌࡿࢹ࣓ࣜࢵࢺࡢᙳ㡪ࢆᢚ࠼ࡿࡓࡵࡢᑐ⟇ࡢ⪃㸦ලయⓗ
ࡣࠊ᪥ᮏሬᩱᐃᰴ⥲࠾ࡅࡿ༢ඖᮍ‶ᰴᘧࡢ㈙ቑไᗘࡢᑟධ㛵ࡍࡿ
㆟ࡢ㆟ࡘ࠸࡚ࠊᰴᘧዎ⣙᭩࠾ࡅࡿ᪥ᮏሬᩱࡢ⩏ົࡋ࡚ᐃࡵࡓ
ୖ࡛ࠊᮏᰴᘧಀࡿ㐺㛤♧᭩㠃࠾࠸࡚ࡶグ㍕ࢆ⾜࠸ࠊຍ࠼࡚ࠊ᪥ᮏሬ
ᩱࡢ༢ඖᮍ‶ᰴᘧࡢ㈙ྲྀㄳồ㝿ࡋ࡚Ⓨ⏕ࡍࡿᡭᩘᩱࢆせࡍࡿࡇࢆྵ
ࡴࠋ㸧ࢆᗘせㄳࡋࡓࠋ�
�
࢚� ➨ � ᅇᥦ�
⚄ᮾሬᩱࡣࠊ᪥ᮏሬᩱࡽࠊ���� ᖺ �� ᭶ � ᪥࡛ࠊձᰴᘧẚ⋡ࢆ �㸸
���� ࡍࡿ㸦⚄ᮾሬᩱᰴᘧ � ᰴᑐࡋ࡚᪥ᮏሬᩱᰴᘧ ���� ᰴࢆᙜࡍ
ࡿ㸧᪨ࠊղᅇࡢᥦࡀ᪥ᮏሬᩱࡢ᭱⤊ⓗ࡞᮲௳ࢆ♧ࡍࡶࡢ࡛࠶ࡿ᪨ࠊճ᪥
ᮏሬᩱࡢ༢ඖᮍ‶ᰴᘧࡢ㈙ྲྀㄳồ㝿ࡋ࡚Ⓨ⏕ࡍࡿᡭᩘᩱࢆせࡍࡿࡇࡸ
ᐃᰴ⥲࠾ࡅࡿ༢ඖᮍ‶ᰴᘧࡢ㈙ቑไᗘࡢᑟධ㛵ࡍࡿ㆟ࡢ㆟ࢆᰴ
ᘧዎ⣙ୖࡢ᪥ᮏሬᩱࡢ⩏ົࡍࡿࡇࡣᅔ㞴࡛࠶ࡿࡶࡢࡢࠊᮏᰴᘧ
ಀࡿ㐺㛤♧᭩㠃࠾࠸࡚ࠊᮏᰴᘧࡢຠຊⓎ⏕᪥ᚋ㛤ദணᐃࡢ᪥ᮏ
ሬᩱࡢᐃᰴ⥲࡚ࠊ༢ඖᮍ‶ᰴᘧࡢ㈙ቑไᗘࡢᑟධᚲせ࡞ᐃḰኚ᭦㆟
ࢆ㆟ࡍࡿࡇࡘ࠸࡚ࠊ༢ඖᮍ‶ᰴᘧࢆಖ᭷ࡍࡿᰴࡢ≧ἣཬࡧࢽ࣮ࢬ➼
ࡶ㋃ࡲ࠼᳨࡚ウࡍࡿ᪉㔪࡛࠶ࡿ᪨ࢆグ㍕ࡍࡿࡇࡣᑐᛂྍ⬟࡛࠶ࡿ᪨ࡢᅇ⟅ࢆ
ཷࡅࡓࠋࡇࢀᑐࡋࠊᮏ⊂❧ᙺဨጤဨࡣࠊ᪥ᮏሬᩱ⚄ᮾሬᩱࡢᰴ౯ཬࡧᰴ
ᩘ➼ࢆ຺ࡍࡿࠊ༢ඖᮍ‶ᰴᘧࡢ㈙ቑไᗘࡢᑟධࢆ᪥ᮏሬᩱ☜⣙ࡉࡏ
ࡿࡇࡣᅔ㞴ࡀక࠺ࡼ࠺ࡣᛮࢃࢀࡿࡇࢁࡣ☜࠶ࡿࡇ➼ࡽࡍࢀࡤࠊ
᪥ᮏሬᩱࡢୖグᥦࡣ⚄ᮾሬᩱࡢ୍⯡ᰴ୍ᐃࡢ㓄៖ࡀ࡞ࡉࢀࡓࡶࡢ⪃
࠼ࡽࢀࡿࡶࡢࡢࠊࣉ࣑࣒ࣞỈ‽ࡢほⅬࡽࠊ⚄ᮾሬᩱࡢ୍⯡ᰴࡢ┈ಖㆤ
༑ศ࡞ෆᐜࡲ࡛ࡣ⮳ࡗ࡚࠸࡞࠸ࡇࠊ᪥ᮏሬᩱᑐࡋ࡚ࠊ⚄ᮾሬᩱࡢ୍⯡ᰴ
ࡢ┈ಖㆤ㓄៖ࡋࡓࡼࡾ㧗࠸ᰴᘧẚ⋡ࡋ࡚ࠊᮏᰴᘧẚ⋡ࢆ �㸸
������ ࡋࡓ࠸᪨ࡢពྥࢆఏ㐩ࡍࡿࡇࡀ㐺ษ࡛࠶ࡿ᪨ࡢពぢࢆ♧ࡋࡓࠋࡇࢀ
ࢆཷࡅ࡚ࠊ⚄ᮾሬᩱࡣࠊ⚄ᮾሬᩱᮏ⊂❧ᙺဨጤဨࡢ㐃ྡࡼࡿ ���� ᖺ �� ᭶
� ᪥᭩㠃ࢆࡶࡗ࡚ࠊ᪥ᮏሬᩱᑐࡋࠊᰴᘧẚ⋡ࡢᘬୖࡆ㸦ලయⓗࡣࠊ
ᮏᰴᘧẚ⋡ࢆ �㸸������ ࡋࡓ࠸᪨ࡢᕼᮃ㸧ࢆᗘせㄳࡋࡓࠋ�
�
࢜� ➨ � ᅇᥦ�
⚄ᮾሬᩱࡣࠊ᪥ᮏሬᩱࡽࠊ���� ᖺ �� ᭶ � ᪥࡛ࠊᮏᰴᘧẚ⋡ࢆ �㸸
������ ࡍࡿ㸦⚄ᮾሬᩱᰴᘧ � ᰴᑐࡋ࡚᪥ᮏሬᩱᰴᘧ ������ ᰴࢆᙜ
ࡍࡿ㸧ࡇᛂㅙࡍࡿ᪨ࡢ㐃⤡ࢆཷࡅࡓࠋࡇࢀᑐࡋࠊᮏ⊂❧ᙺဨጤဨࡣࠊձ
ᇶ‽᪥࠾ࡅࡿᮾிドๆྲྀᘬᡤ࠾ࡅࡿ᪥ᮏሬᩱᰴᘧࡢ⤊್ᙜヱ᭱⤊ᥦ
ಀࡿᰴᘧẚ⋡ࢆࡌ࡚ᚓࡓ್ࡀࠊ⚄ᮾሬᩱᰴᘧࡢᇶ‽᪥⤊್୪ࡧ㐣ཤ �
���
�
ࣨ᭶ࠊ� ࣨ᭶ཬࡧ � ࣨ᭶ࡢྛ⤊್༢⣧ᖹᆒ್ᑐࡋ୍࡚ᐃࡢࣉ࣑࣒ࣞࡀࡉࢀ
࡚࠸ࡿࡇࠊղᮏᰴᘧẚ⋡ࡀࠊᮏᰴᘧẚ⋡⟬ᐃ᭩࠾ࡅࡿᕷሙᰴ౯ᇶ‽
ἲࡼࡿ⟬ᐃ⤖ᯝࡢࣞࣥࢪࡢ⠊ᅖෆ࠶ࡿࡇࠊࡲࡓࠊ'&) ἲࡼࡿ⟬ᐃ⤖ᯝࡢ
ࣞࣥࢪࡢ⠊ᅖෆ࠶ࡾࠊࡘࠊࣞࣥࢪࡢ୰ኸ್ࢆ㉸࠼ࡿỈ‽࡞ࡗ࡚࠸ࡿࡇ➼
ࡶ㋃ࡲ࠼࡚⥲ྜⓗ⪃៖ࡍࡿࠊᮏᰴᘧẚ⋡ࡣࠊ⚄ᮾሬᩱࡢ୍⯡ᰴࡢ┈
㓄៖ࡉࢀࡓࡶࡢࡋ࡚ྜ⌮ᛶࡀㄆࡵࡽࢀࡿ᪨ࡢពぢࢆ♧ࡋࡓࠋ�
ࡇࢀࢆཷࡅ࡚ࠊ⚄ᮾሬᩱࡣࠊ���� ᖺ �� ᭶ � ᪥᭩㠃ࢆࡶࡗ࡚ࠊ᪥ᮏሬᩱ
ᑐࡋࠊᙜヱ᭱⤊ᥦ㈶ྠࡍࡿࡇࡀྍ⬟࡛࠶ࡿ᪨㸦ࡓࡔࡋࠊ᭱⤊ⓗ࡞ពᛮỴᐃ
ࡣࠊ���� ᖺ �� ᭶ � ᪥㛤ദணᐃࡢ⚄ᮾሬᩱྲྀ⥾ᙺ࠾࠸࡚⾜ࢃࢀࡿணᐃ࡛࠶ࡿ
᪨㸧ࢆ㐃⤡ࡋࡓࠋ�
�
�
ᮏᰴᘧಀࡿࢫ࣮࣒࢟ࡢጇᙜᛶ�
ᮏᰴᘧࡣࠊ⚄ᮾሬᩱࡢᰴᑐࡋ࡚᪥ᮏሬᩱᰴᘧࢆᙜࡍࡿࡶࡢ࡛
࠶ࡿࡇࢁࠊ⚄ᮾሬᩱࡢᰴࡀ୰㛗ᮇⓗ࡞⚄ᮾሬᩱࡢᴗ౯್ࡢྥୖࢆ᪥ᮏሬ
ᩱᰴᘧࢆ㏻ࡌ࡚ᑗ᮶ⓗாཷࡍࡿࡇࡀ࡛ࡁࡿ࠸࠺Ⅼ࠾࠸࡚ࠊᰴᘧࡣ⚄
ᮾሬᩱࡢᰴࡗ࡚ࡶ࣓ࣜࢵࢺࡢ࠶ࡿᡭἲ࡛࠶ࡿホ౯࡛ࡁࡿࠋࡲࡓࠊ⚄ᮾሬᩱ
࠾࠸࡚ࡣ ���� ᖺ � ᭶ᮇࡼࡾ↓㓄ᙜࡢ≧ἣࡀ⥅⥆ࡋ࡚࠸ࡿࡇࢁࠊ⚄ᮾሬᩱࡢ୍
⯡ᰴࡣࠊᮏᰴᘧᚋ࠾࠸࡚ࡣࠊ᪥ᮏሬᩱࡢᰴࡋ࡚ࠊ᪥ᮏሬᩱࡀ⌧ᅾ
ᐇࡋ࡚࠸ࡿ㓄ᙜࡑࡢࡢᰴ㑏ඖࢆாཷࡍࡿᶵࢆᚓࡽࢀࡿᮇᚅࡀ࠶ࡿࡇࡶ
⚄ᮾሬᩱࡢ୍⯡ᰴ࠾ࡅࡿ⤒῭ⓗ࣓ࣜࢵࢺࡢ୍ࡘࡋ࡚⪃࠼ࡽࢀࡿࠋ�
᪉࡛ࠊᮏᰴᘧẚ⋡ࢆ๓ᥦࡍࡿࠊ����� ᰴᮍ‶ࡢ⚄ᮾሬᩱᰴᘧࢆಖ᭷ࡋ
࡚࠸ࡿ⚄ᮾሬᩱࡢᑡᩘᰴࡣࠊᮏᰴᘧࡼࡾ᪥ᮏሬᩱࡢ༢ඖᮍ‶ᰴᘧࡢࡳ
ࢆಖ᭷ࡍࡿࡇ࡞ࡿ㸦࡞࠾ࠊ�� ᰴ௨ୗࡢ⚄ᮾሬᩱᰴᘧࢆಖ᭷ࡍࡿᑡᩘᰴࡣࠊ
᪥ᮏሬᩱᰴᘧࡢᙜ࡚ࢆཷࡅࡎࠊ➃ᩘࡢฎ⌮ࡼࡾ㔠㖹ࡢࢆཷࡅࡿࡇ
࡞ࡿࠋ㸧ࠋᙜヱ༢ඖᮍ‶ᰴࡣࠊᮏᰴᘧᚋᮇᚅࡉࢀࡿࢩࢼࢪ࣮ຠᯝࡸࠊࡑࡢ⤖
ᯝࡋ࡚ࡢ᪥ᮏሬᩱᰴᘧࡢ౯᱁ୖ᪼➼ࢆாཷࡍࡿᶵࢆ༑ศᚓࡽࢀ࡞࠸࠾ࡑ
ࢀࡀ࠶ࡿࠋࡶࡗࡶࠊ⚄ᮾሬᩱࡢᏊ♫ࡀබ㛤㈙ࡅཬࡧࡑࡢᚋࡢᰴᘧేྜ
ཪࡣᰴᘧΏㄳồࡢ᪉ἲࡼࡾ⾜ࢃࢀࡿሙྜ㸦ࡍ࡞ࢃࡕࠊ⚄ᮾሬᩱࡢᰴࡀཷࡅྲྀ
ࡿᑐ౯ࡀ⌧㔠࡛࠶ࡿሙྜ㸧ẚ㍑ࡍࡿࠊᰴᘧࡢሙྜࡣࠊ⚄ᮾሬᩱࡢ୍⯡ᰴ
ࡀ᪥ᮏሬᩱࡢ༢ඖᮍ‶ᰴ࡞ࡗࡓࡋ࡚ࡶࠊᑗ᮶ࡢ᪥ᮏሬᩱᰴᘧࡢ౯᱁ୖ
᪼ศࡢࣜࢱ࣮ࣥࢆாཷࡍࡿᶵࡣࡉࢀ࡚࠸ࡿ㸦᪥ᮏሬᩱᰴᘧࡢᕷሙᰴ౯ࡀ
ୖ᪼ࡋࡓ㝿ࠊᰴྡ⡙⟶⌮ேࡢㄳồ฿㐩᪥ࡢᕷሙᰴ౯ࡢ᭱⤊౯᱁ࢆᇶ‽ࡋ
࡚ࠊ᪥ᮏሬᩱᑐࡋ࡚༢ඖᮍ‶ᰴᘧࡢ㈙ྲྀㄳồࢆ⾜࠺ࡇࡶྍ⬟࡛࠶ࡿࠋ㸧࠸
࠼ࡿࠋຍ࠼࡚ࠊ᪥ᮏሬᩱࡣࠊ༢ඖᮍ‶ᰴᘧࡘ࠸࡚ࠊᰴ࠾ࡅࡿ㈙ቑ㟂せ୪ࡧ
᪥ᮏሬᩱ⏕ࡌ࠺ࡿᰴᘧົཬࡧ⟶⌮ࢥࢫࢺ➼ࡢࢆ⪃៖ࡢୖࠊᚋࠊ♫
ἲ ��� ᮲ᐃࡵࡿ༢ඖᮍ‶ᰴᘧࡢ㈙ቑไᗘࢆᑟධࡍࡿྰࡘ࠸᳨࡚ウࡍࡿண
���
�
ᐃࡢࡇ࡛࠶ࡾࠊ௬᪥ᮏሬᩱ࠾࠸࡚ࠊ༢ඖᮍ‶ᰴᘧࡢ㈙ቑไᗘࢆᑟධࡋࡓ
ሙྜࡣࠊ༢ඖᮍ‶ᰴ࡛࠶ࡗ࡚ࡶࠊ᪥ᮏሬᩱᰴᘧࡢ౯᱁ୖ᪼➼ࢆாཷࡍࡿᶵ
ࢆ༑ศᚓࡽࢀࡿࡇ࡞ࡿࠋ�
ࡋࡓࡀࡗ࡚ࠊ⚄ᮾሬᩱࡢᏊ♫ࡢ᪉ἲࡋ࡚ᰴᘧࡀ㑅ᢥࡉࢀࡓࡇ
ࡣࠊ࢟ࣕࢵࢩࣗ࢘ࢺࡼࡿࢫ࣮࣒࢟ࢆ㑅ᢥࡋࡓሙྜẚ㍑ࡋ࡚ࠊ⚄ᮾሬᩱࡢ୍⯡
ᰴࡼࡿᑗ᮶ࡢᮇᚅ㓄៖ࢆࡋࡓࡶࡢホ౯ࡋᚓࡿࠋ�
�
�
ᑠᣓ�
௨ୖࡢⅬࢆ㋃ࡲ࠼ࠊᮏ⊂❧ᙺဨጤဨ࠾࠸࡚ࠊៅ㔜༠㆟ཬࡧ᳨ウࡋࡓ⤖ᯝࠊ
ᮏᰴᘧࡢᐇ᪉ἲ࣭ࢫ࣮࣒࢟୪ࡧᮏᰴᘧࡼࡾ⚄ᮾሬᩱࡢ୍⯡ᰴ
ࡉࢀࡿᑐ౯ࡢ✀㢮ཬࡧᮏᰴᘧࡢྲྀᘬ᮲௳㸦ᮏᰴᘧಀࡿẚ⋡ࢆ
ྵࡴࠋ㸧ࡣබṇࡘጇᙜ࡛࠶ࡿㄆࡵࡽࢀࡿุ᩿ࡍࡿ⮳ࡗࡓࠋ�
�
�� ᮏᰴᘧࡢᡭ⥆ࡢබṇᛶ�
�
ᮏ⊂❧ᙺဨጤဨࡢㅎၥ�
� ㅎၥᮇ�
⚄ᮾሬᩱࡣࠊ���� ᖺ � ᭶ �� ᪥ࠊ᪥ᮏሬᩱࡽᮏᥦࢆཷࡅࠊ���� ᖺ � ᭶
�� ᪥㛤ദࡢ⚄ᮾሬᩱࡢྲྀ⥾ᙺỴ㆟ࡼࡾࠊᮏᰴᘧಀࡿྲྀ⥾ᙺࡢពᛮ
Ỵᐃៅ㔜ࢆᮇࡋࠊࡲࡓࠊྲྀ⥾ᙺࡢពᛮỴᐃ㐣⛬࠾ࡅࡿពᛶཬࡧ┈┦
ࡢ࠾ࡑࢀࢆ㝖ࡋࠊࡑࡢබṇᛶࢆᢸಖࡍࡿࡓࡵࠊᙜ⫋ࡽ � ྡࡼࡾᵓᡂࡉࢀࡿᮏ
⊂❧ᙺဨጤဨᑐࡋࠊᮏㅎၥ㡯ࡘ࠸࡚ㅎၥࡋࡓࠋ�
⚄ᮾሬᩱࡢᮏᥦࡢཷ㡿ࡽᮏ⊂❧ᙺဨጤဨࡢㅎၥࡲ࡛ � ࣨ᭶⛬ᗘࡢᮇ
㛫ࡀ࠶ࡿࡶࡢࡢࠊ⚄ᮾሬᩱࡣࡇࡢ㛫࠾࠸࡚ࠊᮏㅎၥ㡯ࢆㅎၥࡍࡿྜ㆟యࡢ᳨
ウ㸦ᖖタࡢᮏ⊂❧ᙺဨጤဨㅎၥࢆ⾜࠺ࠊู㏵ࠊ≉ูጤဨࢆタ⨨ࡍࡿࢆ
ྵࡴࠋ㸧ࠊᮏᥦࡢ᳨ウᚲせ࡞ࡿ♫ෆయไࡢᵓ⠏ࠊእ㒊ᑓ㛛ᐙࢻࣂࢨ࣮ࡢ
㑅ᐃཬࡧྲྀ⥾ᙺ㛤ദ᪥⛬ࡢㄪᩚ➼ࡢᐇົⓗ࡞᳨ウసᴗࢆ⾜ࡗ࡚࠾ࡾࠊྍཬⓗ
㏿ࡸ࡞ᮏ⊂❧ᙺဨጤဨࡢㅎၥࢆ⾜࠺ࡃྜ⌮ⓗ࡞ດຊࢆࡋ࡚࠸ࡓࡶࡢ
ホ౯ࡍࡿࡇࡀ࡛ࡁࡿࠋࡲࡓࠊᮏ⊂❧ᙺဨጤဨࡢㅎၥࡣࠊ᪥ᮏሬᩱࡢᮏ
ᰴᘧಀࡿྲྀᘬ᮲௳➼ࡢ΅ඛ❧ࡗ࡚⾜ࢃࢀ࡚࠾ࡾࠊ࠼ࡤࠊᮏ⊂❧ᙺဨ
ጤဨࡢㅎၥⅬ࠾࠸࡚ྲྀᘬ᮲௳➼ࡀᐇୖỴᐃࡉࢀ࡚࠾ࡾࠊࡇࢀࢆそࡍ
ࡇࡀᅔ㞴࡞≧ែ⮳ࡗ࡚࠸ࡓ࠸࠺ࡼ࠺࡞ࡣᏑᅾࡋ࡞࠸ࠋ�
௨ୖࢆ㋃ࡲ࠼ࢀࡤࠊᮏ⊂❧ᙺဨጤဨࡢㅎၥᮇࡘ࠸࡚ࠊᮏ⊂❧ᙺဨጤဨ
ࡢᐇຠᛶࢆ㜼ᐖࡍࡿ≉ẁࡢࡣᏑᅾࡋ࡞࠸ࡶࡢ⪃࠼ࡽࢀࡿࠋ�
�
� ጤဨࡢᵓᡂ࣭⊂❧ᛶ�
ᮏ⊂❧ᙺဨጤဨࡣࠊ⚄ᮾሬᩱࡢ⊂❧♫እྲྀ⥾ᙺ � ྡཬࡧ⊂❧♫እ┘ᰝᙺ � ྡ
���
�
ࡢィ � ྡࡼࡗ࡚ᵓᡂࡉࢀࠊ࠸ࡎࢀࡢጤဨࡶࠊ⚄ᮾሬᩱཬࡧ᪥ᮏሬᩱ୪ࡧᮏ
ᰴᘧࡢᡂྰࡢ㛵ಀ࡛ࡶ⊂❧ᛶࢆ᭷ࡋ࡚࠸ࡿࠋ࡞࠾ࠊᮏ⊂❧ᙺဨጤဨࡢጤ
ဨࡢሗ㓘ࡣࠊᮏᰴᘧࡢᡂྰཬࡧ⟅⏦ෆᐜࢃࡽࡎᨭᡶࢃࢀࡿᅛᐃሗ㓘
ࡢࡳ࡛࠶ࡾࠊᮏᰴᘧࡢᡂ❧➼ࢆ᮲௳ᨭᡶࢃࢀࡿᡂຌሗ㓘ࡣྵࡲࢀ࡚࠸࡞
࠸ࠋ�
ᮏ⊂❧ᙺဨጤဨࡣࠊ⚄ᮾሬᩱࡀ᪥ᮏሬᩱࡢ㐃⤖Ꮚ♫࡞ࡗࡓక࠸ࠊ
���� ᖺ � ᭶ �� ᪥㛤ദࡢ⚄ᮾሬᩱྲྀ⥾ᙺỴ㆟ᇶ࡙ࡁタ⨨ࡉࢀࡓᖖタࡢᶵ㛵
࡛࠶ࡿࠋ⚄ᮾሬᩱࡋ࡚ࡣࠊᮏ⊂❧ᙺဨጤဨࡀࠊ᪥ᮏሬᩱཬࡧࡑࡢࢢ࣮ࣝࣉ
♫⚄ᮾሬᩱᑡᩘᰴࡢ㛫┈┦ࡀ⏕ࡌࡿྍ⬟ᛶࡀ࠶ࡿ㔜せ࡞ྲྀᘬ࣭⾜
Ⅽࡘ࠸࡚ࠊᑡᩘᰴಖㆤࡢほⅬࡽᑂ㆟᳨࣭ウࢆ⾜࠺ࡇࢆ┠ⓗࡍࡿᶵ㛵࡛
࠶ࡿࡇ➼ࡽࠊᮏᰴᘧࡘ࠸࡚ࡶᮏ⊂❧ᙺဨጤဨㅎၥࡍࡿࡇࡀ㐺
ษ࡛࠶ࡿุ᩿ࡋ࡚࠸ࡿࠋ�
௨ୖࡽࡍࢀࡤࠊᮏ⊂❧ᙺဨጤဨ࠾ࡅࡿྛጤဨࡢ⊂❧ᛶࢆ࠺ࡁ⏤
ࡣㄆࡵࡽࢀ࡞࠸ࠋ�
�
࢘� ⚄ᮾሬᩱྲྀ⥾ᙺ࠾ࡅࡿᮏ⟅⏦᭩ࡢ⨨࡙ࡅ�
⚄ᮾሬᩱࡣࠊ⚄ᮾሬᩱྲྀ⥾ᙺ࠾࠸࡚ࠊᮏᰴᘧ㛵ࡍࡿពᛮỴᐃࢆ⾜࠺
㝿ࡋ࡚ࠊᮏ⟅⏦᭩࠾࠸࡚♧ࡉࢀࡓᮏ⊂❧ᙺဨጤဨࡢពぢࢆ᭱㝈ᑛ㔜ࡍ
ࡿࡶࡢࡋࠊᮏ⊂❧ᙺဨጤဨࡀᮏᰴᘧࡢᐇཪࡣྲྀᘬ᮲௳ࢆጇᙜ࡛࡞࠸
ุ᩿ࡋࡓሙྜࡣࠊ⚄ᮾሬᩱྲྀ⥾ᙺࡣࠊᮏᰴᘧ㈶ྠࡋ࡞࠸ࡶࡢࡍࡿ
᪨ࢆỴ㆟ࡋ࡚࠾ࡾࠊᮏ⊂❧ᙺဨጤဨࡢุ᩿ෆᐜࡢᐇຠᛶࡢ☜ಖ㓄៖ࡀ࡞ࡉ
ࢀ࡚࠸ࡿࠋ�
�
࢚� ᚲせ࡞ᶒ㝈ࡢ�
⚄ᮾሬᩱࡣࠊᮏ⊂❧ᙺဨጤဨᑐࡋ࡚ࠊ
㸦㸧⚄ᮾሬᩱࡢᙺ⫋ဨࡽࠊᮏᰴ
ᘧࡢ᳨ウཬࡧุ᩿ᚲせ࡞ሗࢆཷ㡿ࡍࡿᶒ㝈㸦ᮏ⊂❧ᙺဨጤဨࡢฟ
ᖍࢆせồࡍࡿᶒ㝈ࢆྵࡴࠋ㸧
ࠊ
㸦㸧ᮏᰴᘧࡢྲྀᘬ᮲௳ཬࡧ΅㐣⛬ᐇ㉁ⓗ
㛵ࡍࡿᶒ㝈㸦⚄ᮾሬᩱᑐࡋ࡚ពぢࢆ㏙ཪࡣᣦ♧ⱝࡋࡃࡣせㄳࢆ⾜࠺ࡇ
ཬࡧᮏ⊂❧ᙺဨጤဨ⮬ࡽ᪥ᮏሬᩱ΅ࢆ⾜࠺ࡇࢆྵࡴࠋ㸧
ࠊ
㸦࢘㸧⚄ᮾ
ሬᩱࡀ㑅௵ࡋࡓ⚄ᮾሬᩱࡢእ㒊ᑓ㛛ᐙࢻࣂࢨ࣮ࢆᢎㄆ㸦㏣ㄆࢆྵࡴࠋ㸧ࡍࡿ
ᶒ㝈ࠊ
㸦࢚㸧⚄ᮾሬᩱࡢ㈝⏝㈇ᢸ࠾࠸࡚ࠊ⚄ᮾሬᩱࡢእ㒊ᑓ㛛ᐙࢻࣂࢨ࣮
ຓゝࢆồࡵࡿᶒ㝈ࠊ
㸦࢜㸧⚄ᮾሬᩱࡢ㈝⏝㈇ᢸ࠾࠸࡚ࠊᚲせᛂࡌࠊ⮬ࡽࡢ
እ㒊ᑓ㛛ᐙࢻࣂࢨ࣮ࢆ㑅௵ࡋࠊຓゝࢆồࡵࡿᶒ㝈ࠊ
㸦࢝㸧ࡑࡢࠊᮏ⊂❧ᙺ
ဨጤဨࡢ⫋ົࢆ⿵ຓࡍࡿ⪅ࡢᢎㄆ➼ࠊᮏ⊂❧ᙺဨጤဨࡀᮏᰴᘧ㛵ࡍ
ࡿ᳨ウཬࡧุ᩿㝿ࡋ࡚ᚲせㄆࡵࡿ㡯ࡘ࠸࡚ࡢᶒ㝈ࢆࡍࡿࡇࢆỴ
㆟ࡋ࡚࠸ࡿࠋࡇࢀࢆཷࡅ࡚ࠊᮏ⊂❧ᙺဨጤဨࡣࠊ⚄ᮾሬᩱࡀ㑅௵ࡋࡓእ㒊ᑓ㛛
���
�
ᐙࢻࣂࢨ࣮㸦-%0$ࠊỤᶫἲᚊົᡤཬࡧ %'2�&D1�)$6 ྜྠ♫㸧ࡘࡁࠊ
⊂❧ᛶཬࡧᑓ㛛ᛶၥ㢟ࡀ࡞࠸ࡇࢆ☜ㄆࡢୖࠊ⚄ᮾሬᩱࡢࢻࣂࢨ࣮ࡋ
࡚ᢎㄆࡋࠊࡲࡓࠊୖグ �� � グ㍕ࡢ࠾ࡾࠊᮏᰴᘧẚ⋡ಀࡿ᪥ᮏሬᩱ
ࡢ΅㐣⛬ᐇ㉁ⓗ㛵ࡋ࡚࠸ࡿࠋ�
�
࢜� ᑠᣓ�
௨ୖࡢ࠾ࡾࠊᮏ⊂❧ᙺဨጤဨࡣࠊ⊂❧ᛶࢆ᭷ࡋࠊࡘ⊂❧ᙺဨጤဨࡋ
࡚ࡢᐇຠᛶࢆ㧗ࡵࡿࡓࡵࡢᐇົୖࡢᥐ⨨ࡀ᥇ࡽࢀࡓୖ࡛ࠊᮏㅎၥ㡯ࡘࡁ᳨
ウุ࣭᩿ࢆ⾜ࡗ࡚࠸ࡿࠋ�
�
�
⚄ᮾሬᩱࡢ᳨ウ᪉ἲ�
⚄ᮾሬᩱࡀᮏᰴᘧࡘ࠸᳨࡚ウࡍࡿ࠶ࡓࡗ࡚ࡣࠊ᪥ᮏሬᩱཬࡧ⚄ᮾሬ
ᩱࡽ⊂❧ࡋࠊࡘࠊྠ✀ࡘ࠸࡚ᐇ⦼ࡶ࠶ࡾࠊᑓ㛛ᛶࢆ᭷ࡍࡿࣇࢼࣥࢩ
࣭ࣕࣝࢻࣂࢨ࣮ཬࡧ➨୕⪅⟬ᐃᶵ㛵࡛࠶ࡿ -%0$ࠊ࣮࣭ࣜ࢞ࣝࢻࣂࢨ࣮࡛
࠶ࡿỤᶫἲᚊົᡤ୪ࡧィ࣭⛯ົࢻࣂࢨ࣮࡛࠶ࡿ %'2� &D1� )$6 ྜྠ
♫ࡽຓゝ࣭ពぢ➼ࢆᚓ࡞ࡀࡽࠊ⚄ᮾሬᩱࡢᴗ౯್ྥୖཬࡧᰴඹྠࡢ┈ࡢほ
Ⅼࡽࠊᮏᰴᘧẚ⋡ࢆࡣࡌࡵࡍࡿᮏᰴᘧࡢྲྀᘬ᮲௳ࡢබṇᛶཬࡧᮏᰴ
ᘧࡢ୍㐃ࡢᡭ⥆ࡢබṇᛶ࠸ࡗࡓⅬࡘ࠸࡚ៅ㔜᳨ウཬࡧ༠㆟ࢆ⾜ࡗ࡚࠸
ࡿࠋ�
࡞࠾ࠊᮏᰴᘧಀࡿ -%0$ ᑐࡍࡿሗ㓘ࡣࠊᮏᰴᘧࡢᡂ❧➼ࢆ᮲௳
ᨭᡶࢃࢀࡿᡂຌሗ㓘ࡀྵࡲࢀ࡚࠸ࡿࡀࠊྠ✀ࡢྲྀᘬ࠾ࡅࡿ୍⯡ⓗ࡞ᐇົ័⾜➼
ࢆ຺ࡍࡿࠊᮏ⊂❧ᙺဨጤဨࡋ࡚ࡣࠊᮏᰴᘧࡢࢆ᮲௳ᨭᡶࢃࢀࡿ
ᡂຌሗ㓘ࡀྵࡲࢀ࡚࠸ࡿࡇࢆࡶࡗ࡚ࠊ-%0$ ࡢ⊂❧ᛶࡀྰᐃࡉࢀࡿࡶࡢ࡛ࡣ࡞࠸
ุ᩿ࡋ࡚࠸ࡿࠋࡲࡓࠊᮏᰴᘧಀࡿỤᶫἲᚊົᡤࡢሗ㓘ࡣࠊᮏᰴᘧ
ࡢᡂྰࢃࡽࡎࠊ✌ാ㛫㛫༢౯ࢆࡌ࡚⟬ฟࡍࡿࡶࡢࡉࢀ࡚࠾ࡾࠊᮏ
ᰴᘧࡢᡂ❧➼ࢆ᮲௳ᨭᡶࢃࢀࡿᡂຌሗ㓘ࡣྵࡲࢀ࡚࠸࡞࠸ࠋ�
�
�
⊂❧ࡋࡓ➨୕⪅⟬ᐃᶵ㛵ࡽࡢ⟬ᐃ᭩ࡢྲྀᚓ�
⚄ᮾሬᩱࡣࠊᮏᰴᘧ㛵ࡍࡿỴᐃࢆ⾜࠺㝿ࡋ࡚ࠊ᪥ᮏሬᩱཬࡧ⚄ᮾሬᩱ
ࡽ⊂❧ࡋࡓࣇࢼࣥࢩ࣭ࣕࣝࢻࣂࢨ࣮ཬࡧ➨୕⪅⟬ᐃᶵ㛵࡛࠶ࡿ -%0$
ᑐࡋ࡚ࠊᰴᘧẚ⋡ࡢ⟬ᐃࢆ౫㢗ࡋࠊ���� ᖺ �� ᭶ � ᪥࡛ࠊᮏᰴᘧẚ⋡⟬
ᐃ᭩ࢆྲྀᚓࡋࡓࠋ࡞࠾ࠊ-%0$ ࡣࠊ᪥ᮏሬᩱཬࡧ⚄ᮾሬᩱࡢ㛵㐃ᙜ⪅ࡣヱᙜ
ࡏࡎࠊᮏᰴᘧ㛵ࡋ࡚㔜せ࡞ᐖ㛵ಀࢆ᭷ࡋ࡚࠸࡞࠸ࠋ�
࡞࠾ࠊ⚄ᮾሬᩱࡣࠊ-%0$ ࡽᮏᰴᘧẚ⋡ࡀ⚄ᮾሬᩱࡢᰴࡗ࡚㈈ົⓗ
ぢᆅࡼࡾබṇ࡛࠶ࡿ᪨ࡢពぢ᭩㸦ࣇ࢙ࢿࢫ࣭࢜ࣆࢽ࢜ࣥ㸧ࡣྲྀᚓࡋ࡚࠸࡞࠸ࠋࡶ
ࡗࡶࠊ0 $ ᣦ㔪࠾࠸࡚ࡶࠊᡃࡀᅜ࠾࠸࡚ࡣࠊࣇ࢙ࢿࢫ࣭࢜ࣆࢽ࢜ࣥࡢබṇ
���
�
ᛶᢸಖᥐ⨨ࡋ࡚ࡢ᭷ຠᛶࡣࡼࡾ୍ᵝ࡛ࡣ࡞ࡃࠊࡑࡢせྰࡘ࠸࡚ࡣࠊಶู
ࡢ 0 $ ࠾ࡅࡿලయⓗ࡞≧ἣࢆ㋃ࡲ࠼ุ࡚᩿ࡍࡿࡇࡀ㐺ᙜࡉࢀ࡚࠸ࡿࡇࢁࠊ
ᮏ⊂❧ᙺဨጤဨࡋ࡚ࡣࠊᮏ௳ࡢ᳨ウ㐣⛬↷ࡽࡋࡓ⤖ᯝࠊᮏㅎၥ㡯ࢆ᳨ウࡍ
ࡿࡓࡵࠊࣇ࢙ࢿࢫ࣭࢜ࣆࢽ࢜ࣥࡢྲྀᚓࡀᚲ㡲࡛࠶ࡿ⪃࠼ࡿࡁࡲ࡛ࡣㄆ
ࡵࡽࢀࡎࠊࣇ࢙ࢿࢫ࣭࢜ࣆࢽ࢜ࣥࢆྲྀᚓࡋ࡞ࡃࡶࠊᮏᰴᘧಀࡿ΅㐣⛬
ཬࡧពᛮỴᐃ⮳ࡿᡭ⥆ࡢබṇᛶࡀྰᐃࡉࢀࡿࡶࡢ࡛ࡣ࡞࠸ᛮᩱࡍࡿࠋ�
�
�
⊂❧ࡋࡓἲᚊົᡤࡽࡢຓゝ�
⚄ᮾሬᩱࡣࠊᮏᰴᘧ㛵ࡍࡿ࣮࣭ࣜ࢞ࣝࢻࣂࢨ࣮ࡋ࡚ࠊỤᶫἲᚊ
ົᡤࢆ㑅௵ࡋࠊᮏᰴᘧ࠾࠸࡚ᡭ⥆ࡢබṇᛶࢆ☜ಖࡍࡿࡓࡵㅮࡌࡿࡁᥐ
⨨ࠊᮏᰴᘧࡢㅖᡭ⥆ཬࡧྲྀ⥾ᙺࡢពᛮỴᐃࡢ᪉ἲ࣭㐣⛬➼ࡘ࠸࡚ἲⓗ࡞ほ
Ⅼࡽຓゝࢆᚓ࡚࠸ࡿࠋ࡞࠾ࠊỤᶫἲᚊົᡤࡣࠊ᪥ᮏሬᩱཬࡧ⚄ᮾሬᩱࡢ㛵
㐃ᙜ⪅ࡣヱᙜࡏࡎࠊᮏᰴᘧ㛵ࡋ࡚㔜せ࡞ᐖ㛵ಀࢆ᭷ࡋ࡚࠸࡞࠸ࠋ�
�
�
⚄ᮾሬᩱࡼࡿ༠㆟࣭΅�
⚄ᮾሬᩱࡣࠊᮏ⊂❧ᙺဨጤဨࡀ๓ᢎㄆࡋࡓ΅᪉㔪ᚑ࠸ࠊᮏᰴᘧẚ
⋡ࡘ࠸࡚ࠊ୍⯡ᰴࡢ┈ಖㆤࡢほⅬࡽࡑࡢබṇᛶࢆ☜ಖࡍࡿࡓࡵࡢᐇ㉁ⓗ
࡞༠㆟࣭΅ࢆ᪥ᮏሬᩱࡢ㛫࡛」ᩘᅇࢃࡓࡗ࡚⾜ࡗ࡚࠸ࡿࠋලయⓗࡣࠊୖ
グ �� � グ㍕ࡢ࠾ࡾࠊ⚄ᮾሬᩱࡣࠊ-%0$ ࢆ❆ཱྀࡋ࡚ࠊᮏ⊂❧ᙺဨጤဨࡀᢎ
ㄆࡋࡓᅇ⟅᭩ࡢᥦ♧ࢆྵࡴᮏᰴᘧẚ⋡ಀࡿ΅ࢆ᪥ᮏሬᩱࡢࣇࢼࣥ
ࢩ࣭ࣕࣝࢻࣂࢨ࣮࡛࠶ࡿᰴᘧ♫୕⳻ 8)- 㖟⾜ࢥ࣮࣏࣮ࣞࢺሗႠᴗ㒊㈈ົ
㛤Ⓨᐊࢆࡋ࡚ � ᅇᐇࡋࠊ΅ࡢ⤖ᯝࠊึᅇᥦ࡛ࡣࠊ���� ᖺ �� ᭶ �� ᪥࠾
ࡅࡿ᪥ᮏሬᩱᰴᘧࡢ⤊್ᑐࡋ࡚ᰴᘧẚ⋡ࢆࡌ࡚⟬ฟࡉࢀࡿ⚄ᮾሬᩱࡢ
� ᰴᙜࡓࡾᰴᘧ౯್ࡣࠊ⚄ᮾሬᩱᰴᘧࡢྠ᪥⤊್ᑐࡋ࡚ ����㸣ࠊ㐣ཤ � ࣨ᭶ࡢ
⤊್༢⣧ᖹᆒᑐࡋ࡚ ����㸣ࠊ㐣ཤ � ࣨ᭶ࡢ⤊್༢⣧ᖹᆒᑐࡋ࡚ ����㸣ࠊ㐣ཤ
� ࣨ᭶ࡢ⤊್༢⣧ᖹᆒᑐࡋ࡚ ����㸣ࡢࣉ࣑࣒ࣞࢆࡋࡓỈ‽࡛࠶ࡗࡓࡇࢁࠊ
᭱⤊ᥦ࡛ࡣࠊᇶ‽᪥࡛࠶ࡿ ���� ᖺ �� ᭶ � ᪥࠾ࡅࡿ᪥ᮏሬᩱᰴᘧࡢ⤊್
ᑐࡋ࡚ᰴᘧẚ⋡ࢆࡌ࡚⟬ฟࡉࢀࡿ⚄ᮾሬᩱࡢ � ᰴᙜࡓࡾᰴᘧ౯್ࡣࠊ⚄ᮾ
ሬᩱᰴᘧࡢྠ᪥⤊್ᑐࡋ࡚ ����㸣ࠊ㐣ཤ � ࣨ᭶ࡢ⤊್༢⣧ᖹᆒᑐࡋ࡚ ����㸣ࠊ
㐣ཤ � ࣨ᭶ࡢ⤊್༢⣧ᖹᆒᑐࡋ࡚ �����㸣ࠊ㐣ཤ � ࣨ᭶ࡢ⤊್༢⣧ᖹᆒᑐࡋ࡚
�����㸣ࡢࣉ࣑࣒ࣞࢆࡋࡓỈ‽ࡲ࡛ᨵၿࡉࢀ࡚࠸ࡿࠋ࡞࠾ࠊึᅇᥦ࠾࠸࡚
ࡣࠊᰴᘧẚ⋡ࡣ �㸸������ ࡉࢀ࡚࠾ࡾࠊ᭱⤊ⓗྜពࡉࢀࡓᮏᰴᘧẚ⋡
㸦�㸸������㸧ࡣࡇࢀࢆୗᅇࡿࡶࡢࡢࠊึᅇᥦᚋࠊ���� ᖺ �� ᭶ �� ᪥බ⾲ࡉࢀ
ࡓ᪥ᮏሬᩱᴗ⦼ୖ᪉ಟṇࣉࣞࢫ࣮ࣜࣜࢫࡢᚋࠊ᪥ᮏሬᩱᰴᘧࡢᕷሙᰴ౯ࡀୖ
᪼ࡋࡓᐇࢆ㋃ࡲ࠼ࡿࠊᮏ⊂❧ᙺဨጤဨࡋ࡚ࡣࠊ␗࡞ࡿⅬ࣭␗࡞ࡿᰴ౯ࢆ
๓ᥦࡋࡓᰴᘧẚ⋡ࢆ༢⣧ẚ㍑ࡍࡿࡇࡣጇᙜ࡛ࡣ࡞ࡃࠊ⚄ᮾሬᩱࡋ࡚
���
�
᪥ᮏሬᩱࡢ」ᩘᅇࢃࡓࡿ΅ࡢ⤖ᯝࠊࣉ࣑࣒ࣞỈ‽ࢆึᅇᥦࡽ᭱⤊
ྜពࡲ࡛ᨵၿ࡛ࡁࡓࡇࢆ㔜どࡍࡿࡇࡀጇᙜ࡛࠶ࡿࡶࡢ⪃࠼ࡿࠋ�
�
�
≉ู࡞ᐖ㛵ಀࢆ᭷ࡍࡿ⪅ࡢ㛵࣭⊂❧ࡋࡓ᳨ウయไࡢᵓ⠏�
⚄ᮾሬᩱࡣࠊ᪥ᮏሬᩱࡽ⊂❧ࡋࡓ❧ሙ࡛ࠊᮏᰴᘧಀࡿ᳨ウࠊ΅ཬࡧ
ุ᩿ࢆ⾜࠺యไࢆ♫ෆᵓ⠏ࡋࡓࠋලయⓗࡣࠊ⚄ᮾሬᩱࡣࠊ���� ᖺ � ᭶ �� ᪥ࠊ
᪥ᮏሬᩱࡼࡾᮏᥦࢆཷ㡿ࡋ࡚௨㝆ࠊᮏᰴᘧ㛵ࡍࡿ᳨ウ㸦⚄ᮾሬᩱᰴᘧࡢ
ᰴᘧ౯್ࡢ⟬ᐃࡢᇶ♏࡞ࡿᮏᴗィ⏬ࡢసᡂࢆྵࡴࠋ㸧୪ࡧ᪥ᮏሬᩱࡢ༠
㆟ཬࡧ΅ࢆ⾜࠺ࠊ⚄ᮾሬᩱࡢᙺ⫋ဨ � ྡࡽ࡞ࡿ᳨ウࢳ࣮࣒ࢆタ⨨ࡋࠊࡑࡢ࣓ࣥ
ࣂ࣮ࡣ᪥ᮏሬᩱࡢᙺ⫋ဨࢆව⫋ࡋ࡚࠸࡞࠸⚄ᮾሬᩱࡢᙺ⫋ဨࡢࡳࡼࡾᵓᡂࡉ
ࢀࡿࡶࡢࡋࠊࡲࡓࠊ���� ᖺ � ᭶ࡲ࡛᪥ᮏሬᩱᅾ⡠ࡋ࡚࠸ࡓ⚄ᮾሬᩱࡢྲྀ⥾
ᙺࡢ୰㇂ᫀᖾẶࠊ⌧ᅾ᪥ᮏሬᩱᅾ⡠ࡋ࡚࠸ࡿ⚄ᮾሬᩱࡢ┘ᰝᙺࡢ୕ᾆྐᮁẶ
୪ࡧ᪥ᮏሬᩱࡽ⚄ᮾሬᩱฟྥࡋ࡚࠸ࡿᚑᴗဨࡘ࠸࡚ࡣࠊᮏᰴᘧ
㛵ࡋ࡚ᐖ㛵ಀࢆ᭷ࡍࡿ⪃࠼ࡽࢀࡿࡇࡽࠊᮏᰴᘧ㛵ࡍࡿ᳨ウࠊ᪥ᮏ
ሬᩱࡢ༠㆟ཬࡧ΅ࡣ୍ษཧຍࡋ࡞࠸ࡇࡋࠊࡿྲྀᢅ࠸ࢆ⥅⥆ࡋ࡚࠸
ࡿࠋ�
࡞࠾ࠊᮏᰴᘧࡀᵓ㐀ⓗ࡞┈┦ࡢၥ㢟ཬࡧሗࡢ㠀ᑐ⛠ᛶࡢၥ㢟ࡀ㢮ᆺ
ⓗᏑᅾࡍࡿྲྀᘬヱᙜࡍࡿࡇ㚷ࡳࠊ⚄ᮾሬᩱࡢྲྀ⥾ᙺ࠾ࡅࡿᑂ㆟ཬࡧ
Ỵ㆟ࡀࡇࢀࡽࡢၥ㢟ࡼࡿᙳ㡪ࢆཷࡅࡿ࠾ࡑࢀࢆ㝖ࡍࡿほⅬࡽࠊ���� ᖺ � ᭶
ࡲ࡛᪥ᮏሬᩱᅾ⡠ࡋ࡚࠸ࡓ⚄ᮾሬᩱࡢྲྀ⥾ᙺࡢ୰㇂ᫀᖾẶࡣࠊᮏ⊂❧ᙺဨጤ
ဨࡢㅎၥಀࡿ ���� ᖺ � ᭶ �� ᪥㛤ദࡢྲྀ⥾ᙺࢆྵࡴᮏᰴᘧಀࡿᑂ
㆟ཬࡧỴ㆟ཧຍࡋ࡚࠾ࡽࡎࠊࡲࡓࠊ⌧ᅾ᪥ᮏሬᩱᅾ⡠ࡋ࡚࠸ࡿ⚄ᮾሬᩱࡢ┘
ᰝᙺࡢ୕ᾆྐᮁẶࡣࠊᮏᰴᘧಀࡿᑂ㆟ཧຍࡋ࡚࠾ࡽࡎࠊពぢࢆ㏙ࡿࡇ
ࢆᕪࡋ᥍࠼࡚࠸ࡿࠋྠᵝࠊᮏᰴᘧࡢබ⾲᪥㛤ദࡢ⚄ᮾሬᩱྲྀ⥾ᙺ࠾࠸
࡚ࡶࠊ୰㇂ᫀᖾẶࡣࠊᮏᰴᘧಀࡿᑂ㆟ཬࡧỴ㆟ཧຍࡋ࡞࠸ணᐃ࡛࠶ࡾࠊࡲ
ࡓࠊ୕ᾆྐᮁẶࡣࠊᮏᰴᘧಀࡿᑂ㆟ཧຍࡏࡎࠊពぢࢆ㏙ࡿࡇࢆᕪࡋ᥍
࠼ࡿணᐃ࡛࠶ࡿࠋ�
�
�
ࡢ㈙⪅ࡼࡿ㈙ᥦࡢᶵࡢ☜ಖ㸦࣐࣮ࢣࢵࢺ࣭ࢳ࢙ࢵࢡ㸧�
⚄ᮾሬᩱཬࡧ᪥ᮏሬᩱࡣࠊ⚄ᮾሬᩱࡀ᪥ᮏሬᩱ௨እࡢ㈙ᥦ⪅㸦௨ୗࠕᑐ
ᢠⓗ㈙ᥦ⪅ࠖ࠸࠺ࠋ㸧᥋ゐࡍࡿࡇࢆ⚗Ṇࡍࡿࡼ࠺࡞ྲྀᘬಖㆤ᮲㡯ࢆྵࡴ
ྜព➼ࠊᑐᢠⓗ㈙ᥦ⪅ࡀ⚄ᮾሬᩱࡢ㛫࡛᥋ゐࡍࡿࡇࢆไ㝈ࡍࡿࡼ࠺࡞ෆ
ᐜࡢྜពࢆ୍ษ⾜ࡗ࡚࠸࡞࠸ࠋࡲࡓࠊᮏᰴᘧಀࡿᰴᘧዎ⣙㸦௨ୗࠕᮏᰴ
ᘧዎ⣙ࠖ࠸࠺ࠋ㸧ࢆᢎㄆࡍࡿࡓࡵࡢ⚄ᮾሬᩱࡢ⮫ᰴ⥲ࡣࠊᮏᰴᘧ
ዎ⣙ࡢ⥾⤖ࡀබ⾲ࡉࢀ࡚ࡽ࠾ࡼࡑ � ࣨ᭶㉸ᚋ࡛࠶ࡿ ���� ᖺ � ᭶ �� ᪥㛤ദண
ᐃ࡛࠶ࡾࠊࡢᴗ㈙ࡢẚࡋ࡚ࡶࠊᑐᢠⓗ㈙ᥦ⪅ࡼࡿᥦࡢᶵࡣ
���
�
༑ศ☜ಖࡉࢀ࡚࠸ࡿࡇࡽࠊᮏᰴᘧ㝿ࡋ࡚ࡣ㛫᥋ⓗ࡞࣐࣮ࢣࢵࢺ࣭ࢳ࢙
ࢵࢡࡀㅮࡌࡽࢀ࡚࠸ࡿ࠸࠼ࡿࠋ�
᪉ࠊ⚄ᮾሬᩱࡣࠊ✚ᴟⓗ࡞࣐࣮ࢣࢵࢺ࣭ࢳ࢙ࢵࢡࡲ࡛ࡣ⾜ࡗ࡚࠸࡞࠸ࡇࢁࠊ
ᮏᰴᘧ࠾࠸࡚ࡣࠊୖグࡢ࠾ࡾ㛫᥋ⓗ࡞࣐࣮ࢣࢵࢺ࣭ࢳ࢙ࢵࢡࡣ⾜ࢃࢀ࡚࠸
ࡿࡶࡢㄆࡵࡽࢀࡿࠊ⚄ᮾሬᩱࡢᨭ㓄ᰴ࡛࠶ࡿ᪥ᮏሬᩱࡼࡿᏊ
♫ྲྀᘬ࡛࠶ࡾࠊ✚ᴟⓗ࡞࣐࣮ࢣࢵࢺ࣭ࢳ࢙ࢵࢡࢆ⾜ࡗࡓࡋ࡚ࡶ➨୕⪅ࡽ┿ᦸ
࡞ᑐᢠᥦࡀࡉࢀࡿࡇࡣ⪃࠼ࡃ࠸ࡇࠊ༑ศ࡞බṇᛶᢸಖᥐ⨨ࡀㅮࡌࡽ
ࢀ࡚࠸ࡿࡇࢆ㋃ࡲ࠼ࡿࠊ✚ᴟⓗ࡞࣐࣮ࢣࢵࢺ࣭ࢳ࢙ࢵࢡࡀ⾜ࢃࢀ࡚࠸࡞࠸ࡇ
ࢆࡶࡗ࡚ᮏᰴᘧ࠾ࡅࡿᡭ⥆ࡢබṇᛶࡀᦆ࡞ࢃࢀࡿࡶࡢ࡛ࡣ࡞࠸⪃࠼ࡽࢀ
ࡿࠋ�
�
�
ᙉᅽᛶࡢ㝖�
ᮏᰴᘧ࠾࠸࡚ࡣࠊ♫ἲୖᐃࡵࡽࢀ࡚࠸ࡿᑐᰴࡢᰴᘧ㈙ྲྀㄳồᶒࡸࠊ
༢ඖᮍ‶ᰴᘧࡢ㈙ྲྀㄳồᶒࡢᏑᅾຍ࠼ࠊ᪥ᮏሬᩱࡀࠊ༢ඖᮍ‶ᰴᘧࢆಖ᭷ࡍࡿ
ᰴࡢ≧ἣཬࡧࢽ࣮ࢬ➼ࡶ㋃ࡲ࠼࡚࠸࠺␃ಖࡁ࡛ࡣ࠶ࡿࡶࡢࡢࠊᮏᰴᘧ
ࡢຠຊⓎ⏕᪥ᚋ㛤ദணᐃࡢ᪥ᮏሬᩱࡢᐃᰴ⥲࡚ࠊ༢ඖᮍ‶ᰴᘧࡢ㈙
ቑไᗘࡢᑟධᚲせ࡞ᐃḰኚ᭦㆟ࢆ㆟ࡍࡿࡇࡘ࠸᳨࡚ウࡍࡿ᪉㔪࡛࠶ࡿ
ࡇ➼↷ࡽࡏࡤࠊ⚄ᮾሬᩱࡢ୍⯡ᰴᑐࡋ࡚ᙉᅽᛶࡀ⏕ࡌ࡞࠸ࡼ࠺㓄៖ࡀ
࡞ࡉࢀ࡚࠸ࡿホ౯࡛ࡁࡿࠋ�
�
�
୍⯡ᰴࡢሗᥦ౪ࡢᐇࣉࣟࢭࢫࡢ㏱᫂ᛶࡢྥୖ�
ᮏᰴᘧಀࡿࣉࣞࢫ࣮ࣜࣜࢫ࠾࠸࡚ࡣࠊἲ௧ࡸᮾிドๆྲྀᘬᡤࡢ㐺㛤
♧つไἢࡗࡓ㛤♧ࡀணᐃࡉࢀ࡚࠸ࡿࠊᮏ⊂❧ᙺဨጤဨ࠾ࡅࡿ᳨ウࡢ⤒
⦋ࡸ΅㐣⛬ࡢ㛵ࠊᮏ⟅⏦᭩ࡢෆᐜࠊᮏᰴᘧẚ⋡⟬ᐃ᭩ࡢᴫせࠊࡑࡢᮏ
ᰴᘧࡢᐇ⮳ࡿࣉࣟࢭࢫࡸ΅⤒⦋➼ࡘ࠸࡚ࠊࡑࢀࡒࢀ㛤♧ࡀ࡞ࡉࢀࡿ
ணᐃ࡞ࡗ࡚࠾ࡾࠊ୍⯡ᰴࡼࡿྲྀᘬ᮲௳ࡢጇᙜᛶ➼ࡘ࠸࡚ࡢุ᩿㈨ࡍࡿ
ሗࡀᥦ౪ࡉࢀࡿࡶࡢㄆࡵࡽࢀࡿࠋ�
�
�� ࣐ࢪࣙࣜࢸ࣭࢜ࣈ࣭࣐ࣀࣜࢸ᮲௳ࢆタᐃࡋ࡞࠸ࡇࡘ࠸࡚�
ᮏᰴᘧ࠾࠸࡚ࡣࠊ࣐ࢪࣙࣜࢸ࣭࢜ࣈ࣭࣐ࣀࣜࢸ᮲௳ࡀタᐃࡉࢀ࡚࠸
࡞࠸ࡇࢁࠊࡇࢀࡣࠊᙜヱ᮲௳ࢆタᐃࡍࡿࡇࡼࡾࠊᮏᰴᘧࡢᡂ❧ࡀᏳᐃ
࡞ࡶࡢ࡞ࡾࠊ࠼ࡗ࡚⚄ᮾሬᩱࡢ୍⯡ᰴ┈ࡀ⏕ࡌࡿᠱᛕࡀ࠶ࡿࡓࡵ
⪃࠼ࡽࢀࡿࠋࡲࡓࠊᮏᰴᘧ࠾࠸࡚ࡣࠊୖグ �� � ࡽ �� � ࡲ࡛ࡢබṇᛶᢸ
ಖᥐ⨨ࡀㅮࡌࡽࢀ࡚࠾ࡾࠊ⚄ᮾሬᩱࡢ୍⯡ᰴࡢ┈㓄៖ࡀ࡞ࡉࢀ࡚࠸ࡿࡇ
㚷ࡳࢀࡤࠊ࣐ࢪࣙࣜࢸ࣭࢜ࣈ࣭࣐ࣀࣜࢸ᮲௳ࡀタᐃࡉࢀ࡚࠸࡞࠸ࡇࡢࡳ
ࢆࡶࡗ࡚ࠊᮏᰴᘧ࠾ࡅࡿᡭ⥆ࡢබṇᛶࢆᦆ࡞࠺ࡶࡢ࡛ࡣ࡞࠸⪃࠼ࡽࢀࡿࠋ�
���
�
�
�� ᑠᣓ�
௨ୖࡢⅬࢆ㋃ࡲ࠼ࠊᮏ⊂❧ᙺဨጤဨ࠾࠸࡚ࠊៅ㔜༠㆟ཬࡧ᳨ウࡋࡓ⤖ᯝࠊ
ᮏᰴᘧ⮳ࡿ΅㐣⛬➼࠾࠸࡚ࡣࠊྠ✀ࡢ♫ẚ㍑ࡋ࡚ࡶࠊྲྀᘬ᮲௳
ࡢබṇࡉࢆᢸಖࡍࡿࡓࡵࡢᡭ⥆ࡀ༑ศㅮࡌࡽࢀ࡚࠾ࡾࠊᮏᰴᘧࡢᡭ⥆ࡣබ
ṇ࡛࠶ࡿㄆࡵࡽࢀࡿุ᩿ࡍࡿ⮳ࡗࡓࠋ�
�
�� ୖグ � ࡽ � ࢆ㋃ࡲ࠼ࠊᮏᰴᘧࡀ୍⯡ᰴࡗ࡚බṇ࡛࠶ࡿ�
ᮏ⊂❧ᙺဨጤဨࡣࠊୖグ � ࡽ � ࡑࡢࡢ㡯ࢆ㋃ࡲ࠼ៅ㔜᳨ウࡋࡓ⤖ᯝࠊᮏ
ᰴᘧࡣ⚄ᮾሬᩱࡢ୍⯡ᰴࡗ࡚බṇ࡞ࡶࡢ࡛࠶ࡿㄆࡵࡽࢀࡿุ᩿ࡍࡿ
⮳ࡗࡓࠋ�
�
➨ �� ␃ಖ㡯�
ᮏ⟅⏦ࡣࠊᮏ᳨ウ㈨ᩱࡢෆᐜཬࡧᮏ⊂❧ᙺဨጤဨࡀᐇࡋࡓࣄࣜࣥࢢ➼ࡼࡾᚓࡓ
ሗࡀ┿ᐇࡘṇ☜࡛࠶ࡾࠊࡲࡓࠊࡇࢀࡽࡢ㈨ᩱࡢෆᐜཬࡧሗ௨እࠊᮏ⟅⏦ࡢෆᐜᙳ
㡪ࢆཬࡰࡋᚓࡿ㔜せ࡞ᐇཪࡣሗࡀᏑᅾࡋ࡞࠸ࡇࢆ๓ᥦࡋ࡚࠾ࡾࠊᮏ⊂❧ᙺဨጤဨ
ࡣࠊࡑࡢ㈨ᩱࡢෆᐜཬࡧሗࡢ┿ᐇᛶࠊṇ☜ᛶࡘ࠸࡚⊂⮬ࡢ㈨ᩱ㞟ࠊ᳨ド➼ࢆ⾜ࡗ࡚
࠸࡞࠸ࠋ�
ࡲࡓࠊᮏ⟅⏦᭩ࡣࠊ⚄ᮾሬᩱᑐࡍࡿᮏㅎၥ㡯ࡢ⟅⏦ࢆ⾜࠺ࡇࡢࡳࢆ┠ⓗࡋ࡚࠾
ࡾࠊᮏ⊂❧ᙺဨጤဨࡣࠊ⚄ᮾሬᩱࡼࡿᮏ⟅⏦᭩ࡢ⏝㛵ࡋࠊ➨୕⪅ᑐࡋ୍࡚ษࡢ㈐
௵ࢆ㈇ࢃ࡞࠸ࠋ�
�
�
௨ୖ�
�
���
�
ู⣬�
ᮏ⊂❧ᙺဨጤဨࡢᐇᴫせ�
�
ᅇ�
➨ � ᅇ�
㛤ദ᪥�
���� ᖺ � ᭶ � ᪥㸦Ỉ㸧�
᳨ウ㡯➼�
�� ᮏᰴᘧࡢᴫせ࣭ᮏ⊂❧ᙺဨጤဨࡢ
������������
ᙺ➼ࡢ☜ㄆ�
�� ጤဨࡢ☜ㄆ࣭ጤဨ㛗ࡢ㑅ᐃ�
�� ⚄ᮾሬᩱࡢእ㒊ᑓ㛛ᐙࢻࣂࢨ࣮ࡢ
⊂❧ᛶ☜ㄆཬࡧ㏣ㄆ�
�� ⚄ᮾሬᩱࡢ᳨ウయไࡢᢎㄆ�
�� ᚋࡢࢫࢣࢪ࣮ࣗࣝࡢ᳨ウ࣭ㄪᩚ�
➨ � ᅇ�
➨ � ᅇ�
➨ � ᅇ�
���� ᖺ � ᭶ �� ᪥㸦㔠㸧�
�� ᪥ᮏሬᩱᑐࡍࡿ㉁ၥ㡯ࡢ᳨ウ�
������������
�� ᚋࡢࢫࢣࢪ࣮ࣗࣝࡢ᳨ウ࣭ㄪᩚ�
���� ᖺ � ᭶ �� ᪥㸦᭶㸧�
�� ⚄ᮾሬᩱࡢᴗィ⏬ࡢ᳨ウ࣭ᢎㄆ�
������������
�� ᚋࡢࢫࢣࢪ࣮ࣗࣝࡢ᳨ウ࣭ㄪᩚ�
���� ᖺ �� ᭶ � ᪥㸦᭶㸧�
�� ᮏ⊂❧ᙺဨጤဨࡼࡿ᪥ᮏሬᩱ
������������
➨ � ᅇ�
���� ᖺ �� ᭶ �� ᪥㸦Ỉ㸧�
ᑐࡍࡿࣥࢱࣅ࣮ࣗࡢᐇ�
�� %'2�&D1�)$6 ྜྠ♫ࡽࡢ㈈ົ࣭⛯ົ
������������
ࢹ࣮࣭ࣗࢹࣜࢪ࢙ࣥࢫ⤖ᯝሗ࿌�
�� Ụᶫἲᚊົᡤࡽࡢἲົࢹ࣮࣭ࣗࢹ
ࣜࢪ࢙ࣥࢫ⤖ᯝሗ࿌�
�� ᮏ⊂❧ᙺဨጤဨࡼࡿ⚄ᮾሬᩱ⤒Ⴀ
㝕ᑐࡍࡿࣥࢱࣅ࣮ࣗࡢᐇ�
�� ⚄ᮾሬᩱࡢಟṇ∧ᴗィ⏬ࡢ᳨ウ࣭ᢎㄆ�
➨ � ᅇ�
���� ᖺ �� ᭶ �� ᪥㸦Ỉ㸧�
�� -%0$ ࡽࡢᰴᘧ౯್⟬ᐃ࣭ᰴᘧ㛵
������������
ࡍࡿ୰㛫ሗ࿌�
�� ᪥ᮏሬᩱࡢ΅᪉㔪ࡢ༠㆟�
➨ � ᅇ�
���� ᖺ �� ᭶ �� ᪥㸦ⅆ㸧�
�� ᪥ᮏሬᩱࡢ΅᪉㔪ࡢ༠㆟�
������������
�� ࣉࣞࢫ࣮ࣜࣜࢫ㸦ࢻࣛࣇࢺ㸧ࡢ☜ㄆ�
�� ⟅⏦᭩㸦ࢻࣛࣇࢺ㸧ࡢ☜ㄆ�
➨ � ᅇ�
➨ � ᅇ�
���� ᖺ �� ᭶ �� ᪥㸦㔠㸧�
�� ᪥ᮏሬᩱࡢ΅᪉㔪ࡢ༠㆟�
������������
�� ⟅⏦᭩㸦ࢻࣛࣇࢺ㸧ࡢ☜ㄆ�
���� ᖺ �� ᭶ � ᪥㸦Ỉ㸧�
�� ᪥ᮏሬᩱࡢ΅᪉㔪ࡢ༠㆟�
������������
�� ⟅⏦᭩㸦ࢻࣛࣇࢺ㸧ࡢ☜ㄆ�
➨ �� ᅇ� ���� ᖺ �� ᭶ � ᪥㸦ᮌ㸧�
�� ᰴᘧẚ⋡⟬ᐃ᭩㸦᭱⤊∧㸧ࡢ☜ㄆ�
���
�
ᅇ�
㛤ദ᪥�
������������
᳨ウ㡯➼�
�� ⟅⏦᭩ࡢ᳨ウ࣭☜ㄆ�
�� ࣉࣞࢫ࣮ࣜࣜࢫࡢ☜ㄆ�
�
���
�
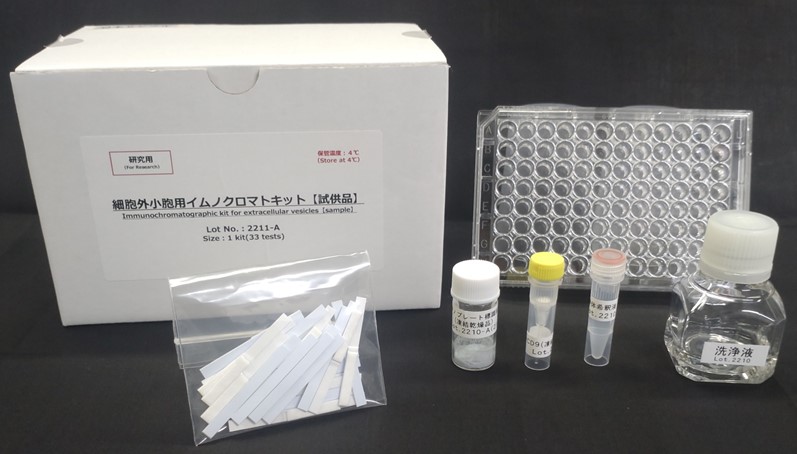 Exorapid-qIC 細胞外小胞用イムノクロマトキット(CD9)




 地下鉄御堂筋線「淀屋橋」駅徒歩3分
地下鉄御堂筋線・中央線「本町」駅徒歩4分
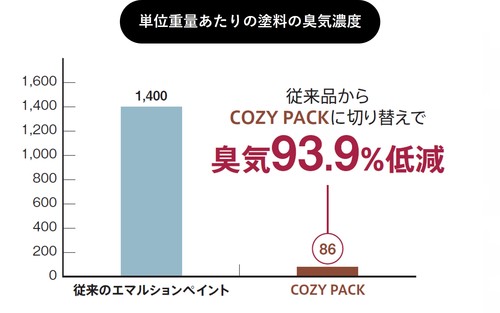
 当社は、塗料を通じて、暮らしや産業、環境が抱える課題に応えることを目指しています。近年では、省力・省人化やカーボンニュートラルなど、社会課題に応える塗料の開発にも取り組んでいます。一方で、塗料のこうした働きは、日々の生活の中で意識される機会が多くはありません。
 玄氏コメント


 そのため、利用者がいる時間帯の施工が難しく、夜間や休日に工事時間が限られるなど、施設側と施工側の双方に負担が生じるケースもあります。
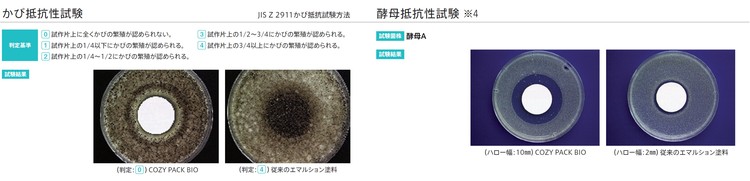
また、医療機関、学校、飲食店、トイレなどでは、壁面の清潔性やかびへの対策も求められます。人の出入りが多い場所や湿気がこもりやすい場所では、塗装後の室内環境にも衛生面に配慮した塗料へのニーズが高まっています。