INTEGRATED REPORT 2026 東和薬品統合報告書 企業理念 私達の誓い 私達は こころの笑顔を大切にします ( T- S M I L E ) 私達は企業活動を通じて 「こころの笑顔」 の実現 私達は 人々の 健康に貢献します こころ の 笑顔 実現 に向 けた 理念を実現するために、…
INTEGRATED
REPORT 2026
東和薬品統合報告書
企業理念
私達の誓い
私達は こころの笑顔を大切にします
( T- S M I L E )
私達は企業活動を通じて
「こころの笑顔」
の実現
私達は 人々の 健康に貢献します
こころ の 笑顔
実現 に向 けた
理念を実現するために、
「私達 の 誓 い」
以下のことを誓います。
S(Speed)
L(Linkage)
意思決定、実行、情報共有などを迅
速に行います。先見性を持って、変化
に俊敏に対応します。
人 や 情報と幅広く結 び つ き 、協力
します。認め合える相手と切磋琢磨
し、お互いを高めます。
M(Mission)
E(Excellence)
世界中で地域社会の人々の健康に役
立つという強い使命感と、その実現へ
の情熱を持ち続けます。
最善の品質を求め、
サイエンスを大切
にしながら、時代にあった最適な技術
でそれをかなえます。
財務・企業データ
発想力と想像力を駆使して、前例に
とらわれない変革にチャレンジしま
す。常に能動的に行動します。
事業を 支える 基盤
人々の健康
(Idea)
I
誠実で、正直であり続けます。公正な
心を持って適正を貫き、人々から喜
ばれ、信頼される存在になります。
東和薬品の価値創造
こころの笑顔
T(Truthful)
健康に貢献 する全てのものを通じて
こころの笑顔を支える
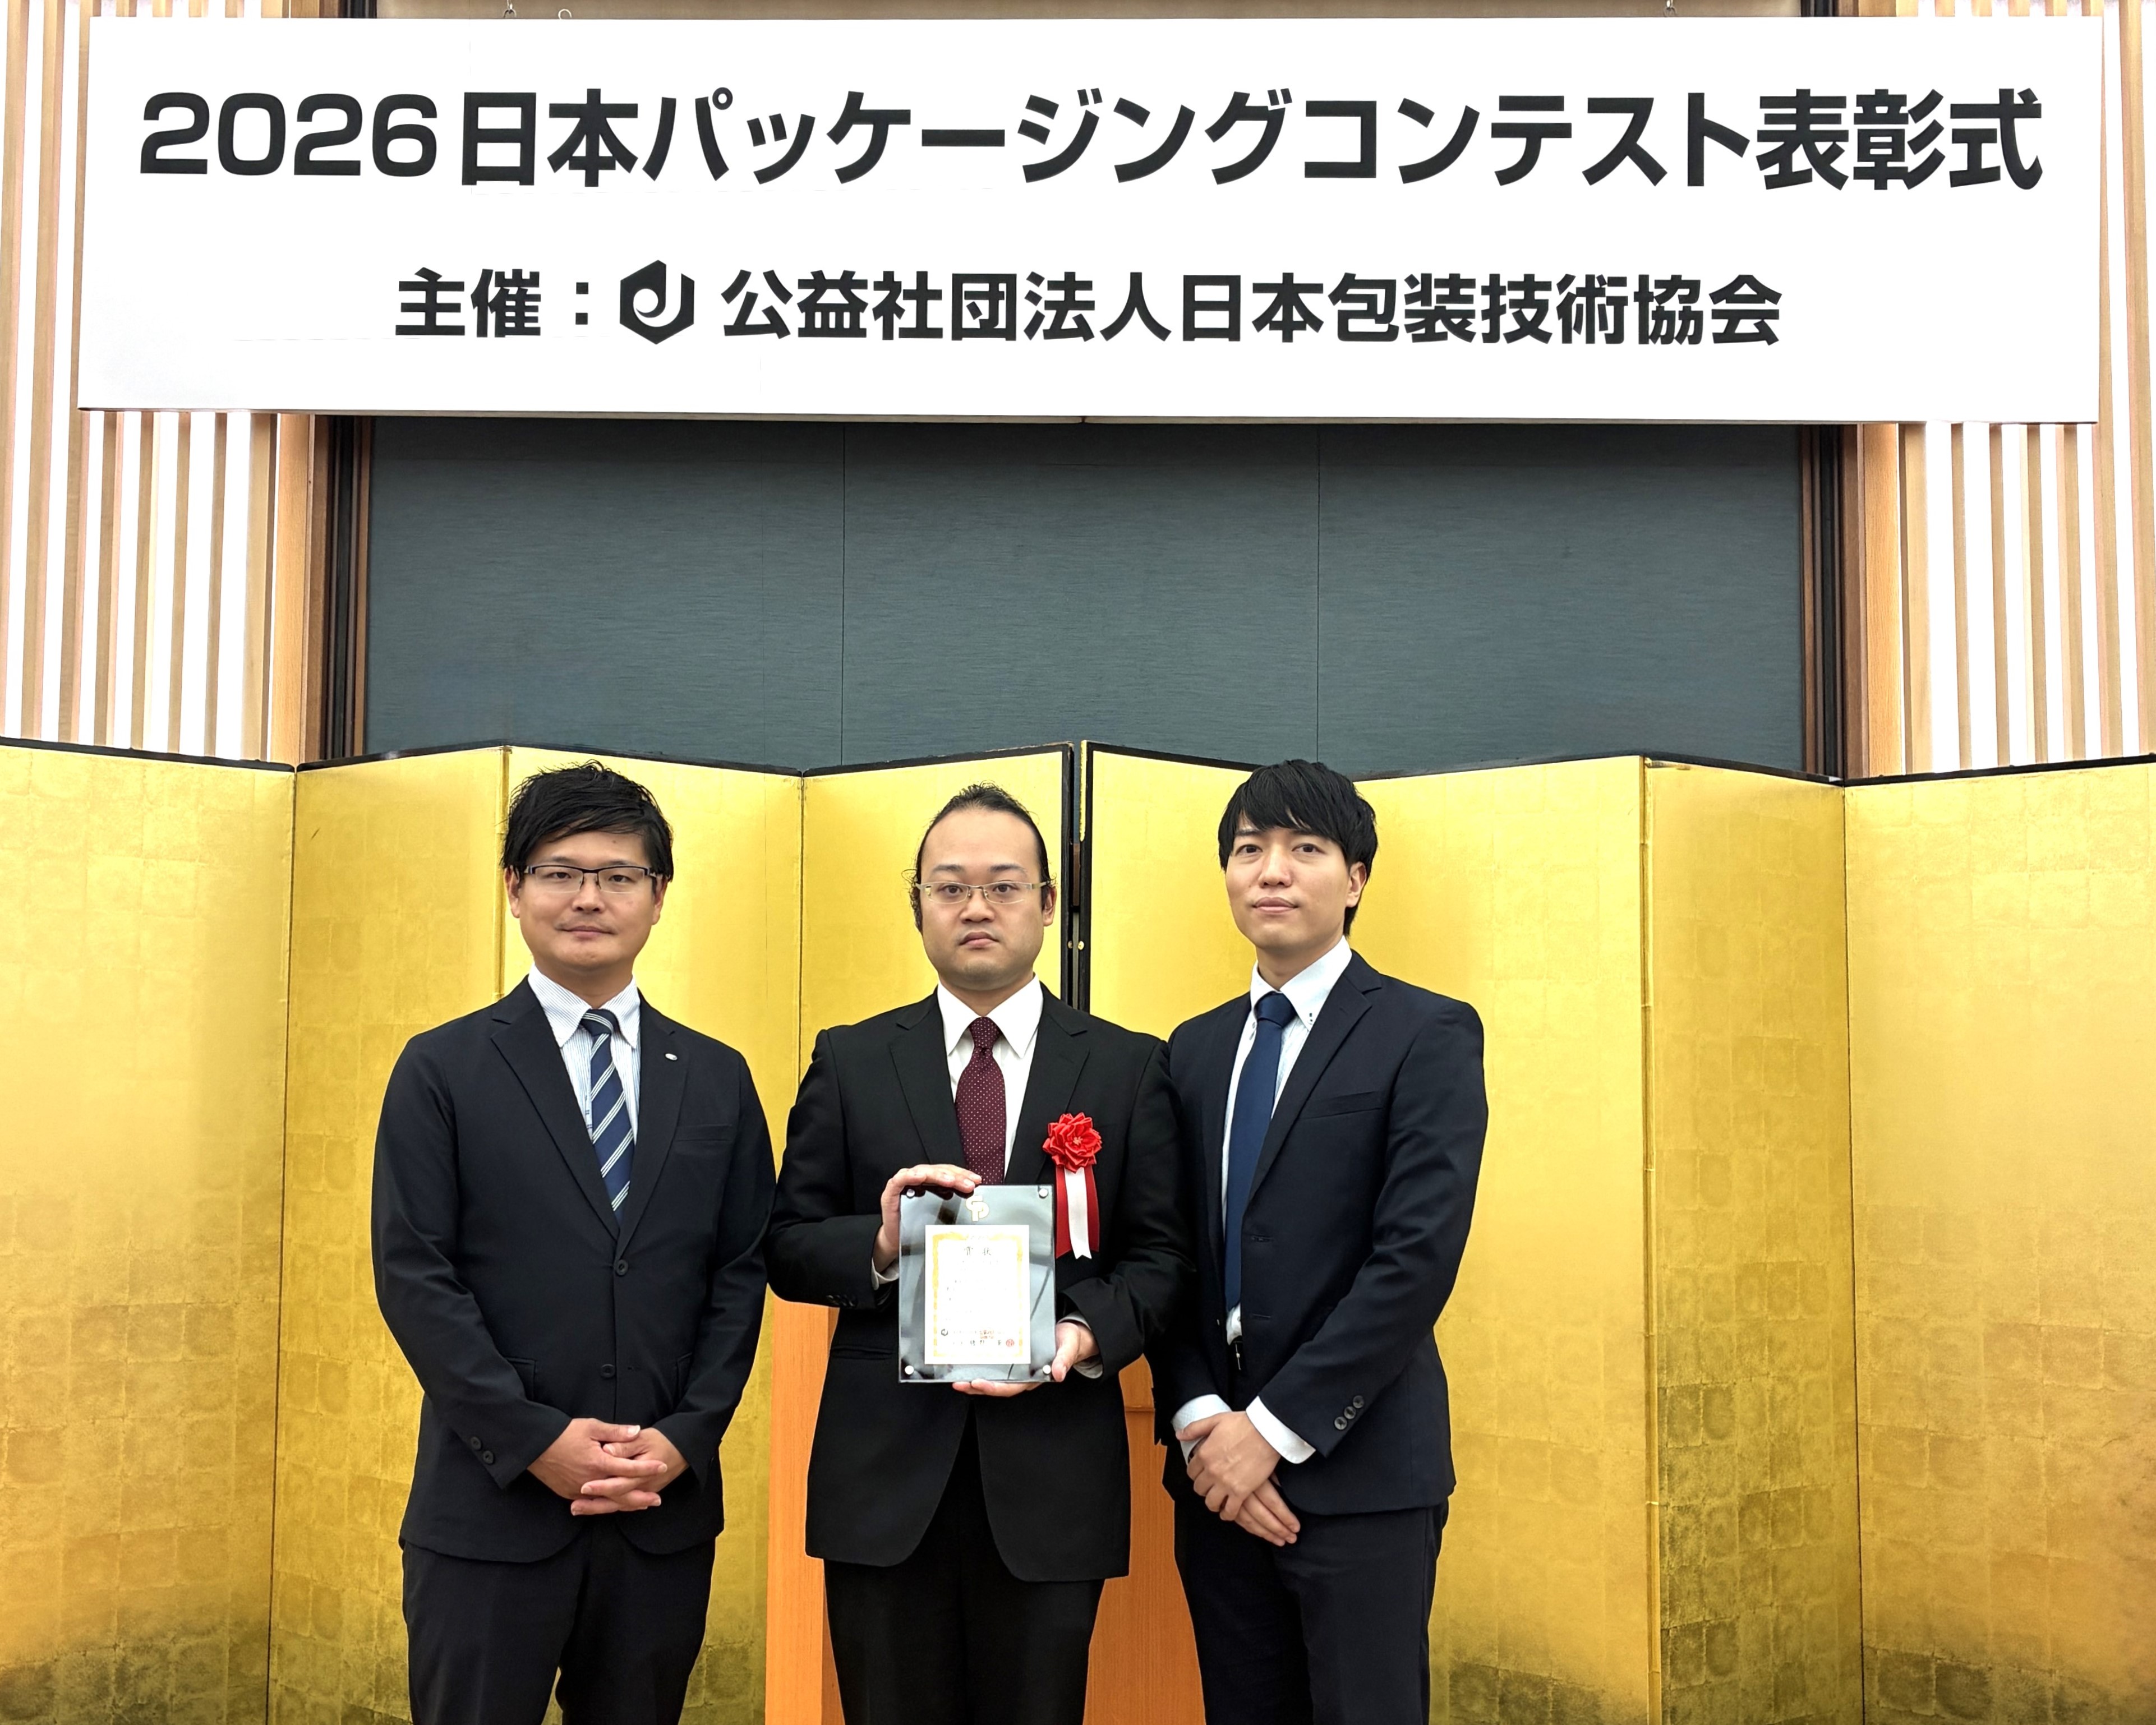
75周年の全社朝礼を実施しました
東和薬品グループは、優れた製品とサービスを創造することによって、人々の健康に貢献します。
そして私達の企業活動を通して、
患者さん、医療関係者の皆様、地域社会をはじめとする全ての方々にこころから喜ばれ、
求められる企業を目指していきます。
当社は2 0 2 6 年 6月1日に創業
75周年を迎えました。当日は全
社朝礼を行い、社長から社員への
講話として、企業理念や大切にし
ている考え方、今後のビジョン
について発信しました。
01
目次
「トップメッセージ」では、医薬品の安定供給に向けた当社の
考え・取り組みについて、代表取締役社長からのメッセージを
掲載しています。
事業を支える基盤
33
東和薬品のサステナビリティ
34
環境
38
社会
44
ガバナンス
02
目次・編集方針
49
リスクマネジメント
03
これまでのあゆみ
50
リスク情報
05
東和薬品が応える社会課題
52
コンプライアンス
07
東和薬品の全体像
53
社外取締役メッセージ
� ップメッセージ
ト
安定供給のその先へ
“東和品質”を軸に、
10年後の医療インフラを創る
55
役員紹介
09
[ 編集方針 ]
東和薬品統合報告書 は 、株主・投資家 をはじめとするステ ー ク
ホルダー の 皆さまに、当社グル ープの 企業価値向上 に向けた取り
組みをお伝えすることを目的に発行しています。統合報告書 2 0 2 6
事業を 支える 基盤
企業理念
東和薬品の価値創造
01
「こころの笑顔」
の実現
「こころの笑顔」を実現する東和薬品
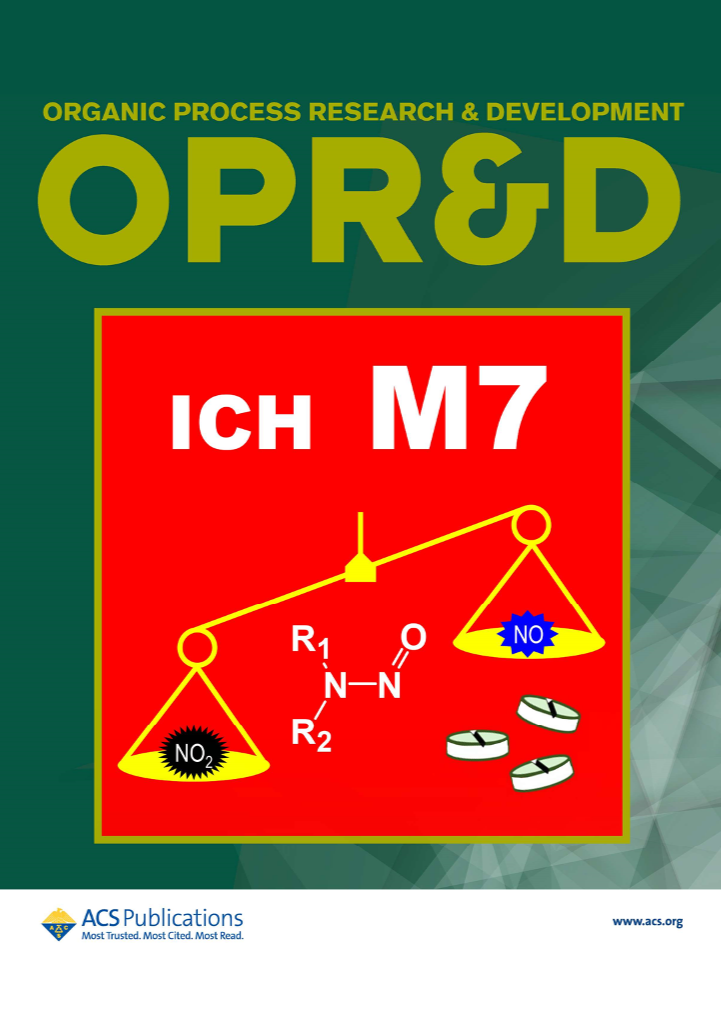
では、冊子を通じた特集テーマとして「医薬品の安定供給」
と
「ニトロ
ソアミン問題」について取り上 げるとともに、当社グル ープの 事業
概要、ジェネリック医薬品業界および制度に関する掲載内容の充実
を 図りました。これ からもステ ー クホ ル ダー の 皆 さまのご 意見 や
ご 関心 にお 応 えできるよう掲載内容 の 充実 に努 めてまいります。
東和薬品の価値創造
特集では、当社が現在注力している取り組みをご紹介いたし
ます。また、
「企業価値向上に向けて」では、取締役・執行役員
からのメッセージを掲載しています。
財務・企業データ
56
11ヵ年財務サマリー
57
財務ハイライト
58
非財務ハイライト
59
企業データ
財務・企業データ
忌憚のないご意見を賜りますようお願いいたします。
[ 対象範囲 ]
東和薬品グループ連結(一部、国内連結・単体の数字を含む)
[ 対象期間 ]
2026年3月期(2025年4月~2026年3月)
※�財務情報は2026年3月末時点。
一部2025年3月以前、2026年4月以降の取り組みも報告しています。
15
特集01
安定供給に向けた協業の取り組み
17
特集02
ニトロソアミン問題への挑戦
19
価値創造プロセス
20
東和薬品の資本
21
東和薬品の強み
[ 見通しに関する注意事項 ]
23
企業価値向上に向けて
当報告書の記載内容のうち、歴史的事実でないものは将来に関する見
26
中期経営計画
[ 参照ガイドライン ]
IFRS財団国際統合報告フレームワーク
経済産業省価値協創ガイダンス2.0
通しおよび計画に基づいた将来予測です。
これらの将来予測には、
リスク
や不確定な要素等の要因が含まれており、実際の成果や業績等は記載
の見通しとは異なる場合があります。
02
これまでのあゆみ
「こころの笑顔」
の実現
当社は1951年に創業して以来、長きにわたりジェネリック医薬品の研究開発・製造・販売に取り組んできました。
「安定供給」
「品質確保」
「情報提供」を充実しながら、
「飲みやすく、扱いやすい」医薬品の研究開発に引き続き注力する
2025年度
連結売上高
とともに、世界中の患者さんへ当社グループの高品質で付加価値のある製剤を提供するための体制づくりや、新しい
2,737億円
医療体制に対応した健康関連事業の創出に取り組んでいます。
2010
1998
1951
175
創業
2,800
175 億錠
大地化成(株)子会社化
三生医薬(株)子会社化
2,600
生産能力
億錠
海外売上高
140
一般用医薬品(OTC)
販売開始
2000
2016
付加価値製剤を上市
2022
東証プライム市場移行
2,400
生産能力
億錠
120
2,000
グリーンカプス製薬(株)設立
OTCから医療用医薬品 の
製造販売へ転換
2003
2,200
生産能力
ジェイドルフ製薬(株)子会社化
110 億錠
2019
生産能力
億錠
115
1,800
生産体制
1,600
生産能力
1,400
140 億錠
2004
1996
「RACTAB技術」
確立
105 億錠
Towa Pharma International
Holdings, S.L.(スペイン)子会社化
1,200
生産能力
85 億錠
吉田逸郎が
代表取締役社長に就任
2004
東証一部上場
財務・企業データ
1965
2021
事業を 支える 基盤
1957
2026年度
生産能力
億錠
生産体制
中央研究所完成
東和薬品の価値創造
会社の歴史 ※年表記は年度
1,000
生産能力
800
75 億錠
600
400
[ 連結売上高推移 ]
1951 1970
200
1980
第1次成長期
1990
創業〜 2001年度
2000
2002
2003
2004
2005
2006
2007
2008
2009
2010
第2次成長期
2011
2012
2013
2014
2015
2016
2017
2018
2019
2020
2021
2022
2023
2024
2025
0
2002 〜 2020年度
第3次成長期 2021年度〜
03
これまでのあゆみ
山形の3工場における生産体制の増強を通じてジェネリック
90%
80%
175億錠の生産能力を有し、安定供給を支えるための仕組み
60%
づくりを強化しています。
40%
65.8%
70%
72.6%
85.0%
88.8%
56.2%
50%
30%
32.5%
34.9%
35.8%
2005
2007
2009
46.9%
39.9%
2011
2013
2015
2017
2018
2019
2020
2021
2022
2023
2024
東和薬品の価値創造
医薬品の供給を行ってきました。現在は国内3 工場で年間
80.2%
76.7% 78.3% 79.0% 79.0%
「こころの笑顔」
の実現
薬価調査における後発医薬品の 使用割合(数量ベース、9月分)の推移
国のジェネリック医薬品使用促進策のもと、大阪・岡山・
2025(9 月)
※厚生労働省「後発医薬品(ジェネリック医薬品)及びバイオ後続品(バイオシミラー)の使用促進について」
より
ジェネリック医薬品使用促進策に基づく取り組みの歴史
1993
「21世紀の医薬品の在り方に関する懇談会」最終報告
ジェネリック医薬品の「定義」
と
「意義」が初めて明示される
2007
2012年度
までに
3 0%以上
2013
2018年度末
までに
6 0%以上
2024
2029年度末までに
全ての都道府県で
80%以上
ジェネリック医薬品数量シェア政府目標
[ 生産体制 ]
大阪
2017
2020年9月
までに
8 0%以上
1981
大阪工場完成
大阪第二工場完成
2005
2023 年度
実績
82.7%
2024 年度
実績
86.5%
2025 年度
実績
89.7%
※日本ジェネリック製薬協会「ジェネリック医薬品数量シェア分析結果について」
より
(数量ベース、1年分)
2013
新大阪工場
(現大阪工場)完成
財務・企業データ
1977
2022 年度
実績
80.7%
事業を 支える 基盤
1961
国民皆保険制度
の開始
大阪工場
倉庫・試験エリア拡大
(生産能力25億錠)
岡山
1983
1995
1996
2012
2016
岡山工場完成
包装棟完成
製剤棟増築
西日本物流センター・
第二固形製剤棟稼働
第二固形製剤棟増築
固形製剤棟の改築
(生産能力25⇒35億錠)
(生産能力35⇒50億錠)
1998
2008
2012
2017
メクト
(株)
東北工場買収
山形工場
建設計画開始
山形工場・東日本
物流センター完成
新東日本物流センター完成(移転)
固形製剤棟改装・第二固形製剤棟稼働
(生産能力25億錠)
固形製剤棟改築(生産能力25⇒30億錠)
山形
[ 販売体制 ]
2011
東和式直販体制
2017
2018 ~ 2022
2024 ~ 2026
第二固形製剤棟
設備導入
(生産能力30⇒65億錠)
第三固形製剤棟稼働・設備導入
(生産能力65⇒100億錠)
営業所(2026年4月現在) 68拠点
代理店(2026年4月現在) 25社53拠点
2017年広域卸2社との協業を開始
東和式販売体制へ
04
東和薬品が応える社会課題
薬価制度・薬価改定の仕組み
日本の医療費問題とジェネリック医薬品の重要性
ジェネリック医薬品を含む医療用医薬品の価格
(薬価)は国が決める公定価格であり、薬価の一覧
製造販売です。ジェネリック医薬品とは、新薬( 先発
同じでなければいけないところ
医薬品 )の特許期間などが 過ぎた後に上市される、
①有効成分 ②用法・用量 ③効能・効果
有効成分が同一で効能・効果や用法・用量が同等の
ジェネリック医薬品
有効成分
有効成分
新薬よりも薬価が低いことが大きな特徴です。
日本の国民医療費は高齢化や医療の高度化に伴い
年々増加しており、2025年度は約49.2兆円
※1
有効性や安全性に
違いはありません。
変えても良いところ
カタチや色、味、添加物など
支える労働人口も減少する中、医療費の負担が課題に
ながらも低価格で提供できるため、新薬と置き換える
ことで 年間約 1 . 2 兆円
※3
の 医療費 を 抑 えることが
できます。医療費削減施策の一つとして国主導でジェ
ネリック医薬品の使用促進が進められ、2025年度の
数量シェアは89.7%※4まで拡大しました。現在では、
新薬
(先発医薬品)
原料費・
企業運営費
ジェネリック
医薬品
原料費・
企業運営費
研究・開発費
研究・
開発費
「数量シェアを2 0 2 9 年度末までに全ての都道府県
で 8 0 % 以上」とする主目標とともに 、新 たに「金額
シェアを2029年度末までに65%以上」
とするという
副次目標が掲げられています。
が通常です。国民負担を抑制するため、卸から医療
機関に販売された価格(市場実勢価格)に合わせて
度以降は毎年行われています。基本的に薬価改定
では薬価は引き下がるため、医薬品業界にとって
極めて厳しい状況になっています。
■ 薬価改定
■ 薬の価格の比較(イメージ)
ジェネリック医薬品は 、新薬と同等の効果を持ち
競争によって薬価よりも低い価格で取引されること
度までは2年に1回行われていましたが、2021年
の持続可能性を脅かしており、保険料や税金などを
なっています。
機関に販売する価格は自由に決められるため、価格
※1 厚生労働省「令和5年度医療費の動向」
より
※2 厚生労働省「医療費の将来見通し」
より
※3 厚生労働省「令和7年度薬価基準改定の概要」
より
※4 日本ジェネリック製薬協会「ジェネリック医薬品シェア分析結果について」
より
財務・企業データ
見方もあります※2 。増大する医療費は国民皆保険制度
企業 が 卸・医療機関に販売する価格や卸 が 医療
国が薬価を見直すことを薬価改定といい、2020年
、厚労
省の試算では2040年度には80兆円近くになるとの
支払う価格である薬価は決まっていますが 、製薬
事業を 支える 基盤
新薬
医薬品です。新薬の医療現場での使用経験や情報を
表を薬価基準といいます。患者さんが医療機関に
東和薬品の価値創造
当社グループの主要な事業はジェネリック医薬品の
もとに開発するため研究開発費を抑えることができ、
「こころの笑顔」
の実現
ジェネリック医薬品で医療費の削減に貢献
年間スケジュール
夏頃~
中医協薬価専門部会での業界意見聴取
9月
薬価調査(12月頃に速報値公表)
10月頃~
中医協薬価専門部会での議論
12月
中医協総会での薬価改定骨子決定
1月
中医協総会での薬価算定基準決定
3月上旬
官報告示
4月1日
施行
05
東和薬品が応える社会課題
ジェネリック医薬品企業の
品質問題と供給不安
02
産業構造改革と
薬価制度の見直し
03
「こころの笑顔」
の実現
01
医療インフラとしての
特許満了医薬品の安定供給
このような状況の中、厚生労働省にて医薬品の安定
ジェネリック医薬品の品質や安定供給に対する信頼
2020年に発覚したジェネリック医薬品企業における
供給の確保に向けた課題と対応策を議論するため、
感が低下している現在、
これを払拭するためには製造
品質問題 をきっかけに 、複数 の 医薬品企業 で 製造
2022年8月から医薬品の迅速・安定供給実現に向け
工程の厳格な管理と透明性の高い情報提供、早急な
管理・品質管理上の不備による医薬品医療機器等法
た総合対策に関する有識者検討会、2023年7月から
増産対応と安定供給体制の確立が不可欠といえます。
( 薬機法 )違反 が 発覚し、業務停止 などの 行政処分
後発医薬品の安定供給等の実現に向けた産業構造の
当社では、医薬品産業全体の課題に対し、先発医薬
が 実施されました。製品回収・出荷停止 が 頻発した
あり方に関する検討会が開催されました。
東和薬品の価値創造
ジ ェ ネ リック 医薬品 の シ ェ ア 拡大 が 進 む 中、
品企業、ジェネリック医薬品企業、医薬品製造受託
企業が相互に連携した協業体制の構築に取り組み、
出荷( 新規顧客の注文や増量受注の辞退など、全て
等の実現に向けた産業構造のあり方に関する検討会
特許期間が満了した先発医薬品とジェネリック医薬品
の受注に対応できない状況 )にせざるを得ない連鎖
報告書」では、後発医薬品産業の在るべき姿や具体的
を1つの特許満了医薬品市場として捉え、将来にわた
が 続き、結果として現在も医療機関・薬局に対して
な方策とともに「5年程度の集中改革期間を設定して、
り治療上必要とされる医薬品を持続的に安定供給
十分な供給量が確保できない事態が生じています。
製造管理・品質管理体制の確保および安定供給能力
するエコシステムの 構築と社会全体 の 健全 な 循環
の確保、持続可能な産業構造の実現を目指す」
ことが
モデルの実現を目指しております。本構想の実現に
示されました。
向け、各社との協業を通じて、医薬品の安定供給に
財務・企業データ
2024年5月に公表された「後発医薬品の安定供給
事業を 支える 基盤
ことで、同一成分の医薬品を供給する製薬企業も限定
向けた製造キャパシティの確保と相互 バックアップ
体制の構築に取り組んでまいります。
■ 2026年薬価改定での主な制度改革
■ その他の制度改革
AG(オーソライズド・ジェネ
リック)の薬価上の取扱い
2026年10月以降に新規収載されるAGは先発品と同額の薬価
になる
長期収載品の
選定療養
� 発医薬品のある先発医薬品の一部において薬価差の
後
2分の1が自己負担になる
企業評価指標
各企業の評価の公表、A評価の企業の対象製品(最初の後発品収載
から5年以内の品目、重要供給確保医薬品A・B)は銘柄別に収載
OTC類似薬の
自己負担増加
対象品目は薬剤費の4分の1が自己負担になる
最低薬価引き上げ
乖離率の要件を満たした品目は3.5%引き上げ
不採算品再算定
医療上の必要性が特に高い品目(基礎的医薬品、重要供給確保
医薬品など)を対象に実施
06
東和薬品の全体像
三生医薬ほか
10.6 %
当社グループは、3つの事業を通じて人々の健康に貢献します。
東和薬品ほか
国内ジェネリック医薬品の製造・販売を展開
2025年度
連結売上高
Towa INT
新規市場
Towa INT
欧米でのジェネリック医薬品の製造・販売を展開
新規事業
三生医薬ほか
健康食品・医薬品等の企画・開発・受託製造を展開
20.7 %
東和薬品の価値創造
コア事業
「こころの笑顔」
の実現
東和薬品グループの事業概況
東和薬品ほか
2,737億円
68.7 %
事業を 支える 基盤
連結売上高の多くを占める東和薬品の成長が今後数年間のグループの成長を牽引
すると想定していますが 、中長期 の 成長を見据えてTo w a I N T・三生医薬 ほかの
事業の成長、グループ間シナジ ーの創出にも取り組んでいます。
財務・企業データ
コア事業
東和薬品ほか [東和薬品、ジェイドルフ製薬、大地化成、グリーンカプス製薬、九州医薬 ]
「東和薬品 ほか 」は 、東和薬品 を中心とした 国内
ジェネリック医薬品を取り扱う事業です。東和薬品は
売上高・セグメント利益は、生産数量の増加に伴い市場への供給数量が増加したことと、近年
2 0 2 5 年度決算概況
増収増益となりました。
1 9 5 1 年創業、現在は7 4 1 品目を有する総合ジェネ
リック医薬品メーカーとして、高品質な医薬品の安定
供給に取り組んでいます。
特徴・強み
売上高・利益推移( 百万円)
153,720
● �O D錠/RACTAB®技術などの
「飲みやすく、扱い
100,000
直販体制と広域卸を活用した東和式販売体制
213,200
200,000
150,000
●自
� 社のMRが直接医療機関へ医薬品をお届けする
売上高構成比
250,000
● 大阪・岡山・山形の3工場で175億錠体制を有する
やすい」付加価値製剤の研究開発
追補品の拡売によるセールスミックスの改善や仕切価戦略の効果で単価も上昇したことにより、
127,355
177,481
25,169
188,102
40,000
26,236
2022
売上高
20,000
10,000
2023
セグメント利益
0.3%
3.5%
9.6%
86.6%
30,000
9,471
0
2025年度
31,500
20,400
50,000
50,000
2024
2025
2026 (年度)
計画
0%
50%
東和錠カプ
東和錠カプ以外
東和新規事業等
子会社
100%
07
東和薬品の全体像
新規市場
Towa INT [Towa Pharma International Holdings, S.L.、その他7社]
売上高・セグメント利益は、米国でのニトロソアミン問題による主力製品の売上悪化が続いている
Pharma International Holdings, S.L.を中心と
ものの、欧州のニトロソアミン基準厳格化前の駆け込み需要による欧州BtoBの受託製造の増加
2 0 2 5 年度決算概況
と、欧州BtoCで主力製品が伸びたことにより、増収増益となりました。
した事業です。ジェネリック医薬品を取り扱い、欧州
BtoC事業・欧州BtoB事業・米国事業(BtoC)
の3事業
製造拠点を有しています。欧州BtoBでは欧米以外の
売上高・利益推移( 百万円)
60,000
地域でも販売を展開しており、さらにC M Oに加えて
40,000
開発受託を行うCDMO事業にも取り組んでいます。
20,000
0
800
53,487
●日
� 欧米とその他の国や地域のGMP基準に適合している
500
458
600
28.3%
37.2%
34.5%
200
11
2022
2023
2024
2025
2026 (年度)
計画
−277
売上高
0
0%
50%
100%
−200
セグメント利益
欧州BtoC
欧州BtoB
米国
※2022年度は15ヵ月間の実績です。
財務・企業データ
新規事業
60,000
57,630
449
400
●ス
� ペインのマルトレージャス工場で60億錠体制を有する
● �大型造粒機を用いた大量生産
53,865
49,324
2025年度
事業を 支える 基盤
特徴・強み
売上高構成比
80,000
東和薬品の価値創造
を持っています。
また、欧州に本社機能・研究開発拠点・
「こころの笑顔」
の実現
「Towa INT」は、2019年度に子会社化したTowa
三生医薬ほか [三生医薬、サン・フレイルラボラトリ]
「三生医薬ほか」は、2021年度に子会社化した三生
医薬を中心とした事業です。三生医薬は1993年創業、
売上高は、国内健康食品事業が伸長したものの、
ニューアプリケーション事業が失注により落ち込み、
ほぼ前期並みとなりました。セグメント利益は、利益率の良いニューアプリケーション事業が落ち
2 0 2 5 年度決算概況
込んだことで事業ミックスが悪化し、大幅な減益となりました。
健康食品事業・医薬品事業・ニューアプリケーション事業
( 香料をカプセルに閉じ込めた雑貨向けフレーバー
カプセル)の3事業を持つCDMO企業です。
また、厚原・
南陵・大渕・久沢・千葉の5製造拠点を有しています。
特徴・強み
● �健康食品のCDMO企業として、
国内トップクラスの
マーケットシェアを確立
●ソ
� フトカプセル・シームレスカプセルの製造技術
● �独自の製剤技術
「UniORV®(ユニオーブ®)」
売上高・利益推移( 百万円)
売上高構成比
50,000
5,000
40,000
30,000
2025年度
4,000
28,182
20,000
24,995
1,460
31,600
28,873
28,621
2,000
1,489
861
10,000
0
2022
売上高
2023
セグメント利益
※2022年度は15ヵ月間の実績です。
2024
56.7%
3,000
2,046
2025
計画
35.1%
2,000
1,000
2026 (年度)
8.2%
0%
50%
100%
0
健康食品事業
医薬品事業
ニューアプリケーション事業等
08
TOP MESSAGE
「こころの笑顔」
の実現
安定供給のその先へ
東和薬品の価値創造
“東和品質”を軸に、
10年後の医療インフラを創る
事業を 支える 基盤
医薬品の安定供給は、これからの日本の医療を支える基盤です。東和薬品
は生産体制の進化と協業の拡大により、10年後の医療インフラを見据えた
供給モデルを構築し、社会に安心を届け続けてまいります。
2 0 2 5 年度は安定供給体制の
再構築に向けた一年
吉田逸郎
財務・企業データ
代表取締役社長
年以降一部メーカーの不祥事を契機とした「医薬品の
立上げが 完了しました。東和薬品 3 工場の生産能力
供給不安」が社会問題となり、安定供給体制の確保が
1 7 5 億錠体制が整い、錠剤・カプセルの生産数量も
業界全体の最重要課題となっています。
前期比14.4%増の164.3億錠へと増加しました。
こうした環境下で、2025年度は当社にとって「安定
安定供給体制を強化したことで市場への供給数量
2025年度の国内のジェネリック医薬品使用割合は
供給体制の拡充」を本格的に推し進めた一年でした。
も増加し、2025年度の連結売上高は前期比5.4%増
数量ベースで89.7%(日本ジェネリック製薬協会調べ)
生産能力の増強と品質管理体制の強化を同時に進め、
の2,737億円となり増収を確保。一方で、営業利益は
に 達し、2 0 2 4 年 1 0 月の「長期収載品 の 選定療養
医療機関・患者さんからの信頼に応えるべく全社を
232億円から213億円とわずかに減益となりました。
制度」導入により、ジェネリック医薬品の使用はさらに
挙げて取り組みました。山形工場第三固形製剤棟へ
「東和薬品 ほか 」の 売上高 は 販売数量・単価ともに
促進されています。市場は急拡大する一方で、2021
の追加投資を前倒して行い、2025年10月より設備
伸長し前期比6.0%増の1,881億円、セグメント利益
09
TOP MESSAGE
岡山工場の同50億錠、大阪工場の同25億錠を合わ
計画に対しては未達でした。限定出荷解除後の拡売が
せた 1 7 5 億錠体制 が 実現し、モノづくりは 新 たな
想定より伸びなかったことや、粗利率の良い近年追補
ステージへ進化しています。
品の伸び悩みによりセールスミックスの改善が 進ま
協業による「特許満了医薬品の安定供給
エコシステム」の構築へ
山形工場の第三固形製剤棟では包装工程の自動化
医薬品の供給不安は日本の医療インフラの根幹を
また、三生医薬に関しては 、1 4 7 億円ののれんの
資材の供給を自動ロボットに置き換えることで、8時間
揺るがす課題です。不祥事による製造管理・品質管理
減損損失を計上しました。国内健康食品事業での収益
以上連続無人供給が可能になり、作業負荷が大幅に
の水準が問われる中で、ジェネリック医薬品業界だけ
性低下、
ニューアプリケーション事業の競争環境の悪化、
軽減しました。塩ビフィルムなどの重量物資材の装着
で安定供給に向けた産業構造の再編を行うには、
かなり
東和薬品とのシナジ ー 創出の遅 れによるものです。
も機械を利用して行うなど、女性でも安全に作業でき
の時間を要します。
同社が担う「医療用医薬品以外の健康関連事業」は
る環境を整えています。自動化設備の導入などにより
また、ジェネリック医薬品使用促進政策により長期
当社グループの長期成長に不可欠な領域であり、国内
現場の安全性と効率性を大きく向上させています。
収載品 の 需要 は 急減し、先発医薬品企業 の 工場 は
さらに 、M E S( 製造実行管理システム )とL I M S
生産量の低下に直面しています。国内製造拠点の減少は
事業の回復、グループシナジー創出の加速により、成長
(品質試験情報管理システム)を導入し、データ処理
地域経済にも大きな影響を与えます。特に先発医薬品
軌道への回帰を図ります。
の自動化 を 進 めています。従来 の 手書 きの 記録 を
企業が長年蓄積してきた製造技術、ノウハウ、安全性
さらに、コア事業のジェネリック医薬品の生産能力
システムに転記する作業を自動化することでヒューマン
情報などの貴重な資産が消滅してしまうことは、国や
は大幅に向上したものの、いまだに1 0 0 品目程度は
エラーを防ぎ、品質データの正確性とトレーサビリティ
社会にとっても大きな損失です。国内医薬品産業の
限定出荷となっており、需要増に供給が追いつかない
を大幅に向上させています。
持続可能性にとって大きな課題だと考えています。
状況が続いています。特に品目ごとの需給予測精度の
DX(デジタルトランスフォーメーション)
は単なる効率
これら医薬品産業全体の課題に対し、当社は「特許
向上は大きな課題です。販売数量・生産数量計画の
化ではなく、東和品質を次のステージへと進化させる
満了医薬品の安定供給エコシステム」という新たな
精度向上と需要変動の見極めによる生産能力の最適
基盤です。
スマートファクトリー化とDXによる生産性向上
産業モデルの構築を提唱しています。これは 既存の
配分化を進めています。
と、信頼性の高いデータの構築と統合管理により、製造
長期収載品・AG・ジェネリック医薬品という分類では
管理・品質管理の水準をさらに高めます。そして、
「人が
なく、特許が満了した先発医薬品とジェネリック医薬
行うべき仕事」
と
「機械が担うべき仕事」を明確に分け、
品を「特許満了医薬品」
という1つの大きな市場として
現場の働き方を根本から変えていきます。人は、
データを
捉え、安定供給・持続可能な産業構造への改革を提起
読み解く、仕事の改善を考えるといった判断する仕事に
するものです。この仕組みの実現に向け、先発医薬品
集中し、単純作業は機械に任せる。
こうした取り組みに
企業・ジェネリック医薬品企業・医薬品製造受託企業
より175億錠の生産体制を有機的に機能させ、2030
が相互に連携した新たな産業構造が必要だと考えて
年以降のさらなる拡張に向けた土台を固めています。
います。
1 7 5 億錠体制の実現で
生産体制を新たなステージへ
2025年10月より山形工場の生産能力100億錠、
財務・企業データ
健康食品事業の価格改善、ニューアプリケーション
事業を 支える 基盤
を推進。従来、人海戦術で行っていた個装箱や包装
東和薬品の価値創造
なかったことが要因です。
「こころの笑顔」
の実現
は前期比4 . 2%増の2 6 2 億円と増収増益でしたが、
10
TOP MESSAGE
「こころの笑顔」
の実現
協業を通じて「特許満了医薬品の安定供給エコシステム」を構築
体制を構築するため、当社は先発医薬品企業や医薬品
東和薬品の価値創造
この構想に基づき、社会インフラとしての安定供給
先発医薬品の特許満了を基点とした医薬品の安定供給エコシステムの概念図
製造受託企業との協業を進めています。2026年1月
事業を 支える 基盤
に発表した大塚製薬との協業は、この構想の実現に
向けた極めて重要な第一歩です。同年4月に発表した
アドラゴスファーマ川越や三和化学研究所との協業に
おいては、製造委託による増産だけではなく、有事にも
対応した複数拠点でのバックアップ生産体制の構築を
財務・企業データ
進めていきます。
さらに、同年 7月には田辺ファーマファクトリーの
株式取得を発表しました。田辺ファーマファクトリー
は、原薬から製剤までの一貫生産体制や国際標準に
準拠した高い製造管理・品質管理・品質保証体制、
それを高い水準で支える人材、地域経済への貢献実績
などを有しています。
これらを維持し、共に成長路線を
歩むことは、日本の医薬品供給の将来に大きな意義を
持つものと考えています。持続可能な安定供給や品質
の維持だけでなく、連携による企業資産の承継・活用
も重要なテーマです。
当社 3 工場 の 生産効率化、田辺ファーマファクト
リー2工場の生産能力、アドラゴスファーマ川越・三和
化学研究所などとの委託・協業を通じて、2030年度
11
TOP MESSAGE
ソアミン問題への挑戦」です。今、世界各国で医薬品
( スペイン)は 、優 れた 生産技術と品質管理体制 を
(自社3工場:225億錠、委託・協業:75億錠以上)の
中に発がん性が 懸念されているニトロソアミン類が
有するのが強みです。同工場は日本国内向けに販売
体制構築を目指します。しかし、現在のジェネリック
検出され、製品回収に至る事例が頻発しています。当社
す る エ ソメプ ラゾ ー ル カ プ セ ル 1 0 m g / 2 0 m g
医薬品の一年間の必要量は1,000億錠規模であり、
は、原薬合成担当の化学者(ケミスト)たちが中心と
「トーワ」の 製造 を 2 0 2 4 年 に 開始し、日本 の 安定
有事に備えたバックアップ体制が必要だと考えています。
なり、分析方法 の 確立・ニトロソアミン混入 の 原因
供給にも貢献しています。また、従来の製造よりも約
増産にはさらなる設備投資が必要になり、生産数量が
究明と対策に注力しています。原薬および 製剤製造
4 割程度生産効率が高まる大型設備や、米国向けの
増える中で安定供給を行うために原材料や製品在庫
工程における空気中の窒素酸化物( N O x )がニトロ
注射剤の輸出を進めるべく欧米の品質基準に準拠
の金額も増えています。こうした状況を踏まえた上で
ソアミンの生成・混入の一因であることを突き止め、
した製造技術・ノウハウの日本への導入も進んでいます。
ROIC改善に向け、生産効率を向上させて生産能力の
2 0 2 3 年 に 世界 で 初 めて 発表 しました 。
「数ppb
実際に工場間や研究部門での人の交流も進んでおり、
増加を売上・利益の増加につなげていくことが必要だと
以上のN O xがニトロソ体生成の一因である」とする
日本国発のグローバルジェネリック医薬品企業を目指
感じています。
検証結果 は 、世界で 大きな 反響を呼びました。さら
して、国際感覚を備えたグローバル人材の育成にも
社会インフラとしての「特許満了医薬品の安定供給
なる挑戦としてニトロソアミン制圧 を掲 げ、世界 で
注力しています。
エコシステム」を築くために、何より治療が必要な患者
初めて、N O xを1 0 億分の1( p p b )まで低減させた
当社には 、水なしでも口の中で溶けて飲みやすい
さんに医薬品を届ける使命を果たすためにも、当社の
環境下でアトモキセチン錠を製造し、ニトロソ・アトモ
OD錠(口腔内崩壊錠)や、苦みをマスキングする技術、
考えを訴求し、
さらに協業の輪を広げる必要があります。
キセチン混入量が許容限度値を下回る製剤の製造に
服用しやすい崩壊性と普通の錠剤同様に取り扱える
成功しました。2026年4月には「みらい事業推進室」
硬さを両立した 独自の 製剤技術「 R A C TA B(ラク
を立ち上 げ、専門 チ ームを構成してニトロソアミン
タブ )」など付加価値の高い技術が 数多くあります。
混入対策のプロジェクト管理、研究および 実用化に
患者さんにとって服用しやすく、医療関係者の皆さま
向けた技術開発を通じた事業化の推進に取り組んで
にとって識別しやすく安心して処方・調剤 いただけ
います。チームは「技術革新に妥協はない。」をスロー
る工夫を重 ねてきました。当社グル ープが 持つ最新
ガンに掲げ、
「東和品質」を世界に示すべく取り組んで
の 技術で 改良・改善 を重 ね 続 け、その 時代 の 最新・
います。
最高 のものに更新する製品づくりが「東和品質」を
妥協なく
「東和品質」を追求し、
世界的なニトロソアミン問題に挑戦
当社は安定供給体制を強化するだけでなく、
「製品
総合力No.1の製品づくり」と「東和品質」を追求して
海外医薬品事業 で は 、グル ープ 化 6 年目とな る
います。それは患者さんにとって服用しやすく、医療
Towa Pharma International Holdings, S.L.傘下
関係者の皆さまに安心して処方・調剤いただける製品
のTowa Pharmaceutical Europe, S.L.が生産
を目指して、常に最新の技術で改良・改善を重ね、製品
体制や品質面で高いシナジー効果を発揮しています。
を最新・最高のものに更新していくことです。
欧州医薬品庁(EMA)や米国食品医薬品局(FDA)の
財務・企業データ
委託・協業:60億錠)、2036年度には同300億錠以上
事業を 支える 基盤
基準 に 準拠している 同社 のマルトレ ー ジャス 工場
東和薬品の価値創造
技術イノベーションの代表的な取り組みが「ニトロ
「こころの笑顔」
の実現
には年間生産能力240億錠(自社3工場:180億錠、
支えています。
12
TOP MESSAGE
「こころの笑顔」
の実現
グループで挑む「医療から未病ケア・予防までカバーする未来の実現」
程度減らせる」
というエビデンスの構築を進めています。
が 提供するクラウド型地域医療情報連携 サ ービス
その根拠を示した上で予防 への財源案や、公共性・
「 ヘルスケアパスポート」を協業販売し、その普及に
永続性を担保できる健康情報プラットフォームの社会
努めています。
「 ヘルスケアパスポート」はかかりつけ医
実装を提言していきたいと考えています。
やかかりつけ薬局、病院が連携し、一人の患者さんの
2026 PROACTIVE Ⅲ」では、
「新たなステージに
情報を共有することで適切な医療の提供を実現する
向けた挑戦」を掲げ、これからの医療体制に適応した
もので、在宅医療や介護施設などとの多職種連携に
健康関連事業の創出にグループ全社で挑み、
「『健康
有効なプラットフォームです。東邦大学医療センター
長寿社会』に対応した、医療から未病のケア・予防まで
佐倉病院(千葉県佐倉市)、千葉脳神経外科病院(千葉
カバーする未来への実現」に向けてさまざまな取り組み
県千葉市)、広尾病院(東京都渋谷区)など、病院への
を進めています。重度 な 要介護状態となっても住み
導入も進んでいます。
また、2026年7月以降、地域包括
慣れた地域で自分らしい暮らしを人生の最後まで続ける
ケアシステム浸透へのさらなる貢献を目指し、クラウド
ことができるよう、医療・介護・予防・住まい・生活支援
型健康・医療情報双方向連携サービス「 ヘルスケア
が 包括的 に確保される「地域包括 ケアシステム」の
パスポ ートp l u s 」の提供を開始しています。従来の
構築の実現を目指しています。
強みであった生活者の健康・医療情報を医療関係者
この仕組みは、かかりつけ医が 一人ひとりの患者
や家族と安全かつ双方向に共有できる機能に加え、
さんやご家族と伴走することが求められますが、そこ
生活者が症状を認識してから予防・受診・診断・治療・
には2つの課題があります。
1つ目は1,000~2,000
セルフケアに至るまでの一連の体験や行動の流れを
人規模の住人を支えるために、健康情報を管理する
表すペイシェントジャーニーにアプローチできる機能
データプラットフォームの構築が必要であること。2つ
が強化されました。
目は予防管理に対する医師への診療報酬以外の財源
を確保することです。
財務・企業データ
最終年度を迎えた「第 6 期中期経営計画 2 0 2 4 -
事業を 支える 基盤
当社は1つ目の課題への対応として、TISI株式会社
東和薬品の価値創造
健康寿命の延伸に貢献し、
新たな価値を創出
当社は、2つ目の医師への報酬財源の課題について
も、
「病気のリスク因子を予防することで医療費を一定
13
TOP MESSAGE
グループ百年計画」の1つで、
「モンゴルでの甘草(かん
を超えて人々に必要とされる製品・サービスを提供
ぞう)栽培」を2014年より始動しています。地下資源
する会社であり続けるための象徴として、
こうした長期
の採掘により国土の砂漠化や気候変動が大きな課題
的に地域に貢献できる活動を続けていきたいと考えて
となっているモンゴルに、持続可能な産業創出を目指
います。
当社 グル ープは「人々の 健康 に 貢献 する」という
は「私達はこころの笑顔を大切にします」という当社
品 だけでなく医薬品 の 原料 など幅広 い 需要 がある
企業理念のもと、
これからも品質と供給の両面で社会
グループの企業理念に基づきます。
「こころの笑顔」
とは、
植物です。モンゴル東部のヘンティー県ヘルレン郡に
に貢献してまいります。医療機関・患者さん、株主の
身体が健やかで、こころが満ち足りた状態でいられる
約1,000ヘクタールの土地を確保し、計画的な甘草の
皆さま、そして地域社会の皆さまからの信頼に応える
ことにより、心底(しんそこ)から湧き上がるよろこびが
栽培に向けた準備を進めています。地域の人々の暮らし
ため、当社はこれからも挑戦を続けていきます。
笑顔としてあふれてくる様(さま)を表します。あるべき
を支える産業となることを目指しています。地域や時代
事業を 支える 基盤
す取り組みです。甘草はモンゴルに自生し、食品、化粧
東和薬品の価値創造
当社グループの根本的な考え方、あるべき姿の基本
「こころの笑顔」
の実現
地域活性と「こころの笑顔」を
次世代につなぐ「百年計画」
姿は「いつの時代でも、
どの地域でも、その地域に住ん
でいる人々に必要とされ、必要とされる製品・サービス
を提供する会社であり続ける」
ことです。
社会とその関係を永続的に続けるためには、さま
財務・企業データ
ざまな国や地域社会が活気にあふれ、人々が心身とも
に健康であることが大前提になります。当社は高校生
を対象に地域社会の活性化をテーマにビジネスコン
テストを毎年開催し、若い学生たちが 地域の課題に
目を向け、その解決について考え話し合う機会を提供
しています。2 0 2 5 年日本国際博覧会( 大阪・関西
万博)においては「Better Co-Being」パビリオン主催
の「未来と健康のための高校生ビジネスコンテスト
supported by 東和薬品」
を開催しました。2026年度
も第7回となる「未来と健康のための高校生ビジネス
アイデアコンテスト」を開催します。
また、海外での地域社会との関係構築として、
「 モン
ゴル100年計画」を進めています。当社の理念を体現
するシンボリックな取り組みとして進める「東和薬品
14
「こころの笑顔」
の実現
医薬品企業の連携による
特許満了医薬品の安定供給
当社 で は 、医薬品不足 や 産業 の 持続可能性 と
東和薬品の価値創造
いった 医薬品産業全体 の 課題 に対し、先発医薬品
企業、ジェネリック 医薬品企業、医薬品製造受託
企業 が 相互 に 連携した 協業体制 の 構築 に 取り
組 み 、特許満了医薬品 の 安定供給 エコシステムを
通じた 社会 の 健全 な 循環 モデルの 実現 をビジョン
01 安定供給に向けた協業の取り組み
として掲げ、持続的かつ安定的な供給体制の構築を
事業を 支える 基盤
特集
目指しています。
増産施策として山形工場第三固形製剤棟を新設
し、当社3工場の年間生産能力175億錠が完成した
ものの、需要増に供給が追いつかない状況が続いて
います。さらなる増産が必要になる中、当社 3 工場の
取締役
中村
豪之
増産に加えて協業の取り組みを進めています。ジェネ
リック医薬品企業同士の協業はもちろん、長期収載
ジェネリック医薬品の供給不安が 続く中、治療上
「安定供給 エコシステム 」を 構築し、個々の 施策 を
品を製造している工場も有効活用すべきだと考えて
必要な医薬品を将来にわたり安定的に供給するため
産業全体の仕組みへと発展させることが 重要です。
い ま す。この 考 え 方 の もと 、こ れ ま で に 大塚製薬
には、個社の取り組みを超えた持続可能な供給体制
日本の創薬力を高め、新たな医薬品を迅速に患者へ
株式会社、アドラゴスファーマ川越株式会社、株式
の構築が 不可欠です。当社は、業界や企業の垣根を
届ける「創薬エコシステム」
と、特許満了医薬品を持続
会社三和化学研究所との協業、田辺ファーマファク
越え、各社が持つ製造技術、生産設備、人的資本などの
的に届ける「安定供給エコシステム」を連動させ、医薬
トリー 株式会社の株式取得について発表しました。
強みを生かした企業間連携を推進し、新たなビジネス
品産業を支える両輪として機能させることで、国内
モデルの創出に取り組んでいます。
生産基盤の維持・強化と、医薬品産業および地域経済
安定供給 には 、単 なる増産だけでなく、有事 にも
財務・企業データ
企業間連携による新たなビジネスモデルと
産業構造改革への挑戦
の活性化・発展に貢献します。
対応できるバックアップ 生産体制や、柔軟で強靭な
当社は、医薬品の臨床的価値や技術的価値に加え、
サプライチェーンが求められます。さらに、製薬企業、
安定供給そのものを重要な提供価値と捉え、経済性と
行政、医療機関、流通事業者などが横断的に連携する
社会性を両立する産業構造改革に挑戦していきます。
15
特集
01
医薬品企業の連携による特許満了医薬品の安定供給
大塚製薬とは、医薬品製造における協業体制の構築に向けた基本合意を締結しました
(2026年1月21日開示)。大塚製薬が保有する一部の医薬品(長期収載品かつ基礎
「こころの笑顔」
の実現
■ 大塚製薬株式会社との協業
田辺ファーマファクトリーは2008年設立、医薬品の製造を専門に行い、小野田・
吉富の2工場を有しています。2025年度の生産数量は15.6億錠ですが、当社製品の
製造移管による稼働率向上、増産のための設備投資により、2036年度に40~50億錠
の生産能力を目指します。
また、田辺ファーマが製造販売する
「ウルソ」
「デパス」
「ブロチゾラム」等の17成分35
て、安定供給を目指します。当社が目指す「特許満了医薬品の安定供給エコシステム
品目を承継します。先発医薬品企業が長年蓄積してきた安全性情報や医療現場での
構想」の実現に向けた極めて重要な第一歩として位置付けています。
臨床的知見を継承することも本件の重要な戦略的意義だと考えております。
東和薬品の価値創造
的医薬品を優先)の承継および製造委受託、戦略的協業品目のライセンス活用を通じ
■ アドラゴスファーマ川越株式会社との協業
事業を 支える 基盤
アドラゴスファーマ川越とは 、特許満了医薬品 の 安定供給に向けた協業体制 の
構築に関する基本合意を締結しました(2026年4月16日開示)。製造委託による製造
キャパシティの確保と、相互バックアップ体制の構築を目指します。アドラゴスファーマ
川越川越工場において製造ラインの増強を進め、2029年までに約5億錠規模、2033
■ 株式会社三和化学研究所との協業
三和化学研究所とは、特許満了医薬品の安定供給に向けた複数拠点でのバックアップ
小野田工場
吉富工場
■ 生産能力/供給能力の向上
当社では、医薬品の安定供給に貢献するため、当社3工場の生産効率化、田辺ファーマ
ファクトリー2工場の生産能力増強、アドラゴスファーマ川越や三和化学研究所など
生産体制の構築を目的とした協業に合意しました(2026年4月23日開示)。製造委託
との委託・協業によって、さらなる
による製造キャパシティの確保と、相互バックアップ体制の構築を目指します。三和化学
生産能力向上を図ってまいります。
研究所熊本工場において製造ラインの増強を進め、2028年度までに約7億錠規模の
2030年度には年間生産能力240
250
製造を委託する予定です。
億錠(当社3工場:180億錠、委託・
200
協業:60億錠)、2036年度には同
150
3 0 0 億錠以上(当社 3 工場:2 2 5
100
億錠、委託・協業:75億錠以上)の
50
■ 田辺ファーマファクトリー株式会社の株式取得
田辺ファーマとは、田辺ファーマファクトリーの株式取得および製造販売承認の承継
について合意しました(2026年7月3日開示)。
財務・企業データ
年までに約15億錠規模の製造を委託する予定です。
体制構築を目指します。
(単位:億錠)
300
0
■ 委託・協業
■ 自社 3 工場
180
田辺ファーマファクトリーの
生産能力 40 〜 50 億錠
240
300 以上
75














 <受賞概要>