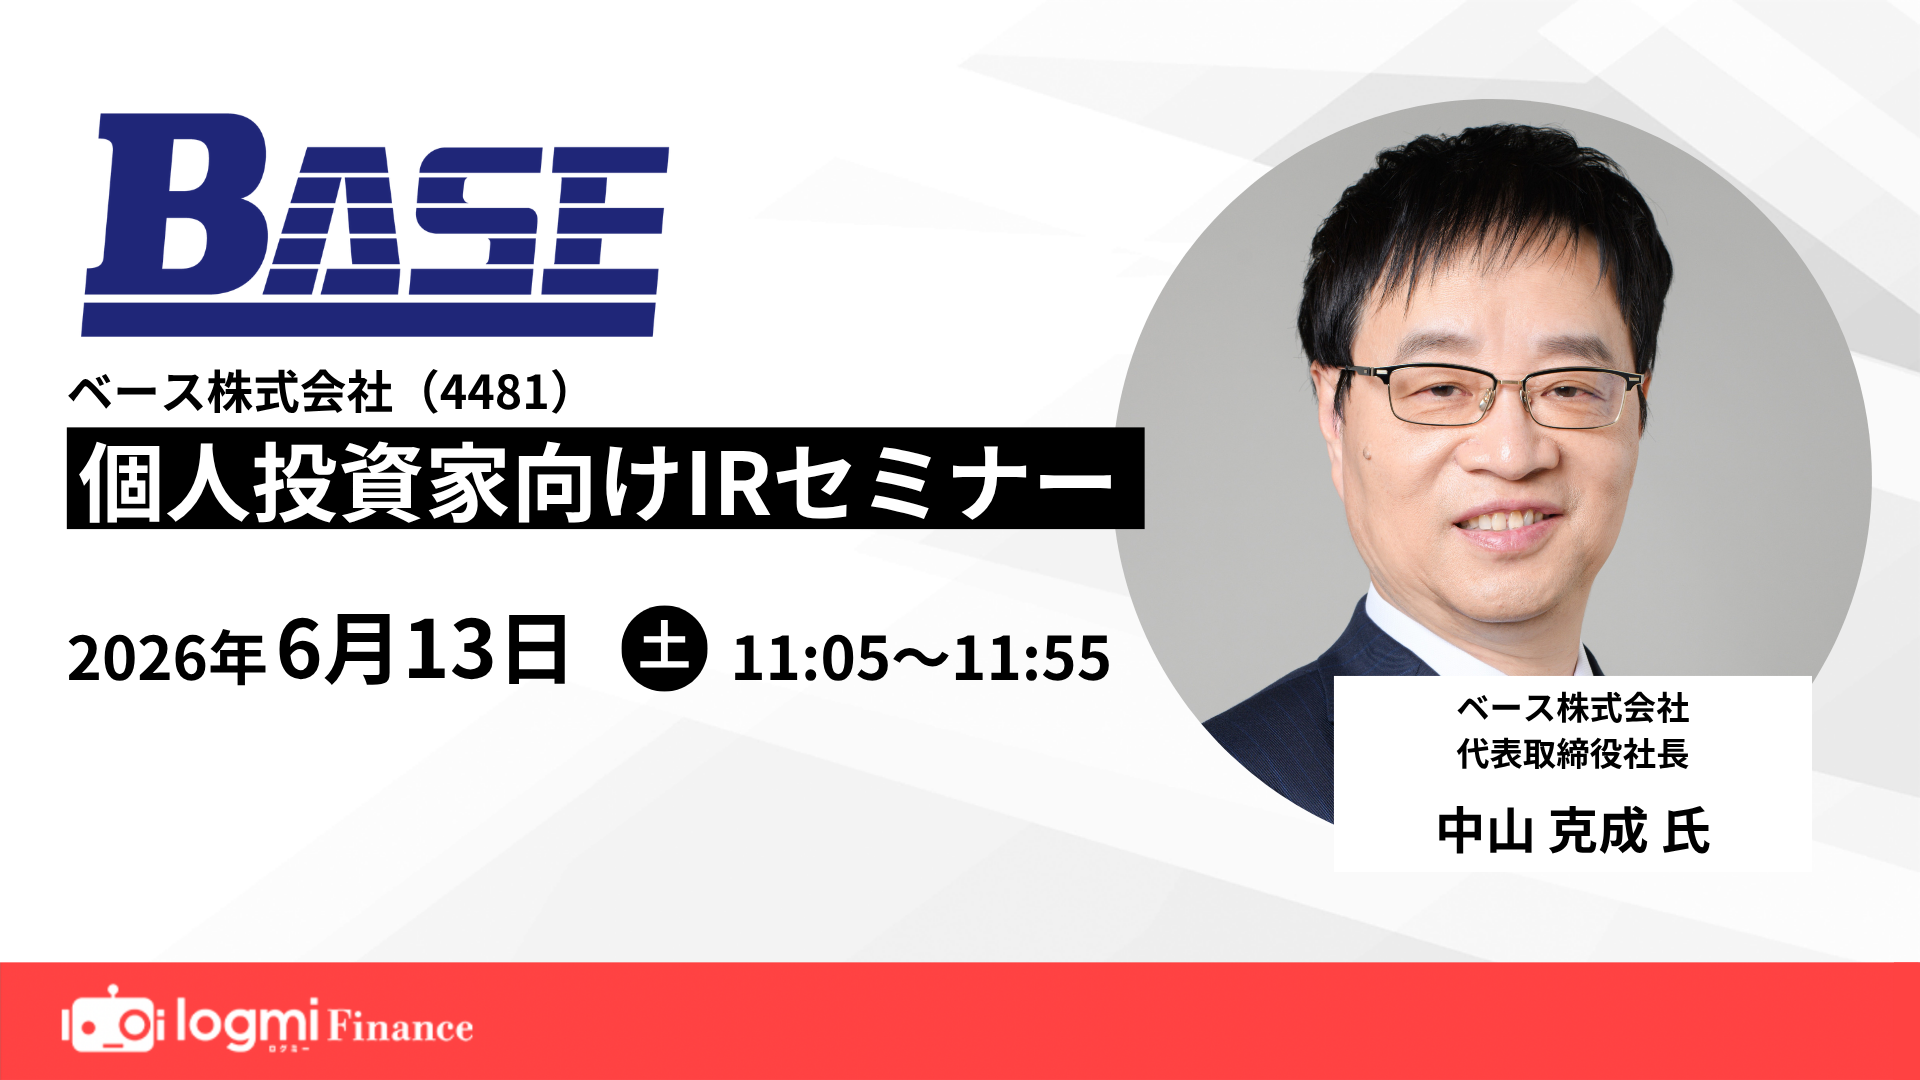
4481 TSE Prime BASE CO., LTD. FY2026 H1 Financial Results Briefing Presenter President & CEO Katsunari Nakayama Date August 17, 2026 Agenda 01 02 03 04 ref Overview of Key Topics Outlook & Shareholder Reference Financial Results H1 FY2026 H2 Key…
4481
TSE Prime
BASE CO., LTD.
FY2026
H1 Financial Results Briefing
Presenter
President & CEO
Katsunari Nakayama
Date
August 17, 2026
Agenda
01
02
03
04
ref
Overview of
Key Topics
Outlook &
Shareholder
Reference
Financial Results
H1 FY2026
H2 Key Initiatives
Returns
Materials
► Performance Summary
► Establishment of
AI Promotion Office
► Toyosu Development
Center Full Launch
► Revenue Growth at
Major SIers
► Partner Recognition
& Awards
► Growth in Shareholders
& Trading Volume
► Earnings Forecast
► Basic Policy
► edium-term Management
Plan"BASE2030"
► Key AI Strategy Initiatives
► Dividend Plan for This
Fiscal Year
► Company Overview &
Growth History
► Our Strengths &
High-Profitability Factors
► Growth Drivers
► Financial Data
© BASE CO., LTD. All Rights Reserved.
► Strengthening AI Talent
Development
► Strengthening AI-Related
Project Proposals
► Lawn Strategy
► IR Activities
1
01
Overview of Financial Highlights
S E C T I O N
© BASE CO., LTD. All Rights Reserved.
2
H1 FY2026 Performance Summary (1)
Results came in significantly below expectations.
H1 performance fell below the prior year and missed the plan.
(Unit: million yen)
Previous Period
Current Period
H1 FY2025
H1 FY2026
Rate of Change
Initial Forecast
(Announced Feb 13,
2026)
Achievement Rate
Net sales
11,014
10,960
(0.5%)
12,040
91.0%
Operating profit
2,920
2,720
(6.9%)
3,223
84.4%
Ordinary profit
2,952
2,738
(7.3%)
3,223
84.9%
Profit attributable to
owners of parent
2,042
1,896
(7.2%)
2,223
85.3%
Net income per share
110.56
104.53
(5.5%)
122.59
85.3%
57
93
93
On plan
(unit: yen)
Dividend per share
(unit: yen)
© BASE CO., LTD. All Rights Reserved.
3
H1 FY2026 Performance Summary (1): Primary Causes of H1 Shortfall
Primary Causes of Shortfall
Primary cause: Major organizational restructuring to implement the Mid-Term Plan "BASE2030"
► Three Steps That Led to the Shortfall
STEP 01
STEP 02
STEP 03
Launch of Mid-Term Plan "BASE2030"
Major Organizational Restructuring
Temporary Slowdown in Order Activity in H1
Shift to an Execution-Ready Structure
Impact on H1 Performance
⚫ Establishment of the Strategy Planning Office
⚫ Establishment of the AI Promotion Office
⚫ Organizational expansion: 4 Systems HQ → 6
System Development Divisions
The transition and ramp-up to the new structure
required time for organizational setup and
internal coordination, temporarily slowing order
activity. Both prior-year and planned targets were
missed.
Transition to a Company-Wide Strategic
Execution Structure
(Including Readiness for the AI Era, etc.)
To evolve into a knowledge-intensive organization,
we shifted to a structure capable of driving
forward the new mid-term plan. In particular, we
recognized the rapid rise of generative AI as a
"once-in-a-generation opportunity," and
repositioned our organization to manage AI
substitution risk while capitalizing on it.
► Positioning — A "Temporary Investment Phase" Toward Future Growth
This is not structural damage to earnings capacity, but a temporary cost of building the foundation for BASE2030. As the new structure is
nearly complete, we expect an early recovery in order activity and a return to a growth trajectory from H2 onward.
© BASE CO., LTD. All Rights Reserved.
4
Q2 FY2026 Results Summary (1): Reorganization for BASE2030
Realigning management focus from divisional command to company-wide growth drivers.
Legend
BEFORE
FY2025 Operating Structure
AFTER
Each System Division is led directly by a Managing Director / Senior Executive Officer as
Division Head. A vertical structure in which the division itself owns the numerical results.
SYSTEM DIVISIONS
Managing Director / Senior Executive Officer
Executive Officer
FY2026 Structure (BASE2030 Operating Framework)
A new Systems Control Division is established, with senior management overseeing
company-wide cross-functional capabilities. On the front line, the structure expands to six
units, each headed by an Executive Officer who owns divisional results.
Company-wide functions
SYSTEMS HEADQUARTERS
System
Headquarters IV
Senior leadership consolidated
Company-wide cross-functional capabilities
Strategic Planning · AI Advancement · Finance ·
System
Headquarters I
System
Headquarters II
System
Headquarters III
Head
Head
Head
Head
System
Development
Division I
Deputy Head
Deputy Head
2 Deputy Heads
Deputy Head
Head
Key characteristics
● Senior executives focused on individual units in siloed structures.
● No dedicated roles for company-wide cross-functional initiatives.
Corporate / Public Sector · Solutions
System
Development
Division II
System
Development
Division III
System
Development
Division IV
System
Development
Division V
System
Development
Division VI
Head
Head
Head
Head
Head
Key characteristics
● Senior executives centralized at Headquarters to drive company-wide growth.
● Executive officers hold field-level accountability; divisions expanded from 4 to 6.
►What this means for investors — three key changes
-
Focused deployment of management resources
-
Organizational expansion (from 4 to 6 units)
-
A clearer accountability structure
Senior executives freed from divisional operations to oversee
growth areas such as AI and corporate strategy
Six-segment coverage of the business delivers faster
decision-making and stronger project execution
Divisional numbers owned by Unit Heads; company-wide
strategy owned by senior management — each role clearly
delineated
© BASE CO., LTD. All Rights Reserved.
5
H1 FY2026 Performance Summary (1): H2 Recovery Measures
Sales activities were strengthened in Q2, with the aim of recovering H2 sales and profits.
Key Initiatives
Intensive Deepening of Key Accounts
Accelerating the Sales PDCA Cycle
Strengthening AI-Related
Project Proposals
Concentrate sales resources on the top 10
Increase the frequency of sales activity
Leveraging internally developed AI talent,
customers by revenue to increase the number
reviews to improve both the quality and
actively advance proposals for AI-related
of high-probability proposals
volume of proposals
projects (including AI-driven development)
Expanding Sales Activity × Improving Sales Productivity
Expanding Sales Activity
⚫
Strengthening new customer
acquisition
⚫
Intensive deepening of key
accounts
⚫
Strengthening referral /
partner-driven sales
Improving Sales Productivity
⚫
Improving proposal content
and quality
⚫
Strengthening pipeline
management
⚫
Accelerating the sales PDCA
cycle
⚫
Rigorous KPI management
Through the above initiatives, we will drive growth in business opportunities and win rate improvements,
targeting H2 sales and profit recovery.
© BASE CO., LTD. All Rights Reserved.
6
H1 FY2026 Performance Summary (2)
Full-year targets remain unchanged; H2 recovery to restore growth trajectory.
Sales trends (million yen)
Operating profit trends (million yen)
6,000
25,000
20,000
4,000
15,000
2,000
10,000
0
5,000
2019 2020 2021 2022 2023 2024 2025 2026
© BASE CO., LTD. All Rights Reserved.
2019 2020 2021 2022 2023 2024 2025 2026
7
Balance Sheet (Consolidated)
Maintaining a stable financial base.
(Unit: million yen)
Equity Ratio
81.7%
End of FY2025
End of H1 FY2026
Change
Current assets
16,106
15,901
(204)
Non-current assets
2,816
2,667
(148)
Total assets
18,922
18,569
(353)
4,288
2,997
(1,290)
12
12
—
4,301
3,010
(1,290)
Shareholders' equity
13,850
14,660
+809
Capital
1,122
1,123
+1
Total net assets
14,621
15,558
+937
Total liabilities and net assets
18,922
18,569
(353)
[Assets]
[Liabilities]
Current liabilities
Non-current liabilities
Total liabilities
[Net Assets]
© BASE CO., LTD. All Rights Reserved.
8
Sales Composition (Non-consolidated)
Overall portfolio unchanged; system development and other solutions growing in share.
Revenue Mix by Service Line
3%
Outside: FY2026
Inside: FY2025
65% →
65%
42% →
47%
11% →
10%
12% →
8%
Solutions
35% →
35%
SAP
23% →
22%
Other Sol.
12% →
13%
System Development
Development
Maintenance & Operations
Staff Support
Non-consolidated
Sales
10,654
million yen
Stock
Stock
Business Features
Diverse Order Channels
In addition to partner orders from major SIers, we also generate direct
orders from end users.
Broad Industry Coverage
We serve a wide range of industries—including securities, distribution,
industrial, public, insurance, and banking—maintaining a portfolio that is not
dependent on any single industry.
© BASE CO., LTD. All Rights Reserved.
9
Sales ratio (consolidated)
Sales Composition by Region
97%
BASE (Japan)
Net sales:
Employees
(1.0%)
1,356
+110
Locations
Tokyo Head Office
Akihabara Development Center
Toyosu Development Center
Diversity-aware composition with a 1:1 ratio of Japanese and non-Japanese
3%
Chinese subsidiary
Net sales:
Employees
Locations
+9.2%
76
Shanghai
Wuxi
(10)
BASE
Chinese subsidiary
Consolidated sales
10,960 million yen
© BASE CO., LTD. All Rights Reserved.
We primarily receive orders from local Japanese-affiliated companies and local
companies, with no offshore revenue.
Response to the Business Environment
In light of the economic environment in China, we are adjusting the personnel and organizational
structure of our Chinese subsidiary to an appropriate and sustainable scale. At the same time,
we are strengthening risk management and optimizing operations across the Group as a whole.
10
Analysis of Factors Contributing to Increase/Decrease in Operating Profit
H1 Closed with a Decline in Profit.
Sluggish revenue growth led to a decline in
utilization rates and gross margin. Combined
with upfront investment in recruitment and
other SG&A items, operating profit decreased
by JPY 200 million.
Operating Profit Waterfall
(Unit: million yen)
Gross profit decrease: (132)
3,000
2,920
(17)
SG&A increase: (68)
(114)
(20)
Decrease in
(30)
(17)
(132) million yen
2,720
Revenue decline
Higher personnel costs
Lower utilization rate
Increase in
(68) million yen
2,000
Strengthened Hiring Activities (Recruitment Fees, etc.)
Higher personnel costs and other expenses due to
headcount growth
© BASE CO., LTD. All Rights Reserved.
Actual
Increase Factors
Decrease Factors
11
02
Key Topics H1 FY2026
S E C T I O N
© BASE CO., LTD. All Rights Reserved.
12
Establishment of the AI Promotion Office
Topic 01
Building a Company-Wide AI Promotion Structure
Background and Positioning
What is AI Empowerment?
The "AI Promotion Office" was established on February 13, 2026,
An initiative that maximizes the capabilities of people and
as the core organization driving the "Innovation Focus" strategy
organizations through proactive use of AI technology, supporting
under BASE2030, accelerating company-wide AI Empowerment
more advanced work and creative activities.
and the evolution toward an IT services–oriented business
model.
Role of the AI Promotion Office
1
AI Skill Enhancement: Equipping existing engineers with AI skills
2
AI Utilization: Applying AI to traditional businesses to boost productivity
3
Tool / Talent Development Evaluation: Research and evaluation of
multiple tools including Cloud Code and Copilot
4
AI Agent Development & Internal Deployment: Creating AI agents
and deploying them into internal systems
AI Promotion Office Achievements
Engineers equipped with AI skills: 90 / Internal systems built using AI-driven development: 2 / Increasing number of AI-related project proposals
© BASE CO., LTD. All Rights Reserved.
13
Toyosu Development Center Now Fully Operational
Topic 02
Development Expansion Complete
— Toyosu Facility Now Fully Operational
Fully Operational
From February 2026
Capacity
Over 200
Background of Full Launch
⚫ Following the increase in in-house projects from customers, the center was newly
established in December 2025 and the structure and environment are now fully in
place.
⚫ The center is now fully operational as an expanded capacity capable of
accommodating up to 1,500 employees for sustainable growth.
Toyosu Development Center
Expected Benefits
Expansion of Contract Development Capabilities:
● Productivity improvement through a better work environment
● Higher employee engagement and satisfaction
By eliminating physical capacity constraints, we are now
positioned to proactively pursue and secure large-scale
development projects.
● More stable project quality through enhanced team communication
© BASE CO., LTD. All Rights Reserved.
14
Revenue Growth at Major SIers
Topic 03
Customer Development Is Advancing Steadily in Line with Strategy
Revenue Mix Trend of Non-Major SIers
Expanding High-Contribution Customer Segments and
Diversifying the Customer Base
✓ Broadening the pool of potential major customer candidates
+9.9 %
- Top 3 SIers: Fujitsu Group, NRI Group, NTT DATA Group
Revenue from major SIers other than the three key
groups (Fujitsu, NRI, and NTT DATA) has been
expanding steadily and is emerging as the fourth
growth pillar.
By achieving consistent and sustained revenue growth, we
aim to establish these SIers as a new core customer pillar.
© BASE CO., LTD. All Rights Reserved.
40.0%
SHARE OF TOTAL REVENUE
Revenue Mix (%)
44.4%
45.0%
leverage our strengths
Revenue Mix of SIers excl. Top 3* (vs. Prior Year-End)
Share
Expansion
50.0%
✓ Continuously strengthening proposals to customers where we can
✓ Revenue from priority customers continues to grow steadily
SHARE UP
34.5%
35.0%
31.2%
30.0%
25.5%
25.0%
20.7%
20.0%
17.2%
15.0%
10.0%
5.0%
0.0%
FY2021
FY2022
FY2023
FY2024
FY2025
FY2026
2Q
15
Partner Recognition & Certification Achievements
Building Cumulative Customer
Evaluation and Deepening Trust
Strategic Significance
Driving high-level recognition and strengthening
relationships through the continuous delivery of value
NEC Corporation
Hitachi Systems, Ltd.
SolCon Co-Creation Day Award
Award
FY2025: Nominated the highest number of participants
for new SolCon partner development
✓ Recognized for contributions to developing
new solution partners
Ref.
Topic 04
Financial Sector Project Contribution Award
✓ Highly valued for contributions
to financial industry projects
Other Key Partner Certification Achievements
Fujitsu Limited
Core Partner Certification
Hitachi Systems, Ltd.
Core Partner Certification
NEC Solution Innovators, Ltd.
© BASE CO., LTD. All Rights Reserved.
Prime Partner Certification
NTT DATA, Inc.
Business Partner Certification
Hitachi Solutions, Ltd.
Excel Partner Certification
ITOCHU Techno-Solutions Corporation Alliance Partner Certification
16
Growth in Shareholder Count and Trading Volume
Topic 05
10,000+ Shareholders and 2x Trading Volume : Broader Retail Engagement
14,000
12,000
10,000
12,000,000
10,000,000
8,000,000
8,000
6,000,000
6,000
4,000
2,000
0
Total Shareholders
Key Changes
Trading Volume (Semi-Annual Total)
Total Shareholders
Trends in Number of Shareholders and Trading Volume
• Number of shareholders increased significantly year-on-year
• Trading volume also increased, improving stock liquidity
• Broader participation from individual investors
Background
We attribute this progress to expanded IR activities, including individual
investor briefings and enhanced information dissemination, which have raised
awareness of the Company and broadened the base of investors.
4,000,000
Going Forward
2,000,000
nstitutional
Investors
We will continue to conduct one-on-one meetings and small-group meetings,
deepening understanding of our growth strategy and capital policy, with the aim
of building a stable shareholder composition.
Individual
Investors
We will continue to expand points of contact and, through enhanced information
disclosure that is easy to understand and enriched dialogue opportunities, aim
to build a shareholder base that supports us over the medium to long term.
0
Trading Volume (Semi-Annual Total)
※ Number of shareholders is based on the shareholder register record date. ※ Trading volume is based on market trading records. ※ The relationship between IR initiatives and shareholder/volume growth reflects the Company's current view based on observed trends in investor engagement.
© BASE CO., LTD. All Rights Reserved.
17
03
Outlook & H2 Key Initiatives
S E C T I O N
© BASE CO., LTD. All Rights Reserved.
18
Earnings Forecast for FY2026
The full-year earnings forecast remains unchanged.
In H2, we aim to recover through strengthened talent development and sales activities to achieve our full-year targets.
(Unit: million yen)
FY2025
(Results)
FY2026
(Forecast)
Increase
/Decrease amount
Rate of change
Net sales
21,787
24,099
+2,311
+10.6%
Operating profit
5,749
6,349
+599
+10.4%
Ordinary profit
5,800
6,349
+549
+9.5%
Profit attributable to owners of parent
4,221
4,563
+341
+8.1%
Net income per share (unit: yen)
229.31
251.59
+22.28
+9.7%
+69
+59.0%
Dividend per share (unit: yen)
© BASE CO., LTD. All Rights Reserved.
117
186
Including a
commemorative
dividend
19
Medium-term Management Plan"BASE2030"
BASE 2030
2026 - 2030
Growth Strategy in the AI
EraTransforming into a
Knowledge-Intensive
Businessby Augmenting
Existing Assets with AI
Evolution Toward an AI-Augmented,
Knowledge-Intensive Business
⚫ Strengthening our existing foundation of people,
customers, and know-how through AI augmentation.
⚫ Shifting away from a labor-intensive, “build-only” delivery
model.
⚫ Delivering higher-value IT services by working closer to our
customers and their business challenges.
Business Model Transformation:
From Labor-Intensive to Knowledge-Intensive
STEP 02
STEP 01
High Value-Added
• Scratch-based development
• Client-specific customization
• IT services–oriented business
• Solutions / AMO / BPO expansion
• Knowledge and management as core
value
Revenue proportional to headcount
(linear growth)
Headcount-independent growth
Non-linear growth
Labor Intensive
© BASE CO., LTD. All Rights Reserved.
Pursuit of the “Last Mile” in IT Services
By completing the “last mile” of execution and decision-making,
we ensure end-to-end resolution of customer challenges.
STEP 03
TARGET
Knowledge Intensive
AI-enabled assetization for exponential growth
• AI-enabled assetization of accumulated
knowledge
• Reproducibility and automation as value
Recurring revenue expansion
High-margin, scalable growth
20
Key AI Strategy Initiatives
Four Key AI Initiatives
AI Talent
Development
AI Research
Function
Objective
AI Literacy Enhancement &
Reskilling
Objective
Internalization of Advanced
Knowledge / AI CoE
Objective
Defensive Profit
Enhancement
Embed AI into daily
workflows and establish a
scalable
Track technological evolution
and build an AI CoE
Increase productivity in
standardized domains to
01
02
Productivity
Improvement
03
AI Products
04
Objective
Validation for Future
Service Commercialization
Key Outputs
Key Outputs
Key Outputs
Key Outputs
✓ Visualization of AI
utilization and maturity
✓ Technology selection
guidelines and
architecture standards
✓ Proposal-ready "solution
PoCs“
✓ PoC results combined
with operational design
✓ Evaluation: workload
reduction and quality
improvement
✓ Clear accountability
boundaries and quality
standards
✓ Continuous updates to AI
training curricula
© BASE CO., LTD. All Rights Reserved.
✓ Internal AI FAQs and
hands-on project support
21
Strengthening AI Talent Development
Leveraging 30 Years of Development Assets to Expand AI-Driven Development Talent
Building an AI Development Foundation Leveraging 30 Years
of Development Assets and Technical Expertise
AI Talent
AI Talent Scale (Practical Level)
30 →
90
Ready to Compete in Practice
Developing talent capable of autonomously
driving the full cycle from proposal to
development
ABAP Agent
TRACE Framework
Built "ABAP Development Agent," an AI-
Built "TRACE Framework," a standard
driven ABAP development platform
framework for AI-driven development0
FDE Talent Development Program
Deployed the FDE (Forward Deployed Engineer) talent development program to drive AI-driven
development, building a continuous pipeline of practitioners who can handle the full cycle from
customer engagement and business design to testing
Plan to develop 60 additional hands-on professionals in H2
As AI-related projects enter a rapid growth phase, we are building a continuous talent pipeline of hands-on professionals
who can both propose solutions and deliver AI-driven development.
© BASE CO., LTD. All Rights Reserved.
22
Strengthening AI-Related Project Proposals
Strong Growth in Deal Volume and Order Value
Deal volume increased sevenfold from the previous second half, while order value doubled.
Going Forward
We will assetize successful outcomes from both prime and SIer-under engagements, converting H2 momentum into a sustainable growth engine.
01
Developing Practical AI Talent and Expanding Capacity
Converting Development Assets and Know-How into an AI Development Platform
02
Scaling Prime Project Success Models
Cataloging Success Patterns
● Leveraging development assets and technical know-how accumulated since our founding to
build an AI development platform.
● Cataloging success stories and configuration patterns from AI-driven system modernization
● Leveraging accumulated domain knowledge across financial, industrial,
● Inquiries about AI agent-based system modernization
Accelerating the FDE Development Program
via an upstream-led approach.
Penetrating Partner / Customer Base
● Continuously producing practical practitioners through the FDE talent development program
to strengthen pipeline depth and upstream engagement capabilities.
● Strengthening proposal activities targeting SIer partners and key customer bases to capture
migration demand.
AI-Related Projects Accepted in H1
CASE 1
PRIME
CASE 2
PRIME
CASE 3
SIer-Under
CASE 4
SIer-Under
Industry: Tax Accounting Firm
Industry: Information & Communications
Industry: Financial
Industry: Manufacturing
Income Tax System Modernization
(AI-Driven Development)
Business Workflow Efficiency Project
Core Accounting System
Legacy Modernization
AI-Driven Development (ABAP)
(COBOL → Java)
© BASE CO., LTD. All Rights Reserved.
23
04
Shareholder Returns
S E C T I O N
© BASE CO., LTD. All Rights Reserved.
24
Basic Policy
基本方針 profit growth directly to shareholder returns
Link
Maintain a target dividend payout ratio of approximately 50% until operating profit reaches
JPY 10 billion
Continue to provide stable dividends while securing sufficient internal reserves necessary for future business expansion and strengthening the management foundation
01
02
03
Target Dividend Payout Ratio: ~50%
Commitment to Dividend Forecast
High Total Shareholder Return Ratio
・Achieve performance-linked dividend
increases
・Return profit growth directly to
shareholders through stable and
sustainable dividends
We regard the dividend forecast
announced at the beginning of the fiscal
year as a firm commitment to our investors
and will not reduce dividends due to
performance fluctuations.
We deliver a high total shareholder return
ratio through dividends and share buybacks,
while promoting shareholder returns with an
emphasis on capital efficiency.
Track Record
FY2024:77.0%
FY2025:79.3%
Performance-Linked Model
© BASE CO., LTD. All Rights Reserved.
Strict Adherence to Initial Dividend
Forecast
Agile Capital Policy
25
Trend in Dividends of Surplus
SPECIAL
Implementation of a 30th Anniversary Commemorative Dividend
To commemorate the Company’s 30th anniversary and to express our gratitude to our shareholders for their continued support,
we plan to pay a commemorative dividend in addition to the ordinary dividend.
Dividend per Share (DPS) Trend
200
180
160
140
120
100
80
60
40
20
0
Share Buybacks
Commemorative Dividend
Year-End Dividend
Interim Dividend
186
Share Buybacks
Share Buybacks
117
92
52
52
60
56
20
FY2021
20
FY2022
30yen
60 Interim
Year-End
30yen
102
76
40
73.9
63
40
50
57
63
FY2023
FY2024
FY2025
FY2026
(forecast)
93
※Figures have been retroactively adjusted to reflect the stock split (1:2) effective October 1, 2022.
© BASE CO., LTD. All Rights Reserved.
26
Reference Materials
Reference Materials
Company Overview
& Growth History
Growth Drivers
(Diversity & Customer Focus)
© BASE CO., LTD. All Rights Reserved.
Our Strengths
& High-Profitability Factors
Lawn Strategy
IR Activities
27
Company Overview
Reference materials
Company Overview
Company name
BASE CO., LTD.
Representative
name
Katsunari Nakayama
MISSION・PHILOSOPHY
MISSION
“Continue to provide new value to our customers”
Head office
address
4-14-1 Sotokanda, Chiyoda-ku, Tokyo
Established
January 1997
Capital
1.123 billion yen
(as of the end of June 2026)
Number of
employees
Non-consolidated: 1,356
Consolidated: 1,432
(as of the end of June 2026)
Fiscal year end
December
Business
description
Computer software development and
related work
© BASE CO., LTD. All Rights Reserved.
PHILOSOPHY
Mutual respect
Sincerity
Doing our best
28
Growth Trajectory / Milestones
Reference materials
Expansion in Scale and Trust (1997–2025)
Steady growth since inception, accelerating to approximately 20% annual growth in recent years
Milestones
Net sales
(100 million yen)
250.0
Number of employees
(people)
※Consolidated basis since FY2017
1,400
January 1997
Founded
1,200
200.0
2010s
1,000
150.0
100.0
800
Began transactions with
multiple major SIers
December 2019
600
Listed on the Tokyo Stock
Exchange Second Section
400
December 2020
Designated to the Tokyo Stock
Exchange First Section
50.0
200
0.0
© BASE CO., LTD. All Rights Reserved.
0
April 2022
Transitioned to the Tokyo Stock
Exchange Prime Market
29
Our Strengths
Reference materials
01
Diversity and Talent
Acquisition Capability
Our Proprietary Growth Model:
“Lawn Strategy”
Established two recruitment pipelines in Japan and China
Developing department heads as “unit entrepreneurs”
Approximately half of employees are non-Japanese, reflecting a highly
diverse workforce
Scaling horizontally through small, flat organizational units
Stable and continuous access to top-tier engineering talent
Enabling autonomous operations through delegated authority
Talent Acquisition Capability
~2× the industry average
Field-Driven Operations and Fast
Decision-Making
03
Organizational Model
02
Distributed and Autonomous
Organization
Lean and Highly Efficient
Organizational Structure
04
Decision-makers are embedded at customer sites and on the front lines
Thorough streamlining of back-office and administrative functions
On-site issues are identified and resolved immediately
Tight control of indirect costs to sustain a high-profitability structure
Hands-on leadership and practical guidance by playing managers
Reinvesting profits into improved engineer compensation and strategic
investments元
Development Engagement Ratio
© BASE CO., LTD. All Rights Reserved.
About 95%
Management Efficiency
High-Profitability Structure
30
Key Drivers of High Profitability
Reference materials
Three Reasons Behind Our Above-Industry-Average Profitability
Efficient SG&A Structure
Low-Cost Operations
Rigorous elimination of waste through focused
resource allocation
Customer Concentration Strategy
・By focusing on a defined set of target
customers, we significantly reduce sales and
marketing costs
Single-Segment Operating Model
・Operating within a single segment allows us to
avoid complex organizational structures
・Back-office functions are highly standardized
and optimized
Lean Management Structure
・Maintaining a minimal indirect workforce
contributes directly to higher profit margins
© BASE CO., LTD. All Rights Reserved.
Maximizing
Revenue-Generating
Resources
95%%
95%%
SE Ratio
Utilization Rate
Focus on Revenue-Generating Functions
・Approximately 95% of employees are
engineers, maximizing a revenue-generating
workforce
Maintaining a High Utilization Rate
・Strong demand and optimal resource
allocation minimize bench time and idle capacity
All-Hands-On Management Model
・Managers also act as playing managers,
contributing directly to revenue generation on the
front lines
No Loss-Making
Projects
Rigorous Risk Control
Eliminating unprofitable contracts and securing
reliable profitability
Deep Domain Knowledge
・Long-term relationships with the same
customers enable a deep understanding of their
business and workflows, preventing rework and
inefficiencies
Thorough Field-Driven Approach
・Department heads and executives are
embedded on the front lines, allowing early
detection of potential issues and immediate
follow-up
Profit-Focused Evaluation System
・Operating profit is the primary performance
metric
・This structurally prevents profit-dilutive deals
driven by revenue-only targets
31
Growth Driver (1): Diversity
Ratio of Non-Japanese Employees
Reference materials
Two Recruitment Pipelines: Japan and China
Japan Recruitment Pipeline
42%
China Recruitment Pipeline
Stabilized Hiring of New Graduates and
Experienced Professionals
Securing Top-Tier IT Talent
・Regular recruitment from domestic universities
and technical schools
・Mid-career hiring through recruitment agencies
・Active promotion of employee referral hiring
・Strategic partnerships with leading local
universities
・Job-ready engineers with prior Japanese
language training
Competitive Advantage Created by Diversity
Employee Composition
(non-consolidated)
Japanese Nationals
Non-Japanese Nationals (China, etc.)
© BASE CO., LTD. All Rights Reserved.
Multi-Perspective
Problem Solving
Collaboration among members with diverse
cultural backgrounds enables flexible,
unbiased problem-solving beyond conventional
assumptions
Organizational Vitality
and Team Strength
・The integration of diverse values accelerates
innovation
・Deep mutual understanding fosters strong
teamwork and an energized organization
32
Growth Driver (2): Customer Concentration
Reference materials
Customer Concentration Strategy
Stable growth and deepened relationships through strategic focus on major SIers
Multi-Pillar Key Customer Strategy
Expanding the number of core
customers strengthens management
stability and resilience
Strategic Highlights
Concentrated allocation of resources to
selected major SIers
Prioritizing long-term trust-based
relationships over short-term gains
Maximizing opportunities to participate in
large-scale, mission-critical projects
© BASE CO., LTD. All Rights Reserved.
Benefits of Strategic Customer Concentration
Stable Order Intake
Accumulation of Technical
Expertise
Strengthened Trust-Based
Relationships
Continuous project inflow enables
us to maintain a consistently high
utilization rate
Deepening knowledge of specific
customers’ systems and business
processes enhances specialization
and prevents rework
Establishing a trusted partner
position enables participation in
upstream phases of large-scale
projects
Risk Diversification Initiatives
Expansion to New
SIer Clients
Initiating new engagements
with additional major SIers
beyond existing customers to
broaden the customer portfolio
Expansion of Direct
Transactions
Strengthening direct sales to
end-user companies to
increase the share of prime
contracts
Solution Portfolio
Expansion
Diversifying revenue sources
by expanding solution
businesses such as SAP and
Salesforce
33
Lawn strategy
Reference materials
Our Proprietary Growth Model: “Lawn Strategy”
A proprietary organizational model designed to prevent the drawbacks of excessive hierarchy and to enable sustainable growth and scalability.
Conventional Organizations
Horizontally Scalable
Paradigm Shift
“Lawn-Style” Organization
Pyramid Structure
Multiple layers slow down
decision-making
Unit-Based Entrepreneurial
Management
Each unit head operates the business as an
independent entity with full P/L responsibility.
Hiring and investment authority is delegated to the units,
enabling fast, on-site decision-making.
Autonomous operations foster the development of nextgeneration management leaders.。
Impact of the “Lawn Strategy”
© BASE CO., LTD. All Rights Reserved.
An organizational structure that expands horizontally
by adding autonomous units, without increasing hierarchical layers.
Flat and Scalable Organizational
Expansion
Strong Commitment to a FieldDriven Approach
Prevents growth stagnation caused by limited
management positions and enables virtually unlimited
organizational expansion。
Keeps the organization lean by avoiding the buildup of
middle management layers and streamlining corporate
functions
Maintains an open, transparent organization with
minimal information loss and fast communication
Department heads actively work on the front lines as
engineers, directly experiencing customer challenges
firsthand。
95% of the organization, including management,
remains directly involved in development, ensuring onthe-ground insight is never lost
Close and continuous communication with customers
enables deep understanding of underlying and latent
needs
Agile and flexible
organizational operations
Sustained high growth
potential
A lean, high-profitability
business structure
34
Proactive Implementation of IR Activities
For institutional investors
Reference materials
Individual Investor Events for This Fiscal Year
5.30
One-on-One Meetings
6.13
We place great importance on dialogue with institutional
investors.
Requests for meetings or interviews are accepted on an ongoing
basis via the platform listed below.
Requests may also be submitted by email.
8.1
9.13
Request a Meeting
※For institutional investors
Mail:[email protected]
取材を申し込む
© BASE CO., LTD. All Rights Reserved.
11.26
12.13
Individual Investor Summit
IRTV
IR Seminar for Individual Investors
Logmi Finance
Radio Nikkei National Seminar
Radio Nikkei & PRONEXUS
Completed
Completed
Completed
IR Seminar for Individual Investors
KabuBerry
Koekiku IR Online Seminar
PRONEXUS
Logmi IR Meet
Logmi Finance
35
Disclaimer
Purpose and Nature of This Document
This document has been prepared solely for informational purposes and does
not constitute an offer to sell or a solicitation to buy any securities.
Inquiries related to IR
BASE CO., LTD.
Forward-Looking Statements
This document contains forward-looking statements, including forecasts, plans,
and management targets related to the Company. These statements are based
on assumptions and expectations regarding future events and trends that are
believed to be reasonable at the time of preparation; however, there can be no
assurance that these assumptions will prove to be accurate. Actual results may
differ materially from those expressed or implied by such forward-looking
statements due to various factors.
[email protected]
The Company undertakes no obligation to update or revise any forwardlooking statements contained herein, except as required by applicable
disclosure regulations.
© BASE CO., LTD. All Rights Reserved.
36

 お問い合わせ
 企業情報
 IR情報
 事業領域
 採用情報