|
Harima Chemicals Group, Inc. is a holding company that manages a group of subsidiaries engaged in the production of chemical products, papermaking chemicals, electronic materials, and adhesives. The group's core business involves refining crude tall oil to produce tall rosin and tall fatty acids, which are used to manufacture synthetic resins and chemical products for coatings, printing inks, synthetic rubber emulsifiers, and pressure-sensitive adhesives. In the papermaking chemicals segment, the company produces paper strength enhancers, sizing agents, and barrier coating agents for cardboard and paper products. The electronic materials division supplies soldering materials, semiconductor resist resins, and aluminum brazing materials for heat exchangers in automotive and home appliance applications. The group also operates the Rotator business, which manufactures adhesives, inks, and road marking paint resins through manufacturing bases in seven countries. Additional operations include the management of warehouse facilities, hotel and golf course operations, real estate management, and the production of industrial detergents and food products. Key subsidiaries include Harima Chemicals Co., Ltd., Harima M.I.D. Co., Ltd., Harima USA, Inc., Plasmine Technology, Inc., and LAWTER B.V. Summarised from the annual report, fiscal year ended Mar 2026 |
Industry Specialty Chemicals | Homepage harima.co.jp |
| Sector Basic Materials | IR page harima.co.jp | |
|
Tags
tall oil derivatives, coating resins, printing ink resins, synthetic rubber emulsifiers, pressure-sensitive adhesives, papermaking chemicals, paper strength enhancers, soldering materials, semiconductor resist resins, brazing materials, road marking paints, industrial detergents, Harima Chemicals Co. Ltd., Harima M.I.D. Co. Ltd., Harima USA Inc., Miyoshi Chemical Industry Co. Ltd., Plasmine Technology Inc., Hangzhou Hanghua Harima Chemical Co. Ltd., Dongguan Hanghua Harima Paper Chemicals Co. Ltd., Shandong Hanghua Harima Chemical Co. Ltd., Akita Jujo Chemical Co. Ltd., Nippon Filler Metals Co. Ltd., Harimatec Inc., Hangzhou Harima Electronic Materials Technology Co. Ltd., Harimatec Malaysia Sdn. Bhd., Harimatec Czech s.r.o., HARIMA UK LTD., LAWTER B.V., SunPine AB, Harima Chemicals Trading Co. Ltd., Seven River Co. Ltd., Harima Foods Co. Ltd., Harima Chemicals Management (Shanghai) Co. Ltd.
|
Press page harima.co.jp/newsroom |
Metrics
| Valuation | |
|---|---|
| Market cap | ¥ 29.106B |
| Market cap (USD) | $ 181.913M |
| P/E | 6.42 |
| PEG | 0.17 |
| P/BV | 0.65 |
| P/S | 0.26 |
| P/OCF | 2.84 |
| P/FCF | 4.68 |
| Dividend yield | 3.8% |
| Turnover / mcap | — |
| Returns | |
|---|---|
| ROE | 5.9% |
| ROI | 3.0% |
| ROIC | 3.1% |
| Profit margin | 2.3% |
| Growth | |
|---|---|
| Revenue growing | Yes |
| Profits growing | Yes |
| Revenue up 3y | No |
| Revenue up 5y | No |
| Earnings growth 3y (net profit CAGR) | 38.3% |
| Quality | |
|---|---|
| Profitable | Yes |
| Margin expanding | Yes |
| Buying back stock | No |
| Diluting (TTM) | No |
| Debt/Equity | — |
| Podcast bulls (TTM) | Sign up |
| Podcast bears (TTM) | Sign up |
| Podcast sentiment (TTM) | Sign up |
| Podcast sentiment % (TTM) | Sign up |
| News sentiment (TTM) | 20 |
| Quality score | 22.2% |
| Insiders | |
|---|---|
| Buys, 1w | Sign up |
| Buys, 1m | Sign up |
| Buys, 1y | Sign up |
| Sells, 1w | Sign up |
| Sells, 1m | Sign up |
| Sells, 1y | Sign up |
Sign up to see this company's insider trades
| Figure | FY 2026 | FY 2025 | FY 2024 | FY 2023 | FY 2022 | FY 2021 | FY 2020 | FY 2019 | FY 2018 | FY 2017 | FY 2016 | FY 2015 | FY 2014 | FY 2013 |
|---|---|---|---|---|---|---|---|---|---|---|---|---|---|---|
| Revenue | 103.763B | 101.006B | 92.33B | 94.511B | 76.093B | 62.851B | 71.799B | 78.589B | 73.31B | 71.384B | 80.978B | 82.692B | 75.175B | 64.203B |
| Net profit | 2.345B | 763M | -1.161B | 885.728M | 1.746B | 1.091B | 2.218B | 4.131B | 2.726B | 2.421B | 1.223B | -1.026B | 280.155M | 216.065M |
| Free cash flow | 4.229B | 639M | -3.075B | -4.796B | -22.992M | 712.735M | 2.702B | 1.601B | 1.018B | 4.646B | 1.681B | — | — | — |
| Figure | FY 2026 | FY 2025 | FY 2024 | FY 2023 | FY 2022 | FY 2021 | FY 2020 | FY 2019 | FY 2018 | FY 2017 | FY 2016 | FY 2015 | FY 2014 | FY 2013 |
|---|---|---|---|---|---|---|---|---|---|---|---|---|---|---|
| Share price | 908.44 | 849.75 | 925.11 | 876.92 | 798.33 | 944.03 | 1.123K | 1.029K | 810.86 | 782 | 538 | 458.03 | 458.03 | 462.06 |
| Price performance 12m | 0.07 | -0.08 | 0.05 | 0.1 | -0.15 | -0.16 | 0.09 | 0.27 | 0.04 | 0.45 | 0.17 | 0 | -0.01 | — |
Filed figures
Lines the statements and their notes report beside the headline figures, read from the filings' XBRL as filed (no restatement applied), with figures computed from one filing's own lines. Cash-flow lines carry their cash direction: an outflow is negative. Each period links to its filing; a figure's period, report date and tag are in its tooltip.
| Figure | Mar 2017 | Mar 2018 | Mar 2019 | Mar 2020 | Mar 2021 | Mar 2022 | Mar 2023 | Mar 2024 | Mar 2025 | Mar 2026 |
|---|---|---|---|---|---|---|---|---|---|---|
| Balance sheet detail | ||||||||||
| Trade receivables (JPY) | 17.9B | 20.3B | 21.5B | 17.6B | 17.5B | 40.3B | 44.6B | 43.7B | 41.6B | 41.3B |
| ↳ YoY growth | -5.6% | +13.0% | +6.3% | -18.4% | -0.6% | +130.7% | +10.8% | -2.1% | -4.7% | -0.7% |
| ↳ 5y CAGR | -1.7% | +17.6% | +17.1% | +15.2% | +18.8% | +18.8% | ||||
| Borrowings, current (JPY) | 5.39B | 13.5B | 15B | 13.7B | 9.06B | 8.04B | 25.4B | 31.2B | 28.5B | 21.9B |
| Borrowings, non-current (JPY) | 10.5B | 2.36B | 2.39B | 3.25B | 7.73B | 12.7B | 6.19B | 6.2B | 11.7B | 15.9B |
| Lease liabilities (JPY) | 1.18B | 1.11B | 1.03B | 943M | 890M | 805M | 2.03B | 1.92B | 2.35B | 2.65B |
| Cash and deposits (JPY) | 4.11B | 3.71B | 3.35B | 4.01B | 3.48B | 5.37B | 6.3B | 6.85B | 4.75B | 6.26B |
| Intangible assets (JPY) | 931M | 942M | 788M | 740M | 558M | 713M | 5.23B | 4.99B | 4.69B | 4.39B |
| Net debt (borrowings + leases - cash) (JPY) | 12.9B | 13.3B | 15.1B | 13.9B | 14.2B | 16.1B | 27.4B | 32.5B | 37.8B | 34.2B |
| Cash flow detail | ||||||||||
| Operating cash flow (JPY) | 6.84B | 2.78B | 4.18B | 6.19B | 3.01B | 2.83B | -466M | 353M | 6.15B | 7.86B |
| Purchases of property, plant and equipment (JPY) | -2.04B | -1.64B | -2.53B | -3.48B | -2.23B | -2.59B | -3.52B | -3.3B | -5.46B | -3.58B |
| Purchases of intangible assets (JPY) | -155M | -115M | -49.6M | -177M | -68.6M | -267M | -807M | -132M | -45M | -50M |
| Change in receivables (cash effect) (JPY) | 675M | -2.38B | -1.61B | 3.77B | -99.8M | -1.75B | -909M | 1.12B | 1.92B | 335M |
| Change in inventories (cash effect) (JPY) | 882M | -699M | -197M | -1.49B | 554M | -2.57B | -2.04B | -3.58B | -440M | 526M |
| Change in payables (cash effect) (JPY) | 575M | 580M | 311M | -88.7M | -596M | 2.01B | -1.19B | 125M | -266M | -517M |
| Dividends paid (cash effect) (JPY) | -389M | -519M | -755M | -967M | -955M | -956M | -998M | -1.02B | -1.02B | -1.02B |
| Share buybacks (cash effect) (JPY) | — | — | -396M | -606M | -99,000 | -84,000 | -868M | 0.00 | — | 0.00 |
| Interest paid (cash effect) (JPY) | -299M | -311M | -275M | -297M | -235M | -283M | -411M | -574M | -944M | -1.1B |
| Income taxes paid (cash effect) (JPY) | -594M | -1.21B | -960M | -1.02B | -783M | -587M | -474M | -596M | -737M | -484M |
| Operating cash flow before change in receivables (JPY) | 6.16B | 5.15B | 5.78B | 2.42B | 3.11B | 4.58B | 443M | -764M | 4.22B | 7.52B |
| Free cash flow (OCF - PPE - intangibles) (JPY) | 4.65B | 1.02B | 1.6B | 2.52B | 713M | -23M | -4.8B | -3.08B | 639M | 4.23B |
| Income detail | ||||||||||
| Research and development expense (JPY) | 2.5B | 2.46B | 2.59B | 2.63B | 2.6B | 2.54B | 2.73B | 2.71B | 2.78B | 2.87B |
| ↳ 5y CAGR | +1.8% | +0.3% | +2.1% | +0.9% | +1.1% | +2.0% | ||||
| Total comprehensive income (JPY) | 2.93B | 2.85B | 3.04B | 1.69B | 795M | 3.81B | 2.76B | 1.55B | 2.26B | 4.48B |
| Comprehensive income to owners (JPY) | 2.8B | 2.53B | 2.78B | 1.35B | 358M | 3.1B | 2.2B | 1.1B | 2.23B | 4.45B |
| Provision for credit losses (JPY) | 3.27M | 4.57M | 7.49M | 6M | 2M | 44.6M | 22.7M | 7M | 24M | — |
| Credit cost ratio (credit losses / average receivables) (%) | 0.0% | 0.0% | 0.0% | 0.0% | 0.0% | 0.2% | 0.1% | 0.0% | 0.1% | — |
| Reported | Jun 26, 2017 | Jun 25, 2018 | Jun 24, 2019 | Jun 25, 2020 | Jun 24, 2021 | Jun 24, 2022 | Jun 26, 2023 | Jun 21, 2024 | Jun 27, 2025 | Jun 25, 2026 |
Sign up to see institutional holdings
Sign UpPodcast Mentions
Sign up to see podcast mentions and sentiment
Sign UpTimely disclosures published on TDnet, newest first, titles as filed in Japanese. The link opens the disclosure on TDnet. Filings with EDINET (periodic reports, extraordinary reports, offerings, holding and buy-back reports), newest first, titles as filed in Japanese. The link opens the filing on EDINET. Press releases from the company's own website, newest first.
本ウェブサイトでは、お客様の利便性の向上およびサービスの品質維持・向上を目的として、クッキーを利用しています。クッキーの利用にご同意いただける場合は、「同意する」ボタンを押してください。詳細につきましては、Cookiesについて をご確認ください。
同意する

========================================================================================
- language
- search
- menu
サイト内検索
NEWSROOM
NEWSROOM
10/31(土)のハロウィーンパーティーにご来園ありがとうございました
2026年11月02日
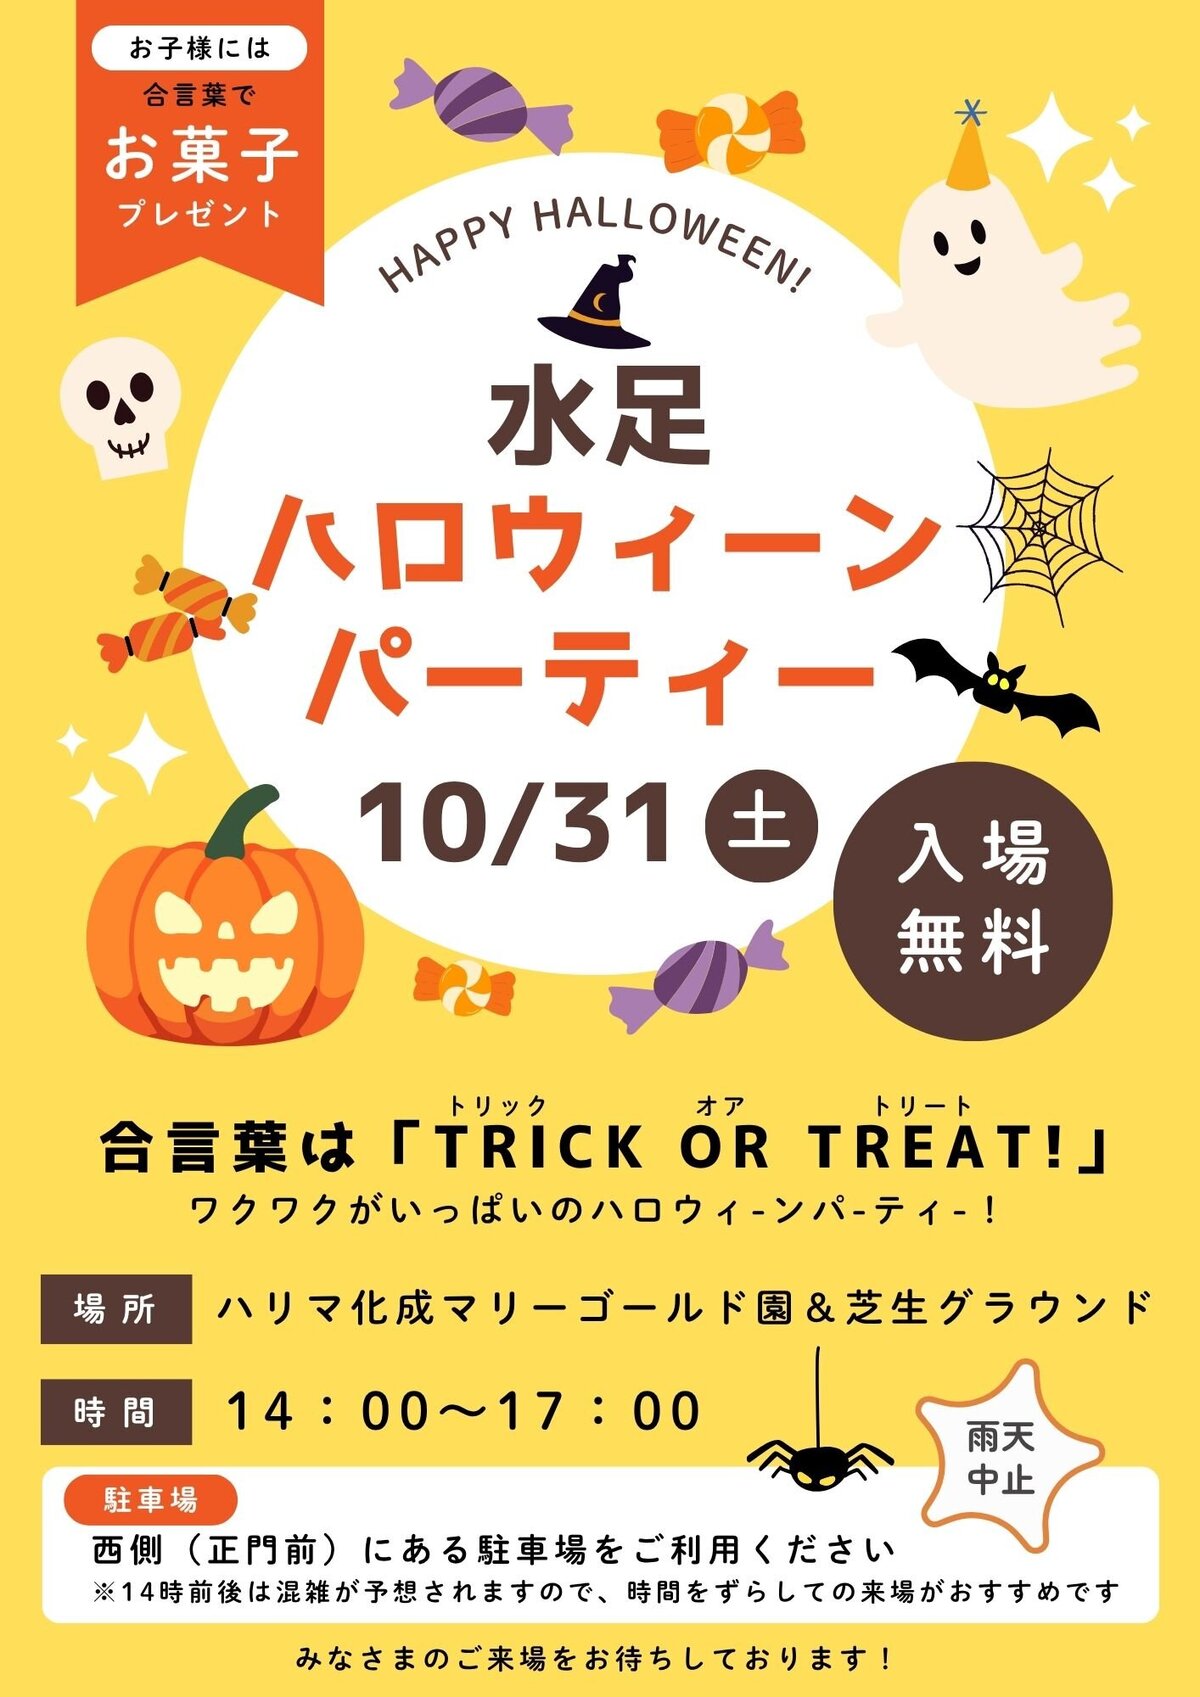
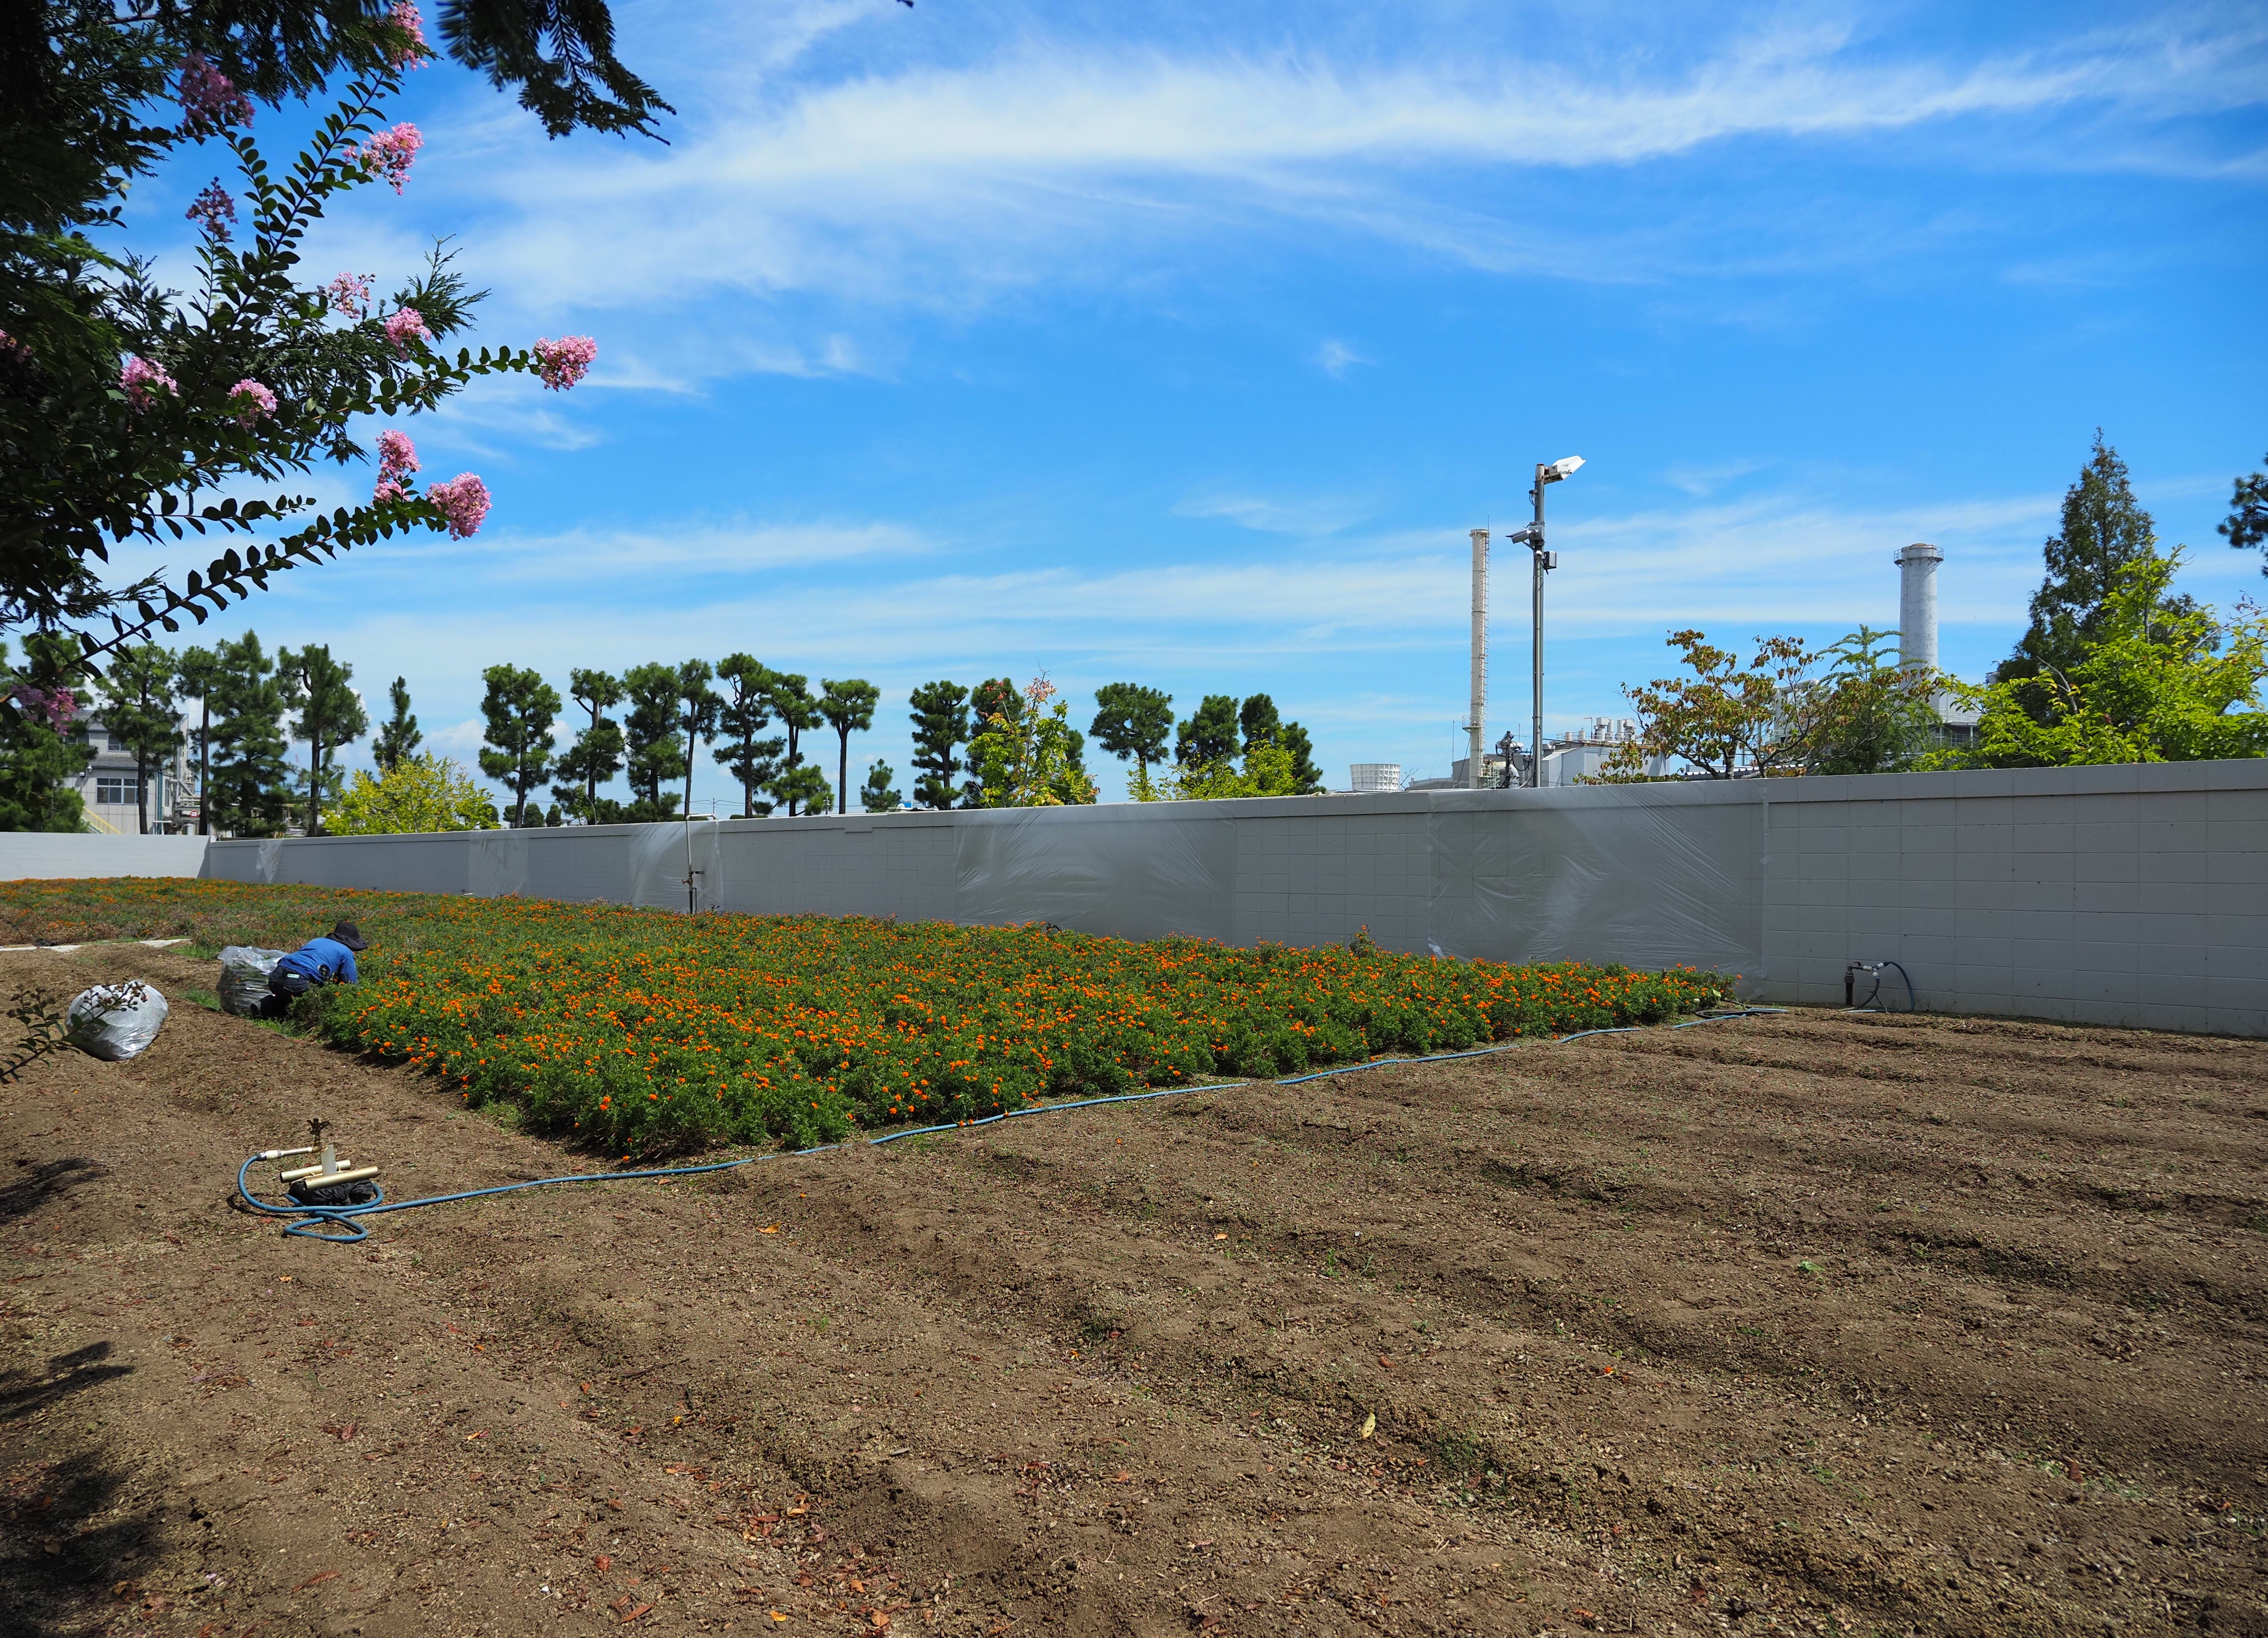
マリーゴールド園では、10月31日(土)にハロウィーンパーティーを開催しました。今年は好天にもめぐまれ、過去最高となる2,500人の方々にご来園いただきました。
今年はゲストにティラノサウルスさんと猫さんもパーティーを盛り上げに遊びに来てくれました!ご来園のみなさま、ゲストのみなさま、「水足ハロウィーン」にお越しいただきありがとうございました。
これからも頑張って、ハリマから元気をお届けします!
開催概要はこちら:
https://harima.co.jp/newsroom/2026/1020150000.html
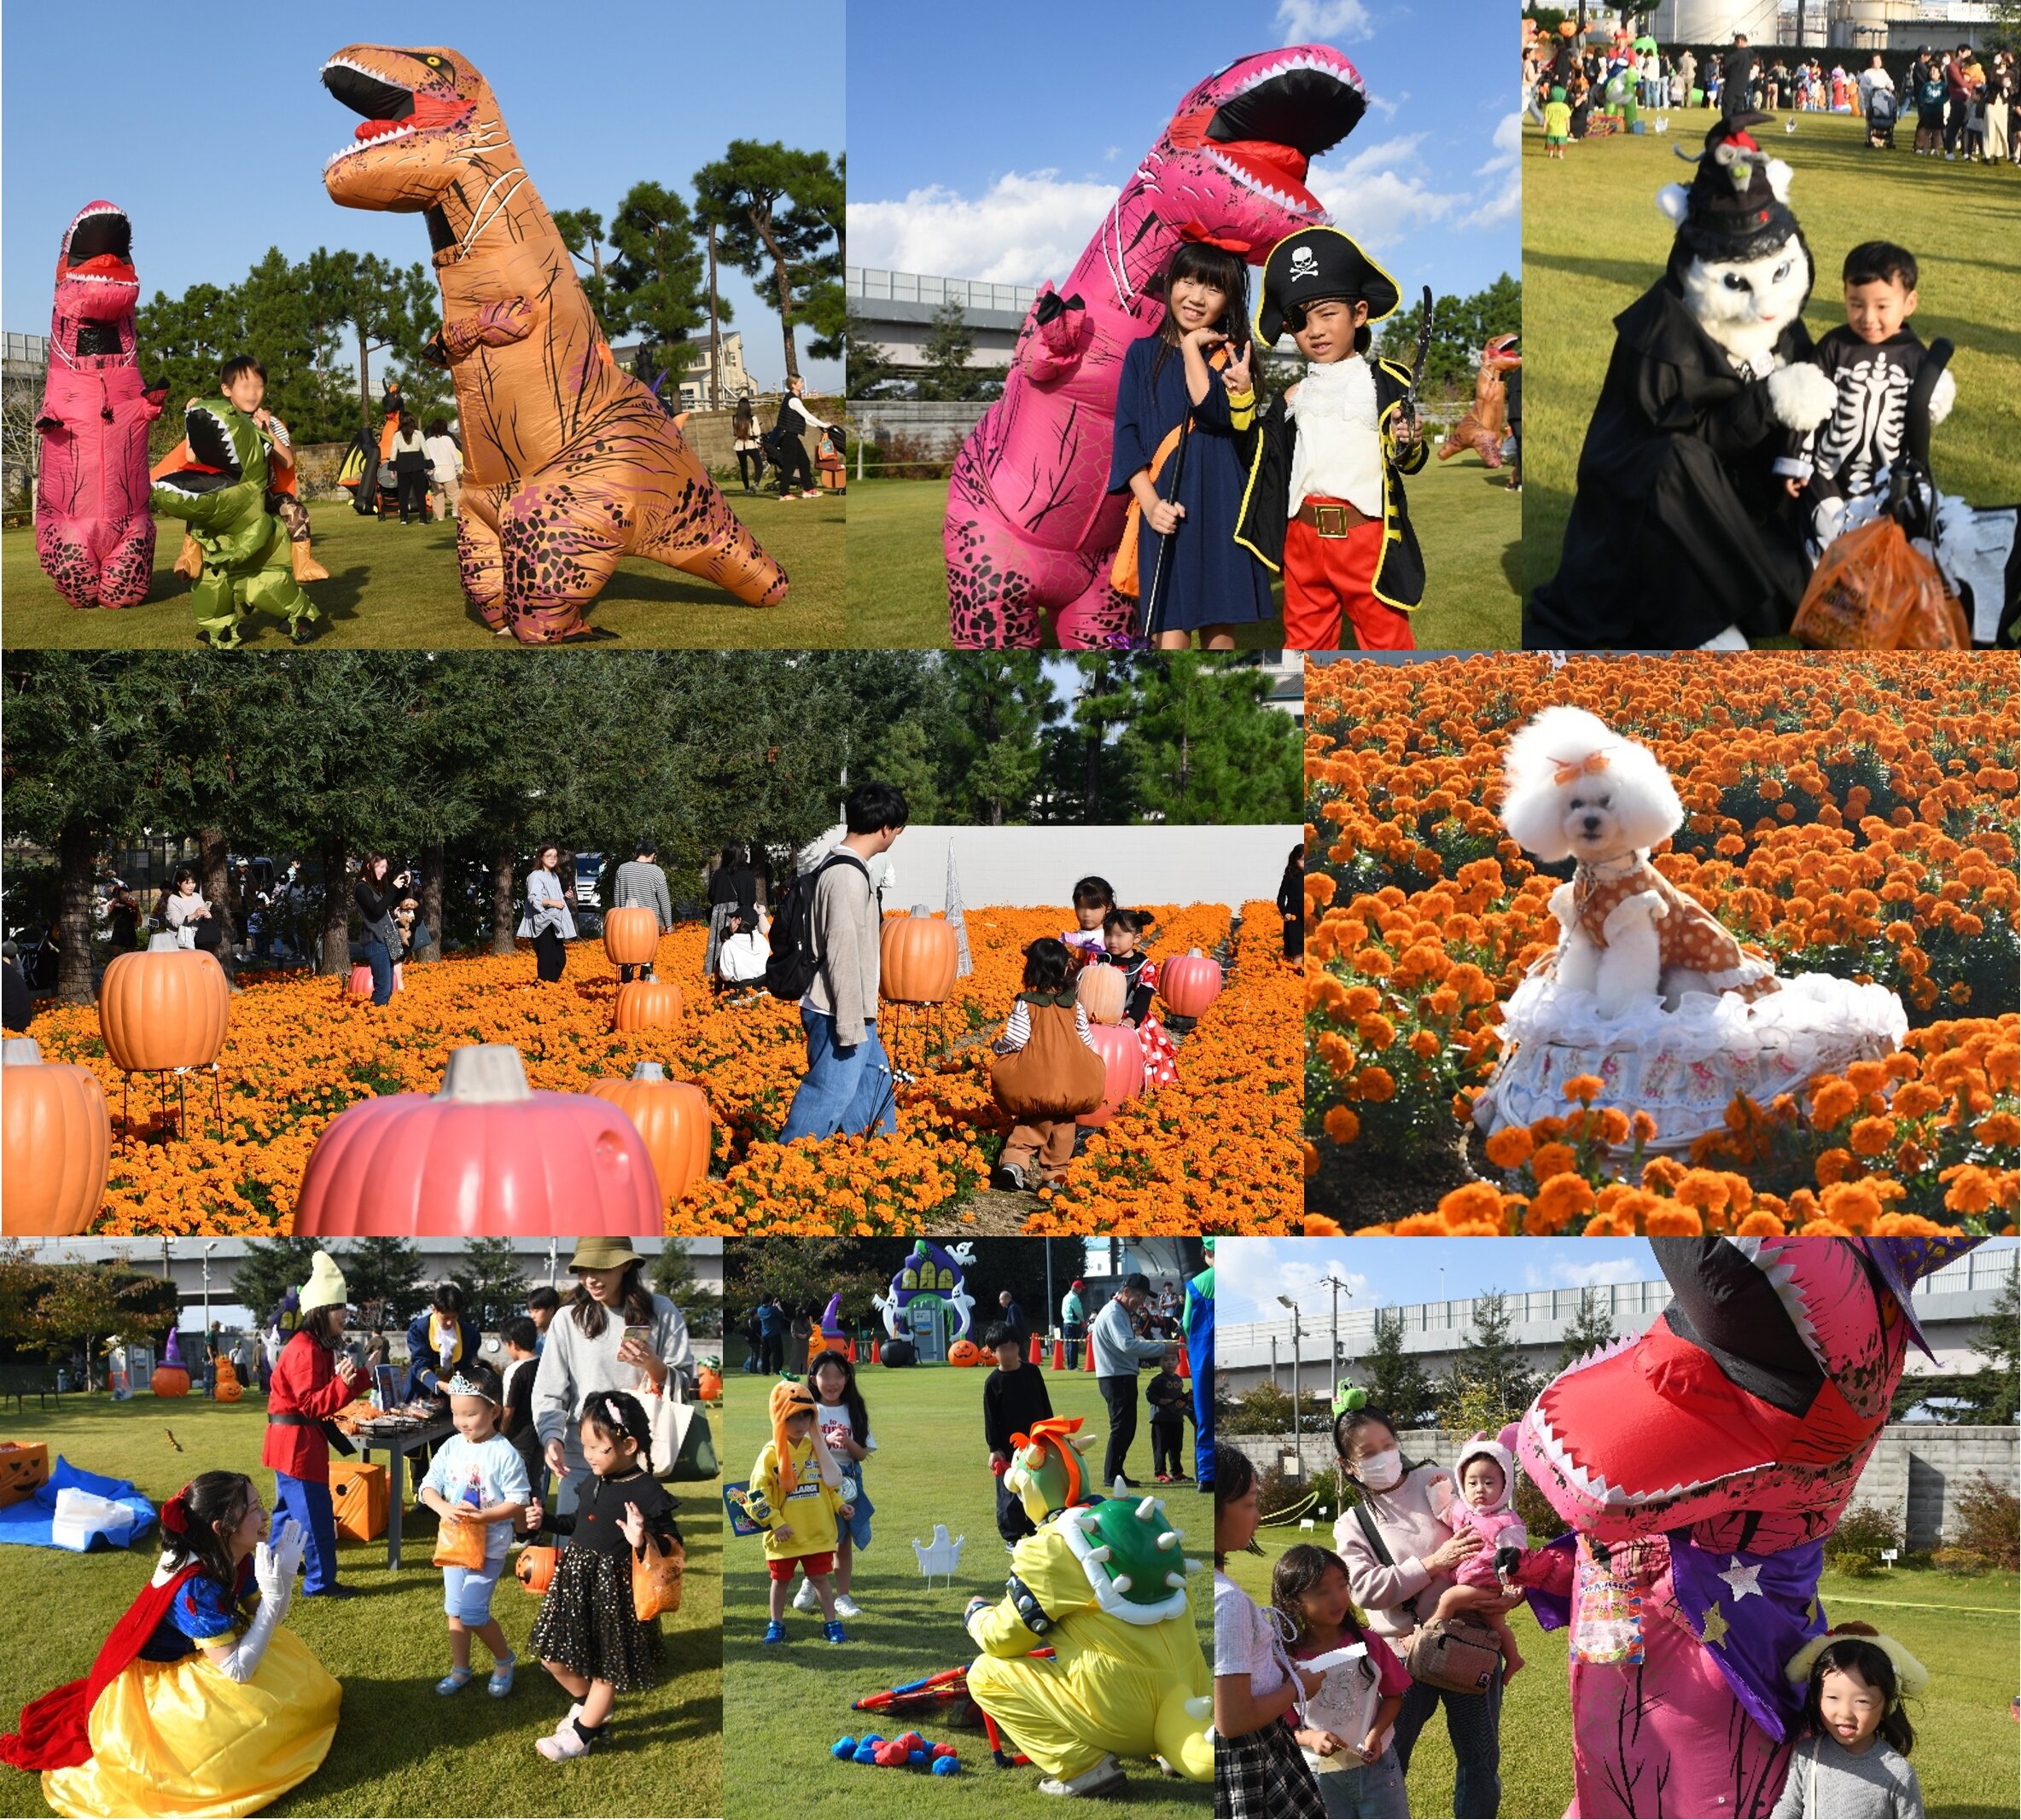
当日の様子
インスタグラムでも情報公開していますので、ぜひフォローしてくださいね!


#ハリマ化成 のハッシュタグで検索して、色々な投稿をご覧ください!
■アクセス情報
https://www.harima.co.jp/marigold/#access
マリーゴールド園西側の来客駐車場をご利用ください。
※アクセスは、Googleマップからもご確認いただけます。

■お問い合わせ先
ハリマ化成株式会社 加古川製造所 総務課
TEL. 079-422-3301
NEWSROOM
-
Webコラム
© 2026 Harima Chemicals Group, Inc. All rights reserved.
本ウェブサイトでは、お客様の利便性の向上およびサービスの品質維持・向上を目的として、クッキーを利用しています。クッキーの利用にご同意いただける場合は、「同意する」ボタンを押してください。詳細につきましては、Cookiesについて をご確認ください。
同意する
========================================================================================
- language
- search
- menu
サイト内検索
NEWSROOM
NEWSROOM
ハリマテックチェコ工場の設備拡張を完了
2026年11月02日
ハリマ化成グループ株式会社(本社:東京都中央区、代表取締役社長:谷中一朗、以下、当社)の
チェコ子会社Harimatec Czech, s.r.o.(以下、ハリマテックチェコ)は、工場設備拡張を完了しました。
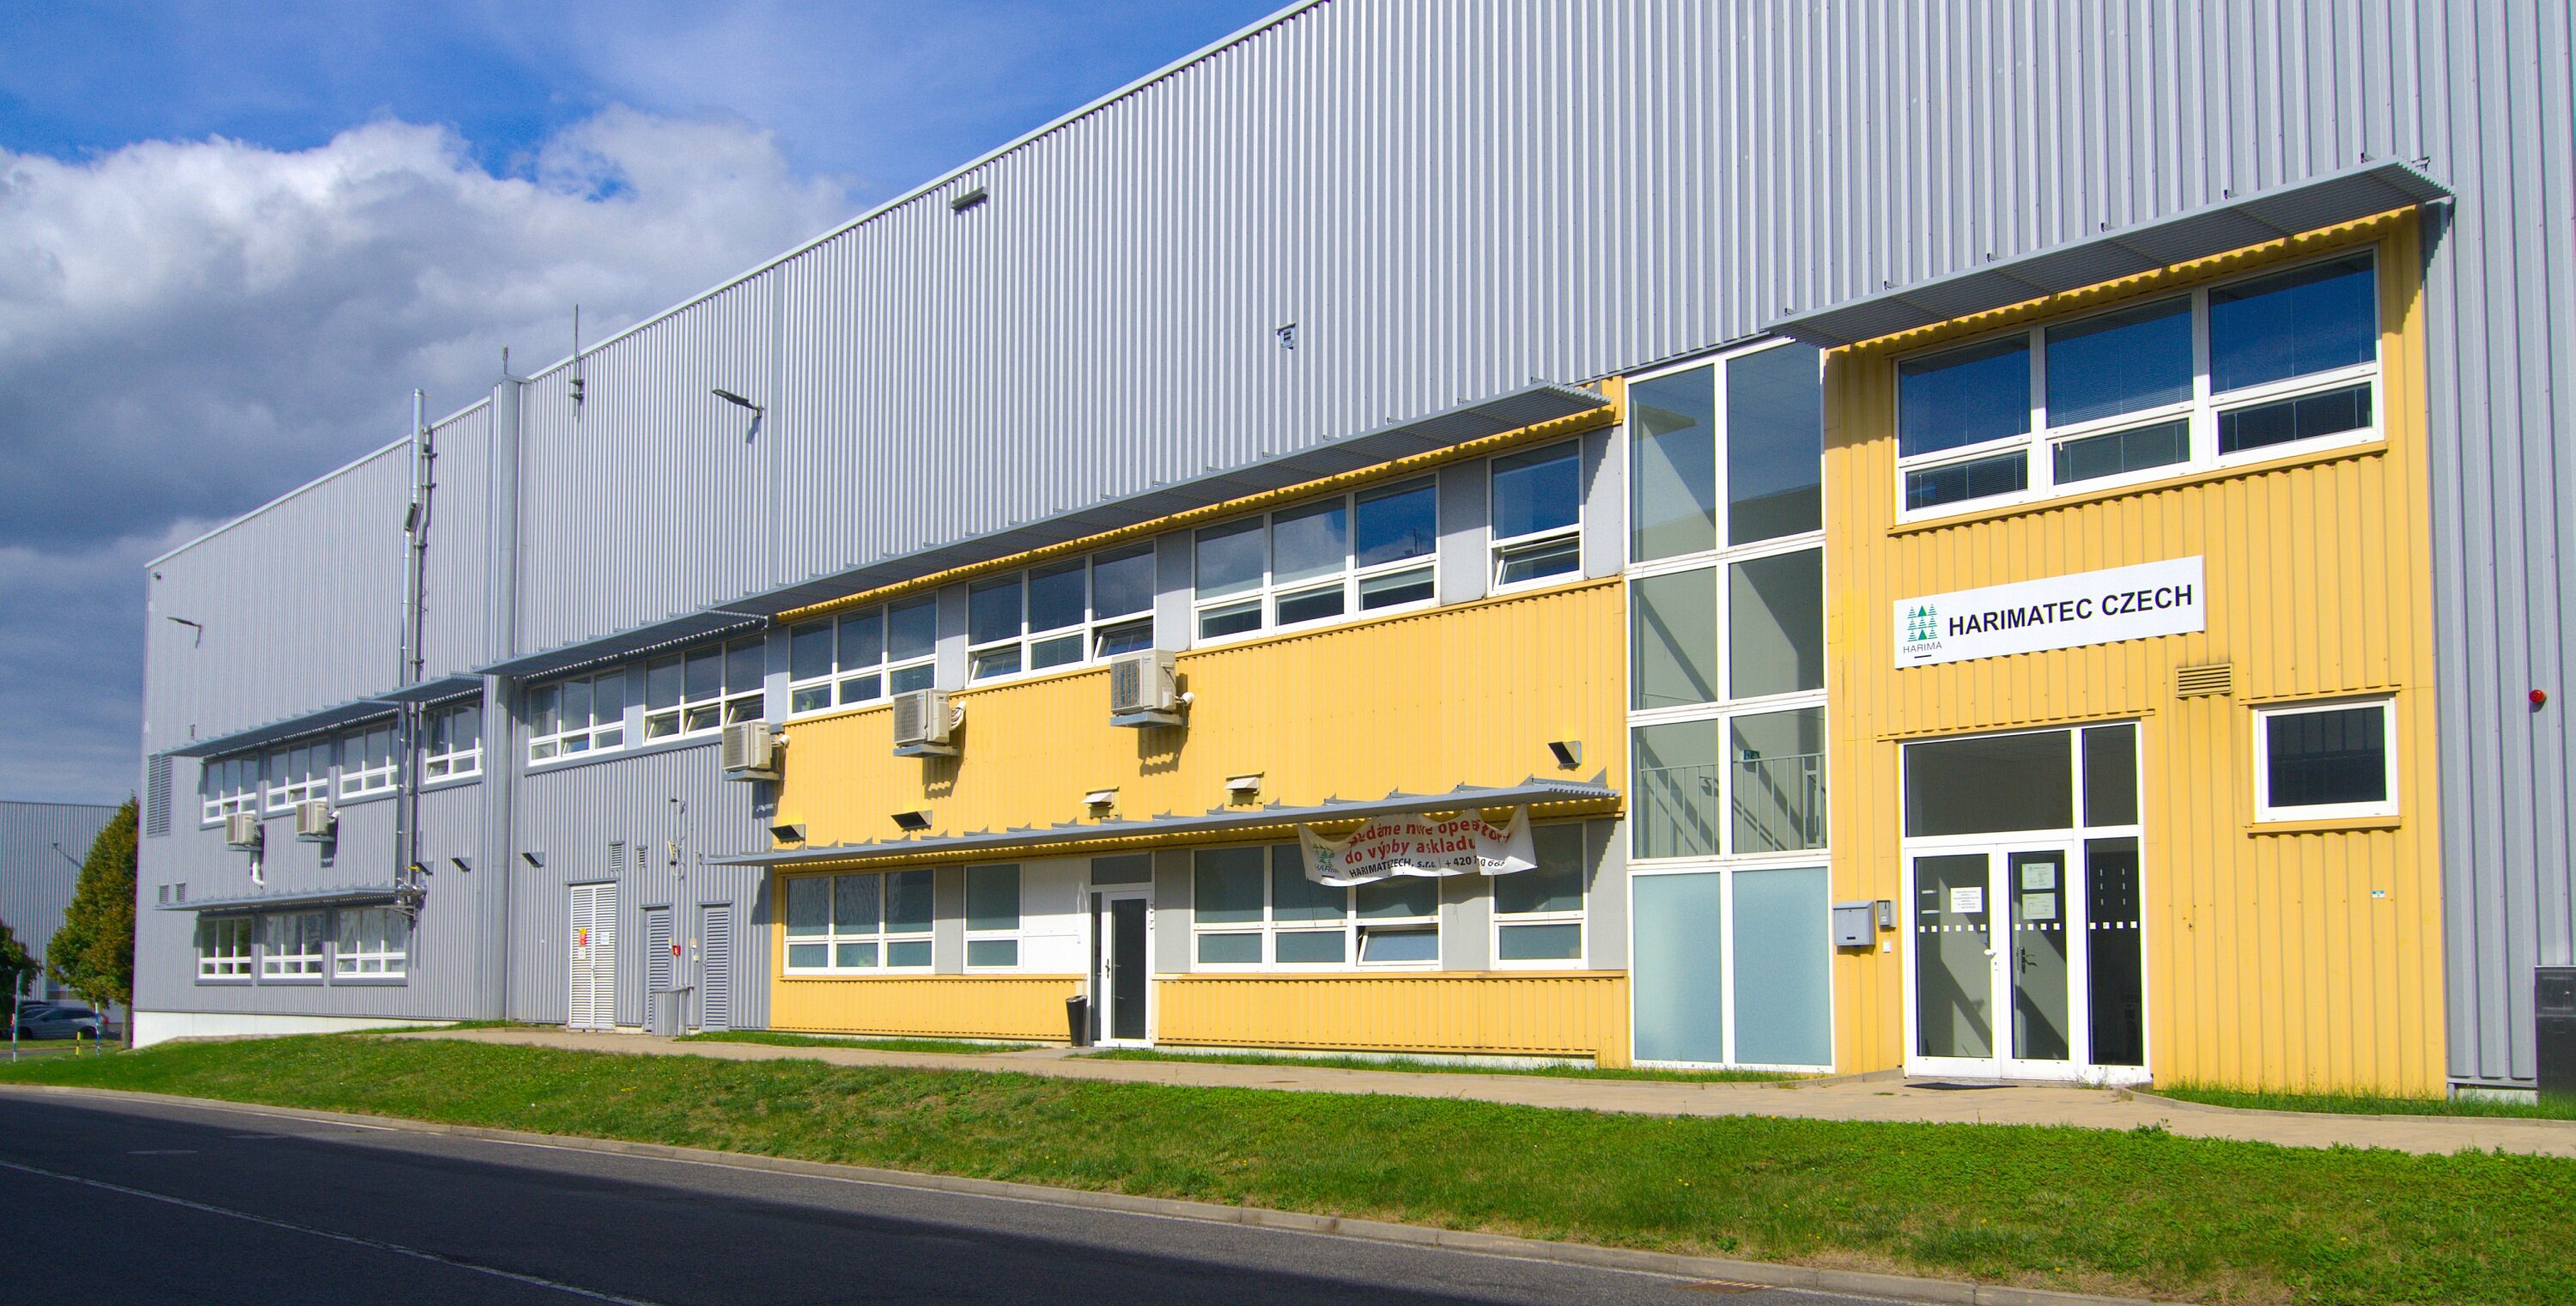
拡張したチェコ工場
2007年に設立したハリマテックチェコは、当社の欧州拠点として、主に自動車・産業機器向けの電子材料を製造・販売しています。この度、欧州におけるはんだ付け材料の需要拡大を背景に、既存設備の大規模な拡張工事を行い、生産能力を約2倍に増強しました。また、研究開発部門による技術的なサポートを通じて、生産体制の最適化を図り、高品質な製品の安定供給体制を構築しています。製品試作および顧客承認は完了しており、2026年7月より量産を開始しました。これにより、既存顧客および新規顧客に対し、欧州全域への安定的かつ迅速な供給が可能となりました。
当社電子材料事業は、従来、日本国内自動車部品メーカー向けに販売していましたが、2022年に、ドイツ・ヘンケル社のはんだ材料事業を買収し、グローバル市場への参入を加速させています。欧州の自動車業界を中心に世界の産業機器業界、通信機器業界に数多くの販売先を取り込んだことで、品揃えを拡充して競争力を高め、顧客基盤を強化しています。また、買収で得られた顧客基盤や技術力、製造拠点、そして優秀な人材との相乗効果を引き出しています。
なお、2025年3月には、電子材料の製造を行う当社グループ各海外拠点において、自動車産業の国際的な品質マネジメントシステム規格「IATF 16949」認証を取得しています。製品・サービスの不具合予防、ばらつき・ムダを低減させるための指針として、サプライチェーン全体での品質保証に活用しています。本認証を取得したことで、国際的な基準に基づいて、より信頼性の高い製品・サービスを提供することが可能となり、更なる事業成長を図っています。詳しくはこちらをご覧ください。
■本件に関するお問い合わせ先
ハリマ化成グループ株式会社
広報グループ
https://www.harima.co.jp/contact/
NEWSROOM
-
Webコラム
© 2026 Harima Chemicals Group, Inc. All rights reserved.




Prompts
Click prompts to add them under the company line, click again to take one out, then copy the result into your AI chat. Shared by Asian Century Stocks and Uncovered Thai Stocks. Thank you.
ETFs Holding Harima Chemicals Group, Inc.
Exchange-traded funds whose newest published daily portfolio holds one of the company's listings, largest weight first.