2026年12月期第3四半期決算説明資料
Bull 2
Bear 0
Results
Fiscal year ends March
Quarters are offset from the calendar — Q1 is Apr–Jun
|
TAKE AND GIVE. NEEDS Co., Ltd. operates in the domestic wedding industry in Japan, focusing on wedding services and hotel operations. The company manages a network of directly operated mansion-style wedding venues across the country, providing planning and operation services for ceremonies and receptions. Its business segments include house wedding operations, consulting services for third-party hotel and restaurant wedding departments, and the management of dress shops and restaurants. The company also operates the TRUNK HOTEL brand, offering boutique hotel services. Additional services include bridal loans through its financial subsidiary and travel arrangements for honeymoons and overseas weddings. Key subsidiaries include TRUNK, GENTLE, Dressmore, Life Angel, and Anniversary Travel. Summarised from the annual report, fiscal year ended Dec 2025 |
Industry Resorts & Casinos | Homepage tgn.co.jp |
| Sector Consumer Cyclical | IR page tgn.co.jp | |
|
Tags
wedding services, boutique hotels, bridal loans, honeymoon travel, wedding consulting, dress retail, TRUNK HOTEL, TRUNK, GENTLE, Dressmore, Life Angel, Anniversary Travel
|
Press page tgn.co.jp/news |
Metrics
| Valuation | |
|---|---|
| Market cap | ¥ 10.818B |
| Market cap (USD) | $ 67.913M |
| P/E | 15.92 |
| PEG | — |
| P/BV | 0.63 |
| P/S | 0.22 |
| P/OCF | 9.05 |
| P/FCF | -11.12 |
| Dividend yield | 4.2% |
| Turnover / mcap | — |
| Returns | |
|---|---|
| ROE | -0.44% |
| ROI | -0.23% |
| ROIC | 2.4% |
| Profit margin | -0.21% |
| Growth | |
|---|---|
| Revenue growing | No |
| Profits growing | No |
| Revenue up 3y | No |
| Revenue up 5y | No |
| Earnings growth 3y (net profit CAGR) | — |
| Quality | |
|---|---|
| Profitable | No |
| Margin expanding | No |
| Buying back stock | No |
| Diluting (TTM) | — |
| Debt/Equity | — |
| Podcast bulls (TTM) | Sign up |
| Podcast bears (TTM) | Sign up |
| Podcast sentiment (TTM) | Sign up |
| Podcast sentiment % (TTM) | Sign up |
| News sentiment (TTM) | 28 |
| Quality score | -52.9% |
| Insiders | |
|---|---|
| Buys, 1w | Sign up |
| Buys, 1m | Sign up |
| Buys, 1y | Sign up |
| Sells, 1w | Sign up |
| Sells, 1m | Sign up |
| Sells, 1y | Sign up |
Sign up to see this company's insider trades
| Figure | FY 2025 | FY 2024 | FY 2023 | FY 2022 | FY 2021 | FY 2020 | FY 2019 | FY 2018 | FY 2017 | FY 2016 | FY 2015 | FY 2014 | FY 2013 |
|---|---|---|---|---|---|---|---|---|---|---|---|---|---|
| Revenue | 35.709B | 47.02B | 45.532B | 39.482B | 20.044B | 63.678B | 66.871B | 64.59B | 60.186B | 59.524B | 59.269B | 60.714B | 52.804B |
| Net profit | -76M | 1.831B | 4.108B | 1.877B | -16.214B | 1.003B | 2.283B | 888M | 360M | 230M | 1.008B | 1.37B | 1.086B |
| Free cash flow | -973M | 1.455B | 2.171B | 6.325B | -10.9B | -3.075B | 3.844B | -2.249B | -855M | -1.751B | — | — | — |
Filed figures
Lines the statements and their notes report beside the headline figures, read from the filings' XBRL as filed (no restatement applied), with figures computed from one filing's own lines. Cash-flow lines carry their cash direction: an outflow is negative. Each period links to its filing; a figure's period, report date and tag are in its tooltip.
| Figure | Mar 2017 | Mar 2018 | Mar 2019 | Mar 2020 | Mar 2021 | Mar 2022 | Mar 2023 | Mar 2024 | Mar 2025 | Dec 2025 |
|---|---|---|---|---|---|---|---|---|---|---|
| Balance sheet detail | ||||||||||
| Trade receivables (JPY) | 686M | 716M | 842M | 642M | 218M | 346M | 488M | 618M | 562M | 736M |
| ↳ YoY growth | +15.1% | +4.4% | +17.6% | -23.8% | -66.0% | +58.7% | +41.0% | +26.6% | -9.1% | |
| ↳ 5y CAGR | -18.2% | -12.8% | -7.4% | -6.0% | -2.6% | +18.6% | ||||
| Borrowings, current (JPY) | 7.11B | 6.3B | 6.73B | 7.88B | 15.8B | 15.2B | 6.86B | 5.99B | 6.29B | 8.33B |
| Borrowings, non-current (JPY) | 12.4B | 12.9B | 11B | 12.7B | 14B | 13.1B | 19.6B | 16.9B | 14.3B | 12.3B |
| Bonds payable (JPY) | 100M | — | — | — | — | — | — | — | — | — |
| Cash and deposits (JPY) | 4.92B | 4.77B | 6.78B | 6.46B | 4.59B | 11.8B | 12.5B | 9.4B | 9.07B | 6.59B |
| Intangible assets (JPY) | 1.14B | 887M | 798M | 462M | 256M | 222M | 226M | 375M | 351M | 705M |
| Net debt (borrowings + leases - cash) (JPY) | 14.6B | 14.4B | 10.9B | 14.2B | 25.2B | 16.5B | 14B | 13.5B | 11.5B | 14B |
| Cash flow detail | ||||||||||
| Operating cash flow (JPY) | 4.13B | 4.14B | 6.45B | 4.26B | -9.71B | 6.65B | 3.55B | 3.81B | 5.46B | 1.2B |
| Purchases of property, plant and equipment (JPY) | -4.99B | -6.26B | -2.36B | -7.26B | -1.19B | -327M | -1.37B | -2.36B | -1.45B | -2.08B |
| Purchases of intangible assets (JPY) | -142M | -127M | -246M | -73M | -10M | -49M | -131M | -221M | -87M | -90M |
| Change in receivables (cash effect) (JPY) | -123M | -30M | -126M | 199M | 393M | -128M | -142M | -129M | 55M | -173M |
| Change in payables (cash effect) (JPY) | -143M | -152M | 257M | -1.28B | -194M | 226M | 166M | 138M | 325M | -475M |
| Dividends paid (cash effect) (JPY) | -194M | -194M | -194M | -323M | -129M | -103M | -206M | -596M | -379M | -437M |
| Share buybacks (cash effect) (JPY) | 0.00 | -1M | -2M | 0.00 | 0.00 | 0.00 | -1M | 0.00 | -2B | 0.00 |
| Interest paid (cash effect) (JPY) | -188M | -392M | -343M | -337M | -383M | -396M | -441M | -492M | -519M | -411M |
| Income taxes paid (cash effect) (JPY) | -510M | -914M | -1.14B | -1.09B | -648M | -103M | -1.4B | 160M | -272M | -360M |
| Operating cash flow before change in receivables (JPY) | 4.25B | 4.17B | 6.58B | 4.06B | -10.1B | 6.78B | 3.69B | 3.94B | 5.41B | 1.37B |
| Free cash flow (OCF - PPE - intangibles) (JPY) | -997M | -2.25B | 3.84B | -3.08B | -10.9B | 6.28B | 2.04B | 1.23B | 3.93B | -973M |
| Income detail | ||||||||||
| Total comprehensive income (JPY) | 295M | 852M | 2.23B | 935M | -16.3B | 1.86B | 4.1B | 1.79B | 3.62B | -15M |
| Comprehensive income to owners (JPY) | 281M | 842M | 2.23B | 981M | -16.3B | 1.86B | 4.1B | 1.79B | 3.55B | -76M |
| Provision for credit losses (JPY) | 63M | 187M | — | — | 58M | 22M | — | — | — | — |
| Credit cost ratio (credit losses / average receivables) (%) | 9.8% | 26.7% | — | — | 13.5% | 7.8% | — | — | — | — |
| Reported | Jun 30, 2017 | Jun 27, 2018 | Jun 27, 2019 | Jun 26, 2020 | Jun 28, 2021 | Jun 27, 2022 | Jun 26, 2023 | Jun 27, 2024 | Jun 23, 2025 | Mar 31, 2026 |
Sign up to see institutional holdings
Sign UpPodcast Mentions
Sign up to see podcast mentions and sentiment
Sign UpTimely disclosures published on TDnet, newest first, titles as filed in Japanese. The link opens the disclosure on TDnet. Filings with EDINET (periodic reports, extraordinary reports, offerings, holding and buy-back reports), newest first, titles as filed in Japanese. The link opens the filing on EDINET. Press releases from the company's own website, newest first.
2026年12月期第3四半期決算短信〔日本基準〕(連結)
Bull 0
Bear 0
Results
当社代表取締役会長の野尻佳孝がラジオNIKKEI「マーケット・テラス」に出演しました PDF
Bull 0
Bear 0
Routine
株式会社テイクアンドギヴ・ニーズ 2026 年 11 月 6 日
当社代表取締役会長の野尻佳孝が ラジオ NIKKEI「マーケット・テラス」に出演しました
当社代表取締役会長の野尻佳孝がラジオ NIKKEI「マーケット・テラス」に出演しました。
番組名:
「マーケット・テラス」
放送メディア: ラジオ NIKKEI 第1 放送日:
2026 年 11 月 5 日(木)15:00~
詳細は番組 WEB サイトをご覧ください。 ラジオ NIKKEI「マーケット・テラス」 https://www.radionikkei.jp/terrace/20261105.html *ページ下部のラジコタイムフリーより、 「マーケット・テラス(14:30-) 」の右下にある「radiko で聴 く」をクリックしてお聴きいただけます。
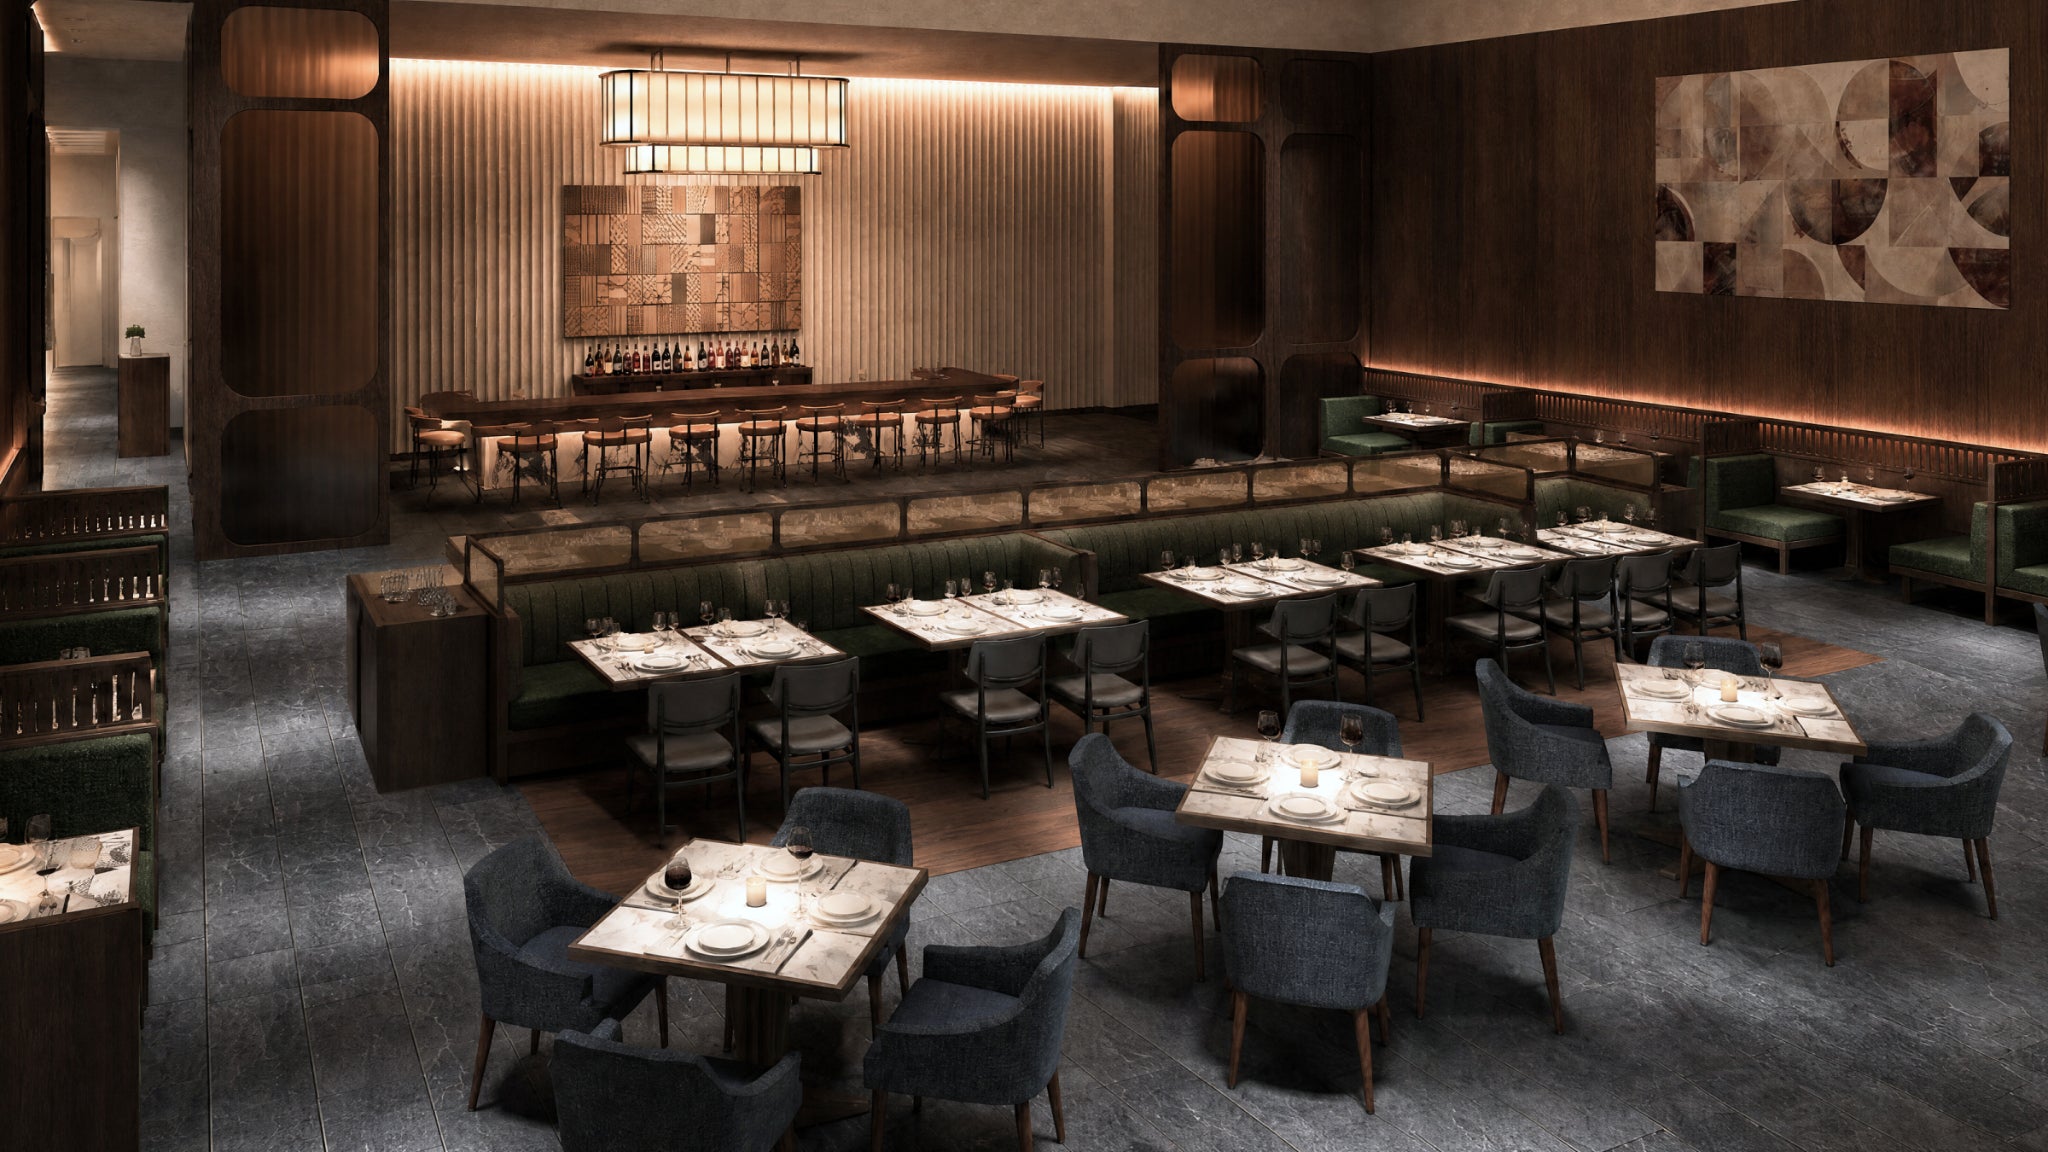
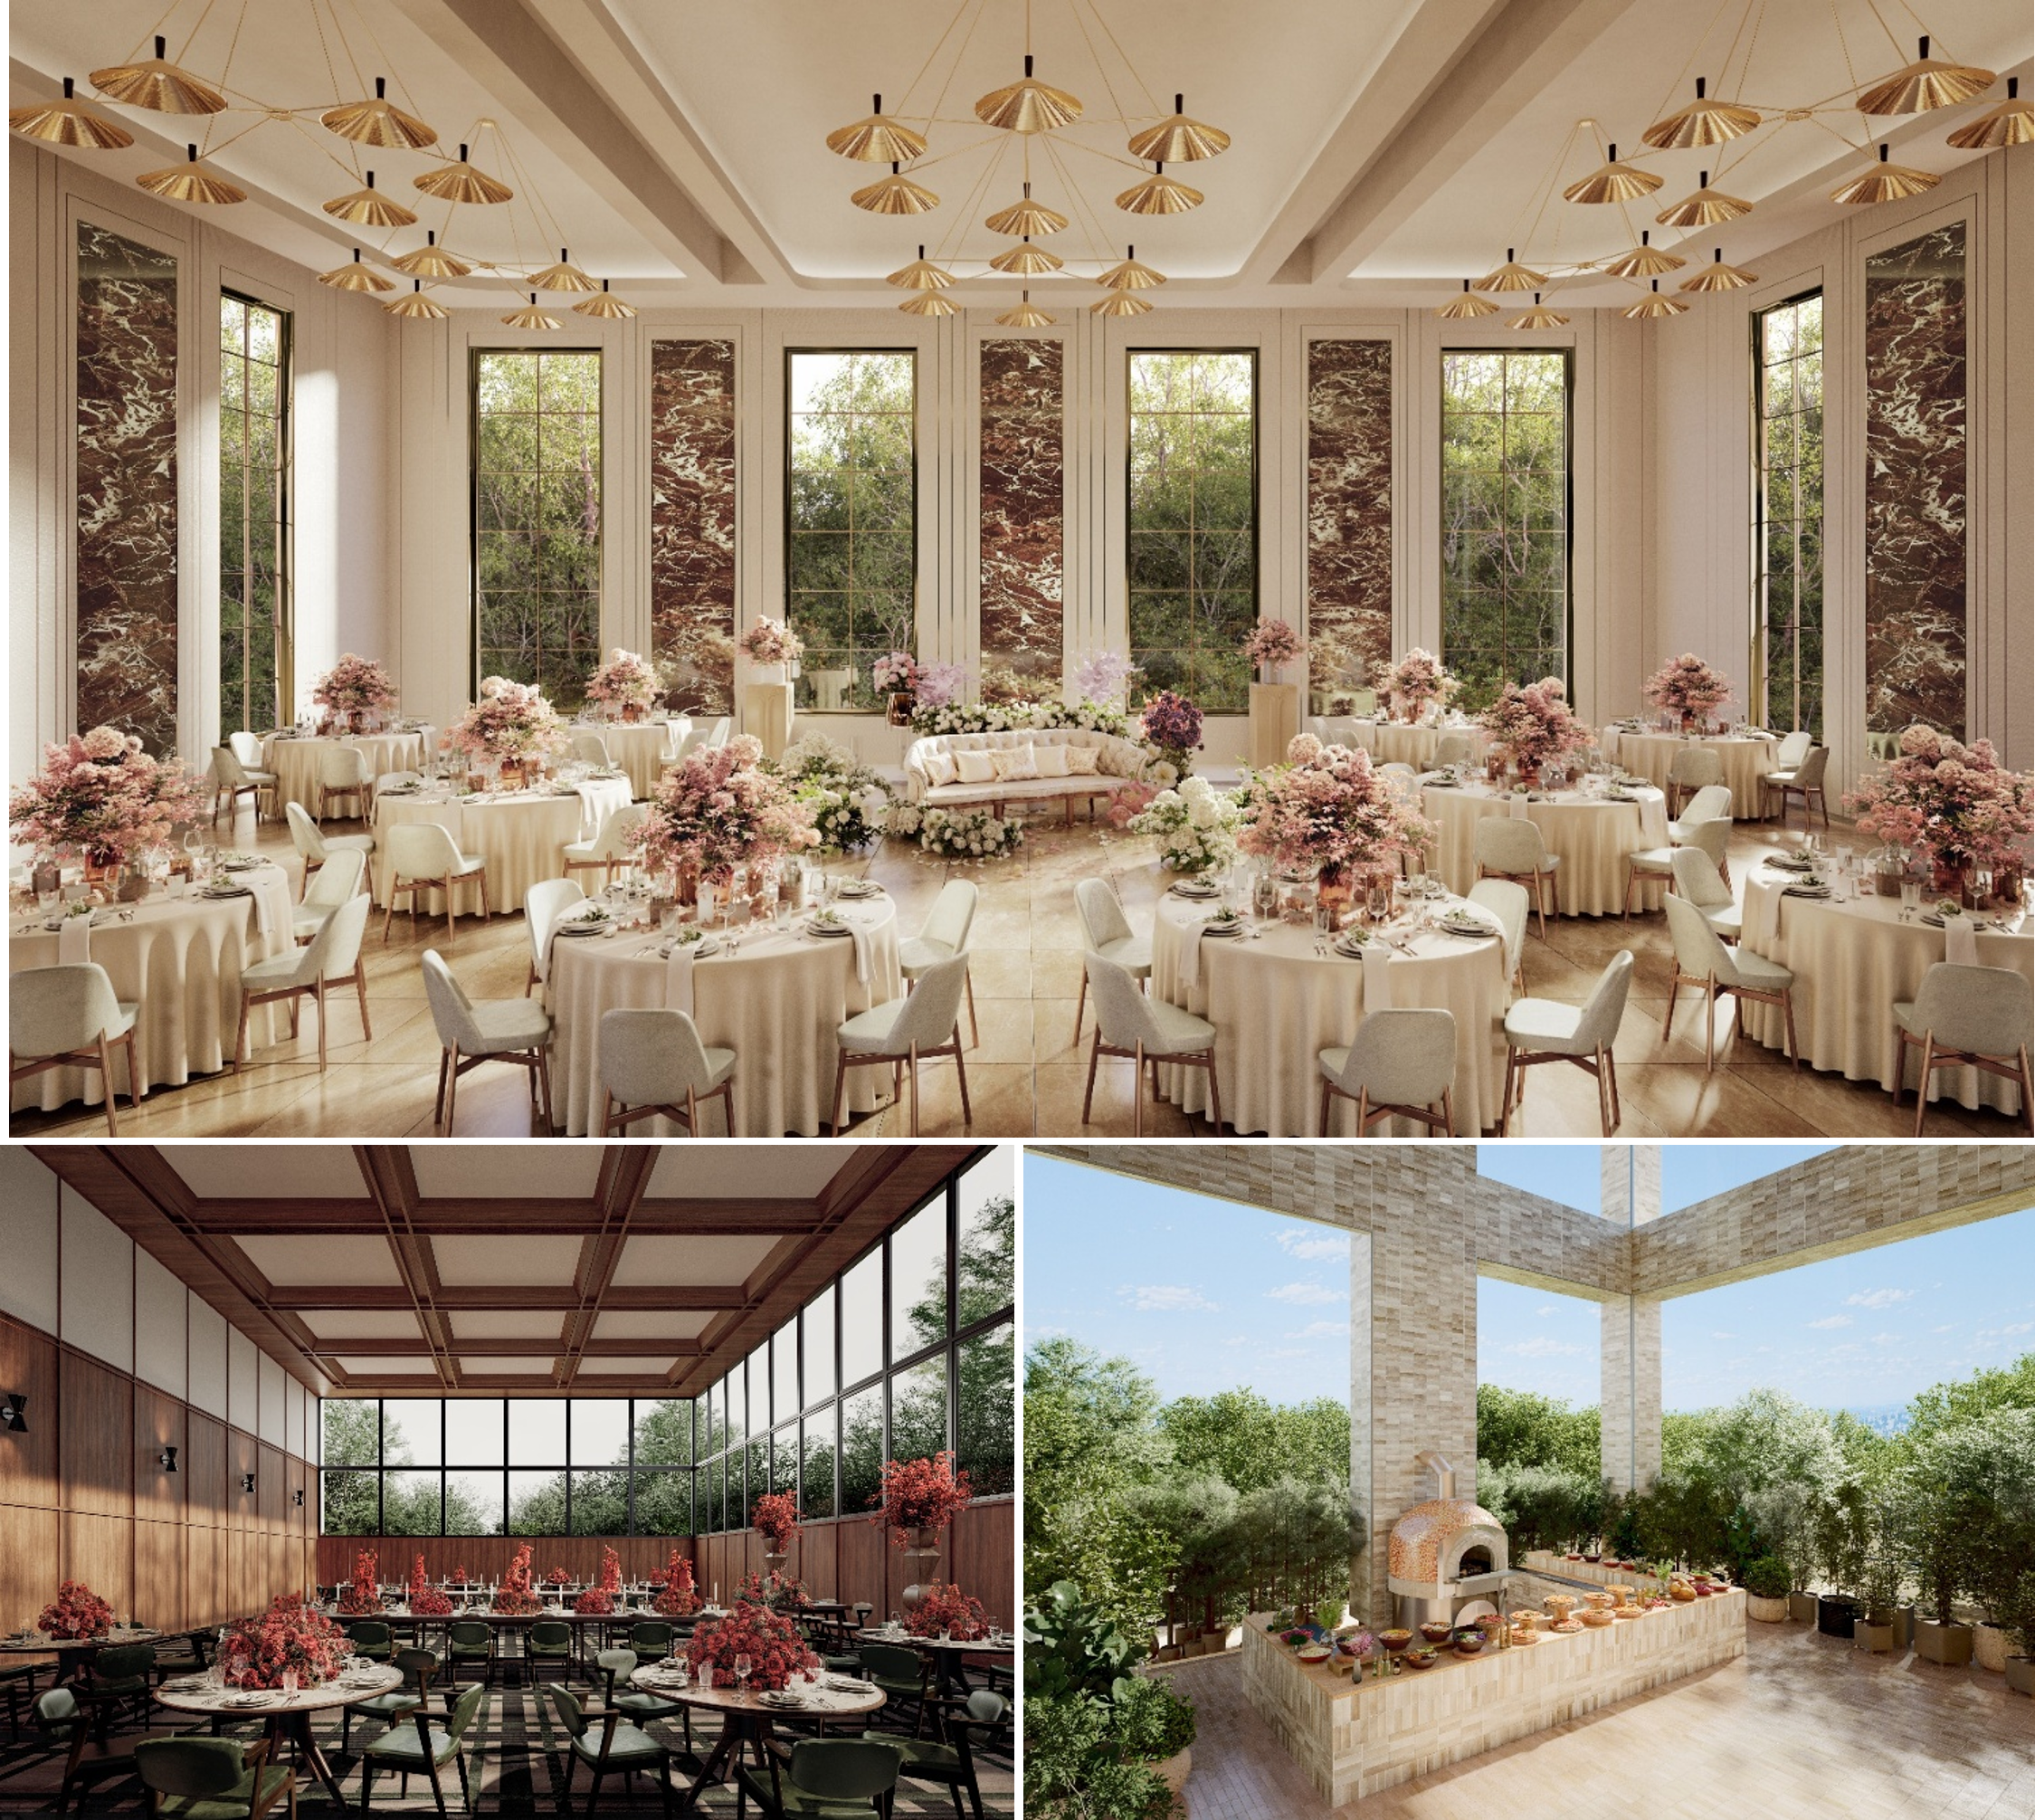
【株式会社テイクアンドギヴ・ニーズ】 「あそびごころとやさしさで、人の心を人生を豊かにする」をミッションに、ホテル事業とウェディング 事業を中心に展開するライフスタイル企業です。2017 年より展開する TRUNK(HOTEL)ブランドで日 本のライフスタイルホテル市場をけん引する他、ハウスウェディングのパイオニアとして全国で約 60 の 結婚式場を運営し、多様なスタイルのウェディングで、年間約 12,000 件の結婚式をプロデュース。 会社名 :株式会社テイクアンドギヴ・ニーズ 設立
:1998 年 10 月
所在地 :東京都品川区東品川 2-3-12 代表者 :代表取締役社長
岩瀬賢治
事業内容:ホテル事業、国内ウェディング事業、レストラン事業、スポーツホスピタリティ事業 WEB サイト:https://www.tgn.co.jp/





























Prompts
Click prompts to add them under the company line, click again to take one out, then copy the result into your AI chat. Shared by Asian Century Stocks and Uncovered Thai Stocks. Thank you.
TAKE AND GIVE. NEEDS Co., Ltd. (ticker 4331), listed in Japan.
Copied
ETFs Holding TAKE AND GIVE. NEEDS Co., Ltd.
Exchange-traded funds whose newest published daily portfolio holds one of the company's listings, largest weight first.