2026年度第2四半期 決算説明会 Q2 FY2026 Earnings Call 2026年8月14日 August 14, 2026 AGENDA ビジネス&戦略アップデート 取締役代表執行役社長 グローバルCEO 佐野傑 2026年度第2四半期連結決算概況 取締役執行役 グローバルCFO 遠藤茂樹…
2026年度第2四半期
決算説明会
Q2 FY2026 Earnings Call
2026年8月14日
August 14, 2026
AGENDA
- ビジネス&戦略アップデート
取締役代表執行役社長 グローバルCEO
佐野傑
- 2026年度第2四半期連結決算概況
取締役執行役 グローバルCFO 遠藤茂樹
- 中期経営計画アップデート
取締役代表執行役社長 グローバルCEO
佐野傑
- Business & Strategic Update
Takeshi Sano
Director, Representative Executive Officer, President & Global CEO
- Q2 FY2026 Financial Update
Shigeki Endo, Director, Executive Officer, Global CFO
- Mid-Term Management Plan Update
Takeshi Sano
Director, Representative Executive Officer, President & Global CEO
ビジネス&戦略アップデート
Business & Strategic Update
2026年8月14日
株式会社電通グループ 取締役
代表執行役社長 グローバルCEO 兼
dentsu Japan CEO
佐野傑
August 14, 2026
Takeshi Sano
Director, Representative Executive Officer,
President & Global CEO, dentsu
CEO, dentsu Japan
2026年度第2四半期(4-6月) 決算ハイライト
Q2 Highlights
オーガニック成長率
オペレーティング・マージン
当期利益
Organic Growth
Operating Margin
Statutory Net Profit
11.9%
6.1
(0.2)%
(40)bps 前年同期比 YoY
(十億円)bn JPY
+¥86.0bn 前年同期差 YoY
H1 +0.3%
H1 12.3%
H1 46.3
+30 bps 前年同期比 YoY
+¥119.9bn 前年同期差 YoY
Japan
Americas
EMEA
APAC
オーガニック成長率
Organic Growth
+5.4 %
(6.9)%
(1.2)%
(0.2)%
オペレーティング・マージン
Operating Margin
19.3%
21.5%
13.2%
(0.1)%
H1 +5.0%
H1 25.6%
H1 (5.0)%
H1 18.8%
H1 (0.2)%
H1 8.8%
H1 (3.8)%
H1 (6.5)%
04
業界内評価とクライアント獲得
Industry Awards & Recognition, Client Wins
クライアント獲得 Client wins
Adobe
アドビ
Americas
NETFLIX
ネットフリックス
EMEA
• 「カンヌライオンズ2026」においてゴールド4個を含む計15個の賞を獲得。メディアエージェンシーブランドのCaratは
「Media Network of the Year」を受賞。グループ全体では合計40の受賞作品にメディアエージェンシーとしてクレジット
• 国際広告賞「The One Show 2026」において計6個の賞を受賞
• メディアエージェンシーブランドのiProspectは今年30周年を迎え、「Campaign Media Awards」(3賞)、
「Festival of Media Global Awards」(2賞)、「Outdoor Media Awards」(4賞)など、
UKの主要業界アワードで計9賞を獲得
• Won 15 Lions, including four Gold at Cannes Lions 2026. Carat, our media agency brand,
won “Media Network of the Year”. Carat, iProspect, and dentsu X were credited as media
agencies on a total of 40 Lions
• Won six awards at “The One Show 2026” International Advertising Awards
• Celebrating its 30th anniversary this year, iProspect won a total of nine major industry
awards in the UK, including three “Campaign Media Awards”, two “Festival of Media Global
Awards”, and four “Outdoor Media Awards”
Tata Group
タタ・グループ
APAC
SBI NEO MEDIA HOLDINGS
SBIネオメディアホールディングス
Japan
Malaysia Aviation Group
マレーシア・アビエーション・グループ
Global
既存クライアントからの拡張案件等を含む。掲載は順不同
Includes expanded scope of work from existing clients
Listed in no particular order
05
中期経営計画各種施策の進捗
Progress of Initiatives in the Mid-Term Management Plan
経営基盤の再構築
• 2026年上期は約124億円を投入。900人弱の人員削減を実行済
2027年までの人員削減計画約3,400人のうち、およそ3,000人(88%)を遂行
• 2026年計画は維持:想定使用金額260億円。年間のコスト削減効果見込み420億円
Rebuilding the Business Foundation
• Around JPY 12.4bn was invested in H1, and a workforce reduction of just
under 900 employees has already been implemented. Around 3,000
employees, representing 88% of the planned 3,400 headcount reduction
through FY2027, has been completed
• The plan for FY2026 remains unchanged, with JPY 26bn to be deployed and
annual cost savings of JPY 42bn expected
内部投資による競争優位性の回復
Restoring Competitiveness through Internal Investments
• メディアサービスの高度化及びAI、データ&テクノロジー領域を中心に
上期に37億円程度の内部投資を実施
• We made around JPY 3.7bn in internal investments in H1, primarily to
enhance our Media services and strengthen our AI and Data & Technology
capabilities
• 2026年度に最大140億円を投資する計画に変更はない
• The plan to invest up to JPY 14bn in FY2026 remains unchanged
事業ポートフォリオの見直し
Optimizing the Business Portfolio
• スイスに本社を置き、サプライチェーン追跡・認証ソリューションを欧州クライアントに
提供する Dentsu Tracking社を売却
• Divested Dentsu Tracking, a Switzerland-based provider of supply chain
tracking and authentication solutions to clients across Europe
• 事業ポートフォリオの簡素化を進め、コア事業へ資源を集中
• Streamlined the business portfolio to concentrate resources on core
businesses
06
dentsu Japan AIの進捗と成果
Our Progress and Success in AI in dentsu Japan
• 2026年5月に戦略アップデート「AI For Growth 3.0」を発表
dentsu Japanの実践知を組み込んだ「マーケティング専門AI」を軸に、企業のマーケティング活動へのAI実装を推進
中核サービスとして、SaaS形式で提供される専門AIプロダクトシリーズ 「AI For Growth Suite」の提供を開始
• AIトランスフォーメーション支援の実績拡大
2026年6月時点で約300件にのぼり、クライアントのバリューチェーン全体へと価値提供の範囲を拡大。2026年度末までの目標は1,000件
• dentsu Japan内における大幅な効率化と生産性の向上
業務特化型AIの活用と基幹システムへのAI実装により実現
2025年度年間業務創出時間実績:10.7万時間超、 2026年度年間業務創出時間見込み:20万時間超
• “AI For Growth 3.0” Strategy Update Announced in May 2026
Centered on “marketing-specialized AI” incorporating the practical expertise of dentsu Japan, the strategy
accelerates AI adoption across clients’ marketing activities. As a core offering, the “AI For Growth Suite,”
a series of specialized AI products delivered via SaaS, was launched
• Growing Track Record in AI Transformation Support
As of June 2026, around 300 transformation projects had been delivered, broadening the scope of the value
we provide across the entire client value chain. The target is to reach 1,000 projects by the end of FY2026
• Significant Productivity Gains across dentsu Japan
Enabled through the use of task-specific AI and the integration of AI into core systems
FY2025 actual annual hours saved: 107,000+ hours, FY2026 estimated annual hours saved: 200,000+ hours
07
海外事業 AIの進捗と成果
Our Progress and Success in AI in the International Business
マーケット毎に最適化された多様なソリューションを社内外に開発・提供
Develop and deliver market-optimized solutions for internal and external needs
<Americas>
Client Service
360iをAI-nativeブランドとしてUSで再始動
AIを中心とした新たなマーケティングモデルを展開
業務変革による
生産性向上支援
事業成長と
イノベーション支援
Enhance Productivity through
Operations Transformation
Drive Client Growth
& Business Innovation
Efficiency
Relaunch 360i in the US as an AI-native, socialfirst solution for the new marketing landscape
Growth
社内業務の
高速化と効率化
グループ内の
ケイパビリティ強化・拡充
Accelerate Internal Operations
& Improve Efficiency
Strengthen & Expand
Internal Capabilities
Internal Transformation
2026年度第2四半期連結決算概況
Q2 FY2026 Financial Update
2026年8月14日
株式会社電通グループ 取締役
執行役 グローバルCFO
遠藤茂樹
August 14, 2026
Shigeki Endo
Director, Executive Officer, Global CFO, dentsu
- 本資料に含まれる数値、指標は、事業の実態に関して、適切な理解を促進することを目的として開示しており、財務諸表の数値とは異なる場合があることにご留意ください。
用語の定義については、Appendicesをご参照ください。
- Please be reminded that the figures shown in this presentation may be different from those shown in the financial statements as this
presentation has been prepared for investors to understand our businesses. Please refer to the annotations in the Appendices for
each definition of the indicators.
2026年度上期連結損益 ハイライト
H1 FY2026 Consolidated Profit & Loss
2026
1-6月
2025
1-6月
前年同期比
Jan-Jun
Jan-Jun
YoY
583.1
562.0
売上総利益(十億円)
Net revenue (JPY bn)
オーガニック成長率
Organic growth
0.3%
(0.2)%
調整後営業利益(十億円)
Underlying operating profit (JPY bn)
72.0
67.5
+6.6%
オペレーティング・マージン
Operating margin
12.3%
12.0%
+30bps
調整後当期利益(十億円)*
Underlying net profit (JPY bn)*
38.2
32.4
+17.9%
基本的1株当たり調整後当期利益(円)*
Underlying basic EPS (JPY)*
147.29
124.98
+17.8%
1株当たり配当金(中間配当)(円)
H1 Dividend per share (JPY)
営業利益(十億円)*
Statutory operating profit (JPY bn)*
83.9
(36.5)
当期利益(十億円)*
Statutory net profit (JPY bn)*
46.3
(73.6)
基本的1株当たり当期利益(円)*
Statutory basic EPS (JPY)*
178.27
(283.72)
+3.7%
10
地域別業績
Regional Performance
オーガニック成長率 (四半期)
Quarterly organic growth
オーガニック成長率(上期) / H1 Organic growth
Group +0.3%
Japan
Americas
EMEA
APAC
+5.0%
(5.0)%
(0.2)%
(3.8)%
売上総利益構成比(上期)
Group
(0.2)%
24Q1
24Q2
24Q3
24Q4
25Q1
25Q2
25Q3
25Q4
26Q1
26Q2
APAC
H1 Proportion of
net revenue
8%
EMEA
24%
Japan
41%
Americas
27%
11
日本
Japan
H1 OG
+5.0%
第2四半期
オーガニック成長率(四半期)
Quarterly organic growth
Q2
4-6月
売上総利益
Net revenue
オーガニック成長率
Organic growth
調整後営業利益(損失)
Underlying operating profit (loss)
オペレーティング・マージン
Operating margin
107.1
前年同期比
YoY
+0.0%
上期
(十億円 / JPY bn)
H1
前年同期比
YoY
1-6月
235.9
(0.3)%
+5.0%
+5.4%
20.7
(0.2)%
60.4
+3.6%
19.3%
(0)bps
25.6%
+100bps
• 前年上期に続き5%以上のオーガニック成長。調整後営業利益は
上期として過去最高
• H1 organic growth remained at the 5% level; H1
underlying operating profit reached a record high
• 第2四半期3か月は、過去最高の売上総利益であり、13四半期連続
のプラス成長
• Q2 net revenue reached a record high, marking the 13th
consecutive quarter of growth
• 第2四半期、インターネット広告が10四半期連続で売上高二桁成長、
テレビも一桁後半の成長、DXも二桁成長
• In Q2, Internet media posted its 10th consecutive quarter
of double-digit turnover growth; TV and DX delivered high
single-digit and double-digit growth, respectively
12
米州
Americas
H1 OG
(5.0)%
第2四半期
オーガニック成長率(四半期)
Quarterly organic growth
Q2
売上総利益
79.7
Net revenue
オーガニック成長率
Underlying operating profit (loss)
オペレーティング・マージン
Operating margin
前年同期比
H1
YoY
1-6月
156.1
+2.7%
(6.9)%
Organic growth
調整後営業利益(損失)
上期
前年同期比
YoY
4-6月
(十億円 / JPY bn)
+1.5%
(5.0)%
Media
(1.2)%
Media
(0.4)%
Creative
(23.3)%
Creative
(18.2)%
CXM
(2.0)%
CXM
(1.5)%
17.1
(13.6)%
29.4
(11.8)%
21.5%
(410)bps
18.8%
(290)bps
• 上期のオーガニック成長率はマイナス5%と想定をやや下回ったが、
オペレーティング・マージンは想定通りの着地
• H1 operating margin was in line with expectations, while
the organic decline of 5% was slightly below expectations
• メディアは概ねフラット。クリエイティブは前年のクライアント喪失の影響
が依然大きい
• Media remained broadly flat. Creative continued to be
significantly impacted by a prior-year client loss
• CXMは上期想定をやや下回ったが、通期で引き続きプラス転換を
目指す
• CXM was slightly below expectations in H1, but we
continue to target a return to growth for the full year
13
欧州・中東・アフリカ
EMEA
H1 OG
(0.2)%
第2四半期
オーガニック成長率(四半期)
Quarterly organic growth
Q2
72.5
Net revenue
オーガニック成長率
調整後営業利益(損失)
Underlying operating profit (loss)
オペレーティング・マージン
Operating margin
• 上期のオーガニック成長率は概ねフラットで、想定通り
• メディアはプラス成長を維持。CXMはスペインの好調、クリエイティブは
英国の貢献により、それぞれ第1四半期より成長率が改善
• 上期のオペレーティング・マージンは販管費抑制により410bps改善
YoY
1-6月
138.0
+12.6%
(1.2)%
Organic growth
前年同期比
H1
YoY
4-6月
売上総利益
上期
前年同期比
(十億円 / JPY bn)
+13.7%
(0.2)%
Media
+0.3%
Media
+2.5%
Creative
(2.9)%
Creative
(3.9)%
CXM
(3.9)%
CXM
(4.9)%
9.6
+32.3%
12.1
+113.1%
13.2%
+190bps
8.8%
+410bps
• H1 organic growth was in line with expectations and
broadly flat
• Media maintained positive growth. CXM and Creative
improved from Q1, supported by Spain and the UK,
respectively
• H1 operating margin improved by 410bps, supported by
SG&A expenses control
14
アジア太平洋
APAC
H1 OG
(3.8)%
第2四半期
オーガニック成長率(四半期)
Quarterly organic growth
Q2
売上総利益
26.8
Net revenue
オーガニック成長率
Underlying operating profit (loss)
オペレーティング・マージン
Operating margin
前年同期比
H1
YoY
1-6月
49.6
+11.1%
(0.2)%
Organic growth
調整後営業利益(損失)
上期
前年同期比
YoY
4-6月
(十億円 / JPY bn)
+5.1%
(3.8)%
Media
(1.6)%
Media
(2.0)%
Creative
+5.8%
Creative
(1.4)%
CXM
(12.9)%
CXM
(19.1)%
(0.0)
(3.2)
(0.1)%
(6.5)%
• 上期のオーガニック成長率はマイナス3.8%となったが想定通り
• H1 organic decline of 3.8% was in line with expectations
• CXMが厳しいものの、全てのプラクティスで第1四半期よりもマイナス幅
が改善。クリエイティブはインドが貢献
• All practices improved from Q1 despite continued
challenges in CXM; Creative was supported by India
• オーガニック成長率はマイナスであったが、販管費抑制により調整後
営業損失を前年同期から大幅に改善
• Driven by SG&A expenses control, underlying operating
loss improved significantly YoY despite organic decline
15
2026年度上期調整後営業利益貢献分析
H1 FY2026 Movement of Group Underlying Operating Profit
80.0
75.0
70.0
+2.5
+12.7
67.5
(0.7)
(0.1)
72.0
65.0
60.0
(9.9)
55.0
50.0
45.0
40.0
35.0
30.0
2025
1-6月
Jan-Jun
売上総利益増減
Change of
net revenue
人件費増減
Change of
staff cost
営業費増減
Change of other
operating expenses
減価償却
Depreciation
為替影響
Currency
2026
1-6月
Jan-Jun
16
2026年度連結業績予想
FY2026 Guidance
2月開示を維持 / February guidance reiterated
オーガニック成長率
Organic growth rate
収益
Revenue
調整後営業利益
Underlying operating profit
売上総利益
Net revenue
調整後当期利益*
-
基本的1株当たり調整後当期利益*
-
Operating margin
Underlying net profit*
-
Underlying basic EPS*
-
1株当たり配当金
-
Dividend per share
営業利益(損失)
Statutory Operating profit (loss)
当期利益(損失)*
Statutory Net profit (loss)*
為替
円/USD
円/GBP
Currency
JPY/USD
JPY/GBP
(十億円 / JPY bn)
2026
連結業績予想
Guidance
0~1%
2025
1-12月
Jan-Dec
増減額
Variance
0.5%
1,491.5
1,435.2
166.3
172.5
1,230.2
増減率
Variance (%)
+3.9
(6.2)
(3.6)
+32.6
13%台/range
14.4%
328.21円
360.38円
(32.17)円
152.6
(289.2)
+441.8
69.7
2026 1月平均
Av. Jan
156.7円
211.9円
93.5
(327.6)
2025 1-12月平均
Av. Jan-Dec
149.6円
197.3円
56.2
1,197.5
85.2
地域別内訳は変更
Updated breakdown
(8.3)
+2.7
(8.9)
(8.9)
+7.1円
+14.6円
Japan: 3%強 / 3%+
Americas: c. (4) %
EMEA: c. 1%
APAC: c. 1%
*下線は2月開示より変更
*Underlined figures have been
updated from February
+397.3
増減額
Variance
オーガニック成長率
Organic Growth Rate
増減率
Variance (%)
+4.7
+7.4
17
中期経営計画アップデート
2026年8月14日
株式会社電通グループ 取締役
代表執行役社長 グローバルCEO 兼
dentsu Japan CEO
佐野傑
中期経営計画アップデートの要旨
基本方針は現在の中期経営計画を維持し、2026ー2028年の計画として再設計。収益性の回復と財務健全化を最優先に取り組む
中期経営計画2025-2027
・経営基盤の再構築による収益性の回復
(2027年度に350~500億のコスト削減)
・2026年度:
不振ビジネス見直しにより赤字マーケット*ゼロ
・2027年度:
全4リージョンが株主価値向上に貢献
これまでの成果と見通し
今回のアップデート
・2027年度に500億円超のオペレーティング・コスト削減を達成見込み
・2028年度までにグローバルHQコストを30%程度削減(2026年度計画比)
・2021年1月時点で1,000以上あった海外事業法人を
2026年1月時点で半減
・2026年度は、70-80程度の海外事業法人数を削減見込み
2028年度までに、加えて50-80程度の削減を検討
・ANZ地域におけるCXM事業の一部売却など構造改革を遂行
・2027年度:赤字マーケット*ゼロの実現
海外事業全体が株主価値向上に貢献
・2025年度は中国・オーストラリアにて調整後営業利益ベースで
黒字化達成
・収益性改善の取り組みは進展しているものの、マクロ環境の
不透明感も影響し、一部マーケットでは2026年度赤字の見通し
・投下資本に関わらず、不採算マーケットの事業再編・撤退コストを
算出し、優先順位をつけて改革を遂行
・2028年度:全4リージョンが株主価値向上に貢献
・2027年度以降は、通常の事業運営上の投資と一体で管理
・重点マーケット、重点領域への投資
3年間で450億円を予定
・メディア領域とAI、データ&テクノロジー領域を中心に投資
2026年上期は37億円の内部投資を実施
・業績回復に応じた選択的なM&A
・M&Aは抑制し、内部成長に注力
・日本・米国を重点マーケットに設定
・日本は13四半期連続成長、米州CXM事業は通期でプラス回復見通し
・重点マーケット/領域は踏襲。各リージョンの戦略を明確化
・海外事業はメディアの付加価値向上に注力
・海外メディア事業は2年連続成長に加え、26年上期もプラス着地
・AI戦略は、オープンエコシステムを基本思想にパートナー連携を強化
・グローバルHQコスト削減額の一定割合を
AI・データ&テクノロジー領域へ投資
・M&Aは、当面抑制的に検討
*2025年2月時点の累計の投下資本100億円超のマーケット
19
当社の目指す姿
顧客と社会の成長に最もインパクトを提供するGrowth Partner
01
02
03
04
05
事業・組織変革と
収益性の改善
重点領域への
成長投資
一人ひとりの
生産性向上
人財獲得力と
定着力の強化
顧客・社会への
更なる価値創出
事業・組織構造の改革による
収益基盤の強化
重点領域への投資集中による
ケイパビリティ強化・拡充
従業員一人あたりの生産性で
業界トップ水準を実現
高い専門性を持った多様な
人財が集い、力を発揮
顧客の事業成長と
社会への価値創出へ貢献
・事業ポートフォリオと
コスト構造の最適化
・AI、データ&テクノロジー領域等
への投資拡大
・AIネイティブなオペレーティングモデル
による持続的な生産性向上
・多様で専門性の高い人材の
獲得と育成の強化
・マーケティングを超えたサービス提供
により、顧客の成長を実現
・成長投資を支える
キャッシュ創出力の強化
・成長性や競争優位性を
踏まえた市場の選択と集中
・一人当たりの売上総利益、
営業利益で業界トップ水準を実現
・透明性と説明責任を基盤とした
高い成果を生み出す企業文化
・当社の携わる全てのクライアントが
業界平均を上回る形で成長
20
当社の目指す姿の実現に向けて
現状の課題
市場成長率を下回る
オーガニック成長率
複雑性の高い
オペレーション
マーケットやケイパビリティ
への投資の分散
2026-2028
2026-2028
競争力の基盤構築を加速
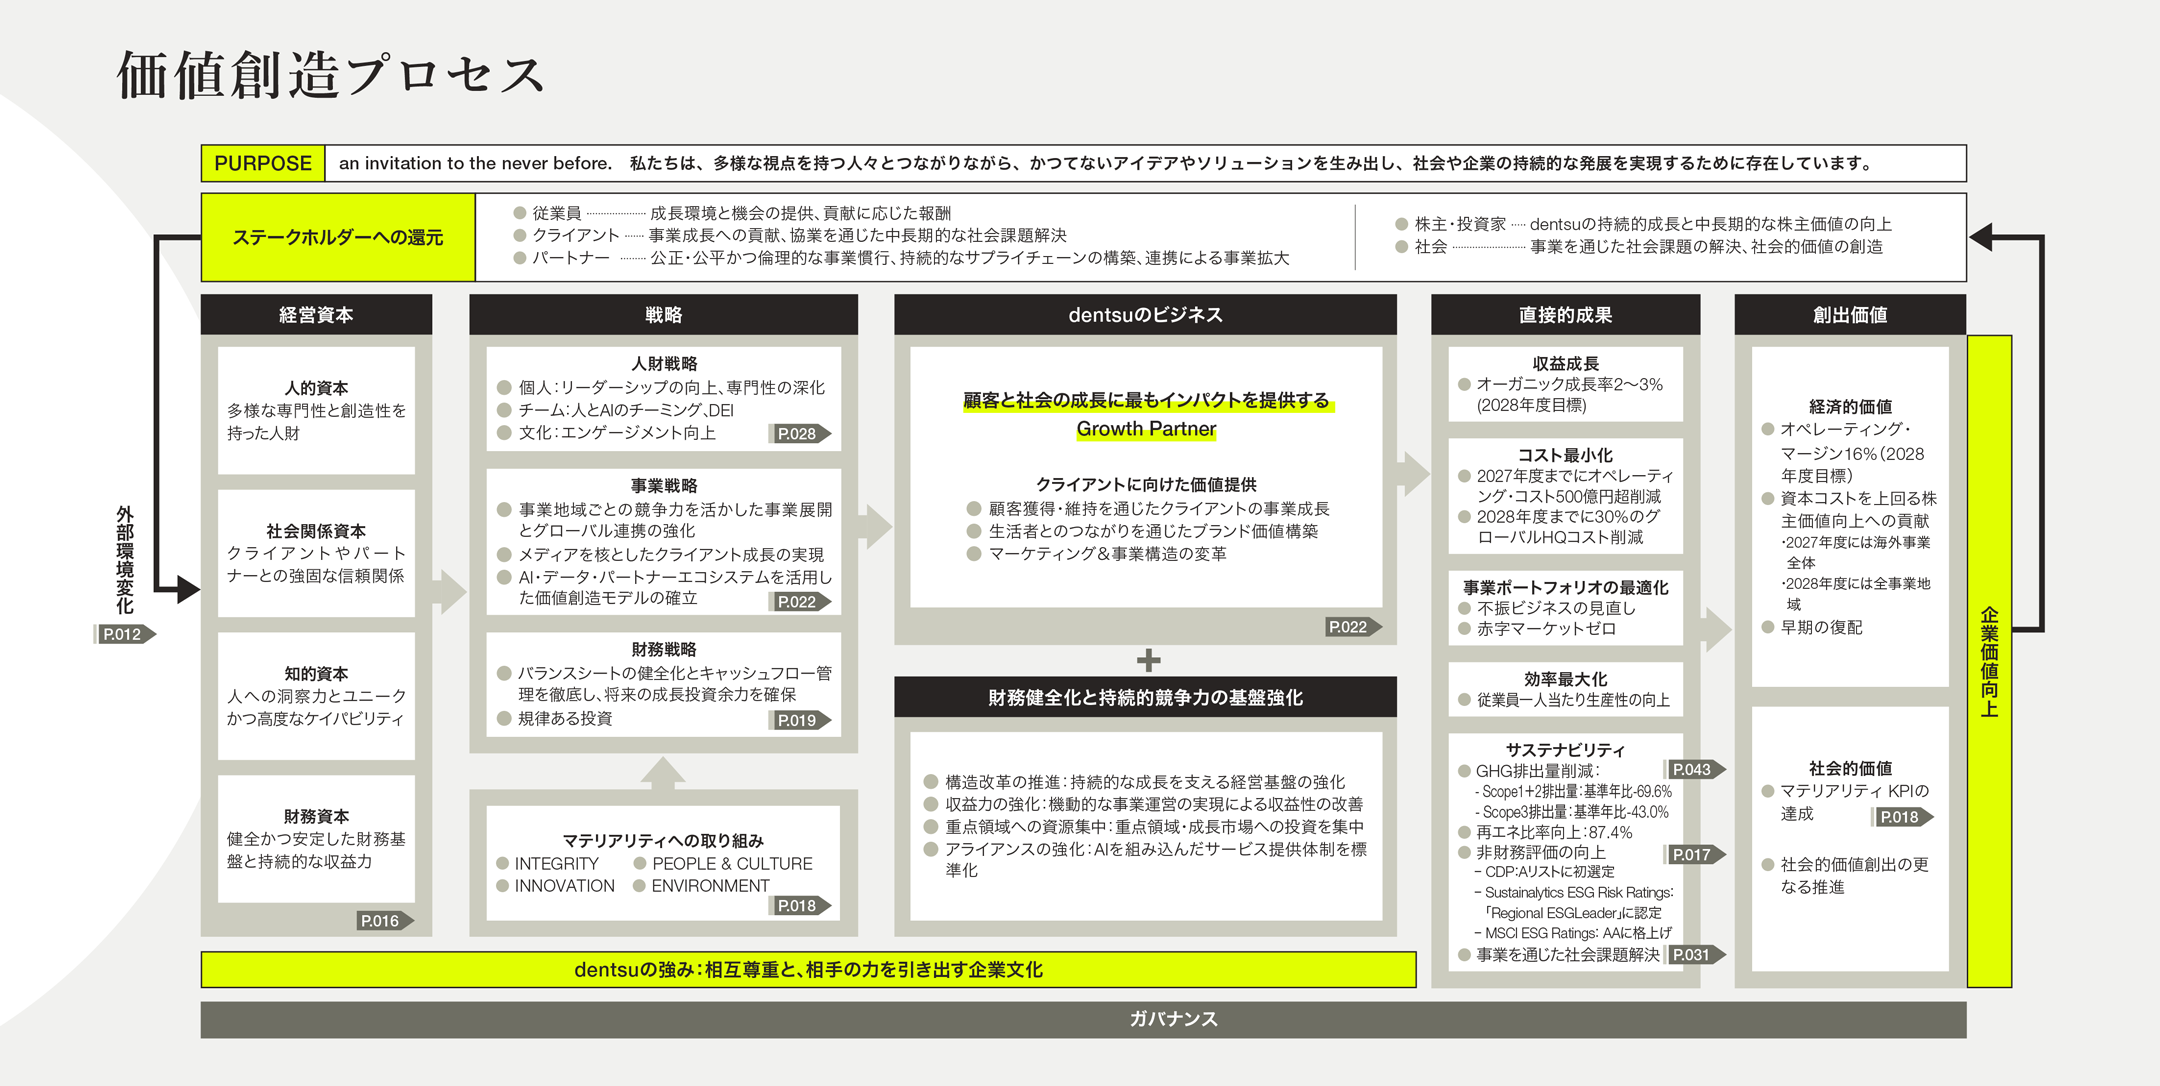
財務健全化と持続的競争力の基盤強化
重点アジェンダ
構造改革の推進
収益力の強化
重点領域への資源集中
アライアンスの強化
持続的な成長を支える
経営基盤の強化
機動的な事業運営の
実現による収益性の改善
重点領域・成長市場への
投資を集中
AIを組み込んだ
サービス提供体制を標準化
・組織の簡素化、事業ポートフォリオ最適化
・コスト構造・オペレーション改革
・メディア領域を中心とした成長への投資
・有力パートナーとのアライアンスを強化
・財務基盤の再建
・不振ビジネスの見直し
・独自ケイパビリティ・プロダクトの拡充
・パートナーのAI基盤・ツールを活用
・ガバナンス・人財マネジメントの高度化
・従業員一人当たりの生産性向上
・新たな収益モデルの構築
・AIを顧客接点・業務プロセスへ実装
21
Right to Win - 競争優位の源泉
当社が選ばれる理由
競争優位を発揮できる領域への集中
顧客成長の実現プロセス
専門性とネットワーク
重点クライアントセグメント
成長パートナーへの進化
• 専門ブランドによる高い付加価値の提供
• 競争優位性を発揮できるセグメントへ注力
• グローバルネットワークによる最適なケイパビリ
ティ提供
• 地域毎に重点領域を開拓・拡大
例:US/UKではB2B・テクノロジー領域に強み
信頼に基づくパートナーシップ
• 長期的なクライアント、パートナーとの信頼関係
• 日本企業として培った信頼と透明性
オープンであり、クライアント中心
フォーカス市場
• 十分な規模と持続的な成長性を有する
市場に注力
• 高成長市場への投資・事業展開を加速
例:日本での成長の加速、
APACの注力マーケットでの成長回帰
• オープンエコシステムによる最適な連携
• クライアントデータを尊重した柔軟な提供
専門性・信頼・オープンな協業
成長性・競争優位性を踏まえた
経営資源の集中
• 専門性を着実に届け、信頼を積み上げ、
包括的なパートナーシップを構築する
専門性の高いサービス
▼
事業支援参画
チーム・サービスの組み込み
▼
成長の支援
着実なデリバリー
▼
信頼の獲得
ケイパビリティの接続
▼
支援領域を拡張
着実かつ継続的な成果創出と
事業成長への貢献
22
クライアントの成長を実現する価値提供の構造
クライアントに向けた価値提供
生活者とのつながりを通じたブランド価値構築
顧客獲得・維持を通じたクライアントの事業成長
マーケティング&事業構造の変革
当社が提供する成長のドライバー
生活者とのエンゲージメント形成
文化・コミュニティの革新
顧客体験の変革
スポーツ
コンテンツ
サプライチェーン
エンターテインメント
ゲーミング
CRMの
統合・高度化
メディアを核としたグローバルでのコア事業
戦略的なコア
クライアントの
成長戦略
独自
データ&AI
予測分析・
測定
AIを組み込んだ実行機能
コンテンツ&
プロダクション
メディア
アクティベーション
エンゲージメント
&ロイヤルティ
事業・テクノロジー変革
ブランドの革新
AIによる変革
ブランド・
新製品イノベーション
AI駆動のビジネス・
テクノロジー変革
デジタル
エクスペリエンス
成長を加速するケイパビリティ
ソーシャル
独自資産を活かして選定マーケットで展開
コマース
AIの適用
当社の最注力領域|すべてのマーケットで展開
発想力・技術力を活かして選定マーケットで展開
23
AI × データ × 実装力 × パートナーエコシステムによる成長モデルの構築
AI・データを起点とした価値創造
クライアントへのAI導入支援
• AIによるマーケティング変革
• エージェンティックワークフローへの転換
• オペレーティングモデルのAI適用
独自データ・AIプロダクトの強化
• 独自のAIソリューション開発
• データ資産の高度化・収益化
AIを組み込んだオペレーション
• プランニング・意思決定のAI適用
• コンテンツ・アクティベーションの自動化
• AI駆動のプロジェクトマネジメント
独自資産に加えて、クライアント・パートナーと共にAIによる革新を追求
競争優位を支える共創型のアライアンス/パートナーエコシステム
パートナー組み込み型のアプローチ
オープンエコシステムの追求
• 共同実証の推進(カスタマーゼロ)
• 当社独自資産と一体化したソリューション開発
• 共創による継続的なイノベーション
• オープンで相互運用可能な設計
• パートナーとの透明性の高い協業
• 日本市場の知見とグローバルネットワークの融合
多面的な共創モデル
• クライアント × パートナー × ユーザーの
あらゆる角度からの協業を推進
• 共創、検証、スケールのサイクルを加速
24
各リージョンの役割と戦略
Growth Partnerという目指す姿は、リージョンを超えて共通。
その実現に向けた道筋は、各々の競争環境を踏まえ、リージョンごとに最適化
Japan
Americas
EMEA
APAC
Group Core
グループの中核
Growth Engine
成長の原動力
Turnaround Focus
収益力の回復
Next Growth Base
次の成長基盤
グループ最大の利益基盤の強化と、
メディアを核とした顧客基盤拡大と
メディア起点の統合提案と
市場横断での連携加速と
クライアントのバリューチェーン全体への
CXMを起点としたAI変革により、
オペレーティング・モデルの簡素化による
成長機会への集中投資による
貢献を通じた新たな価値の創出
グローバル成長へ貢献
市場シェア回復と収益性の改善
競争優位性と収益性の向上
4つのリージョンがそれぞれの役割を果たし、連携し合うことでグループ全体の持続的な成長を実現
25
リージョン別の現状と戦略
Japan:Group Core グループの中核
グループ最大の利益基盤の強化と、クライアントのバリューチェーン全体への貢献を通じた新たな価値の創出
現状の
認識
長期的なクライアント、パートナーとの信頼関係を背景に、マーケティング/コミュニケーション領域を中心とした強固な利益基盤
BX・DX領域では、更なる成長にむけて、既存クライアント内および新規クライアントでの拡大余地が存在
グループ内の連携強化とAI活用により、さらなる提供サービスの領域拡大が可能
今後の戦略
01
クライアントのバリューチェーン
全体へのビジネス拡大
ビジネス変革・テクノロジーの活用を軸に、
提供サービスの領域を拡大
02
成長領域・
クライアント層の開拓
成長領域や中規模・小規模の企業等への
アプローチを強化し、事業基盤を拡大
03
スポーツ&エンターテインメント
事業の成長加速
日本発IPを活用し、グローバルS&Eとの
連携を通じて高付加価値ビジネスを拡大
26
リージョン別の現状と戦略
Americas:Growth Engine 成長の原動力
メディアを核とした顧客基盤拡大とCXMを起点としたAI変革により、グローバル成長へ貢献
現状の
認識
メディア領域のパイプラインは盤石ではない
大型案件を巡る競争激化などにより、売上成長と利益率を圧迫
成長領域への投資やメディア・クリエイティブ・CXM横断の提案力には改善の余地がある
今後の戦略
01
提案型の
営業モデルの強化
成長業種を中心に早期アプローチを推進。
提案型営業の強化によりパイプラインを拡大
02
成長領域の
ケイパビリティ拡充
積極的なパートナー連携により、コマース、ソーシャル等の
成長領域でのケイパビリティを強化・拡充
03
AI変革ビジネス
の拡大
CXMを起点としたAI変革を推進。提供サービスの
標準化と取引形態の多様化により収益性を向上
27
リージョン別の現状と戦略
EMEA:Turnaround Focus 収益力の回復
APAC:Next Growth Base 次の成長基盤
メディア起点の統合提案とオペレーティング・モデルの簡素化による
市場横断での連携加速と成長機会への集中投資による
市場シェア回復と収益性の改善
主要マーケットにおける市場シェアの低下
現状の 分断されたサービス提供体制や大型案件を巡る競争激化などが収益性を圧迫
認識
クライアント、パートナーとの関係性強化とサービスの市場横断展開に向けた
最適な体制構築が必要
競争優位性と収益性の向上
データ、ソーシャル、コマース等の重要領域における競争力・独自性の強化が重要
現状の 成長投資の原資確保に向け、事業ポートフォリオの合理化を推進
認識
クライアント、パートナーとの関係性強化や市場横断連携により、
案件獲得・業務効率化の余地が存在
今後の戦略
01
02
今後の戦略
03
01
02
03
メディア領域を中心とした
統合提案の推進
重点市場への
集中投資
業務の集約と
サービス提供体制の効率化
成長市場への
集中投資
市場間・プラクティス間の
連携の推進
事業ポートフォリオ
の合理化
メディアを中心に統合提案を
推進。共通化したサービスを
市場横断で展開し、
効率的に拡大
ゲートウェイ市場へ
投資を集中。
グローバルクライアントの維持と
マルチマーケット案件を拡大
類似業務の集約による
効率化およびサービス整理、
コスト管理により、
収益性を改善
高成長市場での
投資を強化し、
ケイパビリティを強化・拡充。
競争優位性を確立
市場横断での連携を加速。
メディア、CR、CXM、BXが
一体となった統合提案により、
成長回復を実現
事業ポートフォリオと
オペレーションの合理化により、
成長市場への投資の
原資を創出
28
2028年度の主要KPI
収益性の回復と財務健全化を最優先課題とし、
2028年までに次の成長に向けた強固な事業・顧客基盤の確立にコミットする
オペレーティング・マージン
16%
経営基盤の再構築
2027年度に
500億円超の
オペレーティング・コスト削減
グローバル HQ
更なるコスト削減
不振ビジネス見直しによる
赤字マーケット*の解消
AI・D&T推進による
生産性向上
着実な
オーガニック成長
2028年度までに
グローバルHQコストを
2027年度:
重点領域と人的資本への
投資による生産性の向上
2028年度
オーガニック成長率
2028年度:全4リージョンが
従業員一人当たり
生産性の向上
2-3%
30%程度削減
(2026年度計画比)
赤字マーケットゼロ*
株主価値向上に貢献
*2025年2月時点の累計投下資本100億円超のマーケット
29
財務方針とキャピタルアロケーション
財務基盤の強化を進め、早期の復配を含めた適切な資本配分の実現を図り、
持続的な成長軌道への回帰を目指す
財務方針
株主還元
投資・M&A
バランスシートの健全化とキャッシュフロー
早期の復配を実現すべく、
AI、データ&テクノロジー領域や
管理を重視し、将来の成長投資余力を
収益力強化とともに可能な施策を
構造改革への投資を優先し、
確保すべく、早期の再建を進める
検討・実行していく
M&Aは当面抑制的に検討する
30
人的資本経営、ガバナンス、サステナビリティに関する考え方
2025年2月に公表した中期経営計画の方針を踏襲し、各項目へのコミットメントを継続
人的資本経営
ガバナンス
サステナビリティ
・2026年度は、統合レポートに加え、人的資本レポートを公開予定
・人財の育成機会を提供し、人財の獲得・定着に向けて各マーケットに応じた仕組みを設計
・働きがいと活力のある組織づくりに向けてエンゲージメントスコアを継続的にモニタリング
・2025年に示した方針に基づき、実効性の高いコーポレートガバナンスを推進
・インテグリティを最優先した組織風土の定着に向けた取り組みを引き続き実行
・リスクマネジメントの強化、内部統制の更なる向上を継続
・サステナビリティ戦略として、マテリアリティへの取り組みを継続
・経営における財務と非財務を更に統合し、グループの企業価値を向上
国際的な外部評価機関から高い評価を獲得
<格付評価>
<構成銘柄選定>
<メディア評価>
・Sustainalytics「Regional ESG Leader」認定
・FTSE Blossom Japan Index/Japan Sector Relative
Indexにそれぞれ6年連続、3年連続で構成銘柄に選定
・米国TIME誌
「WORLD'S MOST SUSTAINABLE
COMPANIES」 ランキングに2年連続で選出
・MSCI ESG Ratings「AA」へ格上げ
・Dow Jones Best-in-Class World/
Asia Pacific Indexにそれぞれ3年/10年連続選定
・SOMPOサステナビリティ・インデックスに2年連続選定
31
2028年へのコミットメント、その先の成長加速
持続的な成長へ
再成長に向けた基盤構築
組織・オペレーションの抜本的簡素化による
顧客起点の経営への転換
変革の起点となる現状認識
•
市場成長を
捉えきれなかった現実
•
複雑性の高いオペレーション
•
フォーカスと規律の不足
財務健全化および事業の効率化・
収益性向上へのコミットメント
•
顧客の成長を多面的・
継続的に支援するGrowth Partnerへ
•
AI時代に最適化された
効率的なオペレーションの実現
•
日本市場を起点に、ネットワークを
活かし、信頼とイノベーションに
基づく成長モメンタムを構築
競争優位の源泉に基づくフォーカスの設定と
ケイパビリティの強化・拡充
規律ある実行による着実な成長
2026
2027
2028
32
APPENDICES
2026年度上期連結決算概況
H1 FY2026 Consolidated Financial Results
2026
2025
1-6月
1-6月
Jan-Jun
売上高
排除ベース
YoY (%)
Jan-Jun
Turnover
為替影響
前年同期比
Constant currency basis (%)
3,294.9
717.4
2,972.2
683.9
+10.9
+4.9
収益
Revenue
売上総利益
Net revenue
583.1
562.0
+3.7
(1.7)
235.9
236.7
(0.3)
(0.3)
156.1
153.8
+1.5
(4.9)
138.0
121.3
+13.7
(0.2)
調整後営業利益
Underlying operating profit
49.6
72.0
12.3%
47.2
67.5
12.0%
+5.1
+6.6
+30bps
(3.8)
+5.9
+90bps
38.2
147.29円
32.4
124.98円
+17.9
+17.8
83.9
46.3
77.2
(36.5)
(73.6)
73.2
+5.5
-
オペレーティング・マージン
調整後当期利益*
-
基本的1株当たり調整後当期利益*
営業利益(損失)*
当期利益(損失)*
調整後EBITDA*
-
Operating margin
Underlying net profit*
-
Underlying basic EPS*
Statutory Operating profit (loss)*
Statutory Net profit (loss)*
Underlying EBITDA*
為替
Currency
2026 1-6月平均
Av. Jan-Jun
円/USD
JPY/USD
158.1円
円/GBP
JPY/GBP
212.7円
2025 1-6月平均
Av. Jan-Jun
148.3円
192.5円
前年同期比
YoY (%)
+6.6
+10.5
34
連結決算の四半期情報
Quarterly Results
前年
2026
2026
同期比
4–6月
Apr-Jun
1–3月
YoY (%)
Jan-Mar
前年
同期比
YoY (%)
売上高
Turnover
1,666.6
+11.9
1,628.4
+9.8
収益
Revenue
360.2
+6.3
357.1
+3.4
売上総利益
Net revenue
288.0
+4.8
295.1
+2.7
107.1
+0.0
128.9
(0.6)
79.7
+2.7
76.4
+0.2
72.5
+12.6
65.5
+15.0
26.8
+11.1
22.8
(1.3)
調整後営業利益
Underlying operating profit
34.2
+1.7
37.8
+11.5
オペレーティング・マージン
Operating margin
11.9%
(40)bps
12.8%
+100bps
調整後当期利益*
Underlying net profit
18.7
+17.3
19.6
+18.4
営業利益*
Statutory Operating profit*
18.9
65.0
+155.5
当期利益*
Statutory Net profit*
6.1
40.2
+540.5
調整後EBITDA
Underlying EBITDA
36.7
+0.9
40.5
+10.1
35
四半期 オーガニック成長率
Quarterly Organic Growth
(%)
グループ連結
Group Consolidated
1–3月
4–6月
7–9月
10–12月
累計
1–3月
4–6月
7–9月
10–12月
累計
Jan-Mar
Jul-Sep
YTD
Jul-Sep
Oct-Dec
YTD
2024*
(3.7)
+1.4
+0.3
+0.3
+0.5
(0.7)
Oct-Dec
Apr-Jun
2025
+0.2
(0.2)
Apr-Jun
Jan-Mar
2026
+0.8
+0.2
+0.9
+2.6
(0.1)
日本
米州
欧州・中東・アフリカ*
アジア太平洋
Japan
Americas
EMEA*
APAC
2026
2025
2024
2026
2025
2024
2026
2025
2024*
2026
2025
2024
+5.4
+5.1
+1.8
(6.9)
(1.6)
(3.7)
(1.2)
(3.8)
+7.8
(0.2)
(12.7)
(6.2)
+8.4
+3.5
+4.7
+5.0
+5.5
+9.9
+4.5
+6.2
+2.4
+2.8
+4.0
(3.0)
(5.0)
(5.1)
(3.4)
(1.8)
(3.0)
(6.6)
(3.1)
(2.9)
(4.1)
+0.8
(0.2)
(0.9)
(1.1)
(1.5)
(1.8)
(9.4)
+6.9
+2.2
(7.5)
(4.6)
(7.1)
(12.5)
(11.6)
(3.8)
(6.8)
(7.0)
+0.3
(3.9)
36
四半期 オペレーティング・マージン
Quarterly Operating Margin
(%)
グループ連結
Group Consolidated
1–3月
4–6月
7–9月
10–12月
累計
1–3月
4–6月
7–9月
10–12月
累計
Jan-Mar
Jul-Sep
Oct-Dec
YTD
15.0
12.0
12.2
11.5
17.8
12.3
YTD
Jul-Sep
2024*
10.4
Oct-Dec
Apr-Jun
2025
11.8
11.9
Apr-Jun
Jan-Mar
2026
12.8
23.5
14.4
14.8
日本
米州
欧州・中東・アフリカ*
アジア太平洋
Japan
Americas
EMEA*
APAC
2026
2025
2024
2026
2025
2024
2026
2025
2024*
19.3
19.3
14.9
21.5
25.6
24.0
13.2
11.3
14.1
32.0
28.0
30.8
29.0
27.6
24.4
20.8
25.6
24.4
24.5
24.1
16.1
17.7
16.2
24.8
21.1
18.8
22.9
22.5
23.4
3.9
(2.7)
2025
2024
(1.1)
(13.9)
(14.0)
(13.0)
(6.5)
(6.7)
13.7
11.6
8.8
12.4
14.3
22.6
2026
27.8
(0.1)
(6.5)
(4.0)
22.8
2.5
2.1
14.7
0.9
37
プラクティス別 オーガニック成長率
Organic Growth by Practice
(%)
FY2024
FY2025
FY2026
米州
欧州・中東・アフリカ*
アジア太平洋
Americas
EMEA*
APAC
Media
Creative
CXM
Media
Creative
CXM
Media
Creative
CXM
1–3月
Jan-Mar
(3.5)%
(6.0)%
(11.0)%
(1.2)%
(12.0)%
(20.6)%
(2.9)%
(6.9)%
(18.8)%
4–6月
Apr-Jun
+0.3%
+0.1%
(11.4)%
+1.7%
(12.8)%
+50.8%
+0.1%
(6.2)%
(24.8)%
7–9月
Jul-Sep
+1.3%
(1.3)%
(11.2)%
+0.1%
+10.2%
+24.3%
(3.1)%
(14.9)%
(30.9)%
10–12月
Oct-Dec
+0.5%
(4.5)%
(8.6)%
+4.9%
(8.1)%
+7.6%
+0.1%
(3.2)%
(24.1)%
累計
YTD
(0.4)%
(3.0)%
(10.6)%
+1.7%
(6.0)%
+8.8%
(1.3)%
(7.6)%
(24.7)%
米州
欧州・中東・アフリカ
アジア太平洋
Americas
EMEA
APAC
売上総利益構成比 / Proportion of net revenue
2025 Jan-Dec
30%
23%
47%
Media
Creative
CXM
Media
Creative
CXM
Media
Creative
CXM
1–3月
Jan-Mar
(1.1)%
(5.4)%
(10.3)%
+2.6%
(3.7)%
(6.4)%
+5.0%
(9.3)%
(24.1)%
4–6月
Apr-Jun
+0.7%
+2.3%
(8.0)%
(0.7)%
(3.8)%
(10.9)%
(6.2)%
(14.3)%
(33.9)%
7–9月
Jul-Sep
(0.2)%
(9.1)%
(3.4)%
+6.6%
(17.6)%
(8.7)%
+2.2%
(37.3)%
(11.3)%
10–12月
Oct-Dec
+2.0%
(8.7)%
(2.1)%
+1.5%
(1.4)%
(10.7)%
+0.7%
+1.1%
(5.7)%
累計
YTD
+0.3%
(5.3)%
(6.0)%
+2.4%
(6.8)%
(9.1)%
+0.3%
(13.5)%
(19.3)%
Americas
Media
欧州・中東・アフリカ
アジア太平洋
31%
Americas
EMEA
APAC
21%
Media
Creative
CXM
Media
Creative
CXM
Media
Creative
CXM
Jan-Mar
+0.5%
(12.4)%
(0.9)%
+5.3%
(5.0)%
(5.7)%
(2.5)%
(9.5)%
(24.2)%
4–6月
Apr-Jun
(1.2)%
(23.3)%
(2.0)%
+0.3%
(2.9)%
(3.9)%
(1.6)%
+5.8%
(12.9)%
7–9月
Jul-Sep
10–12月
Oct-Dec
累計
YTD
(0.4)%
(18.2)%
(1.5)%
+2.5%
(3.9)%
(4.9)%
(2.0)%
(1.4)%
(19.1)%
32%
63%
57%
EMEA
APAC
Creative
CXM
2026 Jan-Jun
米州
1–3月
11%
24%
13%
24%
13%
48%
Americas
Media
10%
34%
63%
56%
EMEA
APAC
Creative
CXM
38
2026年度第2四半期主要マーケット別 オーガニック成長率
Q2 FY2026 Organic Growth of Major Markets
2026 4-6月
Apr-Jun
マーケット
Market
オーガニック成長率
Organic Growth %
5%以上
"5% or more"
フランス、インド、日本、ポーランド、スペイン
France, India, Japan, Poland, Spain
0%以上 ~ 5%未満
デンマーク、オランダ、タイ
(10)%以上 ~ 0%未満
オーストラリア、カナダ、中国、ドイツ、イタリア、ノルウェー、シンガポール、スウェーデン、スイス、英国、米国
"0% to 5%"
"(10)% to 0%"
(10)%未満
"Less than (10)%"
Denmark, Netherlands, Thailand
Australia, Canada, China, Germany, Italy, Norway, Singapore, Sweden, Switzerland, UK, USA
台湾
Taiwan
39
2026年度上期主要マーケット別 オーガニック成長率
H1 FY2026 Organic Growth of Major Markets
2026 1-6月
Jan-Jun
マーケット
Market
オーガニック成長率
Organic Growth %
5%以上
"5% or more"
フランス、インド、日本、ポーランド、スペイン
France, India, Japan, Poland, Spain
0%以上 ~ 5%未満
デンマーク、オランダ、英国
(10)%以上 ~ 0%未満
カナダ、中国、イタリア、ノルウェー、シンガポール、スウェーデン、スイス、台湾、タイ、米国
"0% to 5%"
"(10)% to 0%"
(10)%未満
"Less than (10)%"
Denmark, Netherlands, UK
Canada, China, Italy, Norway, Singapore, Sweden, Switzerland, Taiwan, Thailand, USA
オーストラリア、ドイツ
Australia, Germany
40
セグメント情報
Segment Information
2026
1-6月
Jan-Jun
売上総利益
Net revenue
日本
Japan
米州
Americas
2025
1-6月
Jan-Jun
売上総利益
Net revenue
調整後営業利益(損失)
Underlying operating profit (loss)
オペレーティング・マージン
Operating margin
消去/全社
Eliminations/
Central costs
計
Total
連結
Consolidated
156.1
138.0
49.6
579.6
3.5
583.1
60.4
29.4
12.1
(3.2)
98.7
(26.8)
72.0
25.6%
18.8%
8.8%
(6.5)%
12.3%
Underlying operating profit (loss)
Operating margin
アジア太平洋
APAC
235.9
調整後営業利益(損失)
オペレーティング・マージン
欧州・中東・アフリカ
EMEA
日本
Japan
米州
Americas
欧州・中東・アフリカ
EMEA
アジア太平洋
APAC
消去/全社
Eliminations/
Central costs
計
Total
連結
Consolidated
236.7
153.8
121.3
47.2
559.0
3.0
562.0
58.3
33.3
5.7
(4.2)
93.2
(25.7)
67.5
24.6%
21.7%
4.7%
(8.9)%
12.0%
41
2026年度上期電通グループ 売上総利益の増減要因
H1 FY2026 Movement of Group Net Revenue
42
2026年度上期電通グループ 調整後営業利益貢献分析
H1 FY2026 Movement of Group Underlying Operating Profit
43
調整後販管費内訳
Underlying SG&A Expenses Breakdown
売上総利益
Net revenue
2026
1-6月
Jan-Jun
売上総利益販売管理費率
Vs Net revenue (%)
前年同期比(為替影響排除ベース)
YoY (CC, %)
営業費
Other operating
expenses
人件費
Staff cost
減価償却
Depreciation
583.1
392.4
100.2
18.7
ー
67.3
17.2
3.2
(1.7)
(3.1)
+0.7
(11.8)
44
営業利益調整項目
Reconciliation from Underlying Operating Profit to Statutory Operating Profit
2026
2025
1-6月
1-6月
Jan-Jun
Jan-Jun
前年同期差
前年同期比
+6.6
YoY
調整後営業利益
Underlying operating profit
72.0
67.5
+4.5
調整項目
Adjustment items
11.9
(104.1)
+116.0
(12.3)
(12.4)
+0.1
-
M&A関連コスト
-
Acquisition costs
(0.1)
(0.0)
(0.1)
24.2
(91.7)
+115.9
29.6
(0.1)
+29.7
(12.4)
(4.4)
(8.0)
(86.6)
+86.6
7.0
(0.6)
+7.6
83.9
(36.5)
+120.4
営業利益(損失)
Statutory operating profit (loss)
YoY (%)
45
当期利益調整項目
Reconciliation from Underlying Net Profit to Statutory Net Profit
2026
2025
1-6月
Jan-Jun
1-6月
Jan-Jun
前年同期差
前年同期比
+17.9
YoY
調整後当期利益*
Underlying net profit*
38.2
32.4
+5.8
調整項目
Adjustment items
8.0
(106.1)
+114.1
11.9
(104.1)
+116.0
(0.0)
0.0
(0.1)
0.0
0.0
+0.0
(4.2)
(2.5)
(1.7)
0.4
0.4
+0.0
当期利益(損失)*
Statutory net profit (loss)*
46.3
(73.6)
+119.9
YoY (%)
46
営業利益以下の損益項目
Statutory Operating Profit to Statutory Net Profit
2025
2026
前年同期差
1-6月
1-6月
YoY
Jan-Jun
Jan-Jun
前年同期比
YoY
(%)
営業利益
Statutory Operating profit (loss)
83.9
(36.5)
+120.4
3.4
1.9
+1.5
+78.9
金融損益及び税金控除前利益
Statutory Profit (loss) before interest and tax
87.2
(34.6)
+121.9
(9.8)
(8.7)
(1.0)
3.8
4.5
(0.7)
(15.4)
13.6
13.2
+0.3
+2.6
税引前利益
Statutory Profit (loss) before tax
77.5
(43.4)
+120.8
法人所得税費用
Income tax expense
25.9
25.9
(0.0)
(0.0)
当期利益
Statutory Net profit (loss)
51.5
(69.3)
+120.8
46.3
(73.6)
+119.9
5.3
4.3
+0.9
+21.1
47
連結キャッシュフロー計算書
Cash Flow
調整後営業利益
構造改革費用の支出額
非現金支出費用等の調整
運転資本変動前の純営業活動によるキャッシュ・フロー
運転資本の増減
純営業活動によるキャッシュ・フロー
利息の純額
配当金の受取額
法人所得税の支払額
営業活動によるキャッシュ・フロー
固定資産の取得・売却の純額
子会社の取得・売却の純額
非支配持分株主からの子会社持分取得・売却の純額
有価証券の取得・売却の純額
その他の投資活動
リース負債返済による支出
その他の財務活動
グロス・キャッシュ・フロー
配当金の支払額
非支配持分株主への配当金の支払額
自己株式の取得による支出
換算差額
売却目的資産への振替
純有利子負債の増減額
2026
1–6月
Jan–Jun
Underlying operating profit
Business transformation cost spent
Non-cash items adjustments
Cash flows from operating activities before adjusting changes in
working capital and others
Change in working capital
Cash flows from operations
Net interest (paid)
Dividends received
Income taxes paid
Net cash flows from operating activities
Capital spend
Acquisitions and disposals
Purchase/sale of interests in subsidiary
Purchase/sale of securities
Other investing activities
Repayment of lease liabilities
Other financing activities
Gross cash flow
Dividends paid
Dividends paid to non-controlling interests
Share buybacks
Exchange rate movements
Transfer to assets held for sale
Change in net debt
72.0
(13.6)
21.2
2025
1–6月
Jan–Jun
前年同期差
YoY
67.5
(3.8)
23.2
+4.5
(9.8)
(2.0)
79.6
86.8
(7.2)
44.7
124.3
(11.2)
4.8
(22.7)
95.1
22.5
(14.2)
(1.8)
3.5
0.4
(17.9)
(11.6)
76.0
(3.7)
(0.0)
(0.5)
17.5
89.3
(24.4)
62.5
(8.3)
2.6
(19.8)
37.0
(8.6)
(0.6)
18.6
1.1
(19.0)
0.3
28.8
(18.1)
(5.2)
(0.0)
(4.2)
(16.2)
(14.9)
+69.1
+61.8
(2.9)
+2.2
(2.9)
+58.1
+31.1
(14.2)
(1.2)
(15.1)
(0.7)
+1.1
(11.9)
+47.2
+18.1
+1.5
(0.0)
+3.7
+33.7
+104.2
48
連結財政状態計算書
Financial Position
2026
2025
6月末
End of Jun
のれん
無形資産
有形固定資産
使用権資産(リース負債相殺後)
投資有価証券
純運転資本
純有利子負債
買収関連負債
その他
Goodwill
Intangibles
PPE
Right-of-use assets(net of lease liabilities)
Equity instruments
Net working capital
Net debt
M&A related debt
Others
純資産
Net assets
為替
Currency
円/USD
円/GBP
- Owners' interests
- Non-controlling interests
JPY/USD
JPY/GBP
12月末
End of Dec
329.5
320.1
22.0
23.0
165.8
前期末差
前期末比
Var.
Var. %
+9.4
+2.9
(1.0)
(4.3)
178.2
(12.4)
(83.0)
(86.4)
+3.4
+3.9
(31.5)
(83.8)
(4.1)
93.8
22.9
(173.1)
(4.2)
91.4
448.0
374.8
73.1
(54.4)
+89.3
+0.1
+2.4
+37.7
+49.8
(12.0)
(237.6)
+51.6
+2.4
+2.6
162.6円
215.5円
156.8円
211.0円
+3.7
+2.2
77.0
485.7
424.6
61.1
76.1
+0.9
(7.0)
+1.2
+8.4
+13.3
(16.4)
49
レバレッジ
Leverage
2026
6月末
End of Jun
有利子負債*
現金及び現金同等物
Total debt*
Cash and cash equivalents
2025
6月末
End of Jun
(450.2)
(559.4)
366.4
369.2
純有利子負債
Net debt
(83.8)
(190.2)
調整後EBITDA(LTM)*
Underlying EBITDA (LTM)*
186.3
193.3
50
2026年度上期 dentsu Japan業績
H1 FY2026 Results: dentsu Japan
2026 1-6月
前年同期比
Jan-Jun
YoY
売上総利益
(株)電通
電通総研
電通デジタル
セプテーニ・ホールディングス
電通プロモーション *1
電通ライブ
その他・内部取引等
売上総利益合計
調整後営業利益
オペレーティング・マージン
DENTSU Inc.
Dentsu Soken
Dentsu Digital
Net revenue
(%)
113.3
32.2
+11.2
7.1
(3.4)
13.9
Dentsu Live
3.4
Others
+9.5
(36.0)
40.7
(20.1)
60.4
+3.6
Total net revenue
235.9
Operating margin
25.6%
Underlying operating profit
+11.7
25.2
SEPTENI HOLDINGS
Dentsu Promotion
+4.2
(0.3)
+100bps
*1 電通プロモーションの前年同期比には電通tempoを含んでいません
*1 The year-on-year figure for “Dentsu Promotion” does not include Dentsu Tempo.
売上総利益構成比
Proportion of net revenue by company
51
dentsu Japan 業務区分別売上高の状況(IFRSベース)
Turnover of dentsu Japan by Business Category (IFRS Basis)
2026
1-6月
Jan-Jun
新聞
雑誌
ラジオ
テレビ
インターネット *1
OOHメディア
クリエイティブ
マーケティング/プロモーション
コンテンツサービス(日本基準)*2
その他 *1
連結調整等 *3
マスメディアに含まれるインターネット
合計
Total
ご参考
インターネット領域 *1 *4
Internet domain *1 *4
Newspapers
Magazines
Radio
Television
Internet *1
OOH Media
Creative
Marketing/Promotion
Content Services (Japan GAAP)*2
Others 1
Consolidation adjustments and others3
Internet included in mass media
前年
同期比
YoY (%)
2026
4-6月
Apr-Jun
前年
同期比
YoY(%)
2026
1-3月
Jan-Mar
前年
同期比
YoY(%)
20.4
5.0
6.2
293.6
247.9
29.6
114.2
110.0
69.8
119.4
8.5
(2.8)
1,021.8
(2.0)
(12.8)
+7.1
+6.6
+15.8
+33.8
+7.6
(9.1)
+13.7
+12.7
+4.0
6.9
2.4
2.8
142.4
115.5
15.3
53.8
50.6
42.3
59.3
2.6
(1.3)
492.6
(6.3)
(9.0)
+3.2
+6.6
+16.4
+42.6
+9.4
(3.1)
+43.7
+12.0
+6.2
13.5
2.6
3.4
151.2
132.4
14.3
60.4
59.3
27.5
60.0
5.9
(1.5)
529.2
+0.4
(16.2)
+10.5
+6.7
+15.2
+25.5
+6.0
(13.6)
(13.9)
+13.3
+2.0
308.9
+13.0
145.8
+13.7
163.1
+12.3
*1 「インターネット」「その他」「インターネット領域」の前年比は2025年実績からCARTA HD分を除いたプロフォーマで算出しております。
*2 IFRSベースでは、日本基準と売上計上のタイミングに差があります。上表では日本基準を記載し、IFRSベースとの差額は「連結調整等」で調整しています。
*3 海外グループへの売上や、会計基準の違いによる調整等を含みます。
*4 日本の広告費に準じ、メディアに加え、インターネット関連領域として制作費などを加算しています。上表では日本基準で記載しています。
*5 区分変更の際には、開示済みの数字も組み替えて表示しています。
*1 The year-on-year figures for ‘Internet,’ ‘Others,’ and the ‘Internet domain’ are calculated on a pro forma basis, excluding the portion attributable to CARTA HD
from the 2025 actual results.
*2 There is a difference in revenue recognition timing between IFRS and Japan GAAP. Japan GAAP is used for Content Services in the table. The difference
between IFRS and Japan GAAP is recorded in “Consolidation adjustments and others.”
*3 Turnover to group companies in International business, GAAP difference and others are included.
*4 Production and other costs are added to “Internet” in accordance with “Advertising Expenditures in Japan.” The above table is based on Japan GAAP.
*5 Disclosed figures would be revised in case of allocation changes.
52
(株)電通業種別売上高の状況(日本基準ベース)
Turnover of Dentsu Inc. by Industry (J-GAAP Basis)
2026
1-6月
Jan-Jun
構成比
前年同期比
(%)
(%)
Ratio
YoY
2026
前年同期比
4-6月
Apr-Jun
YoY
2026
前年同期比
1-3月
Jan-Mar
(%)
YoY
(%)
官公庁・団体・その他サービス
Government/Organizations/Professional Services
29.6
4.2
+27.1
9.5
+1.4
20.1
+44.5
情報・通信・マスメディア・ソフトウェア
Information/Telecomm/Mass Media/Softwares
110.0
15.6
+46.1
60.3
+85.4
49.8
+16.2
金融・保険
Finance/Insurance
67.6
9.6
+8.4
28.2
+7.9
39.3
+8.7
食品・飲料・嗜好品
Food/Beverages/Tobacco
102.3
14.5
(0.2)
55.5
+1.2
46.8
(1.7)
家庭用品・パーソナルケア
Household/Personal Products
76.0
10.7
+7.8
40.8
+4.5
35.1
+12.0
外食・各種生活サービス
Food Services/Other Consumer Services
78.6
11.1
+2.9
37.2
+13.2
41.4
(4.9)
自動車・関連品
Automobiles/Related Products
29.5
4.2
(7.9)
12.4
+1.4
17.0
(13.7)
交通・レジャー
Transportation/Leisure
39.2
5.5
(1.7)
18.9
(6.9)
20.3
+3.6
流通・小売業
Distribution/Retailing
43.8
6.2
+7.0
21.1
(3.2)
22.7
+18.5
薬品・医療用品
Pharmaceuticals/Medical Supplies
25.6
3.6
(11.4)
13.6
(13.9)
12.0
(8.4)
アパレル・家庭用耐久消費財
Apparel/Consumer Durables
29.5
4.2
+12.2
15.7
+32.7
13.8
(4.5)
精密機器・事務用品
Technology Equipment/Office Supplies
11.4
1.6
+10.6
5.4
+27.0
6.0
(0.9)
その他
Others
64.2
9.1
+8.5
25.9
+6.8
38.4
+9.7
合計
Total
707.2
100.0
+9.2
344.5
+12.9
362.7
+5.9
*1 区分変更の際には、開示済みの数字も組み替えて表示しています。
*1 Disclosed figures would be revised in case of allocation changes.
53
業種別売上高の状況
Turnover by Industry
2026
1-6月
Jan-Jun
構成比
前年同期比
(%)
(%)
Ratio
YoY
2026
4-6月
Apr-Jun
前年同期比
YoY
(%)
2026
1-3月
Jan-Mar
前年同期比
YoY
(%)
官公庁・団体・その他サービス
Government/Organizations/Professional Services
62.6
2.2
+13.2
26.2
+2.6
36.4
+22.3
情報・通信・マスメディア・ソフトウェア
Information/Telecomm/Mass Media/Softwares
395.5
14.2
+30.1
205.6
+26.2
189.8
+34.5
金融・保険
Finance/Insurance
226.3
8.1
+13.9
113.0
+12.5
113.2
+15.3
食品・飲料・嗜好品
Food/Beverages/Tobacco
376.2
13.5
+14.9
214.5
+16.4
161.7
+13.0
家庭用品・パーソナルケア
Household/Personal Products
398.6
14.3
+13.0
202.1
+22.2
196.6
+4.8
外食・各種生活サービス
Food Services/Other Consumer Services
259.4
9.3
+18.1
129.6
+24.7
129.8
+12.1
自動車・関連品
Automobiles/Related Products
187.6
6.7
+7.5
90.9
+15.0
96.7
+1.2
交通・レジャー
Transportation/Leisure
82.0
2.9
+16.4
43.4
+15.3
38.6
+17.8
流通・小売業
Distribution/Retailing
351.7
12.6
+28.9
187.3
+25.4
164.4
+33.1
薬品・医療用品
Pharmaceuticals/Medical Supplies
109.4
3.9
+16.9
60.2
+24.5
49.2
+8.8
アパレル・家庭用耐久消費財
Apparel/Consumer Durables
138.5
5.0
+27.1
74.1
+31.9
64.3
+22.0
精密機器・事務用品
Technology Equipment/Office Supplies
56.6
2.0
+4.2
28.4
+4.3
28.2
+4.1
その他
Others
150.1
5.4
+6.8
74.8
+11.5
75.3
+2.6
合計
Total
2,794.3
100.0
+17.7
1,450.2
+20.1
1,344.2
+15.3
*1 海外事業の約90%および㈱電通が集計の対象となります。
*2 区分変更の際には、開示済みの数字も組み替えて表示しています。
*3 1-3月分については、第1四半期決算発表時の公表数値を訂正しています。
*1 The scope includes approximately 90% of International businesses and all of Dentsu Inc.
*2 Disclosed figures would be revised in case of allocation changes.
*3 The figures for Jan-Mar have been revised from Q1 FY 2026 earnings announcement.
54
為替関連データ
Currency Exchange Rates Information
期中平均レート
Average rate
2025
1-6月
Jan-Jun
2026
1-6月
Jan-Jun
期末日レート
Period end rate
前年同期比
YoY(%)
2026
6月末
End of Jun
2025
12月末
End of Dec
前期末比
YoY(%)
円/USD
JPY/USD
158.1円
148.3円
+6.6
162.6円
156.8円
+3.7
円/EUR
JPY/EUR
184.5円
162.2円
+13.7
185.7円
184.1円
+0.9
円/GBP
JPY/GBP
212.7円
192.5円
+10.5
215.5円
211.0円
+2.2
円/INR
JPY/INR
1.7円
1.7円
(1.4)
1.7円
1.7円
(1.3)
円/CNY
JPY/CNY
23.0円
20.5円
+12.6
24.0円
22.4円
+6.8
売上総利益に占める主要通貨の割合
Net revenue ratio by currency
2026 1-6月
Jan-Jun
(%)
JPY
円
USD
米ドル
EUR
ユーロ
GBP
英ポンド
INR
インドルピー
CNY
中国元
Others
その他
合計
40.5
23.4
11.1
7.1
2.0
1.7
14.3
100.0
Total
55
新規メディアのネットウィン(海外)と競合案件勝率(日本)
Net New Media Wins (Americas, EMEA, APAC) & Pitch Win Rates (Japan)
新規メディアのネットウィン(海外)
競合案件勝率(日本)
Net New Media Wins (Americas, EMEA, APAC)
Pitch Win Rates (Japan)
H1 26
H2 23
H1 24
H2 24
H1 25
H2 25
Source:Dentsu Inc.
56
脚注
Footnotes
スライド10、17
調整後当期利益・基本的1株当たり調整後当期利益・当期利益(損失)は、全て親会社所有者帰属分です。
スライド34、35
調整後当期利益・基本的1株当たり調整後当期利益・当期利益は、全て親会社所有者帰属分です。
調整後EBITDAは、調整後営業利益に調整項目に含まれない減価償却費及び無形資産の償却費を加算し算定しています(IFRS16号に基づく減価償却費調整分を除く)。
スライド36、37、38
2024年度以降のオーガニック成長率、オペレーティングマージンはロシア影響を含みません。
スライド46
調整後当期利益・当期利益は、全て親会社所有者帰属分です。
営業利益調整項目は「営業利益調整項目」をご参照ください。
スライド50
有利子負債は、借入金および社債の合計額です。リース負債(26年6月末1,993億円 25年6月末1,990億円)は、含まれていません。
調整後EBITDAは、調整後営業利益に調整項目に含まれない減価償却費及び無形資産の償却費を加算し算定しています
(IFRS16号に基づく減価償却費調整分は上記減価償却費から除く、及びリース負債にかかる利息費用は上記調整後営業利益から除く)
57
脚注
Footnotes
Slide 10,17
Statutory Net profit (loss), underlying net profit and underlying basic EPS: After attribution to non-controlling interests.
Slide 34,35
Statutory Net profit, underlying net profit and underlying basic EPS: After attribution to non-controlling interests.
Underlying EBITDA: Underlying operating profit before depreciation and amortization (excluding depreciation adjustments under IFRS 16).
Slide 36,37,38
The results from the Russia business are excluded from 2024 onwards.
Slide 46
Underlying net profit and Statutory net profit: After attribution to non-controlling interests.
Operating profit adjustments: Please refer to “Reconciliation from Underlying operating profit to Statutory operating profit”
Slide 50
Total debt is the sum of loans and bonds. Lease liabilities (JPY 199.3 bn as of Jun 30, 2026; JPY 199.0 bn as of Jun 30, 2025) are not included.
Underlying EBITDA: Underlying operating profit before depreciation and amortization (excluding depreciation adjustments under IFRS 16 from the depreciation,
and excluding the lease expenses with lease liabilities under IFRS 16 from the underlying operating profit)
58
本資料取扱い上の留意点
将来に関する記述について
•
本資料は、電通グループに関する「将来に関する記述」またはそれに該当しうるものを含んでおります。本資料に記載される過去の事実以外の記述は将来に関する記述であることがあります。「~を目標としている」、「~を計画している」、「~と
考えている」、「~と予想される」、「~を目的としている」、「~する意向である」、「~するつもりである」、「~する可能性がある」、「~が期待される」、「~と見込まれる」、「~と予測する」、及びこれらに類似する意味の単語や言葉、又はそれら
の否定文は、将来に関する記述です。将来に関する記述には、 (i) 今後の資本支出、費用、収入、利益、シナジー効果、経済動向、負債、財務状況、配当政策、損失及び将来予測、(ii) 事業及び経営戦略、並びに (iii) 電通グループの
事業に対する政府規制の影響に関する記述を含みます。
•
将来に関する記述は、期待されている結果に重大な影響を与えうるリスクや不確実性を伴い、一定の重要な前提に基づいています。多くの要因により、実際の結果は、将来に関する記述において想定又は示唆されていたものと著しく異なるこ
とがあります。かかる不確実性やリスクに鑑み、本資料を閲覧される方は、その記述が行われた日付け時点における予想でしかない将来に関する記述に過度に依存しないようご注意ください。
•
IFRS第16号「リース」適用について
IFRS第16号「リース」を、19年1月1日より適用しています。当社は、本会計基準の遡及適用に伴う累積的影響を、適用開始日に認識(修正遡及アプローチを採用)しており、過年度の業績を、IFRS第16号ベースで修正再表示しており
ません。
なお、現時点で想定される主なリスクとして、以下のような事項を挙げることができます(なお、かかるリスクや要因はこれらの事項に限られるものではありません)。
①
②
③
④
⑤
⑥
⑦
⑧
⑨
⑩
⑪
⑫
•
競争力・長期戦略のリスク
事業変革のリスク
サステナビリティ目標未達のリスク
人財の獲得、開発、維持のリスク
エンタープライズ・テクノロジーの統合及び導入のリスク
情報セキュリティ・サイバーセキュリティのリスク
個人情報(データ・ガバナンス)のリスク
企業文化に関するリスク
コンプライアンスに関するリスク
訴訟等に関するリスク
景気変動及び社会的変革に関するリスク
災害、事故並びに地政学に関するリスク
電通グループは、適用法令により義務付けられる場合を除き、本資料に含まれる将来に関する記述又はその他の記述を更新する義務を負うものではありません。
59
Disclaimer
Forward-Looking Statements
•
This presentation contains statements about Dentsu Group that are or may be forward-looking statements. All statements other than statements of historical facts included in this
presentation may be forward-looking statements. Without limitation, any statements preceded or followed by or that include the words “targets”, “plans”, “believes”, “expects”, “aims”,
“intends”, “will”, “may”, “anticipates”, “estimates”, “projects” or, words or terms of similar substance or the negative thereof, are forward-looking statements. Forward-looking
statements include statements relating to the following: information on future capital expenditures, expenses, revenues, earnings, synergies, economic performance, and future
prospects.
•
Such forward-looking statements involve risks and uncertainties that could significantly affect expected results and are based on certain key assumptions. Many factors could cause
actual results to differ materially from those projected or implied in any forward-looking statements. Due to such uncertainties and risks, readers are cautioned not to place undue
reliance on such forward-looking statements, which speak only as of the date hereof.
•
IFRS16 “Leases”:
IFRS16 “Leases” is applied from January 1st, 2019. The cumulative effect of initially applying IFRS 16 is recognized at the date of initial application (modified retrospective approach).
Past results are not restated under IFRS 16.
•
Risks, uncertainties or other factors that could cause actual results to differ materially from those expressed in any forward-looking statement include, without limitation.
① Risk related to competitiveness and long-term strategy
② Risk related to business transformation
③ Risk related to failure to achieve sustainability targets
④ Risk related to securing, developing, and retaining talent
⑤ Risk related to integrating and introducing Enterprise Technology
⑥ Risk related to information security and cyber security
⑦ Risk related to personal and other information (data governance)
⑧ Risk related to corporate culture
⑨ Risk related to compliance
⑩ Risk related to litigation, etc.
⑪ Risk associated with cyclical changes in the global economy and social changes
⑫ Risk related to disasters and accidents, and geopolitical risks
•
Dentsu Group disclaims any obligation to update any forward-looking or other statements contained herein, except as required by applicable law.
60
用語の定義
売上高:
顧客に対して行った請求額および顧客に対する請求可能額の総額(割引および消費税等の関連する税金を除く)
調整後営業利益:
調整後営業利益は、営業利益から、買収行為に関連する損益および一時的要因を排除した、恒常的な事業の業績を測る利益指標
買収行為に関連する損益:
買収に伴う無形資産の償却費、M&Aに伴う費用、完全子会社化に伴い発行した株式報酬費用
一時的要因の例示:
構造改革費用、減損、固定資産の売却損益、割増退職金など
オペレーティング・マージン:
調整後営業利益÷売上総利益
調整後当期利益(親会社所有者帰属分):
当期利益(親会社所有者帰属分)から、営業利益に係る調整項目、関連会社株式売却損益、アーンアウト債務・買収関連プットオプション再評価損益、
これらに係る税金相当・非支配持分損益相当などを排除した、親会社所有者に帰属する恒常的な損益を測る指標
基本的1株当たり調整後当期利益:
調整後当期利益(親会社所有者帰属分)で計算したEPS
配当性向:
基本的1株当たり調整後当期利益を用いて計算
調整後EBITDA :
調整後営業利益に調整項目に含まれない減価償却費及び無形資産の償却費を加算し計算
(IFRS16号に基づく減価償却費調整分は上記減価償却費から除く、及びリース負債にかかる利息費用は上記調整後営業利益から除く)
為替影響排除ベース:
当期実績(業績予想)と、前期実績などの比較数値を直近決算為替レートで洗い替えた数値との比較
為替変動による影響:
前年実績と、前年実績を直近決算為替レートで洗い替えした数値との差額
M&Aによる成長:
前年期初から直近決算期末までに実施したM&Aによる影響額(為替変動による影響を調整後。M&A先のオーガニック成長分は控除)
オーガニック成長率 :
為替やM&Aの影響等を除いた内部成長率。前年期初から直近決算期末までに実施したM&Aについては、当期に連結された月数分は前年同期にも連結されていたと
仮定して、M&A先も含めてオーガニック成長率を計算
純運転資本:
営業債権及びその他の債権、棚卸資産、その他の流動資産から営業債務及びその他の債務、その他の流動負債を控除した運転資本
純有利子負債:
有利子負債から現金及び現金同等物を控除した額
61
Definition
Turnover: The gross amounts billable to clients handled by the Group on behalf of clients, with net of discounts, VAT and other sales-related taxes
Underlying operating profit: KPI to measure recurring business performance which is calculated as operating profit added with M&A related items and one-off items
M&A related items: Amortization of purchased intangible assets, acquisition costs, share-based compensation expense issued following the acquisition of 100% ownership of a subsidiary
One-off items: Items such as business transformation cost, asset write-down, gain/loss on sales of non-current assets and extra severance pay
Operating margin: Underlying operating profit divided by net revenue
Underlying net profit (attributable to owners of the parent): KPI to measure recurring net profit attributable to owners of the parent which is calculated as net profit (attributable to owners
of the parent) added with adjustment items related to operating profit, gain/loss on sales of shares of associates, revaluation of earnout liabilities / M&A related put-option liabilities, taxrelated, NCI profit-related and other one-off items
Underlying basic EPS: EPS based on underlying net profit (attributable to owners of the parent)
Payout ratio: Calculated based on underlying basic EPS
Underlying EBITDA: Underlying operating profit before depreciation and amortization
(excluding depreciation adjustments under IFRS 16 from the depreciation, and excluding the lease expenses with lease liabilities under IFRS 16 from the underlying operating profit)
Constant currency basis: Comparison with the current period where the previous year’s numbers are recalculated using the currency exchange rate which is used for the current year’s
numbers
Currency: Currency movements comparing prior period reported net revenue at reported currency to prior period net revenue at constant currency (reported currency of the current year)
Acquisitions: The effect of business acquired or disposed of since the beginning of the prior year
Organic growth/ Organic revenue decline: Organic growth and organic revenue decline represent the constant currency year-on-year growth/decline after adjusting for the effect of
business acquired or disposed of since the beginning of the prior year. This is calculated by comparing current period reported net revenue to prior period net revenue, adjusted mainly for
the pre-acquisition or pre-disposal net revenue as applicable, and stated at constant exchange rate, in order to derive like-for-like growth
Net working capital: Working capital after deducting trade payables, other payables and other current liabilities from trade receivables and other receivables, inventories and other current
assets
Net debt: Total debt less cash and cash equivalents
62
THANK YOU