Note: This document has been translated from the Japanese original for reference purposes only. In the event of any discrepancy between this translated document and the Japanese original, the original shall prevail. October 29, 2026 Consolidated…
Note: This document has been translated from the Japanese original for reference purposes only. In the event of any discrepancy
between this translated document and the Japanese original, the original shall prevail.
October 29, 2026
Consolidated Financial Results
for the Six Months Ended September 30, 2026
(Under Japanese GAAP)
Company name:
Prestige International Inc.
Listing:
Tokyo Stock Exchange Prime Market
Securities code:
4290
URL:
http://www.prestigein.com/
Representative:
Shinichi Tamagami, CEO
Inquiries:
Tetsuya Nakamura,Head of Investor Relations, PR&IR Division Group Management Division
Telephone:
+81-3-5213-0826
Scheduled date to file semi-annual securities report:
November 12, 2026
Scheduled date to commence dividend payments:
December 8, 2026
Preparation of supplementary material on quarterly financial results:
Holding of quarterly financial results briefing:
Yes
Yes(for institutional investors and analysts)
(Yen amounts are rounded down to millions, unless otherwise noted.)
- Consolidated financial results for the Six months ended September 30, 2026 (from April 1, 2026 to September 30, 2026 )
(Percentages indicate year-on-year changes.)
(1) Consolidated operating results (cumulative)
Profit attributable to
Net sales
Operating profit
Ordinary profit
owners of parent
Six months ended
Millions of yen
% Millions of yen
% Millions of yen
% Millions of yen
%
September 30, 2026
37,467
8.9
4,669
9.7
5,058
8.0
2,359
-11.4
September 30, 2025
34,400
11.8
4,256
14.1
4,683
18.2
2,662
19.3
(Note) Comprehensive income
For the Six months ended September 30, 2026:
For the Six months ended September 30, 2025:
Basic earnings
per share
Six months ended
¥2,373 million
¥3,159 million
[- 24.9%]
[53.3%]
Diluted earnings
per share
Yen
Yen
September 30, 2026
18.98
18.93
September 30, 2025
21.04
20.99
(2) Consolidated financial position
Total assets
Net assets
Equity-to-asset ratio
Millions of yen
Millions of yen
%
September 30, 2026
85,659
52,568
56.1
March 31, 2026
82,244
52,486
58.8
As of
Reference:
Equity
As of September 30, 2026 :
As of March 31, 2026 :
¥48,040 million
¥48,362 million
1
- Cash dividends
Annual dividends per share
First quarter-end
Second quarter-end
Third quarter-end
Fiscal year-end
Yen
Yen
Yen
Yen
Fiscal year ended
13.00
-
-
March 31, 2026
Fiscal year ended
14.00
-
March 31, 2027
Fiscal year ended
March 31, 2027
-
(Forecast)
(Note) Revisions to the forecast of cash dividends most recently announced: No
Total
Yen
13.00
26.00
14.00
28.00
- Forecast of consolidated financial results for the year ending March 31, 2027
% Million yen
% Million yen
Profit attributable to
owners of parent
% Million yen
%
7.2
8.2
1.6
Net sales
Million yen
Full year
76,000
Operating profit
9,600
Ordinary profit
(Note) Revision to the financial results forecast announced most recently:
9,930
5,920
Basic earnings
per share
yen
0.0
47.46
No
Note:
(1) Significant changes in the scope of consolidation during the period
(2) Adoption of accounting treatment specific to the preparation of quarterly consolidated financial statements:
(3) Changes in accounting policies, changes in accounting estimates, and restatement
- Changes in accounting policies due to revisions to accounting standards and other regulations:
- Changes in accounting policies due to other reasons:
- Changes in accounting estimates:
- Restatement:
None
None
None
None
None
None
(4) Number of issued shares (common shares)
Total number of issued shares at the end of the period (including treasury shares)
As of September 30, 2026
127,293,300 shares As of March 31, 2026
127,176,300 shares
Number of treasury shares at the end of the period
As of September 30, 2026
3,836,923 shares As of March 31, 2026
2,441,523 shares
Average number of shares during the period (cumulative from the beginning of the fiscal year)
As of September 30, 2026
124,308,644 shares As of September 30, 2025
126,517,994 shares
*Review of the Japanese-language originals of the attached consolidated quarterly financial statements by
certified public accountants or an audit firm: None
*Explanation for appropriate use of financial forecasts and other special notes
The forecasts given in this document are based on the current available information in the company and certain reasonable assumptions
to the company. And we don’t commit to achieve these forecasting numbers. Actual results may differ from these forecasts by a variety
of reasons.
2
Table of Contents for Attachment
2
Summary of operating results
(1) Analysis of operating results
2
(2) Summary of Financial Position
4
(3) Future outlook
5
Semi-annual Consolidated Financial Statements and Primary Notes
6
Semi-annual Consolidated Balance Sheet
6
Semi-annual Consolidated Statements of Income and Comprehensive Income
8
Semi-annual Consolidated Statement of Income
8
Semi-annual Consolidated Statement of Comprehensive Income
9
Semi-annual Consolidated Statement of Cash Flows
10
Notes to Semi-annual Consolidated Financial Statements
12
(Note on Segment Information, etc.)
12
(Note on Significant Changes in the Amount of Shareholders' Equity)
13
(Note on Going Concern Assumptions)
13
-1-
1.Summary of operating results
(1) Analysis of operating results
During the six months ended September 30, 2026 (from April 1, 2026 to September 30, 2026; hereinafter the "interim period"),
the business environment surrounding the Group saw a persistent structural labor shortage (tight labor supply and demand) and
rising operating costs driven by price increases due to inflation. Under these circumstances, corporate clients have increasingly
sought to outsource business processes and optimize operational costs.
In the automotive industry, to which our major clients belong, new vehicle sales maintained a recovery trend. In addition, the
aging of vehicle ownership continues against the backdrop of rising vehicle prices, leading to resilient demand for new and
switched auto insurance policies as well as roadside assistance services. In the non-life insurance industry, against a background
of frequent natural disasters and revised insurance premium rates, there is an expanding movement toward outsourcing peripheral
operations - particularly accident handling - to highly specialized external service providers.
In the real estate industry, condominium prices rose further due to surging construction costs and higher interest rates, which
caused weakness in the supply and sales of newly built units. On the other hand, an increasing number of companies are
outsourcing resident support and after-sales maintenance services to external specialists, driven by the aging of existing property
stock and labor shortages in the property management sector. Given these developments across various industries, demand for
the Group’s BPO services has been rising further.
Under these conditions, the Group has strived to provide high-quality services to client companies with a two-pronged
approach: pursuing "human-centric, advanced problem-solving capabilities" and advancing operational sophistication and
efficiency through digital technologies such as AI. In addition, recognizing the recruitment and retention of talent - the source of
our high-quality service delivery - as a top priority, the Group continuously implemented improvements in employee
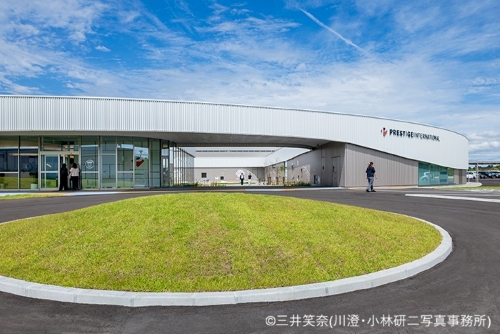
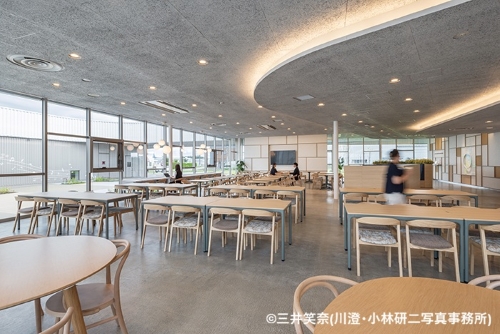
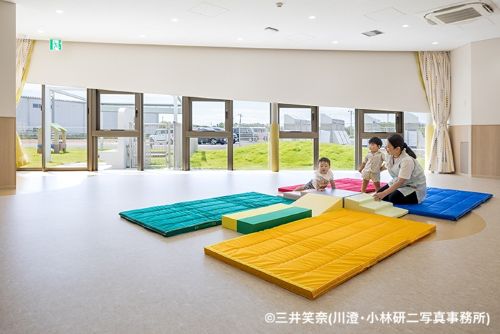
compensation throughout the period. We also successfully opened the "Akita BPO Katagami Campus" (operation started in
August 2026), working to establish a stable operating structure. We have strived to absorb the increased costs associated with
these initiatives through operational efficiencies achieved via the introduction of digital technology and through appropriate price
pass-throughs to client companies.
As a result, consolidated operating results for the interim period were as follows:
Consolidated net sales reached 37,467 million yen (up 8.9% YoY), driven by existing business expansion, new client
acquisitions, and progress in contract service fee increases, which fueled sales growth across almost all business segments, led by
the core Automotive Business. Operating profit was 4,669 million yen (up 9.7% YoY), primarily due to growth in the
Automotive Business and Financial Guarantee Business. Ordinary profit reached 5,058 million yen (up 8.0% YoY), reflecting the
increase in operating profit. Under non-operating income and expenses, the Group recorded 198 million yen in foreign exchange
gains, 169 million yen in interest on securities, and 45 million yen in share of profit of entities accounted for using equity
method, however, non-operating income (expenses), net decreased by 38 million yen year on year, mainly due to an increase in
interest expenses resulting from higher borrowings. Profit attributable to owners of parent was 2,359 million yen (down 11.4%
YoY), due to the recording of extraordinary losses including 207 million yen in costs for the 40th anniversary commemorative
shareholder benefits and a 101 million yen loss on retirement of non-current assets, in addition to an increased tax burden.
FY2026.3/H1
FY2027.3/H1
FY2026.3
Sales
34,400 million yen
37,467 million yen (YoY +8.9%, +3,066 million yen)
70,911 million yen
Operating profit
4,256 million yen
4,669 million yen (YoY + 9.7%, +413 million yen)
8,869 million yen
Ordinary profit
4,683 million yen
5,058 million yen (YoY +8.0%, +374 million yen)
9,772 million yen
Profit attributable to
owners of parent
2,662 million yen
2,359 million yen (YoY -11.4%, -302 million yen)
5,920 million yen
Basic earnings per
share
21.04 yen
18.98 yen
-2-
46.97 yen
● Automotive Business
The Automotive Business, primarily providing roadside
assistance for non-life insurers and automakers, saw sales
growth driven by an increase in the number of policies at our
client auto insurance companies, and the smooth expansion of
services for new client companies launched in and after the
third quarter of the previous fiscal year. Operating profit
increased despite higher procurement costs caused by the
summer peak season and disasters in certain areas, supported
by contract service fee increases implemented from the
beginning of the period and one-time revenue recognition
resulting from the conclusion of operations with certain
business partners.
FY2026.3/H1
FY2027.3/H1
Sales
14,466 million yen
15,523 million yen
Operating profit
1,486 million yen
1,633 million yen
Change
YoY (%)
Sales
1,057 million yen
7.3%
147 million yen
9.9%
Operating profit
● Property Business
The Property Business, providing repair services for
condominiums / housing and maintenance for hourly parking
Sales
lots, grew sales as Home Assist's on-site support for rental
Operating profit
apartments continued to perform strongly, and contract fee
increases for Park Assist business implemented from the
beginning of the period contributed positively. Operating profit Sales
also increased, supported by contract fee increases
Operating profit
implemented from the beginning of the period, centered on
Park Assist clients。
● Global Business
The Global Business, providing travel insurance claims agent
services and medical support for expatriates (Healthcare
Sales
Program), saw steady expansion in new client acquisitions for
Operating profit
its core Healthcare Program; however, sales from the
insurance premium portion declined due to changes in contract
structures with client companies. Nevertheless, the impact on Sales
profit is negligible, as cost of sales also decreased by an
Operating profit
equivalent amount to that of insurance premium. Additionally,
transaction volumes for travel insurance claims adjustment
services decreased in Southeast Asia and Europe, resulting in
overall lower sales and profit compared to corresponding
period of the previous fiscal year
● Customer Business
In the Customer Business, which provides customer support
services, sales remained almost at the same level as the
Sales
corresponding period of the previous fiscal year. While
Operating profit
improving service quality for existing client companies,
accelerated efficiency through various DX initiatives processes
contributed to an improvement in profitability.
Sales
Operating profit
-3-
FY2026.3/H1
FY2027.3/H1
4,833 million yen
5,309 million yen
356 million yen
476 million yen
Change
YoY (%)
476 million yen
9.9%
120 million yen
33.7%
FY2026.3/H1
FY2027.3/H1
5,110 million yen
5,060 million yen
712 million yen
702 million yen
Change
YoY (%)
-49 million yen
-1.0%
-10 million yen
-1.4%
FY2026.3/H1
FY2027.3/H1
3,300 million yen
3,281 million yen
469 million yen
494 million yen
Change
YoY (%)
-18 million yen
-0.6%
25 million yen
5.4%
● Financial Guarantee Business
In the Financial Guarantee Business, which provides livingrelated financial guarantee services such as rent and medical
Sales
expenses, sales increased as the contract volume for property
Operating profit
rent guarantees, medical care expense guarantees, and
eldercare expense guarantees expanded smoothly in operations
run by PI Group subsidiary Entrust Inc. (Securities Code:
Sales
7191). Operating profit increased because, although
Operating profit
outsourcing commission fees increased in line with the growth
in property rent guarantee contracts, allowance for doubtful
accounts were kept lower than projected and other expense
increases were contained within a controlled level.
● IT Business
The IT Business, providing IT solutions, recorded significant
increases in both sales and profit as a temporary revenue
Sales
recognition and associated development expenses, due to the
Operating profit
launch and rollout of systems developed for The SmallAmount & Short-Term Insurance client.
FY2026.3/H1
FY2027.3/H1
5,860 million yen
7,017 million yen
1,388 million yen
1,582 million yen
Change
YoY (%)
1,156 million yen
19.7%
194 million yen
14.0%
FY2026.3/H1
FY2027.3/H1
388 million yen
842 million yen
32 million yen
93 million yen
Change
YoY (%)
Sales
453 million yen
116.6%
Operating profit
60 million yen
183.8%
● Social Business
The Social Business, which operates the "Aranmare"
women's sports teams, childcare services, and regional
Sales
revitalization projects, was unable to expand sales due to the
Operating profit
departure of certain sponsors in Yamagata Prefecture
following the relocation of the "Aranmare" women's volleyball
team's hometown from Yamagata Prefecture to Akita
Sales
Prefecture. In addition, operating profit declined due to higher
Operating profit
personnel costs aimed at strengthening team operations and
athletic capabilities。
FY2026.3/H1
FY2027.3/H1
441 million yen
431 million yen
-187 million yen
-269 million yen
Change
YoY (%)
-9 million yen
-2.2%
-82 million yen
―
(2) Summary of Financial Position
Assets: Total assets amounted to 85,659 million yen at the end of the interim period, an increase of 3,414 million yen compared
to the end of the previous fiscal year. Current assets increased by 1,475 million yen compared to the end of the previous fiscal
year to 48,104 million yen, primarily due to an increase in accounts receivable - trade of 917 million yen, cash and deposits of
630 million yen, advances paid of 251 million yen, and allowance for doubtful accounts of 395 million yen. Non-current assets
increased by 1,939 million yen compared to the end of the previous fiscal year to 37,554 million yen, as buildings and structures
increased by 4,966 million yen, intangible assets other increased by 311 million yen, and investment securities increased by 316
million yen, which offset a decrease of 3,650 million yen in construction in progress and other property, plant and equipment。
Liabilities: Total liabilities increased by 3,333 million yen compared to the end of the previous fiscal year to 33,090 million yen.
This was mainly due to an increase in short-term borrowings of 3,300 million yen, notes and accounts payable - trade of 227
million yen, and income taxes payable of 178 million yen.
Net Assets: Net assets amounted to 52,568 million yen, an increase of 81 million yen compared to the end of the previous fiscal
year. While there were dividend payments and the repurchase of treasury stock, profit attributable to owners of parent was 2,359
million yen.
Consolidated Statement of Cash Flows
Operating activities: Net cash provided by operating activities during the interim period amounted to 3,822 million yen. Primary
positive factors included profit before income taxes of 4,764 million yen, depreciation of 1,310 million yen, an increase in
allowance for doubtful accounts of 393 million yen, and 40th anniversary commemorative shareholder benefit expenses of 207
million yen. Primary negative factors included income taxes paid of 1,763 million yen and an increase in trade receivables of
934 million yen.
Investing activities: Net cash used in investing activities during the interim period amounted to 4,117 million yen. The main
outflow factors were expenditures for the purchase of property, plant and equipment and intangible assets of 3,484 million yen
and expenditures for the purchase of investment securities of 1,136 million yen, while proceeds from redemption of investment
securities provided 489 million yen.
-4-
Financing activities: Net cash provided by financing activities during the interim period amounted to 1,005 million yen. The
main inflow factors were a net increase in short-term borrowings of 3,300 million yen and proceeds from sale of shares of
subsidiaries not resulting in change in scope of consolidation of 569 million yen. The main outflow factors included dividends
paid of 1,620 million yen, expenditures for the repurchase of treasury stock of 999 million yen, and dividends paid to noncontrolling interests of 199 million yen.
As a result of the above, cash and cash equivalents at the end of the interim period increased by 630 million yen compared to the
end of the previous fiscal year to 28,691 million yen, representing an increase of 1,762 million yen compared to the end of the
corresponding period of the previous fiscal year
(3) Future outlook
Regarding the full-year consolidated earnings forecast for the fiscal year ending March 31, 2027, the figures announced at the
beginning of the fiscal year remain unchanged. During the interim period, both net sales and operating profits exceeded the
initial forecasts, driven primarily by the Financial Guarantee Business and Roadside Assistance-related operations. On the other
hand, for the second half of the fiscal year, we anticipate profit-decreasing factors, as certain revenues and profits will be deferred
to the next fiscal year because the launch of several new client contracts is now scheduled for next fiscal year, alongside an
expected decrease in transaction volume for automotive-related operations due to a slowdown in clients' new vehicle sales.
Concurrently, we are advancing launch preparations in the second half for new outsourced operations scheduled for full-scale
operation in the next fiscal year. Taking all these factors into comprehensive consideration, we expect full-year results to land
largely in line with our initial plan.
-5-
- Semi-annual Consolidated Financial Statements and Primary Notes
(1) Semi-annual Consolidated Balance Sheet
(Thousands of yen)
As of March 31, 2026
Assets
Current assets
Cash and deposits
Accounts receivable - trade
Advances paid
Merchandise and finished goods
Work in process
Raw materials and supplies
Other
Allowance for doubtful accounts
Total current assets
Non-current assets
Property, plant and equipment
Buildings and structures, net
Other, net
Total property, plant and equipment
Intangible assets
Goodwill
Other
Total intangible assets
Investments and other assets
Investment securities
Other
Allowance for doubtful accounts
Total investments and other assets
Total non-current assets
Total assets
-6-
As of September 30, 2026
28,072,724
6,588,395
11,293,423
143,333
174,089
112,551
3,652,482
(3,407,611)
46,629,387
28,702,995
7,505,701
11,545,163
109,103
43,589
124,624
3,876,108
(3,802,894)
48,104,392
13,489,232
6,458,292
19,947,525
18,455,797
2,807,428
21,263,226
512,747
3,252,961
3,765,708
466,459
3,564,012
4,030,471
10,610,014
1,362,668
(71,069)
11,901,613
35,614,847
82,244,235
10,926,987
1,402,761
(68,648)
12,261,099
37,554,797
85,659,189
(Thousands of yen)
As of March 31, 2026
Liabilities
Current liabilities
Notes and accounts payable - trade
Short-term borrowings
Income taxes payable
Contract liabilities
Provision for bonuses
Reserve for fulfillment of guarantees
Other
Total current liabilities
Non-current liabilities
Retirement benefit liability
Asset retirement obligations
Other
Total non-current liabilities
Total liabilities
Net assets
Shareholders' equity
Share capital
Capital surplus
Retained earnings
Treasury shares
Total shareholders' equity
Accumulated other comprehensive income
Valuation difference on available-for-sale securities
Foreign currency translation adjustment
Total accumulated other comprehensive income
Share acquisition rights
Non-controlling interests
Total net assets
Total liabilities and net assets
-7-
As of September 30, 2026
1,645,206
6,000,000
1,720,323
4,689,427
1,220,777
868,226
10,682,712
26,826,673
1,872,342
9,300,000
1,899,282
4,627,278
1,151,295
835,558
10,365,998
30,051,756
36,831
2,220,536
673,727
2,931,095
29,757,769
39,224
2,373,348
626,631
3,039,203
33,090,960
1,601,210
2,700,918
41,480,089
(1,647,132)
44,135,085
1,640,639
3,013,159
42,217,740
(2,647,094)
44,224,443
962,813
3,264,265
4,227,079
274,537
3,849,764
52,486,466
82,244,235
656,432
3,160,121
3,816,553
281,686
4,245,545
52,568,229
85,659,189
(2) Semi-annual Consolidated Statements of Income and Comprehensive Income
Semi-annual Consolidated Statement of Income
(Thousands of yen)
Six months ended
September 30, 2025
Net sales
Cost of sales
Gross profit
Selling, general and administrative expenses
Operating profit
Non-operating income
Interest income
Interest on securities
Dividend income
Foreign exchange gains
Share of profit of entities accounted for using equity
method
Other
Total non-operating income
Non-operating expenses
Interest expenses
Other
Total non-operating expenses
Ordinary profit
Extraordinary income
Gain on sale of non-current assets
Gain on sale of investment securities
Subsidy income
Contribution received for construction
Total extraordinary income
Extraordinary losses
Loss on sale of non-current assets
Loss on retirement of non-current assets
commemorative shareholder benefit expenses
Other
Total extraordinary losses
Profit before income taxes
Income taxes - current
Income taxes - deferred
Total income taxes
Profit
Profit attributable to non-controlling interests
Profit attributable to owners of parent
-8-
Six months ended
September 30, 2026
34,400,541
27,054,953
7,345,587
3,089,331
4,256,256
37,467,434
29,509,840
7,957,593
3,288,274
4,669,319
37,287
157,203
4,080
198,613
53,190
168,990
5,027
198,442
44,600
45,412
27,543
469,328
18,056
489,119
14,388
27,798
42,187
4,683,397
50,381
49,824
100,206
5,058,232
3,000
10,616
-
-
13,616
-
13,068
22,427
10,000
45,496
1,662
11,928
-
-
13,590
4,683,423
1,810,502
(179,448)
1,631,054
3,052,368
390,349
2,662,019
2,136
101,157
207,170
28,977
339,441
4,764,286
1,823,433
128,300
1,951,734
2,812,552
453,349
2,359,202
Semi-annual Consolidated Statement of Comprehensive Income
(Thousands of yen)
Six months ended
September 30, 2025
Profit
Other comprehensive income
Valuation difference on available-for-sale securities
Foreign currency translation adjustment
Total other comprehensive income
Comprehensive income
Comprehensive income attributable to
Comprehensive income attributable to owners of
parent
Comprehensive income attributable to non-controlling
interests
-9-
Six months ended
September 30, 2026
3,052,368
2,812,552
7,436
99,666
107,102
3,159,470
(334,912)
(104,144)
(439,057)
2,373,495
2,758,833
1,948,677
400,637
424,817
(3) Semi-annual Consolidated Statement of Cash Flows
(Thousands of yen)
Six months ended
September 30, 2025
Cash flows from operating activities
Profit before income taxes
Depreciation
Amortization of goodwill
Increase (decrease) in allowance for doubtful accounts
Increase (decrease) in provision for bonuses
Increase (decrease) in Reserve for fulfillment of
guarantees
Interest and dividend income
Loss (gain) on sale of property, plant and equipment
and intangible assets
Interest expenses
Foreign exchange losses (gains)
Share of loss (profit) of entities accounted for using
equity method
Subsidy income
Contribution received for construction
Commemorative shareholder benefit expenses
Loss on tax purpose reduction entry of non-current
assets
Loss on retirement of non-current assets
Loss (gain) on sale of investment securities
Loss (gain) on valuation of investment securities
Decrease (increase) in trade receivables
Decrease (increase) in inventories
Decrease (increase) in advances paid
Decrease (increase) in other assets
Increase (decrease) in trade payables
Increase (decrease) in other liabilities
Increase (decrease) in accrued consumption taxes
Increase (decrease) in contract liabilities
Other, net
Subtotal
Income taxes paid
Interest and dividends received
Interest paid
Dividends received from entities accounted for using
equity method
Net cash provided by (used in) operating activities
Six months ended
September 30, 2026
4,683,423
1,183,107
26,543
271,914
435,487
4,764,286
1,310,678
46,288
393,183
△68,834
48,946
△32,667
△198,571
△227,208
△1,337
2,136
14,388
△87,844
50,381
△129,728
△44,600
△45,412
-
-
-
△22,427
△10,000
207,170
-
28,977
16,013
△10,616
381
122,315
16,762
△365,063
△306,635
89,787
484,006
92,919
389,539
39,222
6,900,091
△1,538,139
228,328
△16,937
105,216
△13,068
3,922
△934,968
152,656
△290,872
△183,319
239,061
300,951
△37,204
△59,875
△162,549
5,386,774
△1,763,695
222,777
△54,852
-
31,948
5,573,343
3,822,951
(Thousands of yen)
Six months ended
September 30, 2025
Cash flows from investing activities
Purchase of property, plant and equipment and
intangible assets
Proceeds from sale of property, plant and equipment
and intangible assets
Payments for asset retirement obligations
Purchase of investment securities
Proceeds from sale of investment securities
Proceeds from redemption of investment securities
Loan advances
Proceeds from collection of loans receivable
Payments of guarantee deposits
Proceeds from refund of guarantee deposits
Subsidies received
Payments into time deposits
Proceeds from withdrawal of time deposits
Other, net
Net cash provided by (used in) investing activities
Cash flows from financing activities
Net increase (decrease) in short-term borrowings
Repayments of long-term borrowings
Proceeds from sale of shares of subsidiaries not
resulting in change in scope of consolidation
Purchase of treasury shares
Purchase of treasury shares of subsidiaries
Dividends paid
Dividends paid to non-controlling interests
Repayments of lease liabilities
Net cash provided by (used in) financing activities
Effect of exchange rate change on cash and cash
equivalents
Net increase (decrease) in cash and cash equivalents
Cash and cash equivalents at beginning of period
Cash and cash equivalents at end of period
Six months ended
September 30, 2026
△3,565,597
△3,484,018
3,212
2,443
-
△1,542,220
27,583
1,301,910
△4,906
8,434
△37,027
14,850
100
△5,633
5,195
△1,425
△3,795,524
△7,831
△1,136,969
22,072
489,030
△6,640
8,422
△47,899
13,644
32,427
△5,672
5,359
△1,425
△4,117,056
4,000,000
△62,500
3,300,000
-
-
569,257
△471,904
△25,166
△1,520,177
△127,254
△36,997
1,755,999
△999,962
-
△1,620,928
△199,922
△43,320
1,005,123
△1,123
△80,648
3,532,694
23,396,986
26,929,681
630,370
28,061,445
28,691,816
(4) Notes to Semi-annual Consolidated Financial Statements
(Note on Segment Information, etc.)
[Segment Information]
Information on Sales and Profit or Loss Amounts by Reporting Segment
For the six months ended September 30, 2025 (from April 1, 2025 to September 30, 2025)
Reportable segments
Japan
America and
Europe
Asia and
Oceania
Reportable
segments
(Thousands of yen)
Per semi-annual
Reconciling
consolidated
items
financial
statements
Sales
Revenues from external
customers
31,963,754
1,576,209
860,577
34,400,541
-
34,400,541
Transactions with other
segments
555,075
400,215
542,983
1,498,274
(1,498,274)
-
Net sales
32,518,829
1,976,425
1,403,560
35,898,815
(1,498,274)
34,400,541
4,422,711
331,830
291,823
5,046,365
(790,108)
4,256,256
Operating profit (loss)
Differences Between Total Amounts of Reporting Segments and Amounts Recorded in Consolidated Financial
Statements, and Main Contents of Such Differences (Matters Related to Adjustment of Differences)
(Thousands of yen)
Profit
Amount
Reportable segments
5,046,365
Elimination of inter-segment
transactions
-325,315
Company-wide expenses
-464,793
Operating Income in the Quarterly
Consolidated Statement of Income
4,256,256
(Note) Corporate expenses are expenses related to the administrative department.
Information on Impairment Losses Related to Fixed Assets or Goodwill by Reporting Segment
(Significant Impairment Losses Related to Fixed Assets)
No applicable items.
(Significant Changes in the Amount of Goodwill)
No applicable items.
Information on Sales and Profit or Loss Amounts by Reporting Segment
For the six months ended September 30, 2026 (from April 1, 2026 to September 30, 2026)
Reportable segments
Japan
America and
Europe
Asia and
Oceania
Reportable
segments
(Thousands of yen)
Per semi-annual
Reconciling
consolidated
items
financial
statements
Sales
Revenues from external
customers
35,000,582
1,702,892
763,959
37,467,434
-
37,467,434
Transactions with other
segments
1,153,793
499,145
688,285
2,341,224
(2,341,224)
-
Net sales
36,154,375
2,202,037
1,452,245
39,808,659
(2,341,224)
37,467,434
5,412,218
428,872
269,181
6,110,272
(1,440,952)
4,669,319
Operating profit (loss)
Differences Between Total Amounts of Reporting Segments and Amounts Recorded in Consolidated Financial
Statements, and Main Contents of Such Differences (Matters Related to Adjustment of Differences)
(Thousands of yen)
Profit
Amount
Reportable segments
6,110,272
Elimination of inter-segment
-966,339
transactions
-474,613
Company-wide expenses
Operating Income in the Quarterly
4,669,319
Consolidated Statement of Income
(Note) Corporate expenses are expenses related to the administrative department.
Information on Impairment Losses Related to Fixed Assets or Goodwill by Reporting Segment
(Significant Impairment Losses Related to Fixed Assets)
No applicable items.
(Significant Changes in the Amount of Goodwill)
No applicable items.
(Notes on Significant Changes in the Amount of Shareholders’ Equity)
Pursuant to the resolution of the Board of Directors passed on July 28, 2026, the Company acquired 1,395,400 shares of treasury
stock for 999,962 thousand yen during the interim consolidated accounting period. As a result of this acquisition of treasury
stock, treasury stock at the end of the interim consolidated accounting period amounted to (2,647,094) thousand yen.
(Note on Going Concern Assumptions)
No applicable items



 授賞式の様子