1 経営・人材・組織からみたAX推進のすべて 「生成AIの一般利用拡大から3年余り。最新のAIモデルは東京大学・京都大学の入試で受験生の最高 点を上回り*、すべての科類・学科で「首席」水準に達しました。かつて「高校生レベル」と言われたAIは、いまや…
1
経営・人材・組織からみたAX推進のすべて
「生成AIの一般利用拡大から3年余り。最新のAIモデルは東京大学・京都大学の入試で受験生の最高
点を上回り*、すべての科類・学科で「首席」水準に達しました。かつて「高校生レベル」と言われたAIは、いまや
「東大首席卒の社員」が一人ひとりの隣に座っているのに等しい存在になっています。しかし、それだけの戦力を前
にして、企業の業務の手順、人の配置、評価の物差しは、AIが入る前のままになっていないでしょうか。AIが指
数関数的に賢くなり続ける一方、人と組織の変化はそれに追いついていない。この「AI能力>人・組織能力」の
ギャップこそが、いまAX(AIによる企業変革)の最大の壁であり、同時に最大の経営機会です。
本レポートでは、この問いに3つの角度から迫ります。まず、年間250件を超えるAI/DX プロジェクトを通じて
数多くの企業の現場を見てきたエクサウィザーズ常務取締役COO の大植が、AXを推進する経営者に必要な
姿勢を語ります。変革の成否を分けるのは、技術ではなくトップの本気度。「失敗」よりも怖いのは、成功も失敗も
ないまま止まっていること。経営者への処方箋を率直に示します。
続いて、グループ会社であるExa Enterprise AI取締役の半田が、企業のAX成熟度に関する独自調査の
結果を読み解きます。「社員のスキルが足りない」と見える現場の実態をたどると、業務の手順と評価の物差しが
AI導入前のまま放置されているという、会社側の宿題に行き着きます。AIに業務を渡した後の人の配置、評価
制度、そして人材供給という人事と経営に残された宿題を、自社の試行錯誤も包み隠さず綴ります。
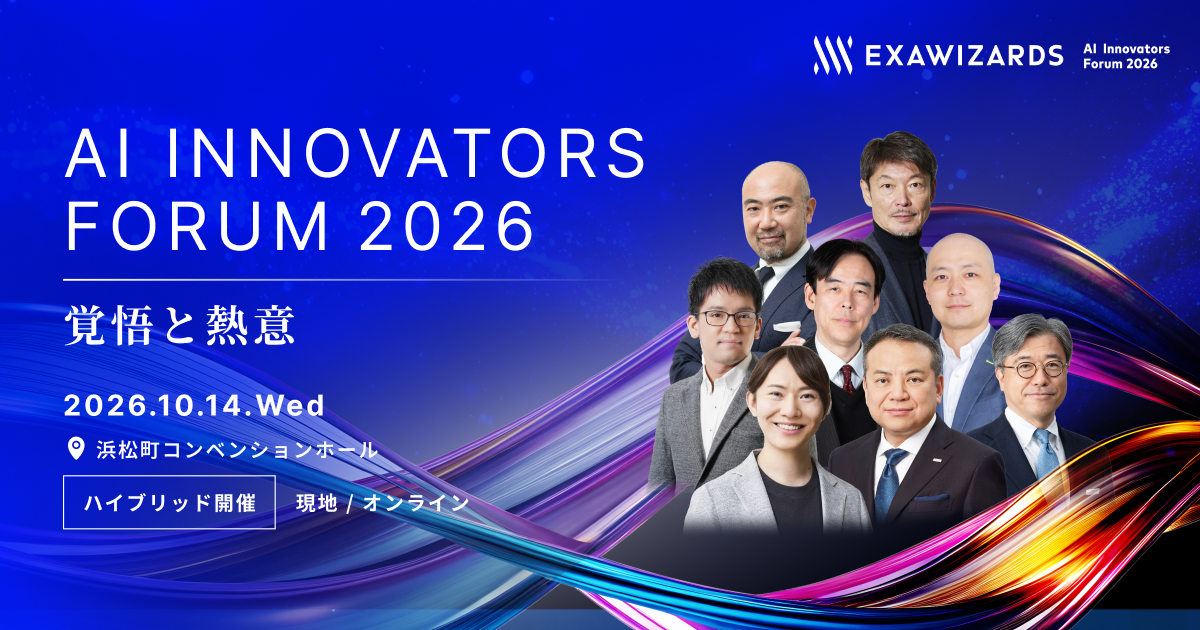
さらに本号は、 AI Innovators Forum 2026の開催に合わせた特別号として、2026年に新たに設立した4
社を含むエクサウィザーズグループ10 社・60 のプロダクト/サービスの全体像を一挙にご紹介します。貴社がいま
抱える課題と向き合うための入り口として、ぜひ本レポートをご活用ください。
*詳細はTopic1 参照
目次
Topic 1 経営はAI とどう向き合うか ・・・ p.0 2
Topic 2 AI エージェント時代、「人と組織」はどう変わるか ・・・ p.0 8
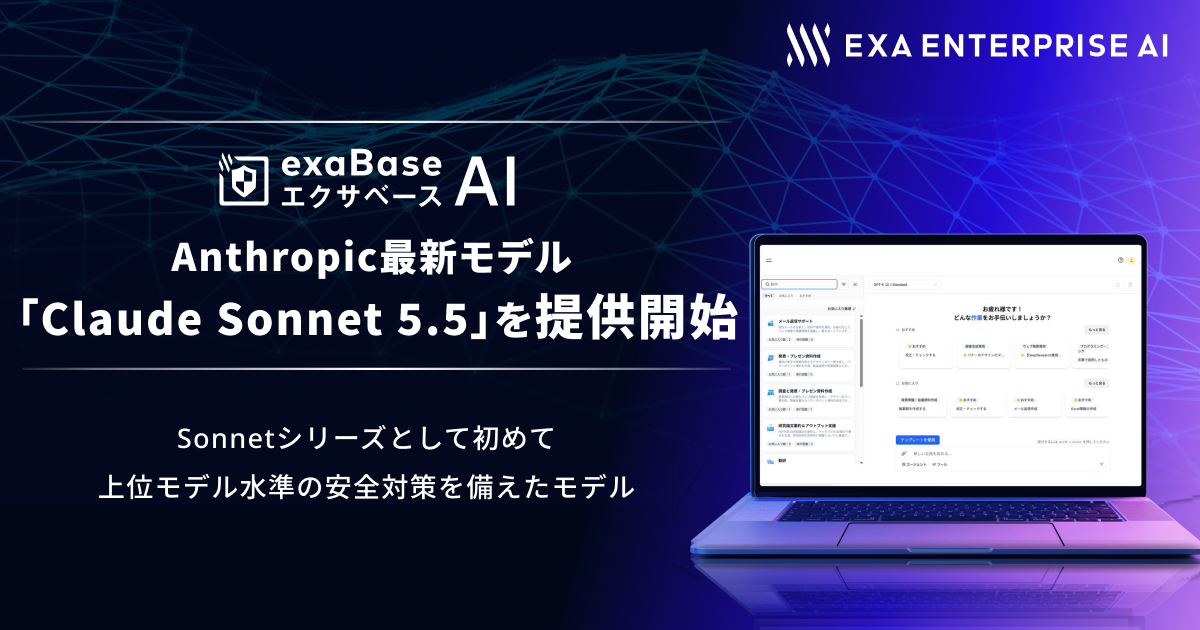
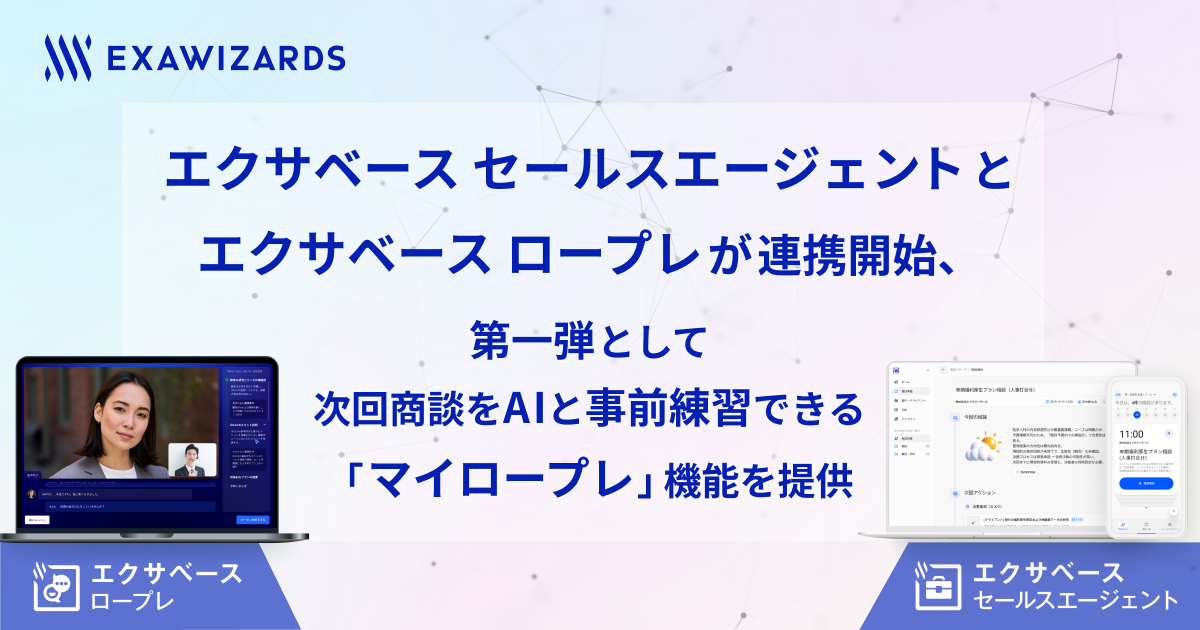
SPECIAL エクサウィザーズグループプロダクト/サービス紹介
全体像 ・・・ p.1 4
株式会社エクサウィザーズ ・・・ p.1 6
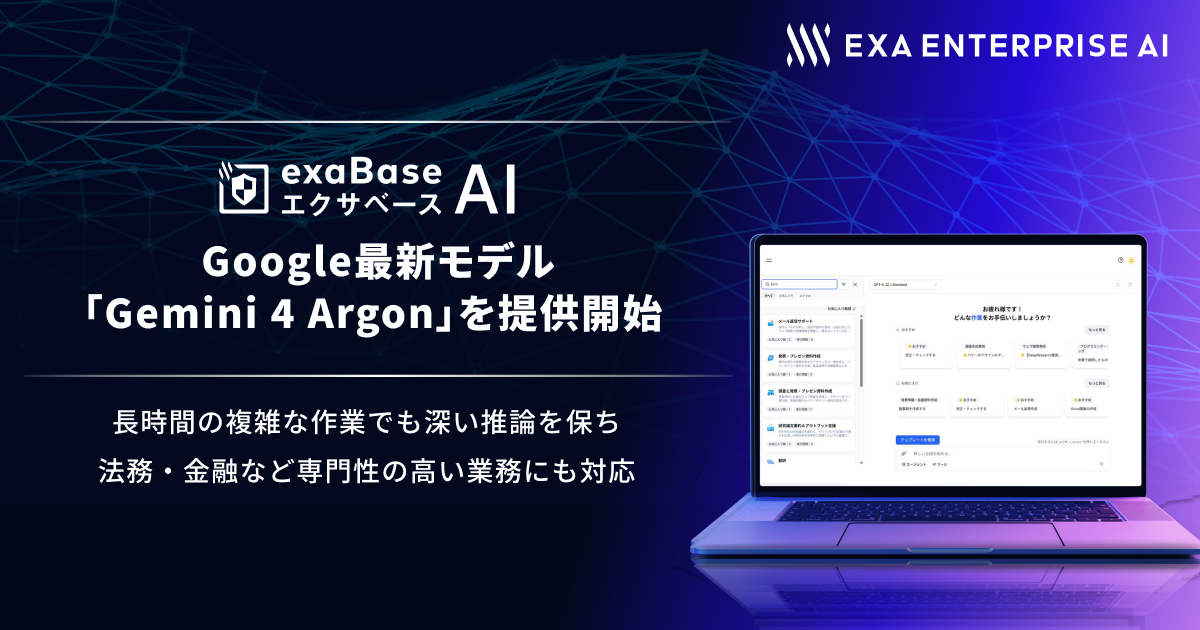
株式会社Exa Enterprise AI ・・・ p.17
株式会社ExaMD ・・・ p.1 9
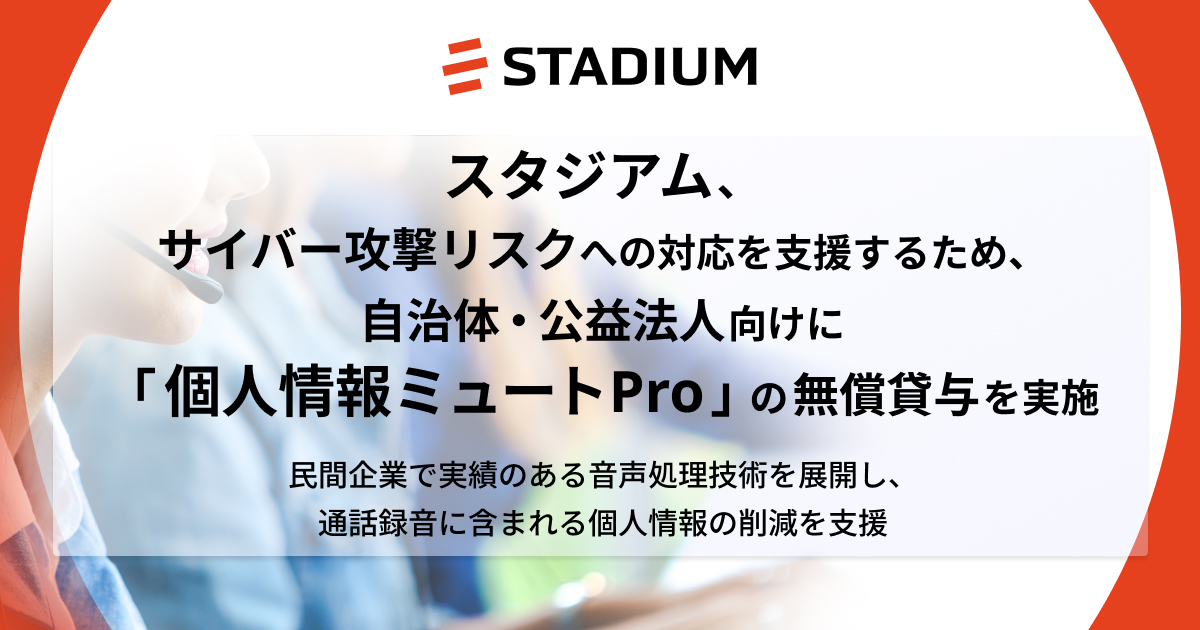
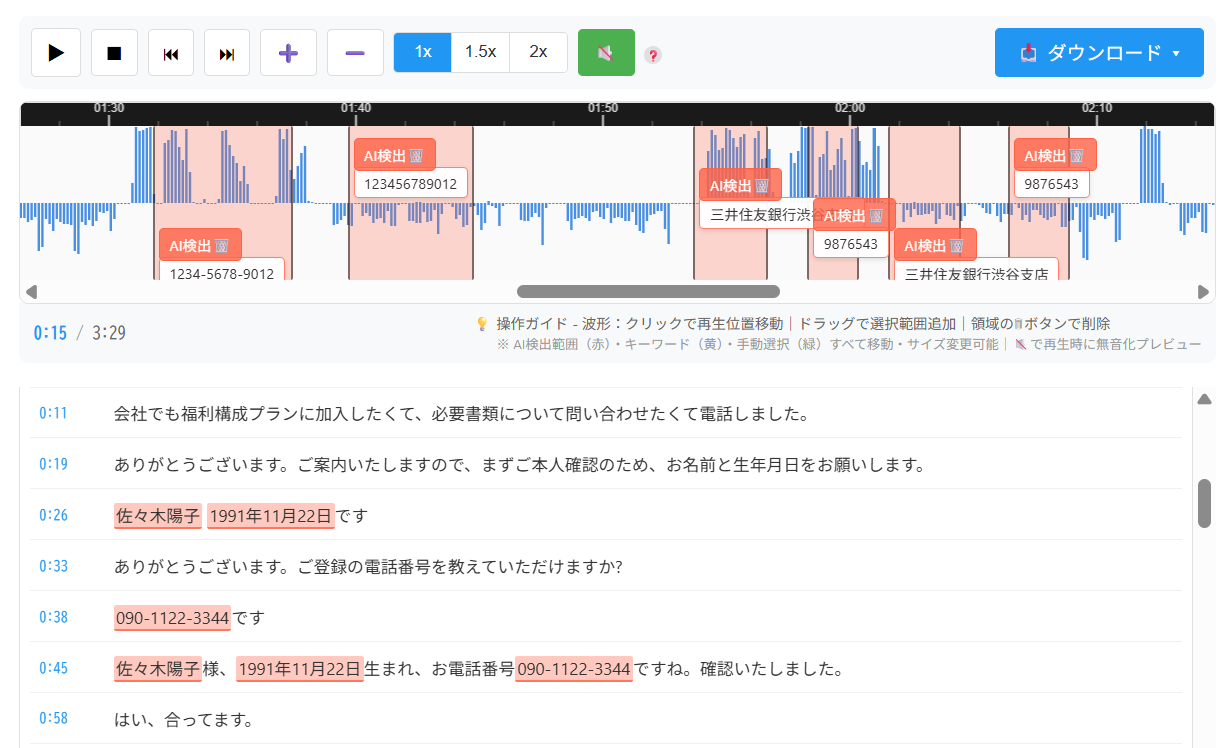
株式会社スタジアム ・・・ p.21
エクスウェア株式会社・・・ p.22
株式会社Exa Frontier Edge・・・ p.23
株式会社Exa Interaction Design Lab・・・ p.24
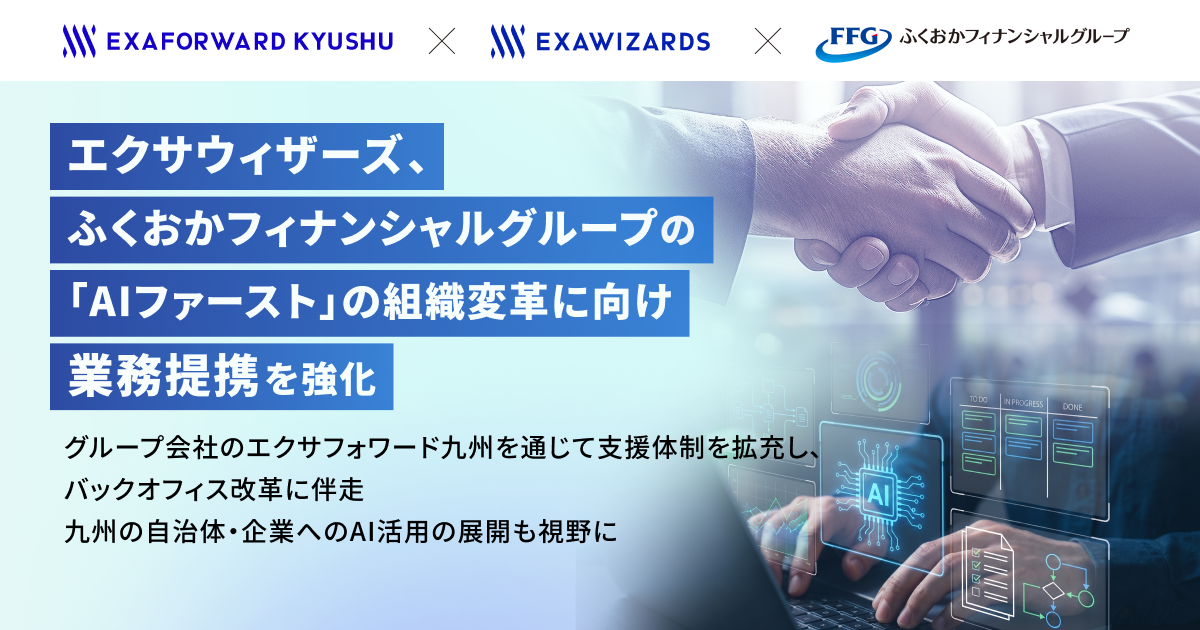
株式会社エクサフォワード九州・・・ p.25
株式会社ExaSecurity・・・ p.26
株式会社株式会社ele&company・・・ p.27
付録 ・・・ p.28
2
経営はAI とどう向き合うか
〜AXを推進するリーダーに、いま必要なこと〜
生成 AIの一般利用拡大から3年余り。生成AIは「質問に答えるチャットツール」から、業務そのものを担う
「AIエージェント」へと進化しました。この変化を、経営はどう受け止めるべきなのでしょうか。年間250件を超える
AI/DX プロジェクトを通じて数多くの企業の現場を見てきたエクサウィザーズ常務取締役COO の大植択真氏
は、「AIの進化に、人と組織が追いついていない。このギャップを埋めることこそ、AI時代の競争戦略の中核だ」と
語ります。
(聞き手: エクサウィザーズレポート編集部)
//////////////////////////////////////////////////////////////////////////////////////////////////////////////////////////////
株式会社エクサウィザーズ常務取締役COO 兼
株式会社Exa Enterprise AI 代表取締役
大植 択真( おおうえ たくま)
京都大学工学部卒業。京都大学工学研究科修了(AI・データサイエンス)。2013年、ボストン
コンサルティンググループに入社。事業成⻑戦略、事業変革、DX推進、新規事業立ち上げなどの
多数のプロジェクトに従事した後に2018年、エクサウィザーズ入社。2020年6 月に取締役、
2023年6 月に常務取締役就任。同年10月より Exa Enterprise AIの代表取締役も務める。兵庫県ChatGPT等生成AI活用
検討プロジェクトチーム アドバイザー。一般社団法人 人間中心のAIコンソーシアム発起人。著書に「Web3 時代のAI戦略」(日経
BP、2022年) 、「次世代AI戦略2025 激変する 20分野 変革シナリオ128」(日経BP、2021年) 、「エネルギー業界を変革する
AX戦略」(電気書院、2025年)、「金融AX戦略― 経営変革を導くAI実装の事例と実務」(金融財政事情研究会、2026
年)。
//////////////////////////////////////////////////////////////////////////////////////////////////////////////////////////////
AIは3年で「高校生」から「東大首席」になった
――生成AIからAIエージェントの時代になり、お客様の課題や要望に変化はありましたか。
一番大きな変化は、AIへの期待値が「業務代行」に変わったことです。これまでの生成AIはチャットで質問に答え
を返すのが基本でした。それが今は社内データやツールにつながり分析をしたり、資料作成したり、入力も出力も様々
なシステムやデータに繋がり始めた。調査や分析、意思決定のための資料作成といったホワイトカラーの仕事を、AIが
実際に担えるようになってきたのです。
――精度の面ではどうでしょうか。
感覚的には、2023年ごろの生成 AIは「高校生」くらいの感覚でした。それがいまや、東大や京大の入試で受験生
の最高点を上回る水準です。2026年の調査では、米オープンAIの最新モデルが東大・京大のすべての科類・学
科で総合得点の「首席」となり、最難関の東大理科3類でも受験生の最高点を上回ったと報告されています
(※1)。
社内の文脈やデータを与えないと社内に適した答えは返ってこないという課題はありますが、例えるなら東大首席卒の
入社5年目社員が社員一人一人の横にいると言っても過言ではありません。たった 3年でここまで来た。この技術進
化の速度をまず認識する必要があります。
3
――経営課題としてのAIの位置づけは、この1〜2 年でどう変わりましたか。
「現場を楽にする効率化ツール」から「抜本的な業務変革のパートナー」に大きく期待値が高まっています。これまで
人間だけでやってきた仕事の半分程度はAIができるようになっていると思います。当社でも、決算説明動画を自動
生成できる仕組み
(※2)に切り替えたことで、丸1日かかっていた動画編集が約3分になりました。象徴的なのはエン
ジニアリングの現場です。以前は企画に数カ月+プロトタイプに数カ月と、サービスリリースまで約半年から1年程度か
かっていたものが、いまは数日あれば動くもので議論ができる。「10%の現場を楽にする効率化」ではなく「半減」の世
界が、コーディングやリサーチといった領域で現実に起き始めています 。
図1︓ AIエージェントと働く未来、AIエージェントの職場導入に関する大規模調査の結果をまとめた論文
出典 Stanford University 「Future of Work with AI Agents」 (https://futureofwork.saltlab.stanford.edu/) を基に作成
最大の課題は、AI と人の「広がり続けるギャップ」
――こ こからは「AX(AIによる企業変革)」について伺います。AIを単に使うのではなく、業務フローや意思決定、事業モデル
のすべてにAIを組み込み、AIを前提に企業を再設計する考え方です。AXを推進する経営者は、いまどんな課題を抱えてい
ると見ていますか。
AIは指数関数的に賢くなり続けているのに、人と組織の変化はそれに追いついていない。この「AI能力>人・組織能
力」のギャップが時間とともに拡大し続けていることが、最大の課題です。当社のようなAI利活用をサービスとして提供
する会社にとっては大きなビジネスチャンスであるとも解釈しています。賢いAIをどう会社の中で活躍させるか、組織にど
う組み込むか。このギャップをどう縮めるかが、AI時代の経営者が考えるべき競争戦略上の最大の焦点だと思っていま
す。
4
図2 ︓「AI能力> 人・組織能力」のギャップが急拡大
出典︓Scott Brinker, "Martec's Law" (chiefmartec.com) を基に作成
――そのギャップに、経営者はどう向き合うべきでしょうか。
例えるなら、ぐちゃぐちゃな業務やデータの中に東大首席の新人を放り込んでも活躍できないのと同じことかと思っていま
す。また、社内の過去のコンテキストを知らされないままだと適切な活躍ができないでしょう。そう考えると、 AIを社内で
活躍させるための土壌づくりが経営の仕事となります。一例として、① 人材育成・教育(AIへの理解を深めるための
研修や人材育成)、② データやコンテキスト整備(会社の過去の文脈やデータを、AI が解釈できる形に整理整
頓)、③ セキュリティ・ガバナンス(AIが動く上でのルールやガイドライン、セキュリティ・ガバナンスの整備)など経営が
取り組むべき重要な課題となります。
特に、直近は人材育成や教育の重要性がどんどん高まっているように感じます。AIが賢くなるほど、うまく使える人と使
えない人の差は開いていきます。電卓は誰が使っても大体同じですが、コンピューターは使い手によって差がつく。AIはそ
の比ではありません。
分かれ目は「トップの本気度」
――AXが進む企業と進まない企業の違いはどこにあるのでしょうか。
大前提として、本当の意味で AXが進んでいる会社は日本にはまだほとんどありません。当社自身も道半ばと捉えて
います。
AXを進めるうえでの必要条件は、経営トップの本気度です。経営トップが、AIの可能性に興奮し、AXビジョンを提
示することが重要です。また、経営がAIで何ができ、何ができないのかを肌感覚で理解していない会社は、絶対に変
革が進みません。
組織変革の分野に、BCG(ボストン コンサルティング グループ) が開発したRWA理論というフレームワークがあります
(※3)。変革が成功するには、Ready(変革の必要性の認識)、Willing(変革への意志・欲求)、 Able( 変革を起こす
能力)の3つが必要だという考え方です。AXに関して日本でも経営者のReadyはだいぶ揃ってきました。「AIは必
要だよね」と口ではみんな言う。しかし本当の意味でのWillingとAbleを備えたリーダーは、まだ多くない。ここがいま
のネックです。
5
――なぜWillingが生まれにくいのでしょうか。
米国では、AI活用で業務を置き換えれば人員削減、つまり人件費の削減として経営インパクトに直結するので、経
営者にとって分かりやすい構図です。しかし日本では、正社員の解雇は法律で厳しく制限されており
(※4)、同じやり方
ができません。AIで業務を効率化しても、人件費はかかり続ける。だから日本型AXでは、人材の「再教育」と「再配
置」が重要になるのです。AIに任せられる業務を任せた後、人にしか価値を出せない業務を会社の中で特定し、そこ
に人を再教育して回す。これが経営インパクトを生む本当の道筋です。この将来像がイメージできたとき、初めて「本気
でやりたい」が生まれるのだと思います。
――企業規模による違いはありますか。
企業規模ではなく、経営のオーナーシップです。そういう意味では、オーナー企業の方が進みやすい側面はあるかもし
れません。トップが「会社をこう変える」と決めれば一気に進むからです 。
「失敗」より怖いのは、成功も失敗もないこと
――AXに失敗している、止まっている企業の共通点は。
そもそも踏み出していない会社が大半です。私は、企業には3つの段階があると思っています。一番いいのは成功し
ている会社。二番目にいいのは失敗している会社。一番良くないのは、成功も失敗もない会社です。失敗は挑戦し
た結果ですから、良いことなんです。日本企業の多くは、残念ながら成功も失敗もない、チャレンジしていない企業が
多い。失敗よりも、止まっている方が問題です。
図3 ︓生成AIを実際に触り続ける人と、検討・情報収集だけの人の差
――途中でやめてしまう企業も多いように感じます。
精度が低かった頃の AIを試して「こんなものか」とやめてしまったケースは多いでしょう。しかし技術は毎年、非連続に
進化しています。過去の印象で離脱したままでは、いまのAIの実力に気づけません。
6
――うまく進んでいる企業のリーダーに共通する「成功の秘訣」は。
しつこく、やり続けることです。やり続けたらうまくいく道筋が見つかる。成功と失敗は二者択一ではなく、少しずつ小さ
な実験を繰り返し、反省(≠失敗)しながら続けた先に必ず成功がある。AXで会社は良くなる、生産性が上がり、
従業員もハッピーになる――そういうビジョンを描いた上で、予算と体制を張ってやり続ける企業が成功します。
経営者への処方箋は「まず、自分で触る」
――これからAXに踏み出す経営層の読者に、最初の一歩として何を勧めますか。
まず経営者自身が触ることです。セミナーで分かったのと、実際に触って何ができて何ができないかを肌感覚で持つの
とでは、決定的な差があります。私自身経営者向けの研修をよく行いますが、実は経営者の半分程度は自分では触
っていない。ニュースで見ているだけです。しかし生成AIは難しくない。自分のマネジメント業務に照らして使えるシーン
は山ほどあります。私自身、メンバーの日報をAIに分析させて経営課題を抽出したり、意思決定のための情報整理
に日常的に使っています。経営の仕事は「決める、変革する」ことであり、意思決定の材料づくりにこそ生成AIは効き
ます。
(編集部注) 経営トップが若手から AIを学ぶ動きは、すでに社会の潮流になりつつあります。2026年8月28日に
は、高市早苗総理が総理大臣官邸で、チームみらいの安野貴博党首らによるAI活用方法の説明「 AI家庭教師」
を受けたことが話題を呼びました
(※5)。
当社でも先日、「第1回エクサベース AI 経営者研修」を開催しました。従業員数万人規模の小売・外食チェーン
の社⻑など、経営者15名ほどをお招きし、当社の若手の生成AI活用担当が一人ひとりに付いて、その場で操作を
お教えする形式です。社内で生成 AIに詳しい人がいても、部下だと気軽に「使い方を教えて」とは聞きにくくても、外
の場なら聞ける。特に、AI の領域は若手の方がうまく使っている人が多く、若手が先生になる領域です。皆さん大変
満足されて、成功体験を社内に持ち帰っていただけました。経営者向け研修のあり方も変わってきています。講話を
聞くのではなく、とにかく自分で触って、実際に何ができるかを自分の目で見る。情報を集めるだけの人は伸びません。
触り続ける人だけが、成果を出し続けます。まずは、今日、ご自身の手で触ってみてください。
(構成・文: エクサウィザーズレポート編集部)
<お知らせ>
【優先案内登録 | エクサウィザーズ】 エクサベース AI 経営者研修
· 内容︓マンツーマンで生成AI活用を体験サポートする経営者向け実践プログラム
·
詳細・お申し込み︓https://forms.cloud.microsoft/r/ncNth1JxV7
7
※1. 日本経済新聞(2026年4月 27日)「 OpenAI とGoogle 、東大理 3『首席合格』数学は満点 得意科目に違い」。ライフプロンプト・河合塾との共同調
査。同記事では、今後は自組織のデータや業務とAIをどう連携させるかという人間側の「設計力」が問われるとも指摘されている。
https://www.nikkei.com/article/DGXZQOUC307OD0Q6A330C2000000/
※2. 【連載】株主総会を「壮大なPoC」の場に(前編) 〜1人 IR×AIエクセレンス推進室が挑んだ業務の自動化〜
https://exawizards.com/column/ai-case/aidrivendays_0010/
※3. BCG "Agile at Scale" ほか。Ready(変革の必要性の認識)、 Willing( 変革への意志・欲求)、 Able( 変革を起こす能力 )
https://www.bcg.com/capabilities/digital-technology-data/agile-at-scale
※4. 労働契約法第16条(解雇権濫用法理)。客観的に合理的な理由を欠き、社会通念上相当と認められない解雇は無効とされる
※5. 首相官邸 高市総理へのAI家庭教師
https://www.kantei.go.jp/jp/105/actions/202608/28ai.html
8
AI エージェント時代、「人と組織」はどう変わるか
〜「人を育てる」の次に来る、配置と評価と供給の話〜
本誌2026年02月号
*1
では、はたらくAI&DX研究所の石原が「 AI人的資本経営」を提言しました。効
率化を組織として徹底し、そこで生まれた余力を人が足りない場所へ振り向けるという考え方です。同じ号では、
人事の平木が自社データから AX人材の条件を読み解きました。あれから半年。その提言を「実装する側」として
日々お客様と向き合っているのが、HR Tech事業を率いるExa Enterprise AI取締役の半田頼敬です。提
言の先に、実際には何が詰まっているのか。本稿では、現場の実態を包み隠さずお届けします。
//////////////////////////////////////////////////////////////////////////////////////////////////////////////////////////////
株式会社Exa Enterprise AI 取締役
半田 頼敬
慶應義塾大学卒業後、2010年ベネッセコーポレーションに入社。マーケティングを担当後、2015
年リクルートホールディングスに入社し、リクルートの中途採用や、Indeed, Inc. の国内外のTech
系人材の新卒・中途採用プロジェクトに従事。2018年にエクサウィザーズへ一人目の専任人事とし
て参画し、組織拡大をリード。2021年のIPOを経て、 2022年4 月より執行役員に就任。現在
はHR Tech事業を率い、AX人材の可視化・育成・配置に関するサービスの事業責任者を務める
ほか、大企業の DX推進を目的としたTech組織のコンサルティングも担当している。LinkedInが
選出する「日本で最も勢いのあるスタートアップランキング」 TOP STARTUPS で2019年・2020年と2年連続 1位、 2019年には
LinkedIn Japanが選出する人事部門で MVPを受賞。自身でも生成AIを積極的に活用し、そこで得た知見やノウハウを活かして、人
事向けプロダクトの企画や情報発信を行っている。
//////////////////////////////////////////////////////////////////////////////////////////////////////////////////////////////
相談は「何を学ぶか」から「次に何をするか」へ
以前お客様からいただく相談は、「全社で生成AIを安全に使えるようにしたい」「まず何から学ばせればよいか」
が中心でした。現在は「研修は一巡した。それで、次に何をすればいいのか」に変わっています。そして同じ企業の
中でも、担当者の業務そのものが組み替わった部署と、便利な道具が一つ増えただけの部署とで、手応えがはっ
きり分かれます。その差は、研修の受講率でも社員の意欲でもないところから生まれているように見えます。
6割が土台づくりの途中――仕組みに人が追いついていない
エクサウィザーズグループでは、企業のAX*成熟度を「人」と「仕組み」の二軸で測る調査を行っています。2026
年6月には、従業員 500名以上の企業でAI推進に関わる管理職・経営層1,472名に回答いただきまし
た。人の側を4つ、仕組みの側を6つ、合わせて10 の観点でスコアを取り、人と仕組みをそれぞれ 3段階で評
価して、9つの段階のどこに立っているかを判定するものです。
*AX︓AI Transformation(AI変革)、AIによる企業変革
9
図1 ︓人と仕組みの10観点
結果として、最も多かったのは、人も仕組みもこれからという「AX基礎整備段階」で、回答者の60.2%でした。
6割がまだ土台づくりの途中にいます。人と仕組みの両方が一定の水準に達している層は合わせて 24.8%で、4
人に1人。両方が最も高い「AX高度化段階」に限ると 3.8%、約25人に1人となりました。
図2︓ AX成熟度の分布
【調査概要】※本誌初出
エクサウィザーズ「AI推進実態調査」(2026年6 月実施)。従業員500名以上の企業で AI推進に関与する管理職・経営層1,472名が回答。人
の成熟度4観点・仕組みの成熟度6観点の計10観点を 0〜3 で採点し、AXロードマップビルダーの基準で9段階に分類。四捨五入のため、合計は
100%になりません。
10
図2でいちばんお伝えしたいのは、人と仕組みの釣り合いが取れていない層の向きです。仕組みが人より先に進
んでいる層(図2左上側ピンク枠②④⑧)は合わせて18.2%。逆に、人が仕組みより先に進んでいる層(図
2右下側⻘色枠③⑥⑦)は6.6%でした。3倍近い開きがあります。AI活用が進まない理由を伺うと「社員の
スキルが足りない」という答えが最も多く返ってきますが、分布もその実感を示しています。
しかし、研修を足せばよい、とはならないと考えています。仕組み側を観点ごとに見ていくと、スコアがとりわけ低かっ
たのが「業務プロセスの変革(S2 業務構造)」と「人事評価への反映(S6評価制度)」でした。生成AIは
導入したけれど業務の手順と評価の物差しは、AIが入る前のまま放置されている。ツールに対して、人を動かす
仕組みが変わっていない。「人が追いついていない」と相談をいただく組織の多くは、ここで止まっていると見ていま
す。
この診断の枠組みは、「 AXロードマップビルダー
*2
」としてお客様にもお使いいただける形にしました。10 の観点の
スコアから、自社が9つの段階のどこに立っているかを判定し、どの観点で詰まっているかを特定する。そのうえで、
打ち手の順番を決めていきます。ここから先にお話しすることは、この調査と、実際の診断の現場で見えてきたこと
がもとになっています。
工程は数週間で渡せる。人は半年動かせない
先ほど触れた「業務プロセスの変革」。これが現場では実際にどこで詰まってしまうのか、その中身をお話しします。
AIエージェントに渡せるのは、職務ではなく工程です。「採用担当」という職務は渡せませんが、「応募書類を要
件に照らして一次評価する」という工程は渡せます。多くの企業で、まず業務を工程に分解する段階までは進めら
れています。
問題はその次に起きます。工程を AIに渡すのは、早ければ数週間で終わります。ところが、その工程を担ってい
た人を別の仕事に移すには、半年から一年かかります。異動先の部署に受け入れの準備が必要であり、等級と給
与の整合を取る必要があり、何より現場の上司が手放したがりません。人を送り出すと自分の部署の数字が下が
るかもしれないのですから、これは当然の反応だと思っています。
つまり、工程は動かせるのに人は動かせない。この時間差を放っておくと、空いたはずの時間は静かに元の業務へ
吸い込まれていきます。会議の準備がもう少し丁寧になり、資料の体裁がもう少し整い、確認の往復が少しだけ
増える。誰も手を抜いていないのに、余力は消えます。そして半年後の振り返りで、「効率化はしたはずなのに、新
しいことは何も始まっていない」という結論だけが残ります。
この時間差は、効率化が終わってから埋めようとすると、なかなか追いつかないように見えます。人が足りない業務
はどこにあるのか、そこに移ってもらうには何を身につけてもらう必要があるのか、移った人の処遇はどう扱うのか。AI
の導入と並行してこの問いに手をつけている企業ほど、生まれた余力を次の投資に回せている印象があります。石
原が 2026年02月号
*1
で書いた「余剰を別のところに振り向ける」は、実装の段階に入ると人事制度の宿題と
して降りてくる、というのが現場から見た実感です。
11
評価の物差しは「学んだか」から「変えたか」へ
10 の観点のうち、業務プロセスの変革と並んでスコアが低かったのが「人事評価への反映」でした。人事にとって
いちばん重い宿題が、そのまま数字に出た格好です。
多くの企業で、AIリテラシーの研修はすでに実施されました。受講率や資格の保有者数をKPI として追いかけ
ている方も多いと思います。ただ、これらはあくまで入口の指標です。
いま私たちがお客様と議論しているのは、その一歩先の物差しです。その人が担当業務のどの工程をAIに渡し
たのか。そこで空いた時間を何に振り替えたのか。渡した結果、成果物の品質は保てているのか。学びを測るので
はなく、変化を測る。ここに指標を置き換えない限り、AI活用は熱心な社員の個人的な工夫のまま終わってしま
います。
ここで必ず持ち上がるのが、本誌2026年07月号
*3
でExa Enterprise AI取締役の前川が触れていた論
点です。 AIに任せて出した成果を、その人の手柄と認めてよいのか。私は、認めるべきだと考えています。もっと言
えば、認めると人事が態度で示さない限り、社員はAIを使ったことを隠します。隠された活用は横に広がりませ
ん。評価の物差しが旧来のままなら、現場はすぐにそれを察知して振る舞いを変えます。
私たち自身も、この宿題の途中にいます。社員に定期的にAIスキルの診断を受けてもらい、業務変革の実績
を人事のデータとして持つ。そのうえで認定や処遇とどう接続するかを設計している最中です。ただ正直なところ、ど
こまで処遇に紐づけるべきかは社内でも議論が分かれており、きれいな答えは出ていません。
分かれ目は「基準」――個人の突破を組織の資産に変えられるか
本誌2026年07月号
*3
で、営業部門の中川が、自らの商談録画やフィードバックのログを教師データにして
自分の分身AIをチームに配った取り組みを紹介しました。効果もはっきり出た実践です。
一方で、組織の立場から見たときに考えるのは、その先のことです。あの仕組みが機能するのは、中川という一人
12
の人間が、売れる理屈を体感として持っていたからです。つまり、基準はまだ個人に宿っています。その個人が異動
したり、市場のルールが変わったりしたときに、誰がその基準を書き換えるのか。個人の突破を組織の資産に変える
工程が、まだどの会社にも残っています。
診断の現場でよく挙がる詰まりに、「管理職が関与せず現場任せ」というものがあります。この話とも地続きだと思
っています。AIエージェントが増えるほど、管理職の一日の中身は入れ替わります。進捗を確認して差し戻す仕事
は減り、何を渡すかを決める仕事と、上がってきたものを検収する仕事が増えます。このとき、品質の合否を自分の
言葉で言える管理職は何体でもエージェントを動かせますが、「なんとなく違う」としか言えない管理職は検収で詰
まり、結局すべてを自分で作り直すことになります。AIが管理職を減らすという話をよく聞きますが、私が現場で見
ているのはもう少し手前の変化で、基準を持つ管理職と持たない管理職の差が、静かに、しかし決定的に開いて
いくという現象です。
ですから、これからの管理職研修に足すべきものは、部下との面談技術だけではないと考えています。業務を工
程に分解する力と、成果物の合否を言い切る力。この二つを組織として育て、個人の頭の中ではなくデータと型の
かたちで残していく。地味ですが、ここが分かれ目だと思っています。
人材育成そのものが、人材不足で詰まっている
ここまで人材育成の話をしてきましたので、私たち自身が抱えている制約についても書いておきます。
企業の変革に伴走する研修は、突き詰めると講師の人数で上限が決まります。現場に立てる人が一人増えな
ければ、提供できる回数は一回も増えません。 AX(AIによる企業変革)への需要はこの一年で明らかに伸びま
したが、それを担える人材の供給が、世の中全体で追いついていません。人材育成という事業そのものが、人材不
足で詰まっている。これが私たちの置かれている状況です。
この制約を正面から解きにいくために、 2026年8月、テクノプロ・ホールディングスとの戦略的提携を公表
*4
しま
した。エンジニアの方々にAXのスキルを身につけていただき、企業の変革現場に立てる人材を増やしていく取り組
みです。自社で抱え込んで少しずつ増やすのではなく、同じ課題意識を持つ企業と組んで、供給量そのものを増
やす方向に舵を切りました。
これは私たちの事業判断の話ですが、人事に携わる皆さまにとっても他人事ではないと思っています。AXを担え
る人材は、社外の市場にもほとんどいません。採用すればよい、という前提が成り立たない領域です。社内で育て
る仕組みと、外から継続的に人を迎え入れる仕組みを両方持っておく。そこまで設計しておかないと、計画が人数
で止まります。私たちが自分の事業でぶつかった壁は、二、三年後にはお客様の変革計画でも同じように立ち上が
ってくるのではないかと見ています。
人事と経営に残る「三つの問い」
最後に、社内の議論でもお客様との会話でも繰り返し立ち返っている問いを、三つ書いておきます。どれも私たち
がまだ答えを出しきれていないものです。
一つ目。人が動かない原因は、本当に人の側にあるのか。調査では、仕組みが先に進み人が追いついていない
13
層が、その逆の 3倍近くいました。しかし、業務の手順と評価が変わっていなければ、研修を追加しても状況は動
きません。私たち自身も、社内で「現場がまだ使いこなせていない」と話していた時期に、実は権限やデータの整備
が止まっていた、ということがありました。
二つ目。そこで空いた時間の行き先を、誰が決めるのか。現場の裁量に委ねれば、ほぼ確実に元の業務へ戻り
ます。行き先を決めるのは、事業部門でも情報システム部門でもなく、人と組織を設計する立場にある人事と経
営の仕事だと考えています。
三つ目。 AIを使って成果を出した人を、いまの評価制度はきちんと評価できるのか。評価できないのであれば、
研修をどれだけ重ねても、活用は水面下に潜ったままになります。
AIエージェントは、人の仕事を奪うというより、仕事の輪郭を引き直してきます。その線をどこに引き、引き直した
後の人をどこへ配置し、どう報いるのか。ここに答えを持っている会社を、私はまだ見たことがありません。私たちも例
外ではなく、自社を実験台にしながら手探りを続けています。同じ問いを抱えておられる皆さまと、現場でご一緒で
きればうれしく思います。
*1. エクサウィザーズレポート2026年02月号
https://contents.xj-storage.jp/xcontents/AS71284/1858bbb3/70c6/4939/80cb/1f4e75525d49/20260224141609429s.pdf
*2. AXロードマップビルダー、 AX推進支援パッケージ︓エクサウィザーズグループ、生成 AI活用の”活用停滞”を解消する「AX推進支援パッケージ」を
提供開始(2026.09.25)
https://exawizards.com/archives/32963/
*3. エクサウィザーズレポート2026年07月号
https://contents.xj-storage.jp/xcontents/AS71284/2a70aa96/6243/4e7f/8773/71b9a2632b6e/20260619175923283s.pdf
*4. エクサウィザーズ、国内最大規模の技術系人材サービスを提供するテクノプロ・ホールディングスとAX人材育成のための戦略的提携にむけた合意書
を締結
https://exawizards.com/archives/32512/
14
エクサウィザーズグループプロダクト/サービス紹介
z
15
16
17
18
19
20
21
22
23
24
25
26
27
28
29
30
1
31
32
33
34
36
37
35
38
いつも「 エクサウィザーズレポート」をお読みいただき、
ありがとうございます。
より役立つ誌面をお届けするため、読者のみなさまのご意見をお聞かせください。
PC/スマートフォンから匿名で約3分でご回答いただけます。
いただいた声は、次号以降の企画に反映してまいります。
PC のかたはこちらから
※ご回答内容は誌面づくりの参考にのみ使用し、それ以外の目的には使用いたしません。


 X @ExaWizards
 YouTube ExaWizards Inc.
 Facebook ExaWizards Inc.
 note HR note
 LinkedIn ExaWizards Inc.
 Zenn Tech Blog