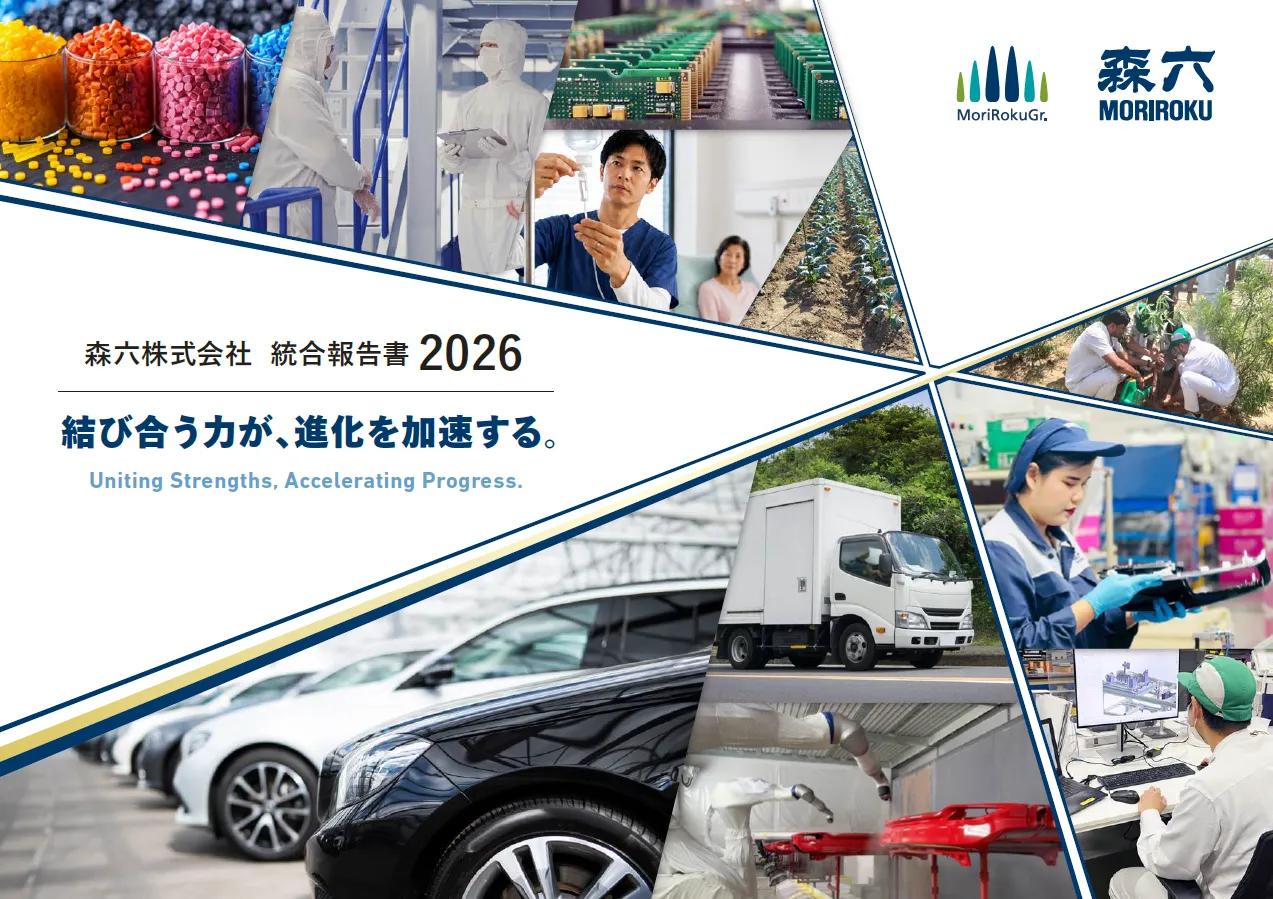
森六株式会社統合報告書 2026 結び合う力が、進化を加速する。 Uniting Strengths, Accelerating Progress. INDEX 未来は、ある日突然はじまるものではありません。 360年を超える歴史の中で培ってきた技術や知見、人と人とのつながり。 Introduction…
森六株式会社統合報告書
2026
結び合う力が、進化を加速する。
Uniting Strengths, Accelerating Progress.
INDEX
未来は、ある日突然はじまるものではありません。
360年を超える歴史の中で培ってきた技術や知見、人と人とのつながり。
Introduction
イントロダクション
その一つひとつが結び合うことで、新たな価値が生まれ、
次の可能性へとつながっていきます。
結び合う力が、進化を加速する。
第14次中期経営計画の初年度となった2025年度、私たちは一社化という節目を迎えました。
それは、森六グループ各社が磨いてきた、ものづくりの技と化学の力を結び合わせ、
360年にわたり蓄積してきた技術・知見を紡ぎ、
より大きな価値を生み出していくための起点でした。
2035年長期ビジョンへの歩みを
そして2年目となる2026年度。
着実に進めていきます。
From Vision to
Progress
中長期戦略
M&Aによって新たな仲間を迎え、
Driving Strategic
森六グループの強みはさらに多彩なものへと進化しました。
事業戦略
Progress
▶
統合報告書2026のテーマと注目ポイント
▶
森六グループの理念
▶
事業紹介
▶
価値創造プロセス
▶
360年以上続く森六「価値創造の進化」
▶
目次・編集方針
▶
社長メッセージ
▶
中期経営計画
▶
財務戦略
▶
財務・非財務ハイライト
▶
特集
▶
ケミカル事業
Progress toward
経営の意思と現場の挑戦をつなぎ、ものづくりの技と化学の力をさらに磨き上げます。
2035年長期ビジョンの実現に向けて、
樹脂加工製品事業
▶
結び合う力は、進化を加速する力です。
こうして広がった共創の土台の上で、
事業戦略
▶
異なる技術や経験、価値観が結び合うことで、これまでにないシナジーを生み出します。
� ゾナック モビリティ事業の
レ
M&Aによる成長戦略
Sustainability
価値創造の
基盤
▶
DX戦略
▶
法務・知財戦略
▶
森六グループのサステナビリティ経営
▶
取り組み報告
森六は着実に、そして力強く歩みを進めていきます。
▶
環境
▶
社会
▶
特集
� 員座談会
社
現場から描くNEW VALUE
ガバナンス
▶
1
統合報告書
2026の
注目ポイント
2
3
4
5
社長メッセージ
第14次中期経営計画
財務目標の見直し
レゾナック モビリティ事業の
M&Aによる成長戦略
社員座談会
「現場から描くNEW VALUE」
ガバナンスの
実効性向上
P.09
P.14
P.18
P.46
P.54
Data
▶
主要財務データ
▶
主要非財務データ
▶
企業情報
IRサイト
業績ハイライト
ESGデータブック
MORIROKU 01 INTEGRATED REPORT 2026
有価証券報告書
森六グループの理念
江戸時代創業
東証プライム上場
363年
■ 経営理念
証券コード:4249
INDEX
Introduction
イントロダクション
森六グループは、未来を先取りする創造力と優れた技術で
高い価値を共創し、時を越えて、グローバル社会に貢献します
■ 行動指針
グループ売上高
メーカー&商社
1,338 億円
2つの事業
- 法令遵守
国内外の法令を遵守し、公平で公正な企業活動を通じ、
信頼される企業グループをめざします
Progress
事業戦略
一緒に働く仲間の人格や個性を尊重します
優れた製品を提供します
- 社会貢献
地球環境に配慮し、地域に根ざした企業活動を通し、
中長期戦略
Driving Strategic
社員一人ひとりが自主性、創造性を発揮し、
お客様に満足いただける、価値ある情報、質の高いサービス、
Progress
(2026年3月期)
- 人間尊重
- 顧客満足
From Vision to
数字でわかる 森六
「良き企業市民」として社会に貢献します
グローバル展開
従業員(連結)
3,873名
■ 大切にする価値観
時代を先取りし、継続的に企業価値向上に努めます
70%
チームワークを尊重し、理想を追求する企業グループをめざします
森六グループの理念
▶
事業紹介
▶
価値創造プロセス
▶
360年以上続く森六「価値創造の進化」
▶
目次・編集方針
▶
社長メッセージ
▶
中期経営計画
▶
財務戦略
▶
財務・非財務ハイライト
▶
特集
▶
約
(2026年3月期)
樹脂加工製品事業
ケミカル事業
▶
Progress toward
Sustainability
価値創造の
基盤
▶
DX戦略
▶
法務・知財戦略
▶
森六グループのサステナビリティ経営
▶
取り組み報告
▶
環境
▶
社会
▶
特集
� 員座談会
社
現場から描くNEW VALUE
ガバナンス
▶
Data
▶
主要財務データ
▶
主要非財務データ
▶
企業情報
IRサイト
業績ハイライト
ESGデータブック
MORIROKU 02 INTEGRATED REPORT 2026
� ゾナック モビリティ事業の
レ
M&Aによる成長戦略
事業戦略
▶
(2026年3月末時点)
海外売上高比率
- 同心協力
統合報告書2026のテーマと注目ポイント
▶
14 か国 60 拠点
(2026年3月末時点)
- 進取の精神
▶
有価証券報告書
INDEX
事業紹介
Introduction
「ものづくりの技」と「化学の力」で、社会に価値あるソリューションを提供します。
イントロダクション
アグリ・フード
ファインケミカル
From Vision to
生活材料
Progress
コーティング
外装部品
企画から量産まで
一貫体制の
内装部品
Driving Strategic
素材と技術で
ものづくりを支える
モビリティ
モビリティ
部品メーカー
中長期戦略
Progress
事業戦略
化学品商社
Progress toward
Sustainability
強み
強み
MORIROKU 03 INTEGRATED REPORT 2026
価値創造プロセス
▶
360年以上続く森六「価値創造の進化」
▶
目次・編集方針
▶
社長メッセージ
▶
中期経営計画
▶
財務戦略
▶
財務・非財務ハイライト
▶
特集
▶
� ゾナック モビリティ事業の�
レ
M&Aによる成長戦略
事業戦略
樹脂加工製品事業
▶
DX戦略
▶
法務・知財戦略
▶
森六グループのサステナビリティ経営
▶
取り組み報告
▶
環境
▶
社会
▶
特集
� 員座談会�
社
現場から描くNEW VALUE
ガバナンス
▶
ケミカル 事業
顧客共創型アジャイル開発を推進
● グローバル拠点の連携により、
最適な開発・量産体制を構築
▶
メディカル
機能素材
Data
● 大手自動車メーカーとの強固なネットワークを基盤に、
事業紹介
ケミカル事業
ヘルスケア
● 市場動向を先取りし、
価値ある提案を創出
森六グループの理念
▶
▶
価値創造の
基盤
樹脂加工製品事業
統合報告書2026のテーマと注目ポイント
▶
▶
電機・電子
各種モビリティ
▶
▶
主要財務データ
▶
主要非財務データ
▶
企業情報
●「化学品商社の知見」
と「ものづくり」でグローバルに事業を展開
IRサイト
● 樹脂加工製品事業とのシナジー
業績ハイライト
● グループ会社との連携による高機能素材の開発・提供
ESGデータブック
有価証券報告書
INDEX
価値創造プロセス
経営理念
インプット
事業活動
財務資本
自己資本
661億円
3,873名
外部環境認識︵ リ ス ク・機会 の 分析 ︶
知的資本
開発拠点数
38億円
開発
製造拠点数
設備投資額
9か国
25拠点
75億円
社会関係資本
グローバル
ネットワーク
● 意匠・加飾部品
量産
● 環境対応樹脂部品
品質
保証
連携・
シナジー創出
技術融合・共同開発・供給最適化 トレー
ディング
開発
ケミカル事業
コンパ
ウンド
ファインケミカル
● 安全性向上絶縁材料
● 高付加価値化学品
※2026年3月期
(時点情報は2026年3月末現在)
ライフサイエンス
量産
● 医療用高機能フィルム
試作
・
試験
● 包装用機能性フィルム
● 農業支援材
(バイオスティミュラント)
コーポレート・ガバナンスの強化
第14次中期経営計画
2026年3月期〜2028年3月期
2028年3月期中期計画目標
戦略❶
戦略❷
戦略❸
戦略❹
70億円
ROE
6.5%
DOE
3%以上
2035年長期ビジョン
CREATE
THE NEW VALUE
Our Mission
主力事業の更なる利益追求
将来の製品化に向けた開発の推進
事業シナジーによる新たな価値創造
事業基盤の更なる強化
From Vision to
Progress
中長期戦略
ものづくりの技と化学の力で、
非財務アウトカム
社会に価値ある
ソリューションを提供する
● 顧客満足度の向上
持続可能な
モビリティ
社会
● 顧客の競争力向上
従業員
Driving Strategic
Progress
事業戦略
● スキルアップ
エコロジカルな
循環型社会
株主・投資家
健やかで
豊かな暮らし
パートナー
● 共創による新価値の創出
統合報告書2026のテーマと注目ポイント
▶
森六グループの理念
▶
事業紹介
▶
価値創造プロセス
▶
360年以上続く森六「価値創造の進化」
▶
目次・編集方針
▶
社長メッセージ
▶
中期経営計画
▶
財務戦略
▶
財務・非財務ハイライト
▶
特集
▶
● CO 2排出量の削減
売上高
ROE
Progress toward
価値創造の
基盤
DX戦略
▶
法務・知財戦略
▶
森六グループのサステナビリティ経営
▶
取り組み報告
▶
環境
▶
社会
▶
特集
ガバナンス
Data
▶
主要財務データ
▶
主要非財務データ
▶
企業情報
IRサイト
業績ハイライト
資本の再投入
MORIROKU 04 INTEGRATED REPORT 2026
� 員座談会�
社
現場から描くNEW VALUE
▶
2,200 億円以上
10% 以上
樹脂加工製品事業
ケミカル事業
経済価値の創出
収益性向上を通じた
持続的な企業価値向上
事業戦略
▶
● 公正・公平な取引
地球環境
� ゾナック モビリティ事業の�
レ
M&Aによる成長戦略
▶
Sustainability
● 安定的な株主還元
▶
▶
● エンゲージメント向上
(成長機会の提供)
サステナビリティ重要課題(マテリアリティ)
34.6%
財務アウトカム
営業利益
イントロダクション
インパクト創出
顧客
● 環境対応導電材料
14か国
60拠点
自然資本
再生可能
エネルギー
使用率
調達
アウトカム
● 高機能外装部品
樹脂加工製品事業
※一過性・期ズレ要因調整後
製造資本
モビリティ
試作
・
試験
設計
4か国
5拠点
研究開発費
アウトプット(製品・サービス)
ステークホル ダーとの共創を通じて、
付加価値の高いソリューションを提供
人的資本
連結従業員
Introduction
森六グループは、未来を先取りする創造力と優れた技術で高い価値を共創し、時を越えて、グローバル社会に貢献します。
ESGデータブック
有価証券報告書
INDEX
360年以上続く
森六
社会への提供価値
Introduction
イントロダクション
地域産業を
支える
日本の産業近代化を
支える
「価値創造の進化」森六の事業変遷
森六の歴史は、
藍と肥料を扱う商いから始
新素材で
暮らしを豊かにする
From Vision to
化学品商社
藍玉商
樹脂事業
まりました。
1663年の創業以来、
「進取の精
Progress
中長期戦略
神」のもと、社会やお客様のニーズの変化
を捉えながら、
新たな事業領域へ挑戦して
Driving Strategic
きました。
事業戦略
Progress
藍や肥料の供給による地域産業の支援か
▶
統合報告書2026のテーマと注目ポイント
▶
森六グループの理念
▶
事業紹介
▶
価値創造プロセス
▶
360年以上続く森六「価値創造の進化」
▶
目次・編集方針
▶
社長メッセージ
▶
中期経営計画
▶
財務戦略
▶
財務・非財務ハイライト
▶
特集
▶
ケミカル事業
の進化、そしてグローバルな供給体制の構
360年以上にわたり受け継がれてきた「進
1663年
1905年
1949
創業
化学品を提供
新素材で戦後復興と
豊かな暮らしを支援
取の精神」
と
「変革のDNA」
を礎に、
森六は
ものづくりの技術と化学の知見を結び合わ
せ、次世代モビリティや環境対応など新た
な社会課題の解決に挑戦し続けます。
樹脂加工製品事業
▶
貢献、樹脂技術による暮らしやモビリティ
化させながら成長を続けてきました。
事業戦略
▶
ら始まり、
化学品を通じた産業近代化への
築へ。
森六は時代ごとに提供する価値を進
� ゾナック モビリティ事業の�
レ
M&Aによる成長戦略
藍染めの原料である「藍玉」と、その生
海外の先進技術や化学品に着目し、染
業の発展に貢献しました。お客様の生業
業発展に不可欠な化学品を供給するこ
産を支える肥料「干鰯」を扱い、地域産
を支え、人々の豊かな暮らしを育むこと
が、森六の価値創造の原点です。
年
Sustainability
価値創造の
基盤
DX戦略
▶
法務・知財戦略
▶
森六グループのサステナビリティ経営
▶
取り組み報告
ニールなどの合成樹脂分野へ進出しまし
とで、近代化とものづくりの発展に貢献
興と豊かな暮らしの実現に貢献しました。
た。新しい素材の普及を通じて、戦後復
▶
環境
▶
社会
▶
特集
▶
Data
▶
主要財務データ
▶
主要非財務データ
▶
企業情報
IRサイト
業績ハイライト
ESGデータブック
MORIROKU 05 INTEGRATED REPORT 2026
� 員座談会�
社
現場から描くNEW VALUE
ガバナンス
石油化学産業の発展を見据え、塩化ビ
料や工業薬品の輸入を開始。日本の産
しました。
Progress toward
▶
有価証券報告書
INDEX
社会への提供価値
モビリティの進化に
貢献する
Introduction
イントロダクション
世界中のお客様へ
安定して届ける
社会の公器として
産業の持続的な発展を支える
森六の事業変遷
メーカー
グローバルカンパニー
パブリックカンパニー
次世代モビリティと
持続可能な社会を創る
技術・事業領域の融合による
価値創造
From Vision to
Progress
中長期戦略
Driving Strategic
Progress
事業戦略
▶
統合報告書2026のテーマと注目ポイント
▶
森六グループの理念
▶
事業紹介
▶
価値創造プロセス
▶
360年以上続く森六「価値創造の進化」
▶
目次・編集方針
▶
社長メッセージ
▶
中期経営計画
▶
財務戦略
▶
財務・非財務ハイライト
▶
特集
▶
� ゾナック モビリティ事業の�
レ
M&Aによる成長戦略
事業戦略
▶
樹脂加工製品事業
ケミカル事業
▶
1958年
1986年
2017年
軽量化技術で
モビリティに貢献
グローバルで
価値を届ける体制に
信頼される
経営基盤を確立
一社化とM&Aで
未来の価値創造を加速
本田技研工業(ホンダ)
「 スーパーカブ」
お客様のグローバル展開に合わせて海
2008年に持株会社体制へ移行し、事業
一社化に加え、森六ReNovaおよび森六
までを一貫して提供するメーカーへ進化
し、世界各地で安定した素材の供給と高
東証一部上場、2022年のプライム市場
わったことで、森六グループの技術・人
の樹脂化開発に参画し、素材から製品
しました。自由なデザインや量産化・軽
量化を実現し、より便利で身近なモビリ
ティの普及と発展に貢献しました。
外へ進出。メーカーと商社の機能を活か
品質な製品・サービスを提供する体制を
築きました。
ごとの専門性と機動力を強化。2017年の
移行を経て、経営の透明性とガバナンス
を高めてきました。持続的な企業価値向
上を目指すパブリックカンパニーとして
の経営基盤を築きました。
2025
年〜現在
モビリティプロダクツがグループに加
Progress toward
Sustainability
価値創造の
基盤
造を加速していきます。
法務・知財戦略
▶
森六グループのサステナビリティ経営
▶
取り組み報告
▶
環境
▶
社会
▶
特集
Data
▶
主要財務データ
▶
主要非財務データ
▶
企業情報
IRサイト
業績ハイライト
ESGデータブック
MORIROKU 06 INTEGRATED REPORT 2026
� 員座談会�
社
現場から描くNEW VALUE
ガバナンス
学の融合を深化させ、多様な強みを結び
世代モビリティの発展に向けた価値創
DX戦略
▶
▶
材・知見が結集しました。ものづくりと化
合わせることで、環境課題への対応や次
▶
有価証券報告書
INDEX の使用方法
目次・編集方針
目次
統合報告書2026のテーマと注目ポイント
森六グループの理念
事業紹介
価値創造プロセス
360年以上続く森六「価値創造の進化」
目次・編集方針
編集方針
01
02
03
04
05
07
社長メッセージ
中期経営計画
財務戦略
財務・非財務ハイライト
特集 レゾナック モビリティ事業の
M&Aによる成長戦略
価値創造の
基盤
森六グループのサステナビリティ経営
08
特集
09
14
15
16
ガバナンス
クホルダーの皆さまに向けて分かりやすくお伝えすることを目指しています。2035年長
P.00
財務・非財務情報を統合して説明することを意識し、編集しています。制作にあたって
本レポートの該当ページへ移動します。
期ビジョンの実現に向けた価値創造プロセスと、
その実現を支える戦略や取り組みを、
34
は、IFRS財団が提唱する
「国際統合報告フレームワーク」
と、経済産業省による
「価値協
創ガイダンス 2.0」
を参照しています。
企業情報
37
40
46
50
62
63
64
17
関連するWebコンテンツへ移動します。
森六株式会社および関連会社
■ 報告対象期間
2026年3月期(2025年4月1日〜2026年3月31日)
※2026年4月以降の活動内容も一部含む。
■ 将来の見通しに関する注意事項
本資料は、
正確性を期して慎重に作成しておりますが、
完全性を保証するものではありません。
本資料中の情報によって生じた障害や損害については、当社は一切責任を負いません。
本資料中の将来予測に関する記述は、本資料作成時点で入手可能な情報に基づき当社が
判断したものであり、潜在的なリスクや不確実性が含まれております。そのため、事業環境
の変化等のさまざまな要因により、実際の業績は言及または記述されている将来見通しと
は異なる結果となることがあることをご承知おきください。
なお、最新の業績予想については、当社ホームページに掲載している
「業績ハイライト」にて
随時更新していますので、あわせてご参照ください。
■ 森六グループ 情報開示体系
財務情報
(経済価値に関する情報)
データ・取り組み
ケミカル事業
DX戦略
法務・知財戦略
非財務情報
(社会価値に関する情報)
考え方・戦略
考え方・戦略
投資家情報
18
データ・取り組み
サステナビリティ
統合報告書 2026
事業戦略
樹脂加工製品事業
https://www......
35
Data
主要非財務データ
コンテンツへのアクセスが容易にできるよう、各ページにナビゲー
ションボタンを設けています。
■ 報告対象組織
社員座談会
現場から描くNEW VALUE
主要財務データ
■ レポート内の関連コンテンツへの移動や、当社のさまざまなWeb
「統合報告書2026」
では、森六グループの短・中・長期の価値創造ストーリーを、
ステー
取り組み報告
社会
Driving Strategic Progress
事業戦略
Progress toward Sustainability
環境
From Vision to Progress
中長期戦略
■ このPDFにはインタラクティブ機能を実装しています。
気候変動関連開示
21
27
32
33
有価証券報告書
決算短信、
財務諸表など
決算説明会
資料
コーポレート・
ガバナンス報告書
IRサイト
業績ハイライト
ESGデータブック
MORIROKU 07 INTEGRATED REPORT 2026
有価証券報告書
INDEX
From Vision to Progress
中長期戦略
社長メッセージ
中期経営計画
財務戦略
財務・非財務ハイライト
09
14
15
16
Introduction
イントロダクション
2035年への事業成長ロードマップ
2026年5月、
「2035年長期ビジョン」の数値目標として、売上高2,200億円以上・ROE10%以上を新たに設定しました。
モビリティの未来を支える技術力と
「ものづくり×商社」の強みを礎に、戦略的M&Aによる技術基盤の強化と事業領域
の拡張を加速し、2035年に向けて稼ぐ力を高めていきます。
最新情報:業績ハイライト
From Vision to
Progress
中長期戦略
https://www.moriroku.co.jp/ir/financial̲information/highlight/index.html
Driving Strategic
2035年長期ビジョンの
実現に向けたKey Points
営業利益
70 億円
営業利益
60 億円
ROE
6.5%
ROE
営業利益
46 億円
地域・顧客ごとの強みを
武器にしたグローバル拠点での
新規ビジネスの獲得
1
他
顧客
主力
顧客
2025年
内装
5
国内
新たな地域への進出
7
7
3
他
顧客
現在(2026年)
内装
5
3
5
国内
7
3
2035年長期ビジョン
5
5
CREATE
THE NEW VALUE
4
海外
5
5
2035年
事業紹介
▶
価値創造プロセス
▶
360年以上続く森六「価値創造の進化」
▶
目次・編集方針
▶
社長メッセージ
▶
中期経営計画
▶
財務戦略
▶
財務・非財務ハイライト
▶
特集
▶
価値創造の
基盤
DX戦略
法務・知財戦略
▶
森六グループのサステナビリティ経営
▶
取り組み報告
実績
計画
目標
2035年
目標
▶
環境
▶
社会
▶
特集
ガバナンス
Data
▶
主要財務データ
▶
主要非財務データ
▶
企業情報
IRサイト
業績ハイライト
ESGデータブック
MORIROKU 08 INTEGRATED REPORT 2026
� 員座談会�
社
現場から描くNEW VALUE
▶
成長事業拡大と新事業への進出
2026年3月期 2027年3月期 2028年3月期
樹脂加工製品事業
▶
売上高
ROE
事業戦略
▶
2,200 億円以上
10 %以上
� ゾナック モビリティ事業の�
レ
M&Aによる成長戦略
ケミカル事業
ものづくりの技と化学の力で、
社会に価値ある
ソリューションを提供する
外装
森六グループの理念
▶
▶
Sustainability
6
統合報告書2026のテーマと注目ポイント
▶
▶
Our Mission
2035年
国内
事業戦略
Progress toward
海外
現在(2026年)
他
顧客
2035年
外装
現在(2026年)
海外
2025年
主力
顧客
内装
5
外装
2025年
ROE
3.8%
9
主力
顧客
大型モジュール
製品技術の進化
5%
Progress
トランスフォーメーション
イメージ
▶
有価証券報告書
社長メッセージ
INDEX
Top Message
変化を力に変え、
強みを結び合わせながら、
Introduction
イントロダクション
From Vision to
Progress
中長期戦略
Driving Strategic
Progress
事業戦略
新たなステージで
統合報告書2026のテーマと注目ポイント
▶
森六グループの理念
▶
事業紹介
▶
価値創造プロセス
▶
360年以上続く森六「価値創造の進化」
▶
目次・編集方針
▶
社長メッセージ
▶
中期経営計画
▶
財務戦略
▶
財務・非財務ハイライト
▶
特集
▶
樹脂加工製品事業
ケミカル事業
▶
Progress toward
Sustainability
価値創造の
基盤
▶
DX戦略
▶
法務・知財戦略
▶
森六グループのサステナビリティ経営
▶
取り組み報告
黒瀨直樹
▶
環境
▶
社会
▶
特集
� 員座談会�
社
現場から描くNEW VALUE
ガバナンス
▶
Data
▶
主要財務データ
▶
主要非財務データ
▶
企業情報
IRサイト
業績ハイライト
ESGデータブック
MORIROKU 09 INTEGRATED REPORT 2026
� ゾナック モビリティ事業の�
レ
M&Aによる成長戦略
事業戦略
▶
持続的に成長していきます
森六株式会社
代表取締役社長最高経営責任者
▶
有価証券報告書
社長メッセージ
INDEX
とに、深く感謝しています。
このM&Aは顧客基盤の拡充に加え、技術・人材・事業領域の強化を通じて、
グ
2026年3月期の事業環境
ループ全体の成長をさらに前進させる重要な第一歩と位置づけています。
(
変化を直視し、2035年から逆算して変革を進める
P.18
特集 レゾナック モビ
Introduction
イントロダクション
リティ事業のM&Aによる成長戦略)
変化に柔軟に向き合い、
成長の力へと変えながら、
第14次中計を着実
この1年、
私が最も強く感じたのは、
自動車業界を取り巻く環境変化の大きさと、
そのスピードです。
当社
に推進していくことが、
2035年長期ビジョンの実現につながると確信しています。
の売上高の多くを占める樹脂加工製品事業も、
こうした変化の影響を大きく受けました。
これまで自動車
ではEV化が大きな潮流となっていましたが、
現在はEVやハイブリッド車、
エンジン車など、
多様な動力シス
構造改革の進展
テムが併存する方向へと変化しつつあります。
こうした中、主要なお客様においてもEV戦略の見直しが進
収益性向上へ。
描いた打ち手を、一つひとつ実行に移す
み、当社の事業環境も大きく変化しています。加えて、中国国内市場で勢いを増していた中国自動車メー
カーは、
2025年以降、
中国市場の成長鈍化を背景に海外展開を加速させており、
とりわけアジア地域では
日系自動車メーカーとの競争が一段と激しくなっています。
さらに、
第4四半期には中東情勢の緊迫化も重
M&Aに関わる費用を除けば、
第14次中計1年目の業績には一定の手応えを感じています。
樹脂加工製
From Vision to
Progress
中長期戦略
品事業では、
中国における減産の影響が想定以上に大きかったものの、
日本やカナダの拠点がその影響
なり、
サプライチェーンやエネルギーをめぐる先行きの不透明感が一段と高まりました。
こうした環境変化の中、
従来の延長線上にある取り組みにとどまることなく、
変化を成長の機会と捉え、
を補い、
目標に近い水準まで持ち直すことができました。一方、自動車関連ビジネスの比重が大きいケミ
自ら変革を進めていきます。
現在、
2年目を迎えた第14次中期経営計画
(以下、
第14次中計)
は、
2035年長
カル事業は、中国・東南アジアでの減産の影響を受け、
目標には届きませんでした。
しかし、連結ベースで
期ビジョンの実現に向けた重要なマイルストーンです。策定当初から一貫して掲げているのは、事業基盤
は、
これまで進めてきた収益構造改革の成果が少しずつ形になり始めています。
Driving Strategic
Progress
事業戦略
▶
統合報告書2026のテーマと注目ポイント
▶
森六グループの理念
▶
事業紹介
▶
価値創造プロセス
▶
360年以上続く森六「価値創造の進化」
▶
目次・編集方針
▶
社長メッセージ
▶
中期経営計画
▶
財務戦略
▶
財務・非財務ハイライト
▶
特集
▶
その一例が、2025年4月に実施したメキシコ工場の売却です。
メキシコ工場は、新たな顧客基盤の構築
を強化し、
グループ全体の事業成長と収益性の向上を実現することです。
� ゾナック モビリティ事業の�
レ
M&Aによる成長戦略
事業戦略
▶
樹脂加工製品事業
その実現に向け、樹脂加工製品事業では、お客様のポートフォリオを拡充するとともに、特定の主要顧
を目的に、成長戦略の一環として建設した拠点でした。
しかし、市場環境の厳しさが今後も続くことを見据
客への依存度を着実に低減し、
安定的な事業基盤の構築を進めてきました。
一方、
ケミカル事業において
え、
経営資源を成長分野へ振り向けるべきと判断しました。
売却にあたっては、
事業と従業員の雇用を引き
▶
も、新たな市場や事業機会の創出を通じて収益基盤の強化を図り、
グループ全体の成長につなげていく
継いでいただける会社を優先して選定し、
譲渡完了まで大きな混乱なく進めることができました。
DX戦略
▶
法務・知財戦略
▶
森六グループのサステナビリティ経営
▶
取り組み報告
こうした構造改革を進める一方で、将来の成長に向けた投資にも着実に取り組んでいます。例えばイン
ことを目指しています。
こうした取り組みをさらに加速させる一手として、2026年3月期には株式会社レゾナックのモビリティ事
業の一部を取得するM&Aを決定しました。
ご縁に恵まれ、
当社を事業の承継先として選んでいただいたこ
ド拠点における設備投資を進めており、2027年3月期末には外装塗装ラインが稼働する予定です。一方
で、事業環境は依然として厳しい状況にあります。主要顧客である本田技研工業株式会社(以下、
ホンダ)
ではEV戦略の見直しが進められており、中国・インド・東南アジア向けの商品開発についても、新たな方
■売上高
■営業利益・営業利益率
(億円)
2,000
1,500
1,944
※
1,288
1,420 1,456 1,461
1,338
60
1,000
40
500
0
20
22.3期
23.3期
24.3期
第13次
中計
25.3期
26.3期 27.3期
(期初計画)
第14次
中計
※2022年3月期より
「収益認識に関する会計基準」
を適用
最新情報:業績ハイライト
3.9
80
0
(%)
5.0
3.5
2.8
57
2.2
28
41
0.9
3.1
60
46
13
22.3期
23.3期
24.3期
第13次
中計
Progress toward
Sustainability
価値創造の
基盤
針が示されつつあります。
こうした事業環境の変化を踏まえ、
当社はホンダとの取り組みを一層深化させる
営業利益率
■ 営業利益
(億円)
100
ケミカル事業
▶
25.3期
26.3期 27.3期
(期初計画)
第14次
中計
https://www.moriroku.co.jp/ir/financial̲information/highlight/index.html
とともに、他の日系自動車メーカーやインドのローカル自動車メーカーとの取引拡大に向けた営業・提案
活動を強化しています。
4.0
当社が最大の経営課題の一つと認識しているのが、
中国メーカーとの競争です。
中国自動車メーカーの
3.0
海外展開に伴い、
中国系サプライヤーも海外市場へ進出し、
短期の利益よりシェア拡大を優先した低価格
2.0
1.0
0
▶
環境
▶
社会
▶
特集
� 員座談会�
社
現場から描くNEW VALUE
ガバナンス
▶
Data
▶
主要財務データ
戦略で参入してきています。
当社は技術力とサービス品質に自信を持っていますが、
慢心することなく技術
▶
主要非財務データ
開発を加速させ、
価格競争に陥らない付加価値を生み出すこと。
同時に、
原価競争力そのものをさらに高
▶
企業情報
めること。
この両輪を回し続けることが、
将来の競争力につながります。
こうした課題認識を踏まえ、2026年5月には第14次中計を見直しました。森六ReNovaグループの参画
IRサイト
を踏まえ、財務目標を新たに設定するとともに、2035年長期ビジョンでは「売上高2,200億円以上」
業績ハイライト
「ROE10%以上」
という具体的な目標値を掲げました。
これらの目標は決して容易に達成できるものではあ
ESGデータブック
MORIROKU 10 INTEGRATED REPORT 2026
有価証券報告書
社長メッセージ
INDEX
りません。
その実現に向け、既存事業の収益力強化と森六ReNovaグループとの融合によるシナジー創出
PMIにおいて私が大切にしているのは、
「森六のやり方に合わせてもらう」
ことではありません。
私自身も
を着実に積み重ね、
持続的な成長と企業価値の向上につなげていきます。
そのためには、
変化を前向きに
森六ReNovaグループの拠点に足を運び、
社員の皆さんと直接対話を重ねながら、お互いの良いところを
捉え、
グループ全体で知恵や技術、経験を結集し、
それぞれの強みを活かしながら新たな価値を創造して
取り入れ、
どのような会社を目指していくのか、そのビジョンを共有し、新しい森六グループをともにつ
いくことが重要です。
一人ひとりの挑戦が森六グループの競争力を高め、
2035年長期ビジョンの実現につ
くっていきます。
ながると確信しています。
※PMI(Post Merger Integration)
:M&A後に組織・業務・人材を統合し、
シナジー創出を図る取り組み
■ ケミカル事業との調達シナジーによる競争力強化
M&Aの実行
森六ReNovaグループとの融合で強みを広げ、成長を加速する
重複せず、新たなお客様との接点を得られたことです。特に、
これまで取引機会のなかった商用車メー
カーとの接点を得られたことは、
当社にとって大きな意義があります。
社内には、
商用車は乗用車に比べて
ケミカル事業拠点
森六ReNova事業拠点
ASIA
ケミカル事業
モデルライフが長く、投資回収にも時間を要することから、当社のビジネスモデルへの影響を懸念する声
もありましたが、
特定顧客への依存度を低減し、
顧客ポートフォリオを広げることの意義の方が大きいと判
断しました。他社自動車メーカーへの営業活動はこれまでも継続してきましたが、既存のサプライチェーン
へ新たに参入することは容易ではありません。すでに他社自動車メーカーとの信頼関係を築いてきた事
業がグループに加わったことは、
当社にとって大きな強みになります。
さらに技術面では、バックドアモジュールという、
当社がこれまで量産経験のなかった領域のノウハウを
From Vision to
森六ReNovaグループの日本・タイの生産拠点において、
ケミカル事業のグローバルネットワークを活用した原材料・副資材の調達を推進
今回の統合における最大の意義は、森六ReNovaグループの顧客基盤が当社の既存ポートフォリオと
森六ReNova事業
EUROPE
ケミカル事業
Progress
中長期戦略
NORTH AMERICA
7 か国
1 か国
ケミカル事業
1 か国
事業戦略
こうした相乗効果の実現には、PMI※の着実な推進が欠かせません。統合を進める中で見えてきたの
▶
統合報告書2026のテーマと注目ポイント
▶
森六グループの理念
▶
事業紹介
▶
価値創造プロセス
▶
360年以上続く森六「価値創造の進化」
▶
目次・編集方針
▶
社長メッセージ
▶
中期経営計画
▶
財務戦略
▶
財務・非財務ハイライト
▶
特集
▶
JAPAN
2 か国
森六
自動車部品関連の
原材料・副資材の取扱量拡大
新たな商権の獲得
双方の
競争力強化
を実現
森六ReNovaグループ
原材料・副資材の安定供給
調達の最適化によるコスト低減・収益性向上
樹脂加工製品事業
ケミカル事業
▶
森六ReNova事業
1 か国
ケミカル事業
� ゾナック モビリティ事業の�
レ
M&Aによる成長戦略
事業戦略
▶
ケミカル事業
MIDDLE EAST
向上につながる貴重な財産です。
モジュール化を進める自動車メーカーが増える中、
この知見は当社が将
新たな価値提案につなげていきます。
Driving Strategic
Progress
得られたことも大きな意義です。
量産を通じて初めて得られる品質面や生産面での知見は、
今後の技術力
来その領域へ挑戦するための重要な基盤になります。
これまで培ってきた加飾技術とも融合させながら、
Introduction
イントロダクション
Progress toward
Sustainability
価値創造の
基盤
▶
DX戦略
▶
法務・知財戦略
▶
森六グループのサステナビリティ経営
▶
取り組み報告
は、同じ
「営業」
や「設計」
という名称の組織であっても、
その役割や業務プロセスが両社で大きく異なると
いうことです。
▶
環境
▶
社会
▶
特集
� 員座談会�
社
現場から描くNEW VALUE
ガバナンス
▶
両者の違いを
「どちらが正しいか」
という視点で捉えるのではなく、お互いの強みを活かしながら、
森六
成長戦略の加速に向けて
グループとして最適な体制を築くことこそが、
私が考えるPMIの本質です。
森六ReNovaグループが持つ発
ケミカル事業を次なる成長の柱へ育てる
泡成形・モジュール化技術や大型外装部品の開発ノウハウと、森六が培ってきた加飾技術、材料開発力、
Data
現在は、
ケミカル事業のさらなる成長に向けた土台づくりに注力しています。
当社はかねてから、
「ものづ
生産技術力を融合することで、
これまでにない価値をお客様へ提供できると考えています。
また、調達面においても、
グループ全体でコスト競争力を高められる余地があります。現在、森六
くり」
と
「化学品商社」
という2つの事業のシナジーについて、
どこに拡大の余地があるのか、
どう最大化し
ReNovaグループでは材料や副資材の調達を外部商社に依存するケースが多くありますが、
グループの
ていくのかを課題として捉えてきました。
その実現に向け、当社の存在意義を示す「Our Mission」
として、
商社機能を活用することで、
サービス水準を維持しながら調達効率を高められる可能性があります。
まず
「ものづくりの技と化学の力で、
社会に価値あるソリューションを提供する」
を掲げています。
は調達シナジーの実現に着実に取り組み、
その先の共同開発や新材料開発へとつなげていきます。
今回グループに加わった森六ReNovaは、
レゾナックの前身の一つである旧日立化成をルーツとする組
MORIROKU 11 INTEGRATED REPORT 2026
▶
主要財務データ
▶
主要非財務データ
▶
企業情報
IRサイト
業績ハイライト
ESGデータブック
有価証券報告書
社長メッセージ
INDEX
織であり、化学品の取り扱いや材料開発にも強みを持っています。
「ものづくり」
と
「化学」
に知見のある森
こうした前向きな動きを一つの方向へ束ね、進むべき道筋を明確に示すことが、経営の役割です。
その
六ReNovaグループが、いわば生産事業とケミカル事業の橋渡し役を果たし始めており、
ケミカル事業の
ためには、経営層自らが多様な視点から率直に意見を交わし、意思決定の質を高めていくことが欠かせ
社員が自ら生産現場に足を運び、
ともに課題を見つけ、
解決策を考える動きも自然と増えています。
これま
ません。
異なる事業やバックグラウンドを持つメンバーが意見を交わすことで、
新たな視点が生まれ、
経営
でケミカル事業を中心に取り組んできた材料開発との融合によって、
グループシナジーを生み出す土壌が
の判断はより良いものになります。実際に、森六ReNovaグループから加わった執行役員が率直な意見を
豊かになり、
ビジョン実現に資する取り組みが拡大していくことが期待できます。
同時に、
この流れをケミカ
述べることで、
これまでにない視点から議論が深まり、経営会議にも良い刺激が生まれています。
こうした
ル事業の活動にも還元し、
ケミカル事業のお客様への提案にも広げていきます。
対話を重ねることが、
より良い経営につながり、
その姿勢は必ず現場にも広がっていくと考えています。
私たちが目指しているのは、
課題解決型の企業への進化です。
自ら手を動かしてものをつくることで付加
ガバナンス面でも、変革を支える基盤は着実に強まっています。今回の大型M&Aを経て、資本効率をど
価値を生み出す仕事と、
ネットワークや情報力を活かして、
ものづくりだけでは生み出せない価値を提供
のように高め、
どのような指標で評価していくかという議論は以前にも増して活発になり、
社外取締役から
する仕事の両方を軸に事業ポートフォリオと経営資源の配分を見直し、
森六ならではのソリューションをつ
も、
より多角的で示唆に富む意見をいただけるようになりました。
その背景には、資料の早期共有や丁寧
くり上げていきます。
な情報提供など、事務局機能を強化することで、建設的な議論を支える環境づくりを進めてきたことがあ
ケミカル事業には、
特殊フィルムを手がける四国化工や、
中間材を製造する五興化成工業といったもの
づくりの会社もありますが、
それ以外は主に商社機能を担っています。
当社はこれまで、
長年にわたり培って
Introduction
イントロダクション
From Vision to
Progress
中長期戦略
ります。
さらに2027年3月期は、
社外取締役との意見交換やディスカッションの機会を充実させるなど、
より
活発な対話を促す取り組みも進めています。
きたお客様との信頼関係を礎に事業を発展させてきました。
その強みをこれからも大切にしながら、
さらに
こうした土壌があるからこそ、新たに加わっていただいた社外取締役にも、早速その知見を発揮してい
選ばれ続ける企業であるためには、お客様の期待を上回る新たな提案やサービスを生み出し続けること
ただいています。私自身、経営の視野を広げ、意思決定の質を高めるためには、自分とは異なる視点から
が欠かせません。例えば、サプライチェーン全体を見据えたソリューション、
さらには商社の枠を超えた
率直な意見をいただけることが不可欠だと考えています。2024年6月の監査等委員会設置会社への移行
サービスの提供など、
私たちにはまだ多くの可能性があります。
こうした価値提供を積み重ね、
ケミカル事
以降に築いてきたガバナンス体制は、
こうした対話を重ねながら、
着実に実効性を高めています。
Driving Strategic
Progress
事業戦略
事業紹介
▶
価値創造プロセス
▶
360年以上続く森六「価値創造の進化」
▶
目次・編集方針
▶
社長メッセージ
▶
中期経営計画
▶
財務戦略
▶
財務・非財務ハイライト
▶
特集
▶
Sustainability
価値創造の
基盤
事業戦略
樹脂加工製品事業
▶
DX戦略
▶
法務・知財戦略
▶
森六グループのサステナビリティ経営
▶
取り組み報告
最近、
心強く感じているのは、
森六ReNovaグループが加わったことで、
社員一人ひとりが新しい環境を
自分ごととして受け止め、お互いの強みやリソースを活かそうという動きが自然に広がっていることです。
� ゾナック モビリティ事業の�
レ
M&Aによる成長戦略
ケミカル事業
Progress toward
一人ひとりの課題認識を、
挑戦につなげる組織へ
森六グループの理念
▶
▶
そのためにも、
経営陣と現場が率直に意見を交わしながら、
新たな可能性を形にしていくための対話を
変化の実感
統合報告書2026のテーマと注目ポイント
▶
▶
業の成長、
ひいては森六グループ全体の競争力向上につなげていきます。
大切にし、
一つひとつ着実に実現していきます。
▶
▶
環境
▶
社会
▶
特集
� 員座談会�
社
現場から描くNEW VALUE
ガバナンス
▶
Data
▶
主要財務データ
同士が自発的に交流し、業務や設備を相互に補完しようという取り組みが始まっています。経営から指示
▶
主要非財務データ
を出さなくても、
現場自らが会社をより良くしていこうと考え、
行動する姿勢が育ち始めています。
この主体
▶
企業情報
例えばタイでは、
もともと森六の工場と森六ReNovaグループの工場が併存していますが、現地の責任者
的な取り組みの広がりこそが、
PMIを成功へ導く原動力です。
こうした取り組みを着実に積み重ねることで、
シナジーを創出し、
新たな価値を生み出していきます。
そし
IRサイト
て、お互いの強みを融合しながら筋肉質な組織を築き、
この領域におけるトップサプライヤーを目指してい
業績ハイライト
きます。
ESGデータブック
MORIROKU 12 INTEGRATED REPORT 2026
有価証券報告書
社長メッセージ
INDEX
森六グループが目指す未来
期待に応える成果を積み上げ、
選ばれ続ける企業へ
株主・投資家の皆さまにまずお伝えしたいのは、私たちが携わる
自動車・化学関連産業は、
社会を支える基幹産業であり、
これからも
社会の発展を支える重要な役割を担い続けるということです。だか
らこそ、私たちは、
ものづくりの技と化学の力を融合させ、高度な製
品づくりと最適なソリューションを世界中のお客様に提供すること
で、
選ばれ続ける企業を目指します。
今回の森六ReNovaグループの
統合は、
その進化を加速させるための確かな一手であり、
この統合
の価値を着実に成果へと結びつけていくことが私の責任です。お客
様や社会から期待される存在であり続け、
その期待に応える成果を
業績として堅実に積み上げていくことで、株主・投資家の皆さまにも
信頼していただける会社へと成長させていきます。
変化の激しい時代だからこそ、私たちは目先の環境変化に一喜
一憂するのではなく、
2035年長期ビジョンの実現に向けて着実に歩
みを進めてまいります。
ものづくりの技と化学の力を結び合わせ、お
Introduction
イントロダクション
One Moriroku
「一つの仲間」
として、新たな価値創造を実現するために
2026年4月、株式会社レゾナックからM&Aにより取得したモビリティ事業の一部を基盤とする森六ReNovaおよび森六モビ
リティプロダクツが始動しました。今回のM&Aは、2035年長期ビジョン
「CREATE THE NEW VALUE」の実現に向け、技術力
や顧客基盤を強化し、持続的な成長を加速させる重要な戦略の一つです。
一方で、M&Aは株式取得が完了した時点で成功するものではありません。真の価値は、互いの技術やノウハウ、人材、企業
よう、
心よりお願い申し上げます。
森六グループでは、PMIの出発点を
「相互理解」
と位置づけています。森六および森六ReNovaの両社長が各拠点を訪問
し、M&Aの目的や2035年長期ビジョン、統合によって目指す姿を共有するとともに、社員との対話を通じて相互理解を深めて
います。互いの考え方や価値観を理解し、それぞれが培ってきた強みを尊重することが、新たな価値創造の土台になると考え
中長期戦略
Driving Strategic
Progress
事業戦略
統合報告書2026のテーマと注目ポイント
▶
森六グループの理念
▶
事業紹介
▶
価値創造プロセス
▶
360年以上続く森六「価値創造の進化」
▶
目次・編集方針
▶
社長メッセージ
▶
中期経営計画
▶
財務戦略
▶
財務・非財務ハイライト
▶
特集
▶
ているためです。
PMIでは、下記4つを
「PMIトップ方針」
として掲げています。これらをすべての取り組みの判断基準とし、技術・組織・文化の
ケミカル事業
Progress toward
Sustainability
- 一つの仲間として未来を創る
価値創造の
基盤
- お客様と従業員の信頼を守る
▶
DX戦略
▶
法務・知財戦略
▶
森六グループのサステナビリティ経営
▶
取り組み報告
- スピード・誠実・透明
2026年4月森六モビリティプロダクツ
(タイ)訪問
森六ReNova株式会社社長メッセージ
4月1日の統合以降、森六の皆さまには温かく迎えていただき、互いの強みを尊重しなが
平田知広
す。私たちも、
これまで培った技術力と経験を活かし、森六グループの成長に貢献していく
MORIROKU 13 INTEGRATED REPORT 2026
環境
▶
社会
▶
特集
� 員座談会�
社
現場から描くNEW VALUE
ガバナンス
Data
風通しが良く活気あふれる環境の中で、新たな価値創出に向けた挑戦が始まっていま
決意です。皆さまから寄せられる期待を力に変え、
ともにさらなる発展を目指してまいります。
▶
▶
ら、一つのチームとして歩みを進めています。
執行役員
森六ReNova株式会社社長
樹脂加工製品事業
▶
融合を着実に進めることで、2035年長期ビジョンの実現と企業価値の向上につなげていきます。
PMIトップ方針
� ゾナック モビリティ事業の�
レ
M&Aによる成長戦略
事業戦略
▶
- 強みの融合による新たな価値創造
代表取締役社長
最高経営責任者
Progress
文化を融合し、新たなシナジーを創出することで初めて実現します。その取り組みがPMI(Post Merger Integration)
です。
客様の課題を解決する価値を提供し続ける。
それが、私たちグルー
プ全員で目指す未来の姿です。
引き続き変わらぬご支援を賜ります
From Vision to
▶
▶
主要財務データ
▶
主要非財務データ
▶
企業情報
IRサイト
業績ハイライト
ESGデータブック
有価証券報告書
中期経営計画
INDEX
第14次中期経営計画財務目標の見直し
最新情報:業績ハイライト
https://www.moriroku.co.jp/ir/financial̲information/highlight/index.html
Introduction
イントロダクション
第14次中計最終年度の財務・非財務目標を確実に達成し、
2035年 Our Missionの実現を目指す
森六グループは、
2025年5月に2035年長期ビジョンおよび第14次中計を公表し、
2035年のありたい姿に
向けた成長戦略として4つの重点テーマを掲げました。
その実現に向けた取り組みを推進する中、事業環
境の変化を機敏に捉え、
2026年4月には株式会社レゾナックからモビリティ事業の一部を対象とするM&A
を実施しました。
本M&Aは、顧客ポートフォリオの拡充および外装樹脂部品の拡大を通じて、2035年長期
ビジョンの実現を加速する重要な戦略です。
(
P.18
特集 レゾナック モビリティ事業のM&Aによる成
長戦略)
こうした事業環境の変化および本M&Aを踏まえ、2035年長期ビジョンの数値目標を新たに設定する
とともに、第14次中計の財務目標を見直しました。2035年の数値目標は「売上高2,200億円以上、
ROE10%以上」
としました。第14次中計については、戦略の方向性を維持しつつ、
より実効性の高い計画
とするため、従来の成長率を基軸とした指標から営業利益額ベースの財務目標へと変更し、あわせて具
体的なROE目標を設定しました。
アジリティ経営で未来を拓く ― 柔軟性と利益追求で成長を加速する―
戦略① 主力事業の更なる利益追求
●グローバル市場拡大と新規顧客獲得による利益拡大
今後は、
中期的に森六ReNovaグループと生産事業本部との統合を進めるとともに、
ケミカル事業とのシ
引き続き、中長期での統合シナジーの創出を通じて第14次中計における収益性の向上を図り、2035
年長期ビジョンに掲げた目標の実現に向けた取り組みを着実に進めていきます。
●生産技術開発と高効率生産による環境負荷低減・利益拡大
戦略② 将来の製品化に向けた開発の推進
●
「ものづくり」強化による差別化
●独自性・付加価値の高い製品開発
Progress
事業戦略
●シナジーを活かした事業領域の拡大と利益性の追求
森六グループの理念
▶
事業紹介
▶
価値創造プロセス
▶
360年以上続く森六「価値創造の進化」
▶
目次・編集方針
▶
社長メッセージ
▶
中期経営計画
▶
財務戦略
▶
財務・非財務ハイライト
▶
特集
▶
戦略④ 事業基盤の更なる強化
60億円
※2
ケミカル事業
▶
●コーポレート機能戦略と事業戦略の統合
●国籍や性別を超えた多様な人材力の最大化
●サステナビリティ経営の深化
(27.3期期初計画)
社員
エンゲージ
メント
(28.3期目標)
5%
※2
(27.3期期初計画)
6.5%
肯定回答率5ポイントの改善へ
45%以上(28.3期目標)
※1「営業利益伸長率」
から
「営業利益」
での目標設定に変更しました。
社員を
活かす環境
Sustainability
価値創造の
基盤
DX戦略
▶
法務・知財戦略
▶
森六グループのサステナビリティ経営
▶
取り組み報告
肯定回答率5ポイントの改善へ
47%以上(28.3期目標)
女性管理職人数
CO2排出量削減率
2024年4月時点比
基準:2019年度比
2倍へ(28.3期目標)
(28.3期目標)
45%(28.3期目標)
※3 人材や組織文化の統合に一定の時間を要することから、
現中計では目標値を据え置き、
既存事業での目標達成を目指します。
※2 2027年3月期の数値は期初計画です。
既存事業の改善に加え、
2026年4月に連結子会社化した森六ReNovaグループの業績
が通期で反映されることにより、
営業利益の増加を見込んでいます。
収益の拡大を通じてROEも改善基調に転じ、
2028年3月
期には資本効率のさらなる向上を図っていきます。
MORIROKU 14 INTEGRATED REPORT 2026
樹脂加工製品事業
▶
社員エンゲージメント
70億円
� ゾナック モビリティ事業の�
レ
M&Aによる成長戦略
事業戦略
▶
非財務目標(森六グループ連結)※3 2025年5月時点から変更なし
ROE
(26.3期実績)
Driving Strategic
戦略③ 事業シナジーによる新たな価値創造
営業利益※1
3.8%
中長期戦略
Progress toward
財務目標(森六グループ連結)
(26.3期実績)
Progress
統合報告書2026のテーマと注目ポイント
▶
●積極的な出資や事業提携により、
新たな価値創造のスピードアップ
ナジー創出も視野に入れ、
グループ内連携を強化することで、
成長戦略をさらに機動的に推進していきます。
46億円
From Vision to
●製品・商材ポートフォリオ確立による利益拡大
▶
▶
環境
▶
社会
▶
特集
� 員座談会�
社
現場から描くNEW VALUE
ガバナンス
▶
Data
▶
主要財務データ
▶
主要非財務データ
▶
企業情報
IRサイト
業績ハイライト
ESGデータブック
有価証券報告書
財務戦略
最新情報:業績ハイライト
https://www.moriroku.co.jp/ir/financial̲information/highlight/index.html
キャッシュアロケーションの見直し
統合シナジーを収益力に変え、
Introduction
イントロダクション
また、第14次中計3年間のキャッシュアロケーションも下のグラフのとおり見直しました。主力事業の
さらなる利益追求、製品化につながる開発の推進、統合シナジー創出といった事業利益成長を実現する
ため、財務面からサポートしてまいります。
企業価値を
■ 第14次中期経営計画 キャッシュアロケーション
次のステージへ 押し上げます
代表取締役副社長
最高財務責任者
INDEX
営業CF
(R&D等調整後)
M&Aによる事業基盤強化を踏まえ、
成長投資を加速
菊地耕一
M&Aによる追加内容
153 億円
借入金
200 億円
● 計画当初
2026年3月期の業績を振り返って
(2025年5月発表時点)
キャッシュイン
増加分
成長投資
105 億円
第14次中期経営計画(以下、中計)初年度となる2026年3月期は、世界経済が米国の関税政策やサプ
ライチェーンの混乱、中東情勢の緊迫化などにより、先行き不透明な状況が続きました。樹脂加工製品事
業において、中国およびアジアでの主要顧客である日系自動車メーカーの販売低迷や、
ケミカル事業に
おける化学品販売減少の影響を受け、
売上高は1,338億円(前期比8.4%減)
となりました。
営業CF
(R&D等調整後)
465 億円
一方、営業利益は、減収影響やM&A関連費用があったものの、販売価格の適正化やコスト改善、固定
費適正化の推進により46億円(同12.2%増)
となり、収益体質改善に一定の成果が見られました。依然と
して、中国市場低迷の長期化などを踏まえ、収益性向上は重要課題と認識しています。
維持投資
株式売却35 億円
株主還元
75 億円
(2026年5月発表時点)
成長・維持・
研究開発
投資
165 億円
株式取得
(森六ReNova)
172億円
キャッシュアウト
増加分
中長期戦略
営業CF
(R&D等調整後)
618 億円
成長・維持・
研究開発
投資
580 億円
Progress
事業戦略
森六グループの理念
▶
事業紹介
▶
価値創造プロセス
▶
360年以上続く森六「価値創造の進化」
▶
目次・編集方針
▶
社長メッセージ
▶
中期経営計画
▶
財務戦略
▶
財務・非財務ハイライト
▶
特集
▶
� ゾナック モビリティ事業の�
レ
M&Aによる成長戦略
事業戦略
樹脂加工製品事業
ケミカル事業
▶
人材投資
10 億円
人材投資 10 億円
統合報告書2026のテーマと注目ポイント
▶
▶
経営統合費用
16 億円
借入金
200 億円
株式売却35 億円
株式取得
(森六ReNova)
▶
DX戦略
▶
法務・知財戦略
▶
森六グループのサステナビリティ経営
▶
取り組み報告
172億円
株主還元
75 億円
キャッシュイン キャッシュアウト
2026年4月のモビリティ事業のM&Aと第14次中計財務目標の見直し
株主還元方針
2026年4月に完了した株式会社レゾナックのモビリティ事業のM&Aは、2035年長期ビジョンの重要戦
当社の株主還元方針として、今後もDOE(自己資本配当率)
を指標とした安定的・継続的な株主還元を
略である
「顧客ポートフォリオの拡充」
や「外装樹脂部品の拡大」
を加速するための投資であり、統合シナ
実施していきます。2026年3月期の年間配当は1株当たり115円(DOE2.7%)、2027年3月期計画は1株当
ジーの創出による収益性向上と、2035年に向けた売上拡大を実現するための施策です。買収した事業の
たり125円(DOE2.7%)
としており、第14次中計最終年度の2028年3月期にはDOE3.0%以上とする目標
初年度営業利益は13億円を見込んでいます。
め、単年度ごとに営業利益目標を設定しました。統合に伴う一時的なコスト増加を織り込んだ上で、2027
Driving Strategic
成長投資余力の拡大
キャッシュイン キャッシュアウト
今回のM&Aに伴い、2026年5月、第14次中計の財務目標を見直しました。着実な進捗管理を行うた
From Vision to
Progress
経営統合費用
16 億円
185 億円
研究開発
投資
125 億円
● 見直し後
▶
Progress toward
Sustainability
価値創造の
基盤
▶
環境
▶
社会
▶
特集
� 員座談会�
社
現場から描くNEW VALUE
ガバナンス
▶
Data
▶
主要財務データ
を設定しています。
自己株式取得についても、
キャッシュ・フローや株価の状況等を総合的に勘案し、機動
▶
主要非財務データ
的に検討・実施する方針です。財務レバレッジや株主還元を通じて最適な資本構成を追求し、引き続き株
▶
企業情報
主価値の向上に取り組んでまいります。
IRサイト
年3月期の営業利益目標値を60億円、2028年3月期の営業利益目標値を70億円と設定しました。
また、
今後も継続して機関投資家や個人投資家の皆さまとの対話の機会や、
ホームページでの情報開示を
収益拡大を見込み、ROEの目標値を2027年3月期に5.0%、2028年3月期に6.5%としました。資本コストを
さらに充実させていきます。特に非財務情報についても積極的に開示し、当社グループの持続可能性の
業績ハイライト
上回る水準の実現に向け、企業価値の向上に取り組んでいきます。
根拠をご理解いただけるよう、サステナビリティ経営の推進とIR活動の充実に努めてまいります。
ESGデータブック
MORIROKU 15 INTEGRATED REPORT 2026
有価証券報告書
財務・非財務ハイライト
最新情報:業績ハイライト
財務
非財務
■ 売上高
■ 営業利益・営業利益率
(億円)
2,000
1,500
1,944
1,288※
1,456
1,420
1,461
(億円)■営業利益
100
営業利益率
1,338
(%)
5.0
3.9
80
20
0
23.3期
24.3期
25.3期
22.3期
※2022年3月期より
「収益認識に関する会計基準」
を適用
26.3期
27.3期
(期初計画)
■ ROEの推移
5.0
4.2
1.9
0
90
60
△6.0
△9.0
22.3期
30
△11.3
23.3期
24.3期
25.3期
26.3期
27.3期
(期初計画)
■ 設備投資額・減価償却費
100
72
79
88
0
24.3期
25.3期
■期末配当
26.3期
27.3期
(期初計画)
2.7
2.2
120,000
26.8%
100,000
削減
37.3%
削減
39.1%
削減
72
78
2.1
100
105
47.0
53.0※
50.0
52.5
47.0
23.3期
0
60
63
30
削減
45.0%
削減
2.7
115
57.5
125
62.5
2.0
1.5
1.0
52.5
50.0
24.3期
25.3期
57.5
62.5
26.3期
0.5
削減
23.3期
24.3期
25.3期
26.3期
0
中長期戦略
80,000
60,000
Progress
事業戦略
森六グループの理念
▶
事業紹介
▶
価値創造プロセス
▶
360年以上続く森六「価値創造の進化」
▶
目次・編集方針
▶
社長メッセージ
▶
中期経営計画
▶
財務戦略
▶
財務・非財務ハイライト
▶
特集
▶
20,000
0
30
26
32
37
38
※
ケミカル事業
20.3期
23.3期
(基準年度)
24.3期
25.3期
26.3期
28.3期
31.3期
(目標) (目標)
■ 女性管理職比率※
Progress toward
Sustainability
(%)
6
5.6
0
価値創造の
基盤
▶
DX戦略
▶
法務・知財戦略
▶
森六グループのサステナビリティ経営
▶
取り組み報告
5
※一過性・期ズレ要因調整後
25.3期
MORIROKU 16 INTEGRATED REPORT 2026
26.3期
環境
▶
社会
▶
特集
� 員座談会�
社
現場から描くNEW VALUE
ガバナンス
Data
2.7
3
2.2
0
▶
▶
2.2
2
24.3期
樹脂加工製品事業
▶
▶
主要財務データ
▶
主要非財務データ
▶
企業情報
IRサイト
1
23.3期
� ゾナック モビリティ事業の�
レ
M&Aによる成長戦略
事業戦略
▶
3.2
22.3期
統合報告書2026のテーマと注目ポイント
▶
4
10
22.3期
From Vision to
Progress
20
20
▶
50.0%
Driving Strategic
(%)
3.0
27.3期
(期初計画)
※2023年3月期の期末配当53.0円は、普通配当47.0円と360周年記念配当6.0円の合計
40
75
43.7%
2.5
2.2
100
22.3期
(t-CO2) ■ Scope1 ■ Scope2
40,000
DOE(%)
94
47.0
■ CO2排出量削減率
50
86
40
0
23.3期
(億円)
83
60
2.2
Introduction
イントロダクション
1.0
■ 研究開発費
(億円) ■設備投資額 ■減価償却費
80
150
120
3.8
△3.0
△12.0
2.0
46
■ 1株当たり配当金とDOEの推移
6.1
3.0
41
0.9
3.0
13
22.3期
(円) ■中間配当
180
(%)
12.0
6.0
0
28
60
57
40
500
3.1
2.8
2.2
INDEX
4.0
3.5
60
1,000
9.0
https://www.moriroku.co.jp/ir/financial̲information/highlight/index.html
業績ハイライト
22.3期
23.3期
24.3期
25.3期
26.3期
※対象範囲:森六株式会社(2025年3月期以前は森六ホールディングス株式会社、
森六テクノロジー株式会社、森六ケミカルズ株式会社)
ESGデータブック
有価証券報告書
INDEX
Driving Strategic Progress
事業戦略
特集
レゾナック モビリティ事業の
M&Aによる成長戦略
18
ケミカル事業
DX戦略
法務・知財戦略
グループシナジーが次の成長を加速する
From Vision to
森六グループでは、スローガン「共に挑もう、新たな未来。」のもと、事業や組織の枠を超えたシナジー
事業戦略
樹脂加工製品事業
Introduction
イントロダクション
21
27
32
33
創出に取り組んでいます。両事業の技術や顧客基盤を、DXや法務・知財などの面から支えています。
また、
Progress
中長期戦略
新たな仲間を迎えたことで、
これまでにない視点や可能性が見え始めています。
こうした連携を通じて、
森六グループの成長をさらに加速させていきます。
Driving Strategic
Progress
樹脂加工製品事業
ケミカル事業
顧客共創型
アジャイル開発
製造技術力
シナジー創出
技術融合力
新たな価値創造へ
12か国での
グローバル展開
強みの融合による
※2026年3月末時点
独自技術を持つ
関係会社ネットワーク
統合報告書2026のテーマと注目ポイント
▶
森六グループの理念
▶
事業紹介
▶
価値創造プロセス
▶
360年以上続く森六「価値創造の進化」
▶
目次・編集方針
▶
社長メッセージ
▶
中期経営計画
▶
財務戦略
▶
財務・非財務ハイライト
▶
特集
▶
ケミカル事業
▶
Progress toward
Sustainability
価値創造の
基盤
DX戦略
▶
法務・知財戦略
▶
森六グループのサステナビリティ経営
▶
取り組み報告
▶
環境
▶
社会
▶
特集
新たな技術・顧客基盤・知見
事業変革を後押し
P.32
▶
法務・知財戦略
リスク対応・知財の戦略的活用
Data
P.33
▶
主要財務データ
▶
主要非財務データ
▶
企業情報
IRサイト
業績ハイライト
ESGデータブック
MORIROKU 17 INTEGRATED REPORT 2026
� 員座談会�
社
現場から描くNEW VALUE
ガバナンス
P.18
DX戦略
樹脂加工製品事業
▶
P.27
森六ReNovaグループ
� ゾナック モビリティ事業の�
レ
M&Aによる成長戦略
事業戦略
▶
360年以上の業歴で
培った商社の知見
品質保証力
P.21
事業戦略
▶
有価証券報告書
特集
レゾナック モビリティ事業のM&Aによる成長戦略
技術・顧客・人材の強化
自動車業界は今、CASEの進展や環境規制の強化に加
え、市場構造そのものが大きな転換期を迎えています。部
森六ReNovaグループとの共創が生み出す次の成長
森六グループは、この変化を成長の機会と捉え、M&A
対象事業は、
世界初・日本初の内外装品を手掛け、
軽量化・モジュール化において、
豊富な実績を有しています。
外装発泡成形品
累計販売台数
樹脂製バックドア
モジュール
日本初
を決断しました。なぜ今、M&Aを行ったのか。どのような
シナジーを生み出すのか。そして、そのシナジーをどう加
速させるのか。3つの視点から、本M&Aの意義と展望をお
伝えします。
Introduction
イントロダクション
M&A対象事業の概要
品メーカーには、軽量化・高機能化・意匠性・環境対応と
いった多様なニーズへの対応が求められています。
INDEX
グローバル
No.1
※
外装発泡成形品
世界初
対象
株式会社レゾナック モビリティ事業の一部
事業内容
自動車用樹脂内外装成形部品の製造・販売
売上高
424億円
(2025年12月期、
対象事業合計)
従業員数
1,247名
(2025年12月末時点)
拠点
日本5拠点
(製造2・営業2・開発1)
、
タイ2拠点
(製造1・開発1)
取得日・形態
2026年4月1日に株式取得
(子会社化)
統合方針
森六ReNovaおよび森六モビリティプロダクツは、M&A後の
統合プロセス
(PMI)
を推進しながら、2028年4月1日をめど
に森六への吸収合併を予定
From Vision to
Progress
中長期戦略
Driving Strategic
Progress
事業戦略
▶
統合報告書2026のテーマと注目ポイント
▶
森六グループの理念
▶
事業紹介
▶
価値創造プロセス
▶
360年以上続く森六「価値創造の進化」
▶
目次・編集方針
▶
社長メッセージ
▶
中期経営計画
▶
財務戦略
▶
財務・非財務ハイライト
▶
特集
▶
※2025年1月時点
� ゾナック モビリティ事業の�
レ
M&Aによる成長戦略
事業戦略
▶
樹脂加工製品事業
ケミカル事業
▶
なぜ今、
M&Aを
行ったのか?
成長貢献 ❶
技術
外装発泡や大型金属部品の樹脂化による軽量化技術
▶高付加価値な外装樹脂部品の強化
製品乗用車向けに加え、商用車の内外装部品へ拡大
R&D
開発リソース
(生産技術、新素材、特許基盤)の
融合および合理化
成長貢献 ❷
技術・顧客基盤・人材を強化し、
2035年長期ビジョンの実現を加速する
新たな自動車メーカーとの取引基盤の獲得
顧客新たな顧客となる自動車メーカーとの取引基盤
今回のM&Aは、
「顧客ポートフォリオの拡充」
および
「外装樹脂部品の拡大」
により、
2035年
長期ビジョンの実現を加速する重要な戦略です。森六ReNovaグループは、独自の軽量化技
術や大型外装部品技術に加え、当社がこれまで取引のなかった自動車メーカーとの取引基
盤を有しており、新たな事業機会の創出と事業拡大が期待できます。また、人材と知見の融
合により、組織力を高めることで、新たな価値創出にもつなげていきます。
高水準の軽量化・バックドアモジュール化技術の獲得
QCD
樹脂成形部品の
トップサプライヤーへ
14次中計開発テーマへの貢献
コア技術
進化
新価値
製品
環境
顧客基盤の
拡大による
売上・利益成長の実現
Progress toward
Sustainability
価値創造の
基盤
人的資源・知見の融合
人材人材の最適配置と知見の相互活用による組織力強化
共創による
新たな価値創出
DX戦略
▶
法務・知財戦略
▶
森六グループのサステナビリティ経営
▶
取り組み報告
▶
環境
▶
社会
▶
特集
ガバナンス
Data
▶
主要財務データ
▶
主要非財務データ
▶
企業情報
IRサイト
業績ハイライト
ESGデータブック
MORIROKU 18 INTEGRATED REPORT 2026
� 員座談会�
社
現場から描くNEW VALUE
▶
製造キャパシティの相互活用により、
顧客への最適供給体制を実現
成長貢献 ❸
▶
有価証券報告書
特集
レゾナック モビリティ事業のM&Aによる成長戦略
どんなシナジーを
生み出すのか?
INDEX
Introduction
▶
統合報告書2026のテーマと注目ポイント
▶
森六グループの理念
今回のM&Aにより、
森六グループは
「外装発泡成形品」
「バックドア」
「バンパーフェイシア」
を新たにラインナップに加え、
外
▶
事業紹介
装部品領域を拡大しました。
また、
森六ReNovaグループが持つ高付加価値技術・顧客基盤と、
当社グループが培ってきた加
▶
価値創造プロセス
飾・量産技術、
ケミカル事業の材料開発力・調達力を融合し、
技術・顧客・事業基盤の各領域でシナジーの創出を目指します。
▶
360年以上続く森六「価値創造の進化」
▶
目次・編集方針
▶
社長メッセージ
▶
中期経営計画
▶
財務戦略
▶
財務・非財務ハイライト
▶
特集
外装領域拡大と技術融合で新たな価値を創出
イントロダクション
From Vision to
新しい価値を生み出す
TECHNOLOGY
森六の強み
Progress
中長期戦略
2つの強みが交わることで
広がる可能性
美しさと機能を、
量産部品につくり込む力
加飾技術
ホットスタンプなどの加飾技術により、
高意匠・高付加価値を実現
森六ReNovaの強み
大型部品を、軽く、一体化する力
外装発泡成形技術
発泡成形技術により、
軽量で高外観な
大型部品を実現
材料開発力
バンパーやバックドアなどの大型外装部品
の開発・生産技術に強み
成形・塗装・組立
バックドアのモジュール化技術
成形・塗装・組立までの一貫した
量産実装力
高機能・高意匠な大型外装部品の創出
開発から量産の一貫体制
軽量化
設計・開発から量産まで、
スピーディーに
顧客価値をカタチにする体制
顧客基盤の相互活用
両者の顧客基盤を活
用し、新しい提案機
会を創出
Progress
事業戦略
高意匠化
部品点数・工程の削減
新しい価値を市場へ広げる
車種・市場の拡大
大型外装部品の提案領
域を拡大し、
グローバル
展開を加速
モジュール化
環境性能の向上
OPERATION
新たな提案機会の創出
加飾×大型外装の新しい
価値提案で、新規受注を
獲得
材料・部品の共同調達
調達力の強化と
コスト競争力 の
向上
新規受注・売上拡大
部品・機能を一体化し、
デザインの自由度と
機能性を向上
工程・生産の最適化
グローバルな生産・物流ネット
ワークの最適化で、
リードタイ
ム短縮とコスト削減を実現
樹脂加工製品事業
ケミカル事業
Progress toward
Sustainability
価値創造の
基盤
DX戦略
▶
法務・知財戦略
▶
森六グループのサステナビリティ経営
▶
取り組み報告
▶
環境
▶
社会
▶
特集
� 員座談会�
社
現場から描くNEW VALUE
ガバナンス
▶
Data
物流・拠点の最適化
生産工程・設備の相
互活用により、効率
化と品質向上を実現
事業戦略
▶
グローバルでの豊富な量産供給実績と
顧客基盤
新しい価値を競争力に変える
� ゾナック モビリティ事業の�
レ
M&Aによる成長戦略
▶
多様な顧客への量産供給実績
競争力・収益性の向上
MORIROKU 19 INTEGRATED REPORT 2026
▶
▶
大型外装部品の開発・生産技術
高機能材料の開発により、
意匠性・
耐久性・環境性能を向上
MARKET
Driving Strategic
▶
主要財務データ
▶
主要非財務データ
▶
企業情報
IRサイト
業績ハイライト
ESGデータブック
有価証券報告書
特集
レゾナック モビリティ事業のM&Aによる成長戦略
段階的なPMIで
素材から製品までをつなぐシナジーを創出
PMIの進展に応じた統合効果の創出イメージ
2035年
統合効果による
利益改善、
売上積み増し
■ 顧客での量産開始
売上シナジー創出に
向けた体制確立
Introduction
イントロダクション
成長分野での
売上拡大
第14次中計期間
売上シナジー
どうやってシナジーを
加速させるのか?
INDEX
■ 製品の高付加価値化
新規顧客・新製品の
拡大による
持続的成長
■ 新製品の創出
■ クロスセル実行
事業基盤の高度化による
シナジー効果の押し上げ
■ 開発テーマの整理
■ 財務シナジー
■ 技術融合
強みを融合し、シナジーの早期創出に取り組みます。統合初期には事業運営の一体化を着実
に進め、その上で、事業・財務・技術・人材の各領域を強化し、売上シナジーの創出・拡大につ
なげます。同時に、開発・生産・購買・物流・品質といった幅広い領域で連携・最適化を進め、収
第14次中計期間
(〜2028年3月期)
コストシナジー
PMI(Post Merger Integration)を通じて、技術・顧客基盤・ものづくり・人材など、両者の
■ 事業ポートフォリオ最適化
■ 共同調達
■ 生産相互補完
■ 品質基準統一
■ 管理部門統合
■ グループ間
材料調達の
開始
■ ノウハウの融合
■ 拠点の合理化
Progress
中長期戦略
■ 人材・組織文化の融合
2029年3月期〜
■ 人材の最適配置
From Vision to
事業効率改善を
通じた基盤安定化
Driving Strategic
Progress
事業戦略
▶
統合報告書2026のテーマと注目ポイント
▶
森六グループの理念
▶
事業紹介
▶
価値創造プロセス
▶
360年以上続く森六「価値創造の進化」
▶
目次・編集方針
▶
社長メッセージ
▶
中期経営計画
▶
財務戦略
▶
財務・非財務ハイライト
▶
特集
▶
河上裕
樹脂加工製品事業
ケミカル事業
▶
P M I 推進者 からのメッセージ
森六ReNova株式会社
事業企画部
事業戦略
▶
益性の向上を図ります。
� ゾナック モビリティ事業の�
レ
M&Aによる成長戦略
現在、PMIの推進にあたり、2028年4月1日の完全統合に向けて、森六
PMIは単なる統合作業ではなく、
両者が一体となって新たな成長基盤を構築して
ReNova側の業務内容の可視化・整理など、基礎情報の整備を進めています。
いく重要な取り組みです。
現段階では、
森六ReNovaグループと森六が目指す姿を
2026年4月より森六グループの一員となりましたが、森六の皆さんは非常に人
共有しながら役割・責任を明確化していくことを、
何より大切にしています。
各部門と
柄が温かく、話しやすい環境をつくってもらっています。
また、自社のやり方を
対話を重ねる中で、
同じ部門名でも業務範囲や役割が大きく異なるなど、
両者の違
一方的に押し付けるのではなく、双方の良い点を活かそうとする姿勢を強く感
いが随所に見えてきました。
こうした違いに触れるたびに、互いの良い点を取り入
じており、大変心強いです。
れ、
新たな価値を生み出すことこそが統合の大きな意義だと感じます。
森六ReNova
検討を進める中で、両者に異なる得意分野や業務プロセスがあることを実感
グループの皆さんの前向きな姿勢にも、大きな手応えと期待を感じています。森六
します。
こうした違いは一見すると課題にも見えますが、同時に統合による価値
ReNovaグループが持つ発泡成形技術の独自ノウハウや開発のスピード感、
そし
創出の源泉であると捉えています。引き続き、現場での対話と情報共有を重ね、
Progress toward
Sustainability
価値創造の
基盤
▶
DX戦略
▶
法務・知財戦略
▶
森六グループのサステナビリティ経営
▶
取り組み報告
▶
環境
▶
社会
▶
特集
� 員座談会�
社
現場から描くNEW VALUE
ガバナンス
▶
Data
▶
主要財務データ
て森六の安定した事業基盤・加飾などの技術・一貫生産体制。
それぞれ異なる強
▶
主要非財務データ
相互理解を深め、一体感を醸成しながら、PMIを推進していきます。
その上で、短
みを掛け合わせることで、
シナジーの可能性は非常に大きいと感じています。
「ど
▶
企業情報
期的な成果の積み重ねと中長期的な競争力向上の両立を図り、持続的な成長
ちらが正しいか」
ではなく、相手の背景を理解することを起点に粘り強く対話を重
につながるシナジーの創出に取り組んでいきます。
ねながら、技術・人材・業務ノウハウの融合とシナジーの創出に貢献していきます。
──まずは樹脂加工製品事業の開発・生産プロセスを中心に、知見の融合を図ります。その上で、
ケミカル事業とのシナジーの
検証やコーポレート機能の統合へと段階的に取り組みを広げ、グループ全体での価値共創を実現していきます。
MORIROKU 20 INTEGRATED REPORT 2026
IRサイト
森六株式会社
生産事業本部
堀越望東生
業績ハイライト
ESGデータブック
有価証券報告書
事業戦略
INDEX
樹脂加工製品事業
市場環境
Introduction
イントロダクション
機会
自動車の樹脂成形部品から二輪車の外装・機能部品まで、
幅広い製品を展開しています。
顧客や
リスク
● インド・東南アジアをはじめとする新興国での
市場のニーズを捉えた提案を起点に、
開発・試作・検証から量産まで一貫して対応しています。
● 中国・アジア市場での主要顧客の自動車減産、
自動車需要の拡大
開発・製造・品質が連携し、
各地域・顧客の要求に応じた製品をグローバルに提供しています。
中国系メーカーによる競争激化
● HEV・EV向け高機能製品、
軽量化・耐熱性・意匠
● 顧客の電動化戦略、
関連投資計画の見直し
● 原材料費・エネルギーコスト
・人件費の継続的上昇
性に優れた樹脂加工部品へのニーズの高まり
From Vision to
基本戦略
事業の強み
グローバルでの最適な開発・量産体制
自社優位性
顧客共創型アジャイル開発
主力事業の
更なる利益追求
開発・設計・製造・品質保証が一体で連携
企画から量産まで一貫して対応
技術融合力
将来の製品化に
向けた開発の推進
開発初期から品質リスクを検証
地域・顧客に応じた最適な品質を確保
財務目標と実績
■樹脂加工製品事業売上高推移
■樹脂加工製品事業営業利益・営業利益率推移※
(百万円)
(百万円)
10,000
■営業利益(左軸)
168,800※
114,998 122,331
106,929
93,304
101,786
112,259 118,740
120,103
75,000
営業利益率(右軸)
7.0
8,074
5,000
7,532
4.3
5.1
4.9
3.9
4,553 4,579
1.2
0
3.8
2.9
18.3期 19.3期 20.3期 21.3期 22.3期 23.3期 24.3期 25.3期 26.3期 27.3期
(期初計画)
※2027年3月期計画には、M&Aにより承継した森六ReNovaグループを含みます。
0
1,253
4,604
0.1 100
3,445
事業戦略
事業紹介
▶
価値創造プロセス
▶
360年以上続く森六「価値創造の進化」
▶
目次・編集方針
▶
社長メッセージ
▶
中期経営計画
▶
財務戦略
▶
財務・非財務ハイライト
▶
特集
▶
事業戦略
▶
■ 日本
(%)
8.0
(百万円)
6.0
150,000
4.0
75,000
0.0
18.3期 19.3期 20.3期 21.3期 22.3期 23.3期 24.3期 25.3期 26.3期 27.3期
(期初計画)
※一社化に伴い、2026年3月期より本社費用のセグメントへの配分方法を変更しています。
0
■ 北米
11%
21%
10%
18%
Progress toward
Sustainability
価値創造の
基盤
▶
DX戦略
▶
法務・知財戦略
▶
森六グループのサステナビリティ経営
▶
取り組み報告
52%
53%
16%
19%
■ 中国 ■ アジア・その他
53%
18%
7%
24%
9%
21%
51%
49%
19%
21%
樹脂加工製品事業
ケミカル事業
▶
環境
▶
社会
▶
特集
� 員座談会�
社
現場から描くNEW VALUE
ガバナンス
▶
20%
4%
10%
20%
� ゾナック モビリティ事業の�
レ
M&Aによる成長戦略
▶
https://www.moriroku.co.jp/ir/financial̲information/highlight/index.html
5,562 6,400 2.0
MORIROKU 21 INTEGRATED REPORT 2026
顧客ポートフォリオの拡充
部品ポートフォリオの拡大
森六グループの理念
▶
■樹脂加工製品事業地域別売上高・構成比推移※
6.2
108,413
Progress
新機種採用に向けた開発強化
環境負荷低減製品の開発
収益性向上に資する製品開発
開発領域
最新情報:業績ハイライト
Driving Strategic
統合報告書2026のテーマと注目ポイント
▶
北米地域の利益拡大
アジア地域の再構築
地域領域
基本戦略②
品質保証力
加飾・軽量化・環境対応技術等を融合
意匠性・機能性・生産性を同時に向上
顧客・部品領域
基本戦略①
製造技術力
開発初期から顧客と連携
市場変化やニーズを迅速に開発へ反映
中長期戦略
成長分野の収益化加速と
新たなビジネスモデルの創出による事業成長基盤構築
世界各拠点が密に連携し、
コスト低減と高付加価値を両立
150,000
Progress
▶
10%
17%
12%
12%
10%
8%
56%
55%
62%
60%
17%
20%
20%
23%
9%
8%
Data
44%
32%
18.3期 19.3期 20.3期 21.3期 22.3期 23.3期 24.3期 25.3期 26.3期 27.3期
(期初計画)
※各棒の内側に記載された数値は、当該年度の売上高に占める地域別割合を示しています。
四捨五入のため、合計が100%にならない場合があります。
▶
主要財務データ
▶
主要非財務データ
▶
企業情報
IRサイト
業績ハイライト
ESGデータブック
有価証券報告書
事業戦略
樹脂加工製品事業
INDEX
います。現在は開発・技術・営業・購買・品質保証・製造・管理といった各領域で、現場ベースの相互理
生産事業本部長メッセージ
解を深めています。
シナジー創出に向けては、
まず互いの強みや課題を理解することが重要です。
こう
現場の力で事業統合を進め、
した相互理解を起点に、具体的な連携へと着実につなげていきます。
高付加価値領域での
培ってきた製造技術力を掛け合わせることで、相互補完による大きなポテンシャルが生まれます。短期
成長を目指します
大化していきます。そのためにも、権限と責任、意思決定プロセスを明確化し、人材・技術・生産の融合
専務執行役員
生産事業本部長
Introduction
イントロダクション
森六モビリティプロダクツが持つ発泡成形・モジュール化技術をはじめとする開発力と、当社が長年
的な収益改善と中長期的な競争力強化に向けた取り組みを同時並行で進めながら、
そのシナジーを最
From Vision to
を組織として着実に加速させていきます。
一方で、自動車販売台数のグローバルな成長が鈍化し、先行きの不透明感が増している現実からは
森田和幸
目を背けません。需要動向を的確に見極め、成長領域と収益改善領域を早期に明確化した上で、収益
Progress
中長期戦略
性向上と新規部品開発の具現化に組織一丸となって取り組みます。
ステークホルダーの皆さまには、
この事業ポートフォリオの変化を、森六グループが次のステージへ進む力強い一歩として受け止めてい
現場の力を礎に、機動力で変化に挑む
ただけるよう、私たちは結果で示してまいります。
第14次中計の初年度となった2026年3月期は、中国・アジアにおける主要顧客の減産や一部事業の
売却の影響を受け、
売上高は前期比9.7%減の1,084億円となりました。
計画を下回る地域が多く、
年間を通
して厳しい状況が続きました。
それでも、
営業利益は前期比35.7%増
(一社化に伴う本社費用の配分方法変
Driving Strategic
Progress
事業戦略
■ 顧客ニーズ・市場性・自社優位性が重なる領域へ経営資源を集中
▶
統合報告書2026のテーマと注目ポイント
▶
森六グループの理念
▶
事業紹介
▶
価値創造プロセス
▶
360年以上続く森六「価値創造の進化」
▶
目次・編集方針
▶
社長メッセージ
▶
中期経営計画
▶
財務戦略
▶
財務・非財務ハイライト
▶
特集
▶
事業戦略
▶
� ゾナック モビリティ事業の�
レ
M&Aによる成長戦略
樹脂加工製品事業
ケミカル事業
▶
更の影響を調整した比較可能ベース)
の55億円となり、
営業利益率については計画水準を確保することが
▶
できました。
これには、販売価格の適正化やコスト改善といった地道な取り組みの積み重ねに加え、一部
DX戦略
▶
法務・知財戦略
▶
森六グループのサステナビリティ経営
▶
取り組み報告
顧客ニーズ
事業の売却に伴う損失解消や、
前期に中国で計上した減損に伴う減価償却費の減少といった構造的な変
● 軽量化・燃費向上
化も寄与しています。
ただ、
こうした成果の土台となったのは、
各部門・各拠点が変化する環境に粘り強く、
● 意匠性・デザイン性向上
● 環境負荷低減・サステナビリティ
柔軟に対応し続けてくれた現場の力です。
数字の背景にある一人ひとりの努力を、
高く評価しています。
内部施策は概ね計画どおり進捗し、価格適正化やコスト改善によって収益性は向上しました。一方、
外部環境の変化により、一部の新規受注・開発案件は当初想定した成果を得るには至りませんでした。
これらについては施策の追加・見直しを進め、着実に成果につなげていきます。
今後は、顧客戦略・地域戦略の根幹は維持しながら、HEVの普及や地域別の需要変動といった外部
環境の変化を踏まえ、施策の優先順位を見極めながら対応していきます。
「顧客ニーズ」
「市場性」
「自
● 高品質・高信頼性
市場性
● HEVの普及拡大
● アジア・新興国市場の成長
● 外装樹脂化の加速
● 環境規制の強化
社優位性」が重なる領域に経営資源を集中させ、生産集約による効率化と独自技術による高付加価値
化の両立を図るとともに、日本をマザーとしたグローバルな品質保証体制をさらに強化していきます。
相互理解から統合の深化へ──開発力と製造力を掛け合わせ、
シナジーを最大化する
3つが
重なる領域へ
経営資源を
集中
自社優位性
● 顧客共創型アジャイル開発
● 製造技術力
● 技術融合力
● 品質保証力
注力している高付加価値領域
高機能外装部品
軽量化・意匠性・耐久性を
兼ね備えた製品の拡大
大型外装部品
Progress toward
Sustainability
価値創造の
基盤
モジュール化・大型化対応
による付加価値向上
社会
▶
特集
Data
▶
主要財務データ
▶
主要非財務データ
▶
企業情報
IRサイト
2026年4月より、森六ReNovaおよび森六モビリティプロダクツが生産事業本部の傘下に加わりま
業績ハイライト
した。私はこの変化を、単なる組織再編ではなく、事業の可能性を大きく広げる重要な転換点と捉えて
ESGデータブック
MORIROKU 22 INTEGRATED REPORT 2026
� 員座談会�
社
現場から描くNEW VALUE
ガバナンス
環境対応製品
リサイクル、
VOC低減など
環境負荷低減に貢献
環境
▶
▶
次世代モビリティ部品
成長事業拡大と
新事業への進出
▶
有価証券報告書
事業戦略
樹脂加工製品事業
INDEX
第14次中期経営計画における成長戦略
Introduction
イントロダクション
顧客・部品領域
地域領域
顧客・部品領域の拡充
グローバル経営資源の最適化
第14次中期経営計画では、
「顧客ポートフォリオの拡充」
と
「部品ポートフォリオの拡大」を成長戦略の柱と位置づけています。森六が
近年、
自動車需要の地域ごとの偏りや顧客による生産体制の再
を推進することで、新たな価値の
編が進む中、市場環境や顧客の生産動向の変化を踏まえ、
グロー
創造と生産性向上を実現し、顧客への提供価値を高めます。
これらの取り組みを通じて、競争優位性を強化するとともに、売上機会の拡大
バルで経営資源の最適化を進めています。日本を収益基盤かつ
と収益性向上につなげていきます。
開発・品質のマザー拠点とし、北米を主力成長市場、中国を構造
培ってきた技術・製造ノウハウと、新たに拡充した部品・技術領域を融合したクロスバリュー開発
P.25
改革市場、
インド・ASEANを将来成長市場と位置づけ、
それぞれの
Progress
中長期戦略
地域が担う役割を明確にしています。
■ 顧客・部品ポートフォリオの拡充による成長機会の創出
❶ 部品・技術ポートフォリオの拡大
From Vision to
地域特性に応じて、投資・人材・技術などの経営資源配分を最
❷ クロスバリュー開発
❸ 顧客ポートフォリオの拡充
適化することで、投資効率と収益性を高め、変化に強いグローバ
ル事業基盤の構築を進めています。
こうした取り組みにより、特定
Driving Strategic
Progress
事業戦略
▶
統合報告書2026のテーマと注目ポイント
▶
森六グループの理念
▶
事業紹介
▶
価値創造プロセス
▶
360年以上続く森六「価値創造の進化」
▶
目次・編集方針
▶
社長メッセージ
▶
中期経営計画
▶
財務戦略
▶
財務・非財務ハイライト
▶
特集
▶
事業戦略
地域の需要変動に左右されにくい強靱な事業構造を構築し、
グ
部品領域※
クロスバリュー
開発
加飾技術
+
外装発泡部品
部品・技術
ポートフォリオ
環境対応技術
量産・品質保証
※部品・技術領域の拡大には、
森六ReNovaグループの部品・技術も含まれます。
新たな価値創造
×
インド・ASEAN
新規顧客の開拓
●
●
生産性向上
●
次世代モビリティメーカーの
開拓
製造融合
開発力 × 製造力
●
能力増強
中国
●
グローバル
経営資源の
最適化
向上により持続的な
競争力を確立
売上機会拡大
既存顧客基盤の強化と
新規顧客の獲得
収益性向上
●
高付加価値製品の販売拡大と
生産性向上による
利益創出
●
●
収益性向上
低
Data
●
●
●
開発マザー機能
森六グループのサステナビリティ経営
▶
取り組み報告
▶
環境
▶
社会
▶
特集
� 員座談会�
社
現場から描くNEW VALUE
技術開発
収益性
▶
主要財務データ
▶
主要非財務データ
▶
企業情報
IRサイト
品質保証
※市場成長性および収益性は、2026年3月末時点の当社認識に基づきます。
MORIROKU 23 INTEGRATED REPORT 2026
▶
ガバナンス
収益基盤
現地顧客拡大
法務・知財戦略
▶
日本
供給最適化
DX戦略
▶
生産効率向上
地域ごとの役割を明確化し、
持続的な成長と
収益性向上を実現
収益性改善
▶
DX推進加速
業績ハイライト
低
❹ 創出される価値
技術力・提案力・品質力の
●
価値創造の
基盤
主力成長市場
需要拡大
新規顧客開拓
Sustainability
北米
将来成長市場
構造改革市場
競争優位性強化
ケミカル事業
Progress toward
顧客
ポートフォリオ
樹脂加工製品事業
▶
■ グローバル事業の地域ポートフォリオ戦略
市場成長性
内外装部品
軽量化技術
既存顧客との取引拡大
ローバル全体での収益性向上と持続的な成長を目指します。
高
モジュール部品
技術融合
技術領域※
大型外装部品
顧客領域
▶
� ゾナック モビリティ事業の�
レ
M&Aによる成長戦略
高
ESGデータブック
有価証券報告書
事業戦略
樹脂加工製品事業
INDEX
こうした基盤のもと、今後はお客様との共創を通じてソリューション提案をさらに加速させることで、森
研究開発担当役員メッセージ
六ならではの競争優位性を高めていきます。
また、内装部品で培った技術を外装部品へ展開することで
適用領域を拡大し、新たな事業機会の創出につなげていきます。
意匠性・機能性・環境性能の融合で、
新たなモビリティ価値を創造します
常務執行役員
生産事業本部
開発、技術担当
研究開発テーマについては、市場や顧客ニーズ、競争優位性の観点から継続的に見直しを行い、将来
の事業機会が大きいと判断したテーマに対し重点的に経営資源を投入しています。
また、研究開発成果
を持続的な競争優位につなげるため、知的財産を重要な経営資源と位置づけ、技術開発と知財活動を
一体で推進しています。
こうした開発戦略と資源配分の継続的な最適化を通じて、持続的な成長と企業
From Vision to
価値の向上を実現していきます。
Progress
中長期戦略
■ 研究開発戦略の全体像
橋本一博
Cross Value Creates New Value 独自技術の融合による価値創造
技術開発の成果が採用につながり、
意匠性
機能性
環境性能
加飾技術の革新で
魅力的なデザインと高品質を実現
ひとにやさしい感性をカタチに
安全・快適・利便性の追求と提供
環境対応技術で持続可能な
モビリティに貢献
新たな成長への手応えを感じています
第14次中計初年度は、
「コア技術・加飾の進化/深化」
「感性アプローチによるひとにやさしい製品開
発」
「環境負荷低減技術開発」の3つを重点テーマとして研究開発を推進しました。
その結果、
これまで積
第14次中計
み上げてきた技術をもとに顧客との共同開発が進展し、一部は採用案件へと結実し始めており、新たな
成長につながる手応えを感じています。
特に加飾技術については、
日本で開発した技術が中国市場で採用されるなどグローバル展開が進展し
パーソナ
ライズ化
車内空間のリビング化
(快適な車室内空間)
開発については、人の感覚とデータの相関の検証など、技術的課題も残っていますが、将来の競争優位
性の源泉となる重要テーマとして評価技術の高度化とデータ蓄積を進めています。
当社の開発戦略の根幹にあるのは、
「意匠性」
「機能性」
「環境性能」
を融合した価値創造です。自動
エクステリア
価値向上
電動化・
ソフトウェア化
●
●
●
●
快適性/五感/感性
加飾範囲拡大
多様な着座姿勢への
対応
シームレス/ノイズレス
●
●
●
●
グレードマネジメント
加飾部の着せ替え
構造
部品・設計の共通化
●
●
●
停車中の価値創造
●
内装加飾の外装転用
環境性能・機能性の
付与、
軽量化
価値分析による
コスト最適化
デザインへの貢献
●
●
●
省電力化・軽量化・
部品点数削減
薄型化・小型化
デバイス提案から
モジュール提案へ
マーケティング
による価値探索
環境対応
技術の強化
サーキュラーエコノミー
(資源循環・脱炭素化)
●
●
●
●
ELV/3R法対応
再生プラスチック
事業紹介
▶
価値創造プロセス
▶
360年以上続く森六「価値創造の進化」
▶
目次・編集方針
▶
社長メッセージ
▶
中期経営計画
▶
財務戦略
▶
財務・非財務ハイライト
▶
特集
▶
事業戦略
樹脂加工製品事業
価値創造の
基盤
DX戦略
▶
法務・知財戦略
▶
森六グループのサステナビリティ経営
▶
取り組み報告
環境配慮素材の
意匠化
▶
環境
▶
社会
▶
特集
ガバナンス
Data
開発・設計
プロセスの高度化
グローバル
開発体制の強化
▶
主要財務データ
▶
主要非財務データ
▶
企業情報
IRサイト
MORIROKU 24 INTEGRATED REPORT 2026
市場・顧客ニーズを
捉え、
開発テーマを
創出
環境材料開発と
リサイクル
(材料・構造)
の最適化
� 員座談会�
社
現場から描くNEW VALUE
▶
推進しています。
設計開発面でも、
グループ全体の技術領域が広がり、
開発能力も拡充しており、
今後は、
日
オープンイノベーション
による次世代製品開発
� ゾナック モビリティ事業の�
レ
M&Aによる成長戦略
▶
モノマテリアル
する多様な部品を組み合わせることで、製品バリエーションと提案領域を広げる
「クロスバリュー開発」
を
本・米国・中国・タイの開発拠点を有機的に連携させながら、
グローバルかつグループ横断的な開発体制
森六グループの理念
▶
ケミカル事業
開発基盤(開発力・提案力強化)
共創による
テーマ創出
統合報告書2026のテーマと注目ポイント
▶
▶
Sustainability
な顧客価値を創出する開発へと進化しています。
大きく拡大しました。各社が有する材料・加飾・環境対応・軽量化の各技術と、大型外装部品をはじめと
事業戦略
▶
▶
車業界が大きな変革期を迎える中、個別の技術開発にとどまらず、技術同士を掛け合わせることで新た
さらに、
2026年4月より森六ReNovaおよび森六モビリティプロダクツがグループに加わり、
開発領域は
Progress
Progress toward
す。環境負荷低減技術については、内閣府が主導する戦略的イノベーション創造プログラム
(SIP)にも参
画し、
リサイクル材活用技術の実用化に向けた検証を進めています。一方で、感性アプローチによる研究
Driving Strategic
重点開発テーマ
ました。
また、高機能ホットスタンプ技術についても外装部品への適用に向けた共同開発が進んでいま
を強化していきます。
Introduction
イントロダクション
設計リソース拡充と
効率的な設計・開発
手法の構築
グローバル連携と
知財戦略の推進
業績ハイライト
ESGデータブック
有価証券報告書
事業戦略
樹脂加工製品事業
INDEX
開発領域
Introduction
イントロダクション
森六ReNova株式会社との技術融合
森六ReNovaグループの参画を機に、各社が保有する技術や製
■ エクステリア価値向上提案モデル(バックドア/コンセプトモデル)
エクステリア価値向上提案モデル
――コンセプトは
「内のやさしさを、外の美しさへ」
品を融合した
「クロスバリュー開発」
を推進しています。
これまで当社
「車内空間のリビング化」
をテーマに培ってきた心地よい空間づ
グループで量産実績のなかった外装発泡成形品やバックドア、バン
くりの知見を車外へと拡張し、
「内のやさしさを、外の美しさへ」を
パーフェイシアが新たにラインナップへ加わることで、
軽量化と高剛
コンセプトとした外装加飾提案モデルを製作しました。見る・触れる
性を実現する素材・設計技術の強化を図ります。
ことでやさしさや心地よさを感じられる新たな外装デザインを提案
さらに、森六ReNovaグループが有する外装発泡技術と当社の加
し、車両の魅力向上を目指しています。本モデルでは、バックドアの
飾技術を融合することで、軽量化と高いデザイン性を両立した新た
広い面積を活用し、多様な加飾技術を搭載することで外装部品の
な製品提案が可能となります。
付加価値向上を図っています。
環境負荷低減と高意匠化を両立する
また、双方が保有する補完性の高い製品ラインナップを活用する
外装フィルム加飾や、多品種少量生産に対応し、局所的なデザイン
ことで、お客様への提案領域を拡大し、
クロスバリュー開発による新
表現を可能とするインクジェット塗装加飾など、次世代の加飾技術
たな価値創造とビジネス機会の拡大を推進していきます。
を組み合わせました。
これらの提案を通じて、お客様のブランド価
値向上や商品差別化に貢献するとともに、新たな事業機会の創出
■ クロスバリュー開発による新たな価値創出
と収益拡大を目指しています。
多層成形+LED加飾
●
透明材の奥行感と光による表現
外装フィルム加飾
●
●
高輝度メッキ調塗装
裏面塗装によるフラットな
エンブレム表現
● 外装部品とエンブレムが
一体となる意匠
●
溶剤排出・乾燥工程削減
印刷による多様な意匠柄
インクジェット塗装加飾
●
●
グレード展開に対応
触感あるグラデーション
高延伸ホットスタンプ+
シボ加飾
グレードマネジメント可能
● 独自の高延伸箔で深絞り形状にも追従
●
Driving Strategic
Progress
ホットスタンプ+
LED加飾
●
配慮材料の開発を進めています。環境配慮材料を自動車内装部品へ適用するにあたっては、剛性と耐衝撃性の両立が課題となりますが、添加
剤や部品形状の最適化を通じて性能向上を図っています。
さらに、
自動車メーカーからは、環境配慮材料ならではの特徴を外観意匠として表現
● 次世代モビリティへの展開
・環境技術を
加飾
電装
● 軽量
(ユニット)
● 材料
(リサイクル)
●
●
クロスバリュー開発
● 成形 ● 塗装 ● 組立
事業紹介
▶
価値創造プロセス
▶
360年以上続く森六「価値創造の進化」
▶
目次・編集方針
▶
社長メッセージ
▶
中期経営計画
▶
財務戦略
▶
財務・非財務ハイライト
▶
特集
▶
事業戦略
▶
●
モジュール化
(バックドア)
● 軽量
(発泡)
コーティング
● 材料
(コンパウンド)
●
New MORIROKU
食品製造工程で発生する
廃棄卵殻を再資源化し、
炭酸
カルシウムの代替資源として
活用。天然素材の粒子が生
み出す自然感のある質感を
原料となる卵殻
食品製造工程で発
生する赤玉・白玉の
卵殻を回収・再資源
化しています。
活かし、多彩な意匠表現の
実現を目指します。
MORIROKU 25 INTEGRATED REPORT 2026
樹脂加工製品事業
ケミカル事業
▶
Progress toward
Sustainability
価値創造の
基盤
DX戦略
▶
法務・知財戦略
▶
森六グループのサステナビリティ経営
▶
取り組み報告
■ 卵殻配合材を使用したインパネ加飾パネル
森六ReNova
グループの強み
� ゾナック モビリティ事業の�
レ
M&Aによる成長戦略
▶
形金型や成形条件の最適化による安定生産の確立に向けて取り組んでいます。
材料・加飾・部品
融合した価値創造
森六グループの理念
▶
することも求められています。
そこで、卵殻配合材に着色マイカ
(雲母)
を組み合わせることで、多彩な意匠表現を可能とするとともに、射出成
● 新市場・新領域への参入
森六の強み
事業戦略
統合報告書2026のテーマと注目ポイント
▶
エンブレムや車名ロゴの
新表現
当社は、天然素材ならではの意匠性と環境性能を両立する製品の提案を目指しており、
その具体例として、廃棄される卵殻を活用した環境
● 既存顧客ビジネスの拡大
Progress
中長期戦略
意匠性と環境性能を両立する材料開発
成長の三本柱
From Vision to
▶
▶
環境
▶
社会
▶
特集
� 員座談会�
社
現場から描くNEW VALUE
ガバナンス
▶
Data
卵殻配合材の断面
着色したマイカ材が
均一に分散し、自然
感のある質感と高意
匠性を実現します。
資源の有効活用
廃棄される卵殻を再
資源化し、循環型社会
の実現に貢献します。
高い意匠性と機能性
自然感のある表情と優れた耐
久性により、快適で上質な車
室内空間の実現を目指します。
▶
主要財務データ
▶
主要非財務データ
▶
企業情報
IRサイト
業績ハイライト
ESGデータブック
有価証券報告書
事業戦略
樹脂加工製品事業
高品質な製品を実現する一貫生産体制
関連部署が迅速に情報を共有し、
部門横断で連携することで、
強固な技術ネットワークを構築しています。
営
業段階から開発・生産技術・品質保証部門が参画し、
お客様のニーズや課題を的確に把握します。
その上で、
最適品質とコスト競争力を両立し、
高付加価値の創出を通じて、
お客様からの信頼獲得につなげています。
Introduction
イントロダクション
日本と現地が一体で築く製造・品質基盤
グローバル新機種の北米先行量産立ち上げに際し、製造・品
質の両面から現地支援を実施しています。工程設計段階から現
■ 一貫生産体制による価値創造
❶ 一貫生産体制(部門横断連携)で、迅速な情報共有・課題解決・最適化
営業
Topic 北米での新機種立ち上げ
INDEX
開発・設計
生産技術
❸ お客様の信頼獲得
地メンバーと連携し、
リスクの早期抽出と対策を推進しています。
不具合の未然防止と安定した立ち上げを図るとともに、
製造ノウ
ハウや品質管理手法の標準化、人材育成を通じてグローバルな
品質保証
製造力・品質力の向上に取り組んでいます。
From Vision to
Progress
中長期戦略
工場
❷ 一貫生産体制が創出する価値
最適品質
コスト競争力
高付加価値
顧客・地域ニーズに応じた
品質を実現
生産効率向上と
最適な設備投資
顧客の競争力向上と
差別化されたものづくり
お客様と長期的な
パートナーシップを築き、
持続的な成長を実現
製造・品質担当役員メッセージ
ています。金型や専用治具、設備仕様を社内で緻密に設計・検証
し、計画段階から量産を見据えた体制を構築しています。設計
フェーズでは、図面だけでなく現物を確認し、精度・生産性の両面
から仕様を最適化しています。量産フェーズでは、国内外の工場へ
の技術移管や、熟練技術者による立ち上げ支援を行っています。
これにより、
グローバルで均一な品質と高い生産効率を実現し、
Progress
品質基盤の融合と進化で、
事業戦略
第14次中計の重点施策
● 新機種におけるグローバル横
断連携、
コンカレント開発力の
強化
● ツールの熟成力向上
● 環境負荷低減と生産性向上を
両立する技術・設備の具現化
● 次世代スペシャリストの育成
執行役員
生産事業本部
製造・品質担当
客信頼の向上に取り組んでいます。各種試験設備を活用した信頼
性試験や品質評価を通じて原理検証を行い、潜在的な課題を早期
に抽出するとともに、改善策の立案・実践につなげる体制を構築し
ています。
こうした取り組みにより、不具合の未然防止と品質リスク
の低減を図り、顧客満足度のさらなる向上を目指しています。
事業紹介
▶
価値創造プロセス
▶
360年以上続く森六「価値創造の進化」
▶
目次・編集方針
▶
社長メッセージ
▶
中期経営計画
▶
財務戦略
▶
財務・非財務ハイライト
▶
特集
▶
事業戦略
▶
第14次中計の初年度は、製造・品質保証の両面で基盤強化に取り組みました。生産面では、適正な要
員配置の重要性を改めて認識し、国内では作業支援カメラの導入により検査品質の安定化と検査工数
削減を両立するなど、一定の成果を上げることができました。一方で、中国・インドネシア市場の低迷や北
第14次中計の重点施策
● グローバルでの
「再発不具合
ゼロ」
● 多言語対応マニュアルの整備
による海外拠点における作業
習熟度の向上
● 製造監視データを活用した不
具合の未然防止
� ゾナック モビリティ事業の�
レ
M&Aによる成長戦略
樹脂加工製品事業
ケミカル事業
▶
水谷英樹
Progress toward
Sustainability
価値創造の
基盤
▶
DX戦略
▶
法務・知財戦略
▶
森六グループのサステナビリティ経営
▶
取り組み報告
米市場におけるBEV需要動向の変化、中東情勢など外部環境の変化への対応は想定以上に難しく、柔
軟で変化に強い製造・品質保証体制の必要性を強く認識した1年でもありました。品質保証体制につい
せるため、外部コンサルタントも活用しながら業務プロセスや設計・品質保証フローを見直し、複数の自
品質保証を経営基盤の一つと位置づけ、市場品質の安定化と顧
森六グループの理念
▶
ては、IATF 16949認証の維持にとどまらず、品質マネジメントシステムをより実効性のあるものへ進化さ
お客様から信頼されるものづくりを支えています。
品質保証
統合報告書2026のテーマと注目ポイント
▶
グローバル競争力をさらに高めていきます
生産技術
高精度かつ安定したものづくりを支える生産技術力を強みとし
Driving Strategic
▶
▶
環境
▶
社会
▶
特集
� 員座談会�
社
現場から描くNEW VALUE
ガバナンス
▶
Data
▶
主要財務データ
第14次中計2年目以降は、当社と森六ReNovaグループとの融合を加速させながら、重要テーマとして
▶
主要非財務データ
品質方針や品質判断基準の統一に取り組みます。双方の検査基準・品質レベルを共通化し、一貫した製
▶
企業情報
動車メーカーに対応できるよう、標準化と仕組みづくりを推進しました。
品品質を維持することで、お客様から信頼される品質基盤の構築を目指します。
また、部門長レベルでの
PMI検討を通じて、生産体制や業務機能の最適化を進めるとともに、双方の強みを活かしたシナジー創
IRサイト
出にも注力します。
さらに、北米での新機種立ち上げにおいては、生産技術部門と連携しながら品質リス
業績ハイライト
クの低減と設備能力の最適化を図り、持続的な品質競争力の強化につなげていきます。
ESGデータブック
MORIROKU 26 INTEGRATED REPORT 2026
有価証券報告書
事業戦略
ケミカル事業
INDEX
市場環境
機会
● 半導体・電機電子市場を中心とした高機能材
化学分野における
「商社事業」
と
「ものづくり事業」
を展開しています。
人と人、
人とモノをつなぎ、
● 中国メーカーをはじめとする価格競争の激化
● インド・ASEANを中心とした新興国市場の成長
顧客や社会が抱える課題の解決に向け、
グループの総合力を活かして挑戦を続けています。
イントロダクション
● 原材料・物流コストの高騰
料需要の拡大
グループ各社の技術やアイデアを結集することで、
化学の力による
「新たな価値」
を創出します。
Introduction
リスク
● 地政学リスクや景気変動による需要の変動
● 脱炭素化・環境対応を背景とした高付加価値
製品の需要拡大
From Vision to
基本戦略
事業の強み
強み1 商社としての知見
360年を
超える業歴
12か国に広がるネットワークを通じ、
基本戦略①
地域の市場・顧客ニーズを先取り
森六グループ グローバルネットワーク
https://www.moriroku.co.jp/network/
四国化工
化学品の
製造受託
五興化成工業
財務目標と実績
低温粉砕
アイ・エム・
マテリアル
食品関連・
農業資材・
農産物の販売
森六アグリ
押出成形品の
製造
中部化学・
M&Cテック
※2026年
3月末時点
将来の製品化に向けた開発の推進
グローバル事業の拡大
ものづくり事業拡大による付加価値創造
外部環境を捉え、
資源を投入すべきエリアを明確化し、
スピード感を持った展開
自動二輪
外装部品の製造
(ファブレス)
製造委託先
最新情報:業績ハイライト
※2022年3月期より
「収益認識に関する会計基準」
を適用しています。
(百万円)
(百万円)
2,000
30,000
0
5.3
27,055 29,759 26,898 26,070 25,458 25,600
18.3期 19.3期 20.3期 21.3期 22.3期 23.3期 24.3期 25.3期 26.3期 27.3期
(期初計画)
(注)2022年3月期以降は「収益認識に関する会計基準」
を適用しており、当該基準に
基づいています。
1,000
1,382
2.1
1,177 1,215
1.8
1.9
事業戦略
(%)
8.0
6.1
5.7
1,389 1,836 1,575 1,538
6.3
4.7
1,235
森六グループの理念
▶
事業紹介
▶
価値創造プロセス
▶
360年以上続く森六「価値創造の進化」
▶
目次・編集方針
▶
社長メッセージ
▶
中期経営計画
▶
財務戦略
▶
財務・非財務ハイライト
▶
特集
▶
ケミカル商社として
優位性のある分野においての
付加価値創造
1,544 1,600
2.2
0
6.0
4.0
60,000
30,000
2.0
0.0
18.3期 19.3期 20.3期 21.3期 22.3期 23.3期 24.3期 25.3期 26.3期 27.3期
(期初計画)
※一社化に伴い、2026年3月期より本社費用のセグメントへの配分方法を変更しています。
MORIROKU 27 INTEGRATED REPORT 2026
■ 国内
Progress toward
Sustainability
価値創造の
基盤
DX戦略
▶
法務・知財戦略
▶
森六グループのサステナビリティ経営
▶
取り組み報告
0
■ 海外
75%
25%
75%
23%
77%
樹脂加工製品事業
ケミカル事業
▶
環境
▶
社会
▶
特集
� 員座談会�
社
現場から描くNEW VALUE
ガバナンス
▶
Data
25%
事業戦略
▶
https://www.moriroku.co.jp/ir/financial̲information/highlight/index.html
(百万円)
� ゾナック モビリティ事業の�
レ
M&Aによる成長戦略
▶
■ケミカル事業地域別売上高・構成比推移(国内・海外)※
営業利益率(右軸)
6.8
63,844 62,155
Progress
統合報告書2026のテーマと注目ポイント
▶
▶
改善すべき文化・体質を破壊し、
スピード及びスケール感をもって新たな企業文化を創造する
■ケミカル事業営業利益・営業利益率推移 ※
67,178 67,222
Driving Strategic
“破壊と創造”
(外部パートナー)
■営業利益(左軸)
基本戦略②
主力事業の更なる利益追求
■ケミカル事業売上高推移
60,000
中長期戦略
ケミカル領域において、“営業利益”を追求するグローバル企業となる
強み2 グローバ ルなビジネス展開
強み3 独自技術を持つ関係会社のネットワーク
共押出
多層フィルムの
製造・販売
Progress
▶
26%
74%
44%
49%
46%
44%
43%
45%
56%
51%
54%
56%
57%
55%
18.3期 19.3期 20.3期 21.3期 22.3期 23.3期 24.3期 25.3期 26.3期 27.3期
(期初計画)
※各棒の内側に記載された数値は、
当該年度の売上高に占める地域別割合を示しています。
▶
主要財務データ
▶
主要非財務データ
▶
企業情報
IRサイト
業績ハイライト
ESGデータブック
有価証券報告書
事業戦略
ケミカル事業
INDEX
2026年4月には、森六ReNova・森六モビリティプロダクツ(日本・タイ)が生産事業本部の傘下に加
ケミカル事業本部長メッセージ
わりました。各社が使用する樹脂材料の供給をケミカル事業本部が担うなど、多角的に連携を図ること
「破壊と創造」の実践とともに、
グローバ ル・ものづくりで
で、
グループシナジーを創出し、売上・利益の拡大につなげていきます。
変革する組織文化と人材の成長が、持続的な利益拡大の原動力
第14次中計の土台として重視するテーマ「破壊と創造」のもと、人材・組織・事業運営の面でも変化
さらなる成長を目指します
の兆しが着実に表れてきています。
「グローバル・ものづくり強化」
という経営の方向性は若手・中堅社
員を中心に浸透しつつあり、海外出張・赴任機会の拡大やものづくり子会社を活用したビジネス展開
は、着実に進んでいます。
専務執行役員
ケミカル事業本部長
文字英人
動的な人材の育成と企業文化の変革を後押ししています。商社というビジネスにおいては、人材こそが
が、営業利益の向上に直結します。
グループ内外の皆さまから信頼される人材を育成することを通じ
課題を糧に、
グローバルとものづくりで次の成長へ
第14次中計の初年度である2026年3月期は、売上高は254億円(前期比2.3%減)、営業利益は15億
りました。
「グローバル事業の拡大」
と
「ものづくり事業拡大による付加価値創造」
という二つの重点戦
略のもと取り組みを進め、課題が残る一方、次の成長につながる手応えも得た一年となりました。
国内商流ビジネスは自社で価格をコントロールできる余地が限られるため、価格主導権を握れる貿易
を主体とした「グローバル事業の拡大」
を目指しています。
インド事業が順調に伸長した一方、日系自動
車メーカーの需要低迷を背景とした中国事業の落ち込みをカバーするには至らず、全体としては計画を
下回る結果となりました。引き続きインド事業を中核に据えながら、次の展開としてアフリカ市場への参
入も視野に入れ、
「グローバル事業の拡大」
を着実に進めていきます。
一方、
「ものづくり事業拡大による付加価値創造」
では、
五興化成工業が通期の営業利益計画を達成し、
収益力回復への確かな手応えを得ることができました。
四国化工についてはメディカル市場での競合激化
という難しい局面にありましたが、
技術提携等を通じた海外展開により新たな成長機会を見出しています。
重点戦略②
グローバル事業の拡大
ものづくり事業拡大による付加価値創造
価格主導権を握れる貿易を主体に、
グローバル事業を拡大
収益力の回復と高付加価値の創出により、
事業拡大を推進
インド事業が順調に成長
海外事業基盤の拡大
Progress
中長期戦略
Driving Strategic
Progress
事業戦略
▶
統合報告書2026のテーマと注目ポイント
▶
森六グループの理念
▶
事業紹介
▶
価値創造プロセス
▶
360年以上続く森六「価値創造の進化」
▶
目次・編集方針
▶
社長メッセージ
▶
中期経営計画
▶
財務戦略
▶
財務・非財務ハイライト
▶
特集
▶
て、短期・中期・長期にわたって持続的に利益を拡大し、
ステークホルダーの皆さまへの還元を実現して
円(一社化に伴う本社費用の配分方法変更の影響を調整した比較可能ベースで前期比14.1%減)
とな
2025年度の
成果・手応え
From Vision to
また、経営層が交代で講師を務める研修を通じて、知見・経験を次世代へ継承するとともに、
より能
事業推進の根幹です。原価低減には一定の限界がある以上、売上の拡大とそれを支える人材の成長
重点戦略①
Introduction
イントロダクション
2025年度の
成果・手応え
四国化工は海外展開により
新たな成長機会を創出
Topic 対話で紐解く「破壊と創造」
問いを共有することが、変革の起点になる
第14次中計が掲げる
「営業利益を追求するグローバ
ル企業」の実現に向け、事業本部長自らが各拠点に足
ケミカル事業
▶
Progress toward
Sustainability
価値創造の
基盤
DX戦略
▶
法務・知財戦略
▶
森六グループのサステナビリティ経営
▶
取り組み報告
は、競合他社の売上高や営業利益、一人当たり生産性
正確に知る」
ことを出発点としています。
大阪支店でのタウンホールミーティング
(2025年7月)
キーワードは
「破壊と創造」。
これまでのやり方や考え方を見直し、新たな価値を生み出す企業
け声で終わらせず、新たな価値創造につなげる取り組みが進んでいます。
MORIROKU 28 INTEGRATED REPORT 2026
環境
▶
社会
▶
特集
� 員座談会�
社
現場から描くNEW VALUE
ガバナンス
Data
意見を交わすことが欠かせません。対話の場では、
「本当にこれで良いのか」
という問いから議論
トップと現場が同じデータを見ながら課題や改善の方向性を共有することで、
「破壊と創造」
を掛
▶
▶
文化を築いていく取り組みです。
その実現には、一方的な指示ではなく、現場と経営層が率直に
が始まり、事業運営や顧客評価など幅広いテーマについて活発な意見交換が行われています。
樹脂加工製品事業
▶
を運び、現場社員との直接対話を重ねています。対話で
などの客観的なデータを共有し、自分たちの「現在地を
事業戦略
▶
まいります。
� ゾナック モビリティ事業の�
レ
M&Aによる成長戦略
▶
主要財務データ
▶
主要非財務データ
▶
企業情報
IRサイト
業績ハイライト
ESGデータブック
有価証券報告書
事業戦略
ケミカル事業
INDEX
第14次中期経営計画における成長戦略
Introduction
イントロダクション
第14次中計では、ケミカル領域において、“営業利益”を追求するグローバル企業となることを目指して、
「グローバル事業の拡大」
と
「ものづくり事業拡大による付加価値創造」
を重点戦略とし、その基盤となる“破壊と創造”を通じて、持続的な利益成長を追求しています。
グローバル事業の拡大
インド
エリア別戦略
アフリカ・欧州
ASEAN
ケミカル事業では、地域ごとの市場環境や顧客
主力の合成樹脂事業の基盤強化を進めるとと
アフリカでは、自動車向け樹脂や塗料関連を切
地域密着型の営業活動と販売ネットワークの
ニーズを踏まえ、海外拠点やグループ会社との連
もに、新たに化学品の輸出入を開始し、事業領域
り口とした化学品ビジネスの展開を進めています。
強化を進めています。
マレーシアでは半導体向け
携を強化しながら、新たな事業機会の創出と収益
を拡大しています。
また、半導体用材料やバッテ
欧州では、
ドイツ拠点を活用した営業活動に加え、
化学品事業の調査・検討を進めるなど、新たな事
基盤の強化に取り組んでいます。既存事業のさら
リー用原料の現地サプライヤーの開拓を進め、事
北アフリカおよび南アフリカ向けの合成樹脂ビジ
業機会の創出に取り組み、地域特性を活かした事
なる拡大や高付加価値製品の開発を通じて、持続
業機会の創出に取り組んでいます。高付加価値製
ネスなどを通じて、新たな市場開拓と事業拡大に
業基盤の強化を図っています。
的な企業価値の向上を目指します。
品の開発を通じて、収益性の向上を図ります。
取り組んでいます。
■ グローバル事業の拡大とものづくり事業を一体で推進
グローバル事業の拡大
ものづくり事業拡大による付加価値創造
中国エリア
欧州
ドイツ拠点の設立・拡大、
現地法人化
事業、体制を見
直し、
他エリアへ
資源シフト
電子・自動車・医療等の
分野への新規開発に伴う
海外進出
(技術提携含む)
カーボンナノチューブ
コンパウンド
推進プロジェクト
ケミカル合成事業拡大
溶剤反応領域の受託拡大
開発・営業体制の強化
分散技術を活かした
用途探索・製品開発
(低硬度シリコーン、
発熱シート、
半導電材等)
ASEAN+1
未進出エリアの開拓
(アフリカ等)
マレーシア、
ベトナム等
のASEAN各国に加え、
インドへ注力
外‑外ビジネス
各エリア連携強化、
担当部門以外の
ビジネスマッチングも推進
東南アジア経済圏における
ビジネスのさらなる拡充へ
ASEANの主要拠点が参加する
「ASEAN Global Meeting」
を定期開催し、成長戦略や市場動向、顧客ニーズに関する
四国化工
五興化成工業
Topic ASEAN Global Meeting
知見を共有しています。拠点間の連携を強化することで、成
From Vision to
Progress
中長期戦略
Driving Strategic
Progress
事業戦略
森六グループの理念
▶
事業紹介
▶
価値創造プロセス
▶
360年以上続く森六「価値創造の進化」
▶
目次・編集方針
▶
社長メッセージ
▶
中期経営計画
▶
財務戦略
▶
財務・非財務ハイライト
▶
特集
▶
事業戦略
樹脂加工製品事業
ケミカル事業
▶
Progress toward
Sustainability
価値創造の
基盤
DX戦略
▶
法務・知財戦略
▶
森六グループのサステナビリティ経営
▶
取り組み報告
▶
環境
▶
社会
▶
特集
思決定を実現し、第14次中計の達成に向けたグローバル経
ガバナンス
Data
▶
主要財務データ
▶
主要非財務データ
▶
企業情報
IRサイト
付加価値のある機能材料の開発
ASEAN Global Meeting
(2025年12月)
� 員座談会�
社
現場から描くNEW VALUE
▶
営基盤の強化を推進しています。
● 化学品開発領域
� ゾナック モビリティ事業の�
レ
M&Aによる成長戦略
▶
長著しいASEAN市場における事業機会の創出と迅速な意
● 樹脂材料開発領域
MORIROKU 29 INTEGRATED REPORT 2026
統合報告書2026のテーマと注目ポイント
▶
▶
ものづくり事業推進室
アップサイクル自社製品の開発
機能性化粧品市場の開拓
▶
業績ハイライト
ESGデータブック
有価証券報告書
事業戦略
ケミカル事業
INDEX
グローバル事業の拡大
電機電子分野担当役員メッセージ
半導体・電機電子分野における成長機会の獲得に向けた体制強化
森六グループは、安定した需要が見込まれるモビリティ分野を収益基盤としつつ、
さらなる市場拡大が期待さ
れる半導体・電機電子分野を成長領域と位置づけています。
こうした事業環境を踏まえ、同分野を担当するモビ
リティ部(東京エリア)の組織体制を再編しました。専門性を高めた営業体制の構築と人材配置の最適化により、
顧客ニーズへの対応力
を強化し、高付加価値商
■ モビリティ分野、半導体・電機電子分野の両輪での成長
材の拡販や新規商流の
獲得を推進します。今後
経営資源を最適に配分し、
両輪での成長を加速
も成長市場に経営資源
を重点投入し、持続的な
収益拡大と企業価値向
上を目指します。
モビリティ分野
収益基盤
安定した需要が見込まれる
収益基盤として強化
人材・ノウハウ
投資・技術・情報
半導体・電機電子の成長を
日韓のネットワークで支える
執行役員
ケミカル事業本部電機電子分野担当
Moriroku Chemicals Korea Co., Ltd. 社長
持続的な収益拡大に貢献
Introduction
イントロダクション
From Vision to
鄭炅喆
Progress
中長期戦略
半導体・電機電子分野は、当社ケミカル事業の成長を牽引する重要な戦略領域です。特に半
半導体・電機電子分野
導体市場は、AI、
データセンター、車載電子機器の進化を背景に、継続的な拡大が見込まれてい
成長分野
ます。韓国は世界有数の半導体生産拠点であり、当社の韓国拠点は市場・顧客に最も近い立場
さらなる市場拡大が期待される
成長分野として注力強化
で情報を捉え、顧客と日本の優れた技術や素材を結びつける役割を担っています。私はこの日韓
Driving Strategic
Progress
事業戦略
▶
統合報告書2026のテーマと注目ポイント
▶
森六グループの理念
▶
事業紹介
▶
価値創造プロセス
▶
360年以上続く森六「価値創造の進化」
▶
目次・編集方針
▶
社長メッセージ
▶
中期経営計画
▶
財務戦略
▶
財務・非財務ハイライト
▶
特集
▶
両国のネットワークを活かし、新たな事業機会の創出と持続的な成長を推進していきます。
ものづくり事業拡大による付加価値創造
の顧客の関心が高まり、多くの評価案件や新規商談につながりました。一方で、品質認定やサプ
DX戦略
▶
法務・知財戦略
▶
森六グループのサステナビリティ経営
▶
取り組み報告
グループ会社である四国化工では、顧客のグローバル展開を成長機会と捉え、
インド市場における事業機会
今後も、半導体・電機電子分野を重点領域とし、
より付加価値の高い提案活動を推進していき
の創出に向けた検討を進めています。国内市場では人口動態の変化などを背景に中長期的な市場環境の変化
ます。単なる商材販売ではなく、顧客ごとの課題や開発テーマに寄り添ったソリューション提案
が見込まれる一方、海外市場では医療インフラの整備や医薬品需要の拡大に伴い、輸液バッグ向け高機能フィ
を強化していく方針です。
また、
韓国の合弁会社であるNAMO Chemicalでは、
リチウムイオン電池
ルムの需要拡大が期待されています。
(LIB)の発火防止補助材料の開発・製造を中心に事業基盤の構築を進めています。当社が化学
業展開の可能性を追求しています。
あわせて、
ケミカル事業のインド
拠点を活用し、
フィルム原料や医療・包装材関連商材の提案活動を
強化することで、事業領域の拡大と新たな事業機会の創出を目指し
ます。
さらに、
インド西部エリアにおける医療分野・包装材事業への
展開も視野に入れるとともに、将来的にはASEANおよびアフリカ地
■ インド西部への展開を強化
ケミカル事業
▶
▶
うした状況下でも日韓連携を強化し、中長期的な成長につながる案件を着実に進めました。
こうした事業環境を踏まえ、
日系品質を維持した製品供給体制の構築を視野に入れながら、海外市場での事
樹脂加工製品事業
進めました。AI関連需要の拡大を背景に、先端半導体材料や半導体パッケージング関連材料へ
ライチェーン管理に求められる水準は一層厳しくなり、市場参入のハードルも高まっています。
こ
高付加価値フィルム技術のインド・ASEAN展開
事業戦略
▶
2025年度は第14次中計の初年度として、半導体・電機電子分野を中心に事業基盤の強化を
� ゾナック モビリティ事業の�
レ
M&Aによる成長戦略
Progress toward
Sustainability
価値創造の
基盤
品商社として培ってきたグローバルネットワークと情報力を活かし、新たな価値創出と事業拡大
に取り組んでいきます。
Moriroku Chemicals
India Pvt. Ltd.
デリー
環境
▶
社会
▶
特集
ガバナンス
▶
Data
主要財務データ
の変化が非常に速く、柔軟かつ迅速な対応が必須
▶
主要非財務データ
です。だからこそ、変化を前向きに捉えて挑戦し続
▶
企業情報
け、お客様に信頼されるビジネスパートナーとして
IRサイト
域へのフィルム販売拡大も見据えながら、
グループ一体となって持
新たな価値を提案していきます。今後も日韓の架け
続的な成長につながる事業基盤の構築に取り組んでいきます。
橋として、社内メンバーとともに専門性を高め、持
業績ハイライト
続的な成長と企業価値向上に貢献してまいります。
ESGデータブック
NAMO Chemicalのパイロットプラント完成
(2025年10月)
MORIROKU 30 INTEGRATED REPORT 2026
� 員座談会�
社
現場から描くNEW VALUE
▶
半導体・電機電子業界では技術革新や市場環境
森六ケミカルズインド拠点
▶
有価証券報告書
事業戦略
ケミカル事業
INDEX
ものづくり事業拡大による付加価値創造
Introduction
イントロダクション
CNTコンパウンドの事業化加速
高分散カーボンナノチューブを用いた製品開発
カーボンナノチューブ(CNT)は、炭素原子が六角形に結びついたグラフェンシートが、
チューブ状に巻
CNTコンパウンド事業は、第13次中計における片野ケミカルズ株式会社との共同研究開始とCNT
かれたナノ構造体です。卓越した導電性・熱伝導性・機械的強度を持ち、次世代の高機能材料として注目
分散技術の獲得を経て、2025年度はカーボンブラックの代替や導電シリコーン用途など、複数テーマを
されています。
その一方で、凝集しやすく分散が難しいという課題があり、本来の性能を発揮するには高
検証しました。今後は、
キャリアテープ(半導体や電子部品を収納・搬送する包装テープ)用途における
度な分散技術が必要です。
技術・コスト両面での競争力強化を図り、事業化を本格的に加速させる段階へと移行します。
当社では、独自の分散技術により、凝集を抑制し、成形時に扱いやすい高性能なCNTコンパウンドを
開発しました。電子部品の導電材料、電磁波シールド材、発熱シートなど幅広い分野への応用を目指し
て、素材提供と製品開発サポートに取り組んでいます。
From Vision to
■ CNT事業への取り組み変遷
第13次
中計
森六の強み
● 幅広い種類の樹脂やゴムにCNT混練が可能
● 独自の配合技術により、
少量添加でCNTの性能を最大限に活用するコンパウンドを開発
● カーボン粒子の飛散や色移りがなく、
作業環境に配慮
2025年度
● 素材の優位性を引き出す製品開発を、
企画から製造まで一貫して支援
高分散CNTをさまざまな産業分野へ応用
Progress
2026年度
以降
技術獲得・
用途探索スタート
多角的に検証
事業化の見極め
重点用途へ
集中
中長期戦略
● 片野ケミカルズとの共同研究を開始
● CNT分散技術を獲得
● 森六グループの新規事業の種を形成
Driving Strategic
● カーボンブラックの代替、
導電シリコーン用途など
事業戦略
複数用途を検証
● 電磁波シールド材、
静電防止袋なども評価
● 量産化・実績化には課題が残存
Progress
● 片野ケミカルズとの関係を深化
キャリアテープ市場への展開
統合報告書2026のテーマと注目ポイント
▶
森六グループの理念
▶
事業紹介
▶
価値創造プロセス
▶
360年以上続く森六「価値創造の進化」
▶
目次・編集方針
▶
社長メッセージ
▶
中期経営計画
▶
財務戦略
▶
財務・非財務ハイライト
▶
特集
▶
【ヘルスケア領域など】
面状発熱シート
導電シリコーン
ケミカル事業
▶
Progress toward
Sustainability
価値創造の
基盤
DX戦略
▶
法務・知財戦略
▶
森六グループのサステナビリティ経営
▶
取り組み報告
重点領域と位置づけ、専任営業体制のもと日本および東アジア地域での拡販活動を推進しています。
片野ケミカルズとの共同開発による製法は、少量添加でも均一な分散性を実現し、導電性の向上と
ダマの抑制を両立できます。
この優位性はキャリアテープにおいて、均一な静電防止性能や伸び性など
【精密機器・電機領域など】
電磁波シールド製品
導電フィルム
▶
環境
▶
社会
▶
特集
� 員座談会�
社
現場から描くNEW VALUE
ガバナンス
▶
Data
▶
主要財務データ
販売面では2025年度に顧客企業4社で製品仕様への登録を完了しており、2026年度の量産採用に向
▶
主要非財務データ
けて着実に歩みを進めています。
まずは日本からの輸出を軸に事業基盤を固めつつ、将来的な現地生産
▶
企業情報
の物性改善により、品質向上に寄与します。
【精密機器・電機領域など】
樹脂加工製品事業
▶
CNTコンパウンドの用途開発の進展に伴い、今後の販売拡大に向け、当社はキャリアテープ用途を
【モビリティ領域など】
� ゾナック モビリティ事業の�
レ
M&Aによる成長戦略
事業戦略
▶
● キャリアテープ用途を重点化
● ボリューム市場を見据えたコスト低減
▶
の実現も見据え、
キャリアテープにとどまらず電磁波シールド材や導電シリコーンなど幅広い用途への
展開を通じて、CNTコンパウンド事業を森六グループの新たな収益柱へと育てていきます。
IRサイト
業績ハイライト
【精密機器・電機領域など】
キャリアテープ
ESGデータブック
MORIROKU 31 INTEGRATED REPORT 2026
有価証券報告書
DX戦略
INDEX
第14次中計におけるDX推進のポイント
DX担当メッセージ
販売管理費の抑制と人的負担の軽減を図る中で、当社は現場に寄り添った実践的なアプローチを重
「現場起点のDX」
を進化させ、
自律的な改善が
視しています。
日常業務の中に潜む課題を見つけ出し、身近な技術を活用して段階的に改善することで、
小さな成功体験を積み重ね、全社的な変革につなげることを目指します。
循環する組織づくりを加速します
情報システム部部長
情報システム部と事業部門との連携を深め、デジタルツール導入後も現場との対話を継続すること
で、現場の声を反映しながら活用の定着を図ります。
さらに、定期的な総括を通じて成功事例の共有やモ
進してきました。2025年度は22部門・43件の業務改善に取り組み、年間約700時間の業務時間削減効果
しかし、
これらの活動が一過性にとどまり、人材育成や組織能力の向上に十分に結びついていないと
いう課題も顕在化しています。組織的な支援体制の整備やマネジメントの意識向上に加えて、社員一人
ひとりのデジタルスキルの底上げとDXリテラシーの向上が必要であると認識しています。
そこで2026年度は、
対象部門をさらに拡大するとともに、
事例の共有と技術サポートを通じて展開を加
速します。
また、生成AIについても実証段階から実務での本格展開へ移行します。AIガバナンスの確立に
向けて、情報セキュリティ対策や利用ルールの整備を着実に進め、
さらなる業務効率化に加え、
データ活
用による意思決定の高度化や人材のスキル補完につなげていきます。
DXの推進には、人材育成と組織間連携の強化が不可欠です。今後は現場と情報システム部門の連携
を強化し、業務課題の解決を支援する体制の整備を進めます。全社員がデジタルツールを活用して主体
的に業務改善に取り組むことができる環境を構築し、
自律的かつ継続的な改善が循環する組織へと進化
させていきます。
■ 実践的アプローチで推進するDX
●
●
RPAの適用領域を拡大し、間接
業務のさらなる自動化と人材の
高度業務へのシフトを実現します
ERPシステムの刷新により、業務
処理の高速化と冗長性の強化を
図り、安定した業務運用体制を構
築します
現場
密着型の
DX推進で
変革を加速
グローバル経営情報の統合
生産事業本部
国内外の基幹システムデータに基づく
意思決定を支援し、全社的な分析力と
情報活用の高度化を推進します
コーポレート
部門
Progress
中長期戦略
■ 2025年度の主な取り組み
を算出するなど、現場主体の改善活動が着実な成果を生みました。
ケミカル
事業本部
From Vision to
チベーション向上を促進し、実効性の高い、持続可能なDXを推進します。
高島潤
森六では、
「身近な業務からの改善」
を起点とした現場主導のDXを推進し、組織全体の行動変容を促
さらなる自動化の推進
Introduction
イントロダクション
DX戦略の柱
データドリブン経営の
推進
生産事業本部DX化
ケミカル事業本部DX化
DX人材育成
セキュリティ強化・
リスクマネジメントの
最適化
主な施策
● KPI・業績・商品・顧客別データ分析の高
度化および効率化
● RPAやBIなどの身近なツールを活用し
た、業務改善の積み重ねによる業務変
革の実現
● 受発注業務の改善による省人化や、
BI
ツールを活用したデータの可視化によ
る業務効率化の推進
● DX啓発活動
(全部門対象)
● 人事部主催の研修で、
eラーニング・特化
コースを必修化
● 法令・組織変更対応、
ERPの刷新
● サイバー脅威への対策強化に向けて、
部
門横断でセキュリティインシデントに対
応する体制の整備を加速
2025年度の成果・進捗
● 一社化に伴う基幹システム統合
Driving Strategic
Progress
事業戦略
● 業務改善の実現
(7部門)
● RPA導入
(5件)
▶
統合報告書2026のテーマと注目ポイント
▶
森六グループの理念
▶
事業紹介
▶
価値創造プロセス
▶
360年以上続く森六「価値創造の進化」
▶
目次・編集方針
▶
社長メッセージ
▶
中期経営計画
▶
財務戦略
▶
財務・非財務ハイライト
▶
特集
▶
事業戦略
▶
樹脂加工製品事業
ケミカル事業
▶
● 業務改善の実現
(6部門)
● RPA導入
(5件)
● eラーニング実施
(修了率97%、理解度
84%)
● システム運用保守支援のOJT実施
Progress toward
Sustainability
● CSIRT体制構築
● サイバーセキュリティ演習実施
P.61
Topic 現場起点のDXによる業務改善
2025年度は、各部門で生成AIやRPAを活用した業務改善を推進しました。資料作成やデータ
価値創造の
基盤
▶
DX戦略
▶
法務・知財戦略
▶
森六グループのサステナビリティ経営
▶
取り組み報告
▶
環境
▶
社会
▶
特集
� 員座談会�
社
現場から描くNEW VALUE
ガバナンス
▶
Data
▶
整理、定型業務の自動化など、現場起点の取り組みを進め、業務効率化と作業負荷の軽減を実
主要財務データ
▶
現しました。加えて、改善事例を社内イントラネットの「DXポータル」
で共有し、部門を超えて横展
主要非財務データ
▶
企業情報
開を進めることで、自律的に改善活動に取り組む風土を醸成しました。今後も、デジタル技術の
経営分析の高度化
� ゾナック モビリティ事業の�
レ
M&Aによる成長戦略
活用を通じて、生産性向上と組織力強化の両立を目指していきます。
BIツールの継続的な活用を通じて、
リア
ルタイムな経営分析の高度化を図るとと
もに、
部門横断的なデータ活用基盤を整
備します
MORIROKU 32 INTEGRATED REPORT 2026
IRサイト
業績ハイライト
ESGデータブック
有価証券報告書
法務・知財戦略
INDEX
第14次中計における法務・知財戦略のポイント
法務・知財担当役員メッセージ
経営理念として掲げる
「未来を先取りする創造力と優れた技術」
を企業成長の原動力と認識し、知的
専門性と組織力を高め続け、
財産の創出・活用を企業文化として根付かせていくため、
さまざまな施策に取り組んでいます。
また、行動
指針に掲げる
「法令遵守」
を基盤に、攻守両面から当社グループの企業価値向上に取り組んでいます。
グループの成長を支えます
執行役員
法務、知的財産、
コンプライアンス担当
法務知財部長
Introduction
イントロダクション
■ 2025年度の主な取り組みと今後の展開
法務・知財機能を強化し、
事業戦略を支える基盤の高度化を推進します。
斉藤潤子
01 重要プロジェクト支援
M&A・海外投資案件などの
重要プロジェクトにおいて、
契約・法規制・知的財産の
観点からリスクを整理し、
事業部門の迅速な意思決定を
支援しました。
2025年度は、M&Aを含む多くの案件において迅速な法務・知財面での分析と解決策の提供に取り組
みました。難易度の高い案件への対応を通じ、
日々の知識・経験の蓄積が専門的な課題解決に直結する
ことを改めて実感しました。
2026年度は、新たにグループに加わった3社との技術融合とシナジー創出を法務・知財の両面から支
援します。事業・開発部門と早い段階から方向性を共有し、各地域のマーケットトレンドや顧客ニーズ、法
攻めの支援
M&A対応体制の強化や対応マニュアルの整備も推進
02 契約審査の高度化
守りの強化
クラウド型法務支援ツールを活用し、
契約審査業務の標準化と効率化を
推進しました。
定型業務の品質を高めることで、
より高度な案件対応に注力できる
体制づくりを進めています。
From Vision to
Progress
中長期戦略
Driving Strategic
Progress
事業戦略
▶
統合報告書2026のテーマと注目ポイント
▶
森六グループの理念
▶
事業紹介
▶
価値創造プロセス
▶
360年以上続く森六「価値創造の進化」
▶
目次・編集方針
▶
社長メッセージ
▶
中期経営計画
▶
財務戦略
▶
財務・非財務ハイライト
▶
特集
▶
審査業務の効率化と品質向上により、
対応力を強化
な事業展開を支える高品質な法務・知財機能の構築を目指します。
コンプライアンス面では、職場の心理的
安全性の向上に向け、人事・総務部門と連
ケミカル事業
03 知財創出力の向上
わった社員にも、経営理念や行動指針に
現場に根ざした発明の掘り起こしと権利化を推進
事業戦略の推進
ついて理解を深めてもらい、法令遵守を
また、法務・知財部門のメンバー一人ひ
とりの専門性向上を促しながら、組織全体
法務・知財戦略
ループの持続的な成長と企業価値向上に
貢献します。
海外グループ会社
グローバルでの
事業展開
基盤の強化
海外法務情報や法改正情報の
迅速な共有体制の整備、
グローバル特許管理システムの改善、
各拠点・部門の知財担当者との
連携を進め、
各拠点の法務・知財
対応力の底上げを図りました。
Progress toward
Sustainability
価値創造の
基盤
技術開発・
イノベーション創出
の法務・知財基盤の整備を進めることで、各部門と連携しながら迅速かつ高度な対応を実現する
体制を強化しました。
これらの取り組みにより、事業戦略を支える基盤としての法務・知財機能を
一層高度化しました。
DX戦略
▶
法務・知財戦略
▶
森六グループのサステナビリティ経営
▶
取り組み報告
▶
環境
▶
社会
▶
特集
ガバナンス
Data
▶
主要財務データ
▶
主要非財務データ
▶
企業情報
IRサイト
業績ハイライト
ESGデータブック
MORIROKU 33 INTEGRATED REPORT 2026
� 員座談会�
社
現場から描くNEW VALUE
▶
に、
シナジーの創出に取り組みました。
また、
クラウド型法務支援ツールの活用やグローバルで
開発部門
▶
各拠点・各部門との連携を強化し、
グローバル対応力を向上
2025年度は、重要案件への対応や知財活動を通じて、事業部門の意思決定を支援するととも
事業戦略を支える基盤
いきます。法務・知財部門が一丸となり、
グ
04 グローバル基盤強化
Topic 事業変革を支える法務・知財機能の進化
企業文化として根付かせていきます。
の力を底上げする仕組みづくりを継続して
攻めの強化
開発部門への特許調査に関する教育や
発明発掘活動を通じて、事業・
開発戦略と連動した知財活動を
強化しました。
今後は、
シナジー創出につながる
特許出願・権利化を推進します。
携しながら各職層を対象とした研修や啓
事業部門
樹脂加工製品事業
▶
■ 事業・開発・海外拠点と一体となった法務・知財戦略
発活動を継続します。新たにグループに加
事業戦略
▶
制度の変化を踏まえながら、
事業戦略と連動した法務・知財活動を推進していきます。
また、
AIツールの活
用や外部連携を通じて業務の効率化・高度化を進めるとともに、
専門性と組織力をさらに高め、
グローバル
� ゾナック モビリティ事業の�
レ
M&Aによる成長戦略
有価証券報告書
INDEX
Progress toward Sustainability
価値創造の基盤
森六グループのサステナビリティ経営
サステナビリティ重要課題(マテリアリティ)の実績とKPI
●環境
(Environment)
気候変動問題への対応強化
35
37
資源の循環利用|水資源の保全|生物多様性に配慮した事業活動
●環境
(Environment)/社会(Social)
社会課題解決型の製品・ソリューションの開発・販売
●社会
(Social)
働きがいのある職場づくり
40
41
Introduction
イントロダクション
社会の持続的成長と企業価値向上に向けた
サステナビリティ経営
通じて社会課題の解決に貢献してきました。
今後も、事業戦略とサステナビリティを一体で推進し、社会的価値と経済的価値を創出
することで、社会の持続的成長に貢献し、企業価値の向上を目指します。
役員一覧
Driving Strategic
Progress
事業戦略
森六グループの理念
▶
事業紹介
▶
価値創造プロセス
▶
360年以上続く森六「価値創造の進化」
▶
目次・編集方針
▶
社長メッセージ
▶
中期経営計画
▶
財務戦略
▶
財務・非財務ハイライト
▶
特集
▶
46
50
ケミカル事業
Sustainability
価値創造の
基盤
Social
人材育成と職場環境づくり
人権尊重と持続可能な
サプライチェーン構築への取り組み
▶
DX戦略
▶
法務・知財戦略
▶
森六グループのサステナビリティ経営
▶
取り組み報告
Governance
持続的な成長と
企業価値向上
透明性と実効性を高め
持続的かつ中長期的な
企業価値向上への取り組み
樹脂加工製品事業
▶
Progress toward
社外取締役からのメッセージ
▶
環境
▶
社会
▶
特集
� 員座談会�
社
現場から描くNEW VALUE
ガバナンス
▶
Data
▶
主要財務データ
▶
主要非財務データ
▶
企業情報
IRサイト
業績ハイライト
ESGデータブック
MORIROKU 34 INTEGRATED REPORT 2026
� ゾナック モビリティ事業の�
レ
M&Aによる成長戦略
事業戦略
▶
気候変動や資源循環
生物多様性など
さまざまな環境課題への取り組み
人権の尊重|持続可能なサプライチェーンの構築
●ガバナンス
(Governance)
中長期戦略
統合報告書2026のテーマと注目ポイント
▶
Environment
労働安全衛生の徹底
社員座談会
現場から描くNEW VALUE
Progress
森六グループは、1663年の創業以来、
ステークホルダーとの信頼関係を礎に、事業を
ダイバーシティ&インクルージョンの推進
●特集
From Vision to
▶
有価証券報告書
森六グループのサステナビリティ経営
INDEX
サステナビリティ経営の深化に向け、
サステナビリティ担当役員メッセージ
Introduction
管理・運用の実効性を追求
事業成長とサステナビリティの
イントロダクション
2026年度は、財務目標の達成に取り組むとともに、M&A後の事業体制を踏まえ、次期中計における
非財務目標の統合・再設定に向けた準備を進めます。
一体化により、
具体的には、資本効率を高めるための経営指標の活用や、それらを含めたモニタリング体制を高度化
し、経営会議等でのレビューを通じて、迅速かつ的確な意思決定を行える体制の強化に取り組んでい
持続的な企業価値向上を実現します
きます。また、M&Aにより拡大した事業基盤を前提に、事業成長と環境負荷低減の両立を図るととも
執行役員
経営企画、サステナビリティ担当
経営企画部長
サステナビリティ推進部長
今後もステークホルダーの皆さまとの対話を大切にしながら、持続的な成長を目指してまいります。
に、人的資本や知見の融合などの非財務領域についても着実に推進します。
伴野裕美
■ 森六グループ
サステナビリティ推進体制
サステナビリティ基盤を強化
第14次中期経営計画(以下、中計)の初年度である2025年度は、事業戦略とサステナビリティの一体
コーポレート各部門
取締役会
サステナビリティ推進部
化に向けた基盤構築を進めた1年でした。加えて、当社グループにとって大きな転換点となるM&Aを決
生産事業本部
森六グループでは、サステナビリティ経営
環境対応・人権尊重を重点課題に、
を推進する体制として、代表取締役社長を
グループ全体で取り組みを高度化
委員長とするサステナビリティ委員会を設置
サステナビリティ重要課題(マテリアリティ)については、中でも環境対応および人権尊重に重点を置
き、グループ全体での取り組みを強化しています。環境対応では、事業拡大に伴いCO₂排出量の増加が
見込まれる中、削減施策を着実に推進するとともに、目指すべき目標値について精査を進めています。
人権については、社内の人権デューディリジェンス体制の整備に加え、サプライチェーンにおける取り組
しています。サステナビリティ委員会は、国際
社会やステークホルダーからの要請、事業環
境の変化を踏まえた課題について審議し、そ
の内容を取締役会に報告しています。取締役
会の監督のもと、グループ全体でサステナビ
リティ経営を推進するために、社会課題や環
みを高度化し、リスクの把握と適切な対応を進めています。
こうした取り組みを通じて、サステナビリティを経営管理そのものに組み込み、その実効性を高めるため
には、目標値の適切な設定と実行に結びつく運用プロセスの構築が重要であると改めて認識しています。
境課題の解決に向けた戦略を議論し、具体
的な取り組み計画を策定しています。
MORIROKU 35 INTEGRATED REPORT 2026
事業紹介
▶
価値創造プロセス
▶
360年以上続く森六「価値創造の進化」
▶
目次・編集方針
▶
社長メッセージ
▶
中期経営計画
▶
財務戦略
▶
財務・非財務ハイライト
▶
特集
▶
各部門
グループ会社
Progress toward
価値創造の
基盤
DX戦略
▶
法務・知財戦略
▶
森六グループのサステナビリティ経営
▶
取り組み報告
▶
環境
▶
社会
▶
特集
ガバナンス
(サプライチェーンマネジメント)
▶
主要財務データ
▶
主要非財務データ
▶
企業情報
● ESG評価機関への対応
IRサイト
● 事業形態変化に伴う非財務データ管理について
等
� 員座談会�
社
現場から描くNEW VALUE
▶
● ESGトレンドと対応方針
● マテリアリティの進捗管理
樹脂加工製品事業
▶
Data
● 気候変動問題への対応
事業戦略
▶
サステナビリティ委員会における
重点議論テーマ(2025年度)
● 人権デューディリジェンス推進
� ゾナック モビリティ事業の�
レ
M&Aによる成長戦略
ケミカル事業
サステナビリティ委員会
ケミカル事業本部
グループ会社
森六グループの理念
▶
▶
Sustainability
各部門
統合報告書2026のテーマと注目ポイント
▶
監督
目標値を見直し、長期ビジョンの実現に向けた成長戦略を推進しています。一方で、事業拡大に伴い
います。
事業戦略
連携
定し、事業ポートフォリオの拡充と成長基盤の強化を進めました。これらを踏まえ、第14次中計の財務
CO₂排出量の増加が見込まれており、環境負荷低減と成長の両立という難度の高いテーマに取り組んで
中長期戦略
Progress
報告
連携
Progress
Driving Strategic
森六株式会社
代表取締役社長
成長の転換点に立ち、
From Vision to
▶
業績ハイライト
ESGデータブック
有価証券報告書
森六グループのサステナビリティ経営
INDEX
サステナビリティ重要課題(マテリアリティ)
の実績とKPI
2030年度最重要非財務KGI
第14次中計では、
サステナビリティ重要課題ごとに中期的な目標および指標
(KPI)
を策定し、
全社で取り組みを推進しています。
特に気候変動問題をサステナビリティ経営での重要
この中期目標は取締役報酬の一部とも連動しており、
取締役のコミットメントのもと、
全社一丸となって取り組んでいます。
CO2排出量を2019年度比で45%削減する目標を掲げています。
第14次中計※3
サステナビリティ重要課題
気候変動問題への
対応強化
E
資源の循環利用
水資源の保全
生物多様性に
配慮した事業活動
社会課題解決型の
製品・ソリューションの
開発・販売
働きがいのある
職場づくり
ダイバーシティ&
インクルージョンの推進
S
労働安全衛生の徹底
人権の尊重
持続可能な
サプライチェーンの構築
G
コンプライアンスの徹底
2025年度の実績
第14次中計期間のKPI
※3
CO2排出量削減率45%
(基準:2019年度比)
廃棄物削減率、マテリアルリサイクル率などの
資源循環目標・方針策定
水資源利用効率向上などの水の最適利用に向
けた目標・方針策定
生物多様性を考慮した事業リスク・機会の把握
と情報開示
廃材利用、
未利用資源を活用したビジネス創出
●「社員エンゲージメント」
肯定回答率
5ポイント改善(基準:2024年度調査結果比)
●「社員を活かす環境」
肯定回答率
5ポイント改善(基準:2024年度調査結果比)
女性管理職人数2倍
(基準:2024年4月時点)
労働災害発生0件
継続的な人権デューディリジェンス実施による
人権リスクの把握と低減
● 継続的なエンゲージメント活動に基づくSAQ
評価の向上
● サプライチェーン上の人権リスクの評価と情
報開示
コンプライアンス強化施策の実施による法令違
反罰則適用・行政処分件数0件
● CO2排出量:2019年度比 43.73%削減
● 再生可能エネルギー導入率:34.55%
● 製造拠点でのリサイクル品目・量の集計
● 環境関連データの収集スキームの定着
● 製造拠点での水の循環利用
● アキダクトを用いた水リスク把握
● 清掃活動の実施
(ビーチクリーン活動、青山清掃など)
● 海外拠点での緑化活動
● 未利用資源を用いたバイオスティミュラント資材の量産
化検討
● スタンパブルシートの量産化技術・製造方法を検討
● オリジナルコンパウンドのニーズ調査、
ターゲット用途
などのマーケティングを実施
● 内閣府戦略的イノベーション創造プログラム
(SIP)の
「サーキュラーエコノミーシステムの構築」の研究機関
として採択
● 四国化工バイオマスクリーンフィルムの開発、
特許出願
完了、上市
● 部下支援力強化研修の実施
● 社員エンゲージメント向上に向けた部門ごとのアクション
プランの策定と改善アクションの展開
● 女性管理職人数:1.5倍
● パラアスリート社員採用
●「介護コンシェルジュデスク」
を開設
● 単身赴任手当拡充
● 安全衛生活動計画の遂行
● 消防計画の遂行
(避難訓練の実施)
● 防災・災害備蓄品拡充
(ヘルメット、女性用キット等)
● eラーニングを活用した人権研修の実施
● 労働組合と共同でハラスメントに関するアンケート実施
● SAQ実施と取引先へのフィードバック
● サプライチェーン上の人権リスク特定に向けた調査
● 法令改正
(公益通報者保護法、下請法等)
への対応
● 法務コンプライアンス研修、
下請法改正に伴う説明会
の実施
● 定例研修
(新入社員、
キャリア採用、海外赴任前等)の
実施
情報セキュリティの強化
システムセキュリティ被害件数0件
● 国内外グループエンドポイント強化とASM※1
● CSIRT※2体制構築とサイバー攻撃訓練実施
※1 ASM:Attack Surface Managementの略で、外部に公開されたIT資産や脆弱性を継続的に把握・管理する仕組み
※2 CSIRT:セキュリティインシデントの予防・検知・対応を担う専門チーム
※3 第14次中計期間は2025年度から2027年度
今後の取り組み
● 再生可能エネルギー施策の最適化
● 取引先への支援を通じたサプライチェーン
全体のCO2削減活動の活性化
● 廃棄物削減、
マテリアルリサイクル率などの
指標管理
● 水資源利用効率などの管理の継続
● 水ストレス地域の把握
● 創業の地・徳島県での森づくりの継続
● 拠点ごとに可能な環境保全活動の推進
関連
ページ
P.37
P.39
P.39
P.39
● 市場投入に向けた開発を推進
2019年度の排出量に比べて、
森六グループ全体で
50%
削減
(長期目標)
として設定しています。
この長期目標からバックキャストして設定した中期目標の一つとして、
2027年度までに
課題と認識し、
CO2排出量削減率を2030年度最重要非財務KGI
CO2排出量�削減率
サステナビリティ重要課題
(マテリアリティ)
の特定プロセス
- 外部環境・他社動向の調査
国際的なサステナビリティ基準(GRIス
タンダード、ISO26000など)、SDGs、
TCFD提言などに基づき、社会課題や業
界の潮流、同業他社の取り組み状況を
調査しました。
● スタンパブルシートの量産化技術の確立お
よび市場開発を推進
● リサイクル材等を活用したオリジナルコンパ
ウンドの製品開発および市場開発を推進
● 内装部品への適用可能性検証
P.40
● バイオマスクリーンフィルムの展開
(CFP算
出による環境訴求、半導体製造装置向けと
してユーザー指定獲得)
● 社員エンゲージメント向上に向けた部門ご
とのアクションプランの継続的な取り組み
と支援
● パルスサーベイ実施
● 総合職における女性採用のポジティブアク
ションの継続
● BCP/防災管理体制の定着、
訓練内容の拡充
(国内グループ会社)
● プライバシーの保護・心理的安全性をテーマ
とする人権研修の実施
● 法改正に即した多様な働き方の実現
● リスク低減に向けた継続的なSAQの実施と
フィードバック
● サプライチェーン上の人権リスク特定に向
けた調査の実施
● コンプライアンス強化担当制による、
コンプ
ライアンス強化施策
● 法令改正
(公益通報者保護法、独占禁止法
等)
への継続対応
● 研修デジタル化コンテンツの検討
● IT−BCP
● CSIRTサイバー攻撃訓練
● セキュリティ強化施策
P.45
4.経営層による議論と承認
MORIROKU 36 INTEGRATED REPORT 2026
特定・見直しされたサステナビリティ重
要課題(マテリアリティ)案は、サステナ
ビリティ委員会および経営会議での審
議を経て、最終的に取締役会にて承認
されました。
P.61
重要課題(マテリアリティ)
の
P.61
Progress
中長期戦略
Driving Strategic
Progress
事業戦略
▶
統合報告書2026のテーマと注目ポイント
▶
森六グループの理念
▶
事業紹介
▶
価値創造プロセス
▶
360年以上続く森六「価値創造の進化」
▶
目次・編集方針
▶
社長メッセージ
▶
中期経営計画
▶
財務戦略
▶
財務・非財務ハイライト
▶
特集
▶
樹脂加工製品事業
ケミカル事業
▶
Sustainability
価値創造の
基盤
▶
DX戦略
▶
法務・知財戦略
▶
森六グループのサステナビリティ経営
▶
取り組み報告
▶
環境
▶
社会
▶
特集
� 員座談会�
社
現場から描くNEW VALUE
ガバナンス
▶
Data
▶
主要財務データ
▶
主要非財務データ
▶
企業情報
IRサイト
特定および見直しプロセス
業績ハイライト
management/materiality.html
ESGデータブック
https://www.moriroku.co.jp/sustainability/
� ゾナック モビリティ事業の�
レ
M&Aによる成長戦略
事業戦略
▶
Progress toward
3.課題抽出とマトリクス評価
P.44
P.45
From Vision to
森六グル ープ 主要各社 に 対し、
ISO26000をベースとしたチェックリスト
(8カテゴリ・160設問)によるアンケー
ト調査および個別ヒアリングを実施しま
した。
また、既存の取り組み状況や課題
意識を把握しました。
1および2の結果をもとに課題を抽出し、
重要度を2軸
(社会/事業)
でマッピング
しました。その上で、当社および社会双
方にとって特に優先度の高い課題を絞
り込みました。
● 安全衛生活動計画の遂行
● 消防計画の遂行
(避難訓練の実施1回/年)
- 内部環境の現状把握
P.41
P.42
P.43
Introduction
イントロダクション
有価証券報告書
E
気候変動問題への対応強化
Environment
気候変動関連情報
https://www.moriroku.co.jp/sustainability/environment/climatic̲change/index.html
INDEX
Introduction
イントロダクション
シナリオ分析の結果(一部抜粋)
基本的な考え方
【時間軸】中期:2030年まで
森六グループは、
気候変動問題をサステナビリティ重要課題の一つとして認識し、
2022年10月にTCFD
提言への賛同を表明しました。
この提言に基づき、
「ガバナンス」
「戦略」
「リスク管理」
「指標と目標」の4つ
の観点から情報開示の拡充に努めています。環境負荷の低減と企業価値の向上の両立を目指し、継続
的に取り組みを進めていきます。
長期:2031年〜2050年
移行リスク
(1.5〜2℃シナリオに基づいて分析)
ダイジェスト
以下の分析における時間軸は、
すべて
「中期から長期」
で設定されています。
事業インパクト
リスク項目
ガバナンス
リスク
● プラスチック規制強化による
既存プラスチック製品の需
環境課題に対するガバナンス体制
気候変動問題を含むサステナビリティ経営に関する基本方針や重要課題、重要な目標設定につい
て、取締役会で審議および決議を行っています。
また、環境課題に関するKPIは中期経営計画に組み込
政策・
規制
み、当社グループ全体で取り組みを推進しています。
プラスチック
要減少
規制
●
バイオマスプラスチック等へ
の材料切替に伴うコスト増加
● 再生可能エネルギー導入に
再エネ政策
気候変動対応と取締役報酬の連動
2022年度から、CO 2排出量削減率の達成度を取締役報酬の一部に反映する仕組みを導入していま
を指標に組み込み、中
す。CO2排出量の50%削減(2030年度目標)に向け、45%削減(2027年度末目標)
期経営計画ごとの取り組み状況を評価に反映しながら、取締役のコミットメントのもと、気候変動問題の
技術
低炭素技術
の進展
解決に取り組んでいます。2026年4月の株式会社レゾナックのモビリティ事業のM&Aに伴うCO2排出量
よる投資コスト増
● エネルギー市場の構造変化
によるエネルギー価格の不
安定化
市場
リスク管理
製品と
サービス
重要リスクの確定プロセスとモニタリング
事業全体の現状把握と分析を行い、
グループ全体に共通するリスク項目を精査し、
グループとして取
り組むべきリスクを取りまとめています。
これらのリスク項目については、全社的な経営視点から、森六
グループへの影響度や重要度を総合的に評価し、優先度の高いリスクを特定しています。
機会
機会の拡大
● プラスチックリサイクルの拡大による資源利用効
率の向上
向上・コスト削減
Progress
中
中
て決定しています。
また、事業環境の変化や事業戦略の進捗に応じて、
リスクと機会の見直しを随時実施
し、取締役会への報告も行っています。
脱炭素化政策が進められた場合の「1.5〜2℃シナリオ」
と、対照的に脱炭素化政策が限定的に行
われる
「4℃シナリオ」
を想定し、それぞれのシナリオに基づいて事業への影響を分析しました。
事業紹介
▶
価値創造プロセス
▶
360年以上続く森六「価値創造の進化」
▶
目次・編集方針
▶
社長メッセージ
▶
中期経営計画
▶
財務戦略
▶
財務・非財務ハイライト
▶
特集
▶
環境配慮型製品や材料の開発、
需要の取り込み
● 低炭素設備の導入によるエネルギー効率向上と
大
大
Progress toward
Sustainability
● 新市場・新規顧客の開拓による事業拡大・多角化
続可能な調達網の構築
● 顧客ニーズの変化への対応による販売機会の
中
大
拡大
事業インパクト
リスク項目
リスク
価値創造の
基盤
▶
DX戦略
▶
法務・知財戦略
▶
森六グループのサステナビリティ経営
▶
取り組み報告
▶
環境
▶
社会
▶
特集
慢性
平均気温の
上昇
MORIROKU 37 INTEGRATED REPORT 2026
● 冷房使用増加によるコスト
上昇
● グローバル複数拠点での供給対応力を活かした
調達リスク回避
● 環境配慮型製品の需要拡大
� 員座談会�
社
現場から描くNEW VALUE
ガバナンス
▶
財務インパクト
機会
樹脂加工製品事業
ケミカル事業
コストの削減
● サプライチェーン全体の環境負荷低減による持
� ゾナック モビリティ事業の�
レ
M&Aによる成長戦略
事業戦略
▶
物理リスク
(4℃シナリオに基づいて分析)
ダイジェスト
異常気象の
● 異常気象による製造停止や
激甚化
急性
(台風、豪雨、 サプライチェーンの遮断
土砂災害等)
戦略
事業戦略
森六グループの理念
▶
▶
以下の分析における時間軸は、
すべて
「中期から長期」
で設定されています。
気候変動問題に関するリスクとその決定プロセスについては、サステナビリティ委員会での審議を経
中長期戦略
統合報告書2026のテーマと注目ポイント
▶
品・サービスの提案機会拡大
● EV化に伴うビジネス機会の拡大
による市場機会の損失
● 規制強化や顧客ニーズの変
化によるプラスチック製品の
需要減少
● 原材料調達・物流の停滞によ
る製品供給への影響
Progress
Driving Strategic
● 再生可能エネルギー活用によるエネルギー効率
● 脱炭素対応ニーズの高まりによる環境配慮型製
From Vision to
大
需要・販売機会の拡大
● 低炭素技術・設備の導入に
伴う開発・設備投資コストの
増加
大
● バイオマスプラスチック等の環境配慮型材料の
● 樹脂加工製品事業とケミカル事業の協業による
既存製品の需要低下
リスク 機会
● プラスチック代替材料を用いた新規部品の開発
● 低炭素製品への移行による
● 資源循環型材料の開発遅延
の増加を踏まえ、CO2排出量の削減率目標を検証し、次期中計にて再設定予定です。
財務インパクト
▶
Data
リスク 機会
大
大
中
ー
▶
主要財務データ
▶
主要非財務データ
▶
企業情報
IRサイト
業績ハイライト
ESGデータブック
有価証券報告書
気候変動問題への対応強化
INDEX
Introduction
イントロダクション
CO2排出量削減に向けて
指標と目標
長期目標
森六グループでは、TCFD提言に基づく開示とともに、CO 2排出量の削減に取り組んでいます。Scope1およびScope2について
森六グループは、
「 2030年度までにScope1およびScope2に
は、省エネルギーの推進や設備の見直しなどを通じて、拠点ごとの状況に応じた継続的な排出削減に取り組んでいます。一例とし
おけるCO 2 排出量を50%削減する」という目標を掲げています
て、森六モビリティプロダクツ関東事業所では、副変電所の更新にあたり省エネ型の変圧器を選定しました。
これにより変圧時の電
(基準年度:2019年度)。再生可能エネルギーの導入などを通じ
力ロスを低減し、809kWh/月(0.32t-CO 2/月)の削減効果を実現しています。
てScope1およびScope2の排出量削減を進める一方で、サプラ
イヤーと協働しながらScope3の排出量の把握と削減にも取り組
一方、Scope3については、排出実態の把握を目的に算定を進めており、その結果は当社ホームページにて開示しています。今後
は、排出量の管理精度を高めることで、
より実効性の高い対応につなげていきます。
From Vision to
Progress
中長期戦略
み、脱炭素社会の実現にも貢献していきます。
再生可能エネルギーの導入
CO2排出量削減率
Scope1
Scope2
(t-CO2)
120,000
26.8%
削減
80,000
37.3%
削減
39.1%
削減
43.7%
削減
50.0%
削減
20,000
2019年度 2022年度 2023年度 2024年度 2025年度 2030年度
再生可能エネルギー使用率※
(%)
40
26.6% 27.1%
30
森六グループの理念
▶
事業紹介
▶
価値創造プロセス
▶
360年以上続く森六「価値創造の進化」
▶
目次・編集方針
▶
社長メッセージ
▶
中期経営計画
▶
財務戦略
▶
財務・非財務ハイライト
▶
特集
▶
32.1% 34.6%
20
2019年度 2022年度 2023年度 2024年度 2025年度
※電力使用量における再生可能エネルギー由来の使用率
樹脂加工製品事業
ケミカル事業
▶
▶
ています。引き続き、再生可能エネルギー導入比率の向上を通じて、環境負荷低減と持続
DX戦略
▶
法務・知財戦略
▶
森六グループのサステナビリティ経営
▶
取り組み報告
Topic 情報開示強化への取り組み
CDP評価「気候変動・水セキュリティ」
ともにBスコア継続取得
CDP2025の評価において、前年に引き続
き
「気候変動」
「水セキュリティ」の両分野でB
0.0%
事業戦略
▶
は、四国支店およびグループ会社の森六アグリでCO 2フリー電力への切り替えを行ってい
� ゾナック モビリティ事業の�
レ
M&Aによる成長戦略
るほか、
グループ会社の四国化工・西山第一工場でも、PPA契約により太陽光発電を導入し
可能な社会の実現に貢献していきます。
40,000
0
事業戦略
統合報告書2026のテーマと注目ポイント
▶
インド拠点では、太陽光パネルを設置し自家発電を実施しています。ケミカル事業本部で
60,000
10
Progress
となる37拠点のうち17拠点で導入が完了しています。生産事業本部の開発センターおよび
100,000
0
Driving Strategic
森六グループ全体で再生可能エネルギーの導入を推進しており、2025年度時点で対象
▶
スコアを取得しました。
これは、気候変動および水資源に関するリスク・機会の把
握、管理体制の整備、目標に基づく取り組みを継続的に進め
てきた結果であると認識しています。
MORIROKU 38 INTEGRATED REPORT 2026
四国化工・西山第一工場
太陽光パネル
Progress toward
Sustainability
価値創造の
基盤
S&P/JPXカーボン・エフィシェント指数
継続選定
▶
環境
▶
社会
▶
特集
� 員座談会�
社
現場から描くNEW VALUE
ガバナンス
▶
Data
▶
主要財務データ
情報の開示状況等をもとに構成銘柄が
▶
主要非財務データ
選定されるS&P/JPXカーボン・エフィ
▶
企業情報
企業の温室効果ガス排出量や環境
シェント指数にも、引き続き組み入れら
れています。
IRサイト
業績ハイライト
ESGデータブック
有価証券報告書
E
資源の循環利用|水資源の保全|生物多様性に配慮した事業活動
INDEX
Introduction
水資源の保全に向けた事業活動
基本的な考え方
イントロダクション
当社グループは、
水資源を限りある貴重な資源と捉え、
その持続可能な利用に向けた取り組みを推
森六グループは、社会を構成する企業の一員として、地球環境問題が次世代以降にも深刻な影響
進しています。
第14次中計では、
2027年度までに水資源管理体制を強化することを目標に掲げ、
取水量
を及ぼす大きな課題であると認識しています。当社グループは、地球環境との共生を目指し、地球環
管理の徹底、
水質や排水先の適切な管理、
水使用効率の向上といった重点分野に取り組んでいます。
境負荷の低減活動に取り組むとともに、教育やトップメッセージを通じて社員全員の環境意識を向上
具体的な施策として、塗装工程では「塗装汚泥の自動剥離設備」
を導入し、塗料カスを水と自動分離す
させ、環境保全活動への積極的な参加を促しています。
ることで水の循環利用を実現しました。水の廃棄回数ゼロを達成し、使用量の削減と作業環境の改善
を両立させています。
また鈴鹿工場では、出荷受入事務所に無水トイレを導入し、年間約35㎥の上水
資源利用効率の把握
使用を削減しました。
これにより、平常時の水資源効率化に加え、災害時にも利用可能な設備としてレ
当社グループでは、限りある資源を有効に活用するため、生産工程で発生する樹脂廃材のリサイク
ジリエンス向上にも寄与しています。
From Vision to
Progress
中長期戦略
ルを通じて、資源循環の促進と環境負荷の低減に取り組んでいます。2025年度には、生産事業本部に
おいて約774tの樹脂廃材を回収しました。そのうち約77%をマテリアルリサイクル、約23%をサーマル
リサイクルしました。今後
は、マテリアルリサイクル
比率の向上や再利用しや
■ 樹脂廃材の処分割合(生産事業本部)
2023年度
2024年度
廃棄物、水、化学物質等のリスクマネジメント
当社グループでは、事業活動に伴う環境リスクの低減を重要な責任と捉え、廃棄物や水資源などに
(単位:kg)
2025年度
関するリスクマネジメントを強化しています。法令遵守を徹底するとともに、全拠点における環境負荷
Driving Strategic
Progress
事業戦略
▶
統合報告書2026のテーマと注目ポイント
▶
森六グループの理念
▶
事業紹介
▶
価値創造プロセス
▶
360年以上続く森六「価値創造の進化」
▶
目次・編集方針
▶
社長メッセージ
▶
中期経営計画
▶
財務戦略
▶
財務・非財務ハイライト
▶
特集
▶
の可視化と予防的な対応を推進しています。2023年度より、CO₂排出量や水資源の使用状況、化学物
� ゾナック モビリティ事業の�
レ
M&Aによる成長戦略
事業戦略
▶
樹脂加工製品事業
すい材料設計、バージン
マテリアルリサイクル
642,869 (76.1%) 661,800 (79.3%) 596,900 (77.1%)
質や廃棄物の管理状況など、各拠点の環境関連データを包括的に収集しています。
これにより、環境
材の使用量の削減に取り
サーマルリサイクル
180,753 (21.4%) 152,980 (18.3%) 177,300 (22.9%)
負荷の全体像を把握し、
リスク評価や改善に向けた基盤整備が進展しました。
また、水資源に関して
▶
組み、資源の有効活用を
産業廃棄物
21,190 (2.5%)
DX戦略
▶
合計
844,812(100.0%) 834,050(100.0%) 774,200(100.0%)
は、WRI(世界資源研究所)の「Aqueduct(アキダクト)」を活用し、各拠点における水ストレスや洪水
法務・知財戦略
▶
森六グループのサステナビリティ経営
▶
取り組み報告
一層推進していきます。
19,270 (2.3%)
0 (0.0%)
リスクなどの水リスク分析を進めています。
今後は、収集した環境データをもとに管理強化を図りながら、廃棄物の最終処分量の削減やリサイ
ISCC PLUS認証取得による認証原料の取扱体制強化
クルの推進、水の効率的な利用にも取り組み、
より実効性のあるリスクマネジメントを進めていきます。
2025年10月、当社ケミカル事業本部は、国際的な持続可能性認
生物多様性に貢献する環境保全活動
証制度「ISCC PLUS(International Sustainability and Carbon
Certification PLUS)」のトレーダー認証を取得しました。ISCC
当社グループは、生物多様性を意識した環境保全活動に力を入れて
PLUSは、バイオマスや再生由来材などの持続可能な原料が、サプ
います。創業の地・徳島県では、地域の森林資源の保全と再生を目的に、
ライチェーン全体を通じて適切に管理されていることを証明する国際認証です。同制度では、再生可
「公益社団法人とくしま森林づくり推進機構」への寄附を通じた支援を
能資源由来の原材料と石油由来の原材料が混合される工程において、再生可能資源由来の原材料
行っています。2025年8月には、
「とくしま協働の森づくり事業」における
の投入量に応じて、製品にその特性を割り当てる
「マスバランス方式」が採用されています。
本認証の取得により、ISCC PLUS認証製品を、認証制度のルールに沿って適切に管理・販売でき
るようになりました。
これにより、化学品商社として持続可能な原料を取り扱う際のサプライチェーンの
ケミカル事業
▶
Progress toward
Sustainability
価値創造の
基盤
▶
環境
▶
社会
▶
特集
� 員座談会�
社
現場から描くNEW VALUE
ガバナンス
▶
Data
▶
主要財務データ
取り組みを通じて、徳島県より年間30.9tのCO 2吸収量を認証する森林
▶
主要非財務データ
CO 2吸収量証明書の交付を受けました。今後も、森林保全をはじめとす
▶
企業情報
る生物多様性の保全に継続的に取り組んでいきます。
IRサイト
透明性と信頼性を高め、顧客に提供するための体制を整えました。今後も、環境負荷の低減と資源循
環型社会の実現に向けて、責任ある企業活動を推進していきます。
森林CO2吸収量証明書
業績ハイライト
ESGデータブック
MORIROKU 39 INTEGRATED REPORT 2026
有価証券報告書
E/S
社会課題解決型の製品・ソリューションの開発・販売
Environment & Social
産官学連携によるサーキュラーエコノミーシステム構築への貢献
基本的な考え方
INDEX
Introduction
イントロダクション
当社は、
2025年、
内閣府が主導する戦略的イノベーション創造プログラム
(SIP)
第3期課題
「サーキュ
森六グループは、気候変動や資源循環、人口構造の変化などの社会課題を事業機会と捉え、持続
ラーエコノミーシステムの構築」
の研究機関として採択されました。
本プログラムは、
廃プラスチックの市中
可能な社会の実現に向けた製品・ソリューションの開発・提供に取り組んでいます。高齢化社会への
回収から再生材の製造、
自動車部品への再利用に至る一連のプロセスにおいて、
性能や品質をデータで
対応、製品リサイクル、
フードロス削減などを通じて、社会的価値と実用性を兼ね備えた製品・ソリュー
可視化し、
再生材の信頼性向上と資源循環の加速を目指すものです。
ションを創出し、事業活動を通じて社会課題の解決に貢献していきます。
当社は本プログラムにおいて、長年培ってきた樹脂加工技術を活かし、再生材を用いた自動車外
装部品の性能・品質評価を担います。評価対象は、車両側面下部に取り付ける「サイドスポイラー」
世界初、半導体向けバイオマスクリーンフィルムを実用化
です。繊細な塗装外観による意匠性と、飛び石や傷からの車体保護、繰り返しの脱着に対応する寸法
製造業においてカーボンニュートラルへの取り組みが加速する中、半導体・電機電子分野でも、製造
精度・剛性といった実用性の両立が求められる、
リサイクル難度の高い大型部品です。
この性能・品質
工程で使用する包装資材の環境負荷低減が課題となっています。
こうした背景から注目されているのが、
評価を通じて、再生材活用における具体的な課題を抽出・解決し、業界を超えた協働によりサプライ
植物由来の原料を使用し、温室効果ガス削減に寄与すると期待されているバイオマスプラスチックです。
チェーンの拡充や新たな事業機会の創出につなげていきます。
一方で、
半導体用途では極めて高い清浄性が求められるため、
環境性能との両立が技術的な課題でした。
グループ会社の四国化工は、長年培ってきた共押出多層技術と品質管理のノウハウを活かし、
この
課題を克服したバイオマスクリーンフィルム
『QN』
を開発しました。サトウキビ由来のリサイクル可能な
森六が評価部品として
製造する外装部品
「サイドスポイラー」
From Vision to
Progress
中長期戦略
Driving Strategic
サイドスポイラー
Progress
事業戦略
▶
統合報告書2026のテーマと注目ポイント
▶
森六グループの理念
▶
事業紹介
▶
価値創造プロセス
▶
360年以上続く森六「価値創造の進化」
▶
目次・編集方針
▶
社長メッセージ
▶
中期経営計画
▶
財務戦略
▶
財務・非財務ハイライト
▶
特集
▶
事業戦略
▶
バイオポリエチレンを採用し、植物非食部由来のバイオマス原料の使用比率は65%以上です。環境負
� ゾナック モビリティ事業の�
レ
M&Aによる成長戦略
樹脂加工製品事業
ケミカル事業
▶
荷を低減しながらも、半導体用途に求められる厳格なクリーン性能を確保しています。本製品により、
▶
CO₂排出量を現行品比で35%以上削減するとともに、
クリーン度は従来品を上回る水準を達成しまし
DX戦略
▶
法務・知財戦略
▶
森六グループのサステナビリティ経営
▶
取り組み報告
た。現行品と比べて物性強度を大きく損なうことなく、環境性能と製品品質を高い次元で両立した、世
界初 のバイオマスクリーンフィルムです。今後は、四国化工と当社のケミカル事
環境配慮型材料の開発とグリーンケミカルの提案
業本部が連携し、電機電子分野の既存顧客ネットワークを活かして本製品の拡
付加価値創造」のもと、コンパウンドおよびケミカルの両分野で
販を進めていきます。同時に、多様化する環境ニーズに応えるべく、環境配慮製
開発体制を強化しています。
樹脂コンパウンド分野
品の開発・普及にも注力し、
グループ一丸となってCO₂削減に向けた取り組みを
推進していきます。
四国化工株式会社
バイオマスマーク
CO2
現行品を上回るクリーン度
LPC※1
(0.5㎛パーティクル数/四国化工法※2による)
35%
削減
CO2
236
個/cm2
CO2
121
5
現行品
QN
植物由来
PEフィルム
BS資材(量産試作品)
石油由来
PEフィルム
現行品
0.4
QN
価値創造の
基盤
▶
環境
▶
社会
▶
特集
て、
樹脂と各種フィラー、
添加剤を組み合わせ、
機械強度や環境特性の最適化を図っています。
特に、
環境負荷
※1 LPC:Liquid Particle Counter
の略。液体中の微細な粒子
(パーティクル)
数を測定する
装置。数値が小さいほど清
浄度が高いことを示す。
※2 四国化工法:袋に純水250ml
を入れ密封しシェイクさせて
微粒子を抽出する。
抽出水10
ml中に含まれる0.5μm以上
の サイズ の 微粒子 の 数を
LPCで測定して求める。
まで幅広く展開しています。
ガバナンス
Data
ケミカル分野
ラボを拠点に化学品分野の新素材・新機能の創出に取り組むとともに、商社として培った調達力・営業力
を活かし、お客様のニーズに応じたソリューションを提供しています。現在は、未利用資源であるカニ殻をバイ
オスティミュラント資材(BS資材)へアップサイクルする取り組みを進めており、量産技術の確立やグループ
会社の森六アグリとの連携を通じて、本格的な事業展開を目指しています。森六アグリでは、
カニ殻原料を
用いたBS資材の効果検証のため徳島県の農業試験センターでの圃場試験、農業法人や農家への試用提
供など、今後の事業化を目指した取り組みを加速しています。
MORIROKU 40 INTEGRATED REPORT 2026
� 員座談会�
社
現場から描くNEW VALUE
▶
低減と持続可能性に配慮した素材開発に注力し、
リサイクルカーボンやセルロース繊維、
バイオ由来材料など
を活用し、
サステナブルな製品展開を推進しています。
また、
グループ内の各事業と連携し、
自社供給から外販
■「バイオマスクリーンフィルム『QN』」の特長
高いCO2削減効果
Sustainability
ラボ機能を有し、
樹脂材料の可能性を最大限に引き出す研究開発を行っています。
お客様のニーズに応じ
※四国化工調べ
(2025年7月現在)
https://www.shikoku-kakoh.com/
Progress toward
ケミカル事業が第14次中計で掲げる
「ものづくり事業拡大による
※
▶
主要財務データ
▶
主要非財務データ
▶
企業情報
IRサイト
業績ハイライト
ESGデータブック
有価証券報告書
S
働きがいのある職場づくり
INDEX
Introduction
基本的な考え方
イントロダクション
社員エンゲージメントの向上
森六は、全社員が目指すべき姿を明確にするため「森六グループ 人事ポリシー」を策定し、多様な
当社では、
社員一人ひとりの力を最大限に引き出すため、
柔軟で働きやすい環境づくりを推進していま
能力・スキルを発揮できる人材の育成に取り組んでいます。
また、会社の持続的な成長には、経営戦略
す。
フレックスタイム制度や在宅勤務の導入により、
多様なライフスタイルや働き方に対応するとともに、
努
の実行とともに、社員一人ひとりの成長が不可欠です。そのため、日々の業務を通じて成長の機会を
力や成果を正当に評価する制度を整え、
社員の挑戦意欲やモチベーションの向上につなげています。
得られ、意欲的に活躍できる環境づくりを重視しています。社員の成長とエンゲージメントを大切にし、
働きがいを感じられる職場の実現を目指します。
これらの取り組みに加え、社員意識調査を通じて職場の
実態を継続的に把握しています。
「社員エンゲージメント」
と
「社員を活かす環境」
の向上を重要な指標とし、
2027年度
までに、2024年度調査結果比で、
「社員エンゲージメント」
人事担当役員メッセージ
From Vision to
Progress
中長期戦略
2027年度目標
5ポイントアップ
させることを目指しています。
Driving Strategic
Progress
“全員活躍”の組織をつくります
事業戦略
エンゲージメントサーベイにおける課題
統合報告書2026のテーマと注目ポイント
▶
森六グループの理念
▶
事業紹介
▶
価値創造プロセス
▶
360年以上続く森六「価値創造の進化」
▶
目次・編集方針
▶
社長メッセージ
▶
中期経営計画
▶
財務戦略
▶
財務・非財務ハイライト
▶
特集
▶
2024年度サーベイの結果、
スコアは2021年度調査時から改善が見られました。一方、各事業部門
求心力の高まりを感じています。
人材と組織のさらなる活性化のため、
心理的安全性の高い職場環境をつ
くるべく、2025年度は管理職向けの部下支援力強化研修やエンゲージメントサーベイに基づく全部門の
アクションプラン策定などの施策を推進しました。
また、国籍や性別を超えた多様な人材力の最大化にも
取り組み、総合職採用における女性比率は近年3割台に向上しました。多様性への理解が進んできた今、
次のステップとして、
ジェンダーだけに焦点を当てるのではなく、
“全員活躍”へと舵を切る時期にきています。
2026年度は、管理職の経営リテラシー強化や選抜型研修の拡充、社員のリスキリング支援など、人材
を強化する取り組みを進めます。
また、M&Aを通じて森六グループに加わった社員との一体感を醸成す
るため、合同ワークショップや相互の拠点訪問など交流の機会を積極的に創出し、
「森六グループに入っ
たことで、事業のさらなる成長と自己の成長機会が期待できる」と感じてもらえる環境づくりに取り
組んでいきます。
長期ビジョンの実現のためには、社員一人ひとりが「新しい価値をどう創り出せるか」
を考え、実践して
いくことが必要です。今後も
「多様な人材が集まり、仕事を通して成長していく」ため、企業の成長・発展に
貢献する人材の育成に取り組んでいきます。
あわせて、
社員の前向きな変化への意欲を大切にし、
一人ひ
とりが自主性・創造性を発揮し、一緒に働く仲間の多様な価値観やアイデアを認め合い、活かし合うこと
� ゾナック モビリティ事業の�
レ
M&Aによる成長戦略
事業戦略
▶
の個別課題への対応や、現場の取り組みに対する社員の認知向上が課題として確認されました。
これ
森川直樹
2025年4月の一社化以降、
経営会議では事業の垣根を越えた意見交換が活発になるなど、
組織としての
ができる環境をつくっていきます。
「社員エンゲージメント」
「社員を活かす環境」の肯定回答率
(2024年度調査結果比)
「社員を活かす環境」
の肯定回答率をそれぞれ5ポイント向上
多様な人材が集い、共に成長する
執行役員
人事、総務担当人事部長
■ 第14次中計KPI
▶
樹脂加工製品事業
ケミカル事業
▶
を踏まえ、役員・部門長と社員の対話機会を拡充し、
オープンな意見交換を通じて経営方針やビジョン
▶
への理解・共感を醸成し、全社的な一体感の向上につなげていきます。
DX戦略
▶
法務・知財戦略
▶
森六グループのサステナビリティ経営
▶
取り組み報告
また、第14次中計の目標達成に向けて、社員の声を職場環境の改善や経営施策へ反映する取り組
みを進めています。2025年度にはその一環として、社長が各拠点を訪問し社員と直接対話するキャラ
バンを13回実施しました。引き続き、社員の声を真摯に受け止め、エンゲージメント向上と働きがいの
ある職場づくりを推進していきます。
Progress toward
Sustainability
価値創造の
基盤
▶
環境
▶
社会
▶
特集
管理職向け「部下支援力強化研修」の実施
2025年、管理職の対話力向上を目的とした「部下支援力
ガバナンス
▶
強化研修」を新設しました。上司の対話力が職場の心理的
Data
安全性を左右し、社員のエンゲージメントや組織の競争力
に直結するとの認識に基づくものです。
研修には生産事業本部(開発センター・関東工場・鈴鹿
工場)の部課長ら約30名が参加し、多様な部下との信頼関
係を築く対話スキルや、個々の能力を引き出しチームの成
果につなげる育成手法を、座学・グループワーク・討議を通
じて実践的に習得しました。参加者からは「自身の改善点や
MORIROKU 41 INTEGRATED REPORT 2026
� 員座談会�
社
現場から描くNEW VALUE
関東工場での研修の様子(2025年11月)
▶
主要財務データ
▶
主要非財務データ
▶
企業情報
IRサイト
業績ハイライト
ESGデータブック
有価証券報告書
働きがいのある職場づくり
INDEX
職場環境の課題に気づくことができた」
という前向きな声が多く寄せられた一方、
「理解はできるが
行動に移す難しさを感じる」
といった率直な意見もあり、理解から行動変容への課題も改めて認識し
ました。
こうしたフィードバックを今後の施策に反映しながら、心理的安全性の高い職場づくりを通じて
Introduction
イントロダクション
成長を支え、働きがいを高める研修
当社は、社員一人ひとりが自らのキャリアを描き、挑戦を続けられるよう、学びの環境を日々進化さ
せています。従来の階層別研修や専門性を高める教育に加え、
キャリアビジョン形成を支援する教育
イノベーションを創出する組織力の強化を進めていきます。
プログラムやeラーニングを導入し、
いつでもどこでも学べる仕組みを整備しています。
対面とオンライン
を柔軟に組み合わせた研修体系により、業務に即した学習機会を提供しています。
事業の特性に応じた人材ポートフォリオの強化
eラーニングでは、DX、人権、アンコンシャス・バイアスに関するプログラムを全社員の必修とし、
当社は、第14次中計および2035年長期ビジョンの実現に向けて、目標達成に必要なスキルセット
ビジネスに不可欠な最新知識の習得とリスキリングを後押ししています。いずれも単なる知識習得にと
を常に意識しながら人材戦略を推進しています。生産事業・ケミカル事業それぞれの事業特性に応じ
どまらず、実践力の強化や視野の拡大にもつながる内容として設計しており、社員が継続的にスキル
た人材ポートフォリオを策定し、企業の成長を支える最適な人材構成を追求するとともに、事業構造
を磨き、
より高度な業務へとステップアップできるよう支援しています。
の変革に機動的に対応するため、適材適所の人材配置と登用を進めています。
■ 研修体系
中でも、
成長戦略の推進に不可欠な経営人材・技術人材の育成や女性管理職の登用を重点テーマ
を整備し、貢献と成果に正当に報いる報酬体系の構築を進めることで、社員の挑戦と成長を後押しし
役割マインド・
スキル
ています。
の維持に加え、女性管理職の人数を2024年4月時点比で2倍とする目標を掲げており、将来的なマネ
個々の課題や強みに応じた成長支援を行うとともに、全社員に対してもキャリア形成を支援する環境
整備に取り組んでいます。
非管理職
ジメント登用を見据え、本人のキャリア志向や適性等を踏まえた育成を実施しています。対象者には
総合職中堅研修
総合職若手研修
入社半年後研修
新入社員研修
MORIROKU 42 INTEGRATED REPORT 2026
グローバル
コミュニ
ケーション
研修
森六グループの理念
▶
事業紹介
▶
価値創造プロセス
▶
360年以上続く森六「価値創造の進化」
▶
目次・編集方針
▶
社長メッセージ
▶
中期経営計画
▶
財務戦略
▶
財務・非財務ハイライト
▶
特集
▶
� ゾナック モビリティ事業の�
レ
M&Aによる成長戦略
事業戦略
▶
樹脂加工製品事業
ケミカル事業
▶
Progress toward
Sustainability
価値創造の
基盤
eラーニング学習
プレリーダーシップ
研修
しています。総合職採用における女性比率は、近年3割台に上昇しています。第14次中計ではこの水準
人権教育
多様な人材力の最大化に向けて、国籍や性別を問わず、幅広い人材の継続的な確保と育成に注力
語学支援
リーダーシップ
研修
定年前ライフプランセミナー
女性管理職の育成・登用
アンコンシャス・バイアス教育
新任管理職研修
統合報告書2026のテーマと注目ポイント
▶
自己研鑽
基本教育両立支援 キャリア支援 その他支援
経営者
人材育成研修
関係会社
取締役セミナー
事業戦略
ダイバーシティ推進
介護育児制度対象者個別説明
階層別研修に加えて選抜型研修を拡充し、次世代の経営人材の計画的な育成を進めています。
グローバル人材育成
海外赴任前研修・帰任時研修
ます。管理職層に対してはリーダーシップや経営リテラシーを強化する研修を実施するとともに、従来の
中長期戦略
Progress
キャリア教育
女性活躍推進研修・キャリアデザイン研修
経営視点・グローバル対応力・変革への挑戦力を兼ね備えた人材の育成を重点テーマに掲げてい
管理職
経営人材の育成
Progress
Driving Strategic
人材強化
に据え、計画的に取り組んでいます。人事評価においても、役割に対する貢献度を基軸とした仕組み
From Vision to
▶
▶
DX戦略
▶
法務・知財戦略
▶
森六グループのサステナビリティ経営
▶
取り組み報告
▶
環境
▶
社会
▶
特集
� 員座談会�
社
現場から描くNEW VALUE
ガバナンス
▶
Data
▶
主要財務データ
▶
主要非財務データ
▶
企業情報
IRサイト
業績ハイライト
ESGデータブック
有価証券報告書
S
ダイバーシティ&インクルージョンの推進
INDEX
Introduction
多様な働き方とライフステージに寄り添う支援制度
多様性の確保に向けた基本的な考え方
イントロダクション
当社は、多様な働き方を実現するため、
フレックスタイム制度や在
「多様な人材の成長なくして森六の成長はなし」
という考え方のもと、人材の確保・育成に取り組ん
宅勤務制度の導入、年次有給休暇の半日単位や時間単位取得制度
でいます。年齢・性別・国籍・障がい、
さらには価値観といったさまざまな違いを社員一人ひとりが認め
を整備するなど、ワークライフバランスに配慮した柔軟な働き方を支
合い、互いに活かし合うことで、チーム力を発揮していくことが、経営理念に掲げる
「未来を先取りする
援しています。
また、産休・育休、子の看護等休暇、介護短期休暇に加
創造力」の具体化につながると考えています。
え、万が一の病気やけがに備えた「あんしん休暇(失効有給休暇積立
第14次中計ではサステナビリティ重要課題(マテリアリティ)の12項目の一つにダイバーシティ&
制度)」など、
ライフステージの変化に応じた働き方をサポートする制
インクルージョンの推進を掲げ、会社全体で多様な人材が活躍できる職場づくりに取り組んでいます。
度を充実させています。2025年度からは、時短勤務の対象となる子の
From Vision to
Progress
中長期戦略
年齢を小学校3年生修了まで延長し、男性社員の育児休業の取得も
ダイバーシティ&インクルージョン
(D&I)の推進
増加するなど、育児と仕事の両立支援が着実に進んでいます。
これら
当社は2018年頃からD&Iの推進に取り組んでおり、理解浸透・制度拡充を経て、現在は風土醸成と
行動変容を目指す段階へと進んでいます。
の取り組みの結果、2025年3月には「子育てサポート企業」
として
「くる
みん認定」を取得しました。介護面でも、専門家が無料で対応する
「介
2023年に女性総合職向け研修を実施した際、職場に残る従来の役割観などのバイアスが課題とし
護コンシェルジュデスク」を開設し、介護との両立支援ハンドブックを
育児休業推進ポスターを通じた
啓発
て指摘されました。
これを受け、2024年にはリーダー層約70名を対象に「アンコンシャス・バイアス・
公開するなど、安心して働ける環境の整備を広げています。今後も育児や介護、看護など、
さまざまなラ
ワークショップ」
を実施しました。
リーダー層自身が意識と行動を変えることで職場全体の風土改善に
イフイベントに対応し、社員が自分らしく長期的に活躍できる職場づくりを推進していきます。
つなげる狙いであり、
実際に働きやすい職場環境が整いつつあると実感しています。
一方、
ワークショップ
160
今後はエンゲージメントサーベイにD&I関連の設問を加え、意識や職場環境の変化を数値で測定
120
しながら、継続的に施策の強化に取り組んでいきます。
Voice 「部下支援力強化研修」を受講して
80
0
125.0
25.0
30.0
30.8
Progress toward
133.3
Sustainability
2021年度
2022年度
2023年度
61.5
44.4
2024年度
価値創造の
基盤
響、持ち家の維持管理の困難さなど、社員の生活全般にわたる不安が課題となっていました。
管理部
総務課課長
徳山浩太郎
▶
価値創造プロセス
▶
360年以上続く森六「価値創造の進化」
▶
目次・編集方針
▶
社長メッセージ
▶
中期経営計画
▶
財務戦略
▶
財務・非財務ハイライト
▶
特集
▶
こうした課題に対応するため、単身赴任手当の拡充と社宅制度の見直しを実施しました。今後も社
事業戦略
樹脂加工製品事業
DX戦略
▶
法務・知財戦略
▶
森六グループのサステナビリティ経営
▶
取り組み報告
▶
環境
▶
社会
▶
特集
� 員座談会�
社
現場から描くNEW VALUE
ガバナンス
▶
Data
▶
主要財務データ
▶
主要非財務データ
▶
企業情報
IRサイト
員の声に耳を傾けながら制度の改善を重ね、
どのような勤務地においても安心して力を発揮できる環
業績ハイライト
境づくりに取り組んでいきます。
ESGデータブック
MORIROKU 43 INTEGRATED REPORT 2026
� ゾナック モビリティ事業の�
レ
M&Aによる成長戦略
▶
2025年度
異動や転勤に伴い、単身赴任による二重生活の経済的負担や、家族の介護・配偶者の就労への影
で、多忙なときには効率を優先しがちな点や、
自分の経験則を前提に話し
事業紹介
ケミカル事業
83.3
62.5
森六グループの理念
▶
▶
安心して働ける転勤制度の実現
まず相手の考えに耳を傾けることをより意識するようになりました。一方
できる環境づくりと成長支援に取り組んでいきたいと考えています。
100%
120.0
統合報告書2026のテーマと注目ポイント
▶
▶
※育休取得率は、女性は出産した社員、男性は配偶者が出産した社員を母数とし
て算出。出産年度と育休取得年度が異なるため、100%を超える場合があります。
にその意図がなくても、
無意識の価値観や思い込みが、
部下の発言のしづ
今後も、一人ひとりに寄り添った対話を大切にし、安心して相談し、挑戦
復職率
40
心理的安全性や傾聴の大切さについて理解を深めるとともに、管理職
てしまう場面があることも、
自身の課題として感じています。
事業戦略
■女性 ■男性
(%)
P.41
らさにつながる場合があることに気づきました。研修後は、結論を急がず、
Progress
■ 育休取得率推移※
を通じて
「部下の支援」
に関する悩みが多く寄せられたことから、
2025年には研修内容をさらに拡充し、
管理職の対話力や育成力の強化を目的とした「部下支援力強化研修」
を実施しました。
Driving Strategic
▶
有価証券報告書
S
労働安全衛生の徹底
INDEX
Introduction
労働安全衛生の基本的な考え方
労働災害の発生防止に向けた取り組み
各事業所・関連会社において、労働災害の発生防止に向けて以下の
「森六グループ 労働安全衛生基本方針」に基づき、安全衛生活動を展開しています。
活動を推進しています。
「労災ゼロ」はもちろん、将来的な
「危険ゼロ」
を目
森六グループ 労働安全衛生基本方針
指した活動を徹底するとともに、毎年、経営層への報告も行っています。
森六グループは人間尊重・同心協力の経営理念にたち、
働く人の生命と心と体の健康を守ることを最優先とし、法令を遵守し、
全員が協力して安全で快適な職場造りを目指します。
労災防止の取り組み
リスクアセスメント
労働安全衛生の推進体制
代表取締役社長を最高責任者とする安全衛生管理体制を構築し、各拠点の安全衛生委員会および
安全衛生推進者が中心となり、事業内容や職場特性に応じた安全衛生活動を実施しています。万が
一、労働災害が発生した場合には、その真の原因を突き詰め、労使が一体となって再発防止策を講じ
ています。
■ 全社安全衛生管理体制図
総合事務局事務局長業務部長/事務局業務部管理課
コーポレート部門管理責任者
人事・総務担当役員
全社安全衛生管理者
代表取締役社長
ケミカル事業本部管理責任者
(専務執行役員)
事業本部長
関連会社安全衛生責任者:各社社長安全衛生委員会/安全衛生推進者
本社
(青山事務所) 安全衛生委員会
ケミカル事業本部事務局営業管理部長
大阪支店安全衛生推進者
2025年度
実施回数 / 年
1回
安全衛生パトロール
12回
安全衛生教育
12回
設備の安全管理
適宜
化学物質安全管理
1回
緊急対応計画
1回
ストレスチェック
1回
第14次中計KPI
2025年度実績
0件 0件
内容
From Vision to
職場のさまざまな危険を評価し、
リスクを低減するための対策を講じています。
定期的に安全衛生委員会が、職場内を巡視し、不適切状態および不適切行
動の労災要因を指摘、
改善を行っています。
従業員に対して教育や訓練を実施し、
危険を認識し適切に対応できるようにし
ています。
機械や設備の導入時および定期的に点検や保守を行い、
事故や火災の未然
防止に努めています。
使用する化学製品の適正な把握とリスク管理・対策を実施することで、化学
物質による事故のない安全な職場を実現します。
防災委員会、
自衛消防隊と連携し、
火災や地震などの緊急事態に備え、
避難
訓練を行い、
緊急時対応の手順を整備しています。
全従業員に定期的にストレスチェックを実施し、必要に応じて相談窓口や医
師との面談を案内し、
職場内での配慮を行っています。
四国支店安全衛生推進者
中長期戦略
Driving Strategic
Progress
事業戦略
▶
統合報告書2026のテーマと注目ポイント
▶
森六グループの理念
▶
事業紹介
▶
価値創造プロセス
▶
360年以上続く森六「価値創造の進化」
▶
目次・編集方針
▶
社長メッセージ
▶
中期経営計画
▶
財務戦略
▶
財務・非財務ハイライト
▶
特集
▶
鈴鹿工場総括安全衛生管理者
(工場長) 安全衛生委員会
関東工場総括安全衛生管理者
(工場長) 安全衛生委員会
明石営業所安全衛生推進者
労働安全衛生教育
樹脂加工製品事業
ケミカル事業
▶
よび低減対策を実施しています。
リスクアセスメントの実施状況については、社内規定に基づいて、四
Progress toward
半期ごとに代表取締役社長へ報告し、取締役会へ年次報告を行うことで、全社的なリスク管理体制の
Sustainability
価値創造の
基盤
▶
DX戦略
▶
法務・知財戦略
▶
森六グループのサステナビリティ経営
▶
取り組み報告
▶
環境
▶
社会
▶
特集
従業員の健康維持・増進を目的として、健康経営の観点から各種施策に取り組んでいます。
開発センター
(真岡) 安全衛生委員会
� ゾナック モビリティ事業の�
レ
M&Aによる成長戦略
事業戦略
▶
森六グループでは、設備・作業・化学物質などの危険源を特定し、安全衛生に関するリスク評価お
健康づくりに向けた取り組み
生産事業本部事務局事務局長管理部長/事務局管理部総務課長
Progress
リスク低減に向けた取り組み
強化を図っています。
名古屋支店安全衛生推進者
生産事業本部責任者
(専務執行役員)
事業本部長
労働災害発生
イントロダクション
メンタルヘルス向上
� 員座談会�
社
現場から描くNEW VALUE
ガバナンス
▶
全従業員を対象に年に1回ストレスチェックを実施しています。結果に基づき、産業医・保健師によ
Data
▶
主要財務データ
止に努めています。
▶
主要非財務データ
健康増進イベント
(高尾山登山)
▶
企業情報
る面談や社外臨床心理士によるカウンセリングを案内し、
ストレス保有者の早期把握および重症化防
森六グループでは各拠点の状況に応じて、安全衛生委員会を設置し、安全衛生管理責任者ならび
従業員の健康増進と交流を目的に高尾山登山イベントを開催しま
に安全衛生推進者を選任しています。各拠点の安全衛生管理責任者のもと、安全業務に係る従業員
した。今後も心身の健康維持と職場内コミュニケーションの活性化を
に対して、人材育成を目的とした各種研修を実施しており、2025年度は、63名が受講しました。
両立する施策を継続していきます。
IRサイト
業績ハイライト
高尾山登山(2025年10月)
MORIROKU 44 INTEGRATED REPORT 2026
ESGデータブック
有価証券報告書
S
人権の尊重|持続可能なサプライチェーンの構築
INDEX
Introduction
人権尊重への取り組み
サプライチェーンマネジメントの基本的な考え方
森六グループは、
「森六グループ 人権方針」をグループ各社のすべての役員・従業員に適用すると
森六グループでは、持続可能な社会の実現に向け、サプライチェーン全体で持続可能な調達を推進し
ともに、取引先を含むすべてのビジネスパートナーの皆さまにもご理解いただき、人権の尊重にとも
ています。その基本方針として、調達活動に関わる従業員の行動の基本となる
「森六グループ 購買方
に取り組んでいます。当社の取締役会が本方針の遵守およびその取り組みを監督しています。
針」
を定めています。
また、取引先との協働により持続可能な調達を実現するため、
「森六グループ CSR
森六グループ
調達ガイドライン」
を定め、取引先の皆さまにご理解と取り組みをお願いしています。
人権方針
https://www.moriroku.co.jp/company/principle/human̲rights.html
森六グループ 購買方針
https://www.moriroku.co.jp/sustainability/social/procurement/index.html
人権デューディリジェンスへの取り組み
第14次中計では「人権リスクの把握と低減」を目標に掲げ、人権デューディリジェンスの枠組みに
森六グループ CSR調達ガイドライン
https://www.moriroku.co.jp/sustainability/social/procurement/index.html
イントロダクション
From Vision to
Progress
中長期戦略
沿った計画を推進しています。
責任ある調達活動に向けた取り組み
人権尊重への取り組みステップ
1.人権方針策定・公表
ステークホルダーとの対話
P
D
C
A
当社グループでは、取引先との協働により責任ある調達活動を推進していくために、取引先のサス
テナビリティへの取り組み状況を確認し、改善を促進するための仕組みを導入しています。新たな取
2.人権デューディリジェンス
取引先アンケート
(SAQ)の実施とリスク評価
取引先アンケート
(SAQ)を通じたリスク評価を実施しています。SAQの結果をもとに、取引先の環
社内外への情報公開
境・社会・ガバナンスへの対応状況を評価し、
リスクが高いと判断された取引先に対しては、改善に向
けたサポートや追加の対応を行っています。
2025年度の取り組み
●「森六グループ CSR調達ガイドライン」
策定・公開
ハラスメント項目について、労働組合と共同で調査を実
施し、課題を把握
● サプライチェーンにおける国・地域別の人権影響評価に
関する机上調査を実施
● ハラスメント研修実施
(eラーニング)
895名受講率98.5%
● 2023年度社内人権関連苦情の調査・分析
● 社内・その他自社関連業界を対象とした人権リスク調査・
分析
● 有識者との意見交換、
リスクマップ作成
●「人権週間」
に人権教育を実施(eラーニング)
903名受講率97.5%
360年以上続く森六「価値創造の進化」
▶
目次・編集方針
▶
社長メッセージ
▶
中期経営計画
▶
財務戦略
▶
財務・非財務ハイライト
▶
特集
▶
● 2024年度調査において、
人権リスクが高い結果となった
ケミカル事業本部での対応例
Progress toward
Sustainability
価値創造の
基盤
DX戦略
▶
法務・知財戦略
▶
森六グループのサステナビリティ経営
▶
取り組み報告
▶
環境
▶
社会
▶
特集
● 取引先アンケートの人権・労働項目を見直し、
アンケートを改定
● 国内製造拠点での労働者派遣・構内請負を行う事業者
への人権リスク調査
● 人権課題の一つである個人情報・プライバシー保護への
対応として、社員向け啓発動画を制作・展開
の促進を支援
取引先アンケート(SAQ)の結果と対応
https://www.moriroku.co.jp/sustainability/social/procurement/index.html
MORIROKU 45 INTEGRATED REPORT 2026
� 員座談会�
社
現場から描くNEW VALUE
ガバナンス
▶
Data
・既存の取引先では、会社規模や売上金額などの基準をもとに対象先を選定し、
「森六グループ CSR
・SAQの評価結果に基づき、取引先に対して、改善の参考となる資料を提供し、持続可能な事業活動
樹脂加工製品事業
ケミカル事業
・新規取引先に対して与信ランクを設定し、それに基づいた適切な取引管理を実施
調達ガイドライン」の共有と同意書の取り交わしおよびSAQを実施
2026年度以降の取り組み予定
事業戦略
▶
ライン」の共有と同意書の取り交わしを実施
・量産開始の翌年よりSAQを実施し、ESGに関する取引先の取り組み状況を確認する体制を構築
� ゾナック モビリティ事業の�
レ
M&Aによる成長戦略
▶
・量産取引が開始される際には、購買方針説明会への参加を通じて、
「森六グループ CSR調達ガイド
● 取引先へのCSR調査・結果分析
● 人権教育プログラムの見直し
価値創造プロセス
▶
・新規取引先に対し、取引開始前に信用調査や取引先監査を実施し、
リスクを評価
2023年度〜
2024年度〜
▶
生産事業本部での対応例
3.是正・苦情処理メカニズムの構築(相談窓口の設置)
903名受講受講率94%
事業紹介
▶
取引基本契約書」
を締結しており、ESGの観点でもリスク管理を行っています。
モニタリングの実施(社内・グループ会社・サプライチェーン継続調査)
● ハラスメント研修実施
(eラーニング)
事業戦略
森六グループの理念
▶
効率的に購買を行うために、すべての取引先と環境保護、人権尊重、贈収賄防止などを定めた「購買
特定された負の影響の防止・軽減(人権教育の実施)
●「森六グループ 人権方針」
の策定・公開
Progress
統合報告書2026のテーマと注目ポイント
▶
引を開始するにあたり、継続的な取引におけるルールを事前に定め、
リスクをコントロールしながら
人権への負の影響の調査・分析
2025年度までの主な取り組み
Driving Strategic
▶
▶
主要財務データ
▶
主要非財務データ
▶
企業情報
IRサイト
業績ハイライト
ESGデータブック
有価証券報告書
特集社員座談会
INDEX
や生産ロスを抑え、早期に安定生産へ移行し、高水準のQCD(品
現場から描く NEW VALUE
質・コスト・納期)
を確立することです。
森六が目指す
「強い企業」
と
Introduction
イントロダクション
いう姿に共感するとともに、
「工場利益を守り切る」
という自分の仕
挑戦と変化の先にある2035年の森六
事と直結しているのだと実感しましたね。
川口 もう一つ、
「外装樹脂部品の拡大」
というテーマについて、
鈴
鹿工場には、
お客様に特に近い立地と、
大型の塗装ラインを2ライン
持っているという強みがあります。
これらを今後さらに活かしていく
方向が明確になったことで、現場にも浸透しやすい表現になって
いると感じました。
以前よりも、
目指す姿がぐっと具体化された──
率直にそう感じています。
中村
大塚鉄平
ており、実は2026年3月末まで、約6年8か月タイに赴任していまし
生産事業本部
鈴鹿工場
工場長
川口仁志
ケミカル事業本部
ライフサイエンス部
マテリアル課
中村貴仁
人事部
人事課
関利枝
生産事業本部
関東工場生産技術課
課長
上原拓也
※掲載している所属部署および役職は、座談会実施時点(2026年5月)
のものです。
Progress
中長期戦略
大きな変化を感じたのは、
レゾナック社のモビリティ事業の
M&Aですね。
私はケミカル事業本部のライフサイエンス部に所属し
ケミカル事業本部
事業戦略室
事業戦略ユニット
ユニット長
From Vision to
た。
国内外のお客様に樹脂ペレットを中心とした材料販売を行って
Driving Strategic
Progress
事業戦略
▶
統合報告書2026のテーマと注目ポイント
▶
森六グループの理念
▶
事業紹介
▶
価値創造プロセス
▶
360年以上続く森六「価値創造の進化」
▶
目次・編集方針
▶
社長メッセージ
▶
中期経営計画
▶
財務戦略
▶
財務・非財務ハイライト
▶
特集
▶
いたのですが、
発表からすぐに取引先から電話がかかってきて、
「ど
ケミカル事業
▶
▶
産事業本部にとっては当然、
事業拡大の大きなチャンスになります
DX戦略
▶
法務・知財戦略
▶
森六グループのサステナビリティ経営
▶
取り組み報告
し、
ケミカル事業とのシナジー創出も、
今後ますます期待できます。
ションを提供する」
ことを使命として掲げています。
森六が創造する
「NEW VALUE」
とは何か――本座談会では、
生産・ケミカル・コーポ
自分もそうした動きに関わっていきたいと考えています。
レートの各領域で第14次中計の推進に携わる5名の社員が、
自身の業務を通じて生まれつつある変化や挑戦、
その先に描く未来につい
大塚
て率直に語り合いました。
現場の実践から見える
「NEW VALUE」
の現在地をお伝えします。
戦略室で、
そのための中長期戦略の立案を担っています。
私として
ケミカル事業本部でも利益追求を重視しており、
私は事業
Progress toward
Sustainability
価値創造の
基盤
▶
は、
中村さんが話された
「シナジー」
も含め、
2035年に向けたケミカル
値目標が示されたことです。製造の立場からすると、
「顧客ポート
事業の戦略や「NEW VALUE」
そのものを、
もっと深く掘り下げてい
フォリオの拡充」
という方向性が明確に打ち出されていて、
主力の
きたいと思っています。
長期ビジョンと次期中計をつなぐ戦略を描く
お客様に加えて新たな顧客層を開拓していく意図が非常に分かり
立場として、
的確な現状分析の重要性を痛感しています。
その時間
やすく示されていると感じました。
を確保するために、
のちほどお話しするBI
(ビジネスインテリジェン
めて見たとき、
どのように感じましたか。
また、
ご自身の仕事とど
上原
のようにつながっていますか。
現場はどう捉えているか
樹脂加工製品事業
まって、
社会的なインパクトも非常に大きかったのだと思います。
生
森六グループは、
2035年長期ビジョン
「CREATE THE NEW VALUE」
のもと、
「ものづくりの技と化学の力で、
社会に価値あるソリュー
「CREATE THE NEW VALUE」
を
事業戦略
▶
ういう状況なのか」
と問い合わせが入りました。
投資額の大きさも相
� ゾナック モビリティ事業の�
レ
M&Aによる成長戦略
環境
▶
社会
▶
特集
� 員座談会�
社
現場から描くNEW VALUE
ガバナンス
▶
Data
▶
主要財務データ
ス)
ツールの導入をはじめとした、
既存業務の棚卸しと再配置を進
▶
主要非財務データ
じました。
顧客満足の追求に向けて、
お客様に多彩なソリューション
めているところです。
▶
企業情報
を提供して競争力を支えるという考え方が示されていましたが、
そ
関
鈴鹿工場長として、
中計や年度目標の数値を確実に達成し
の前提として
「まず自社自身が利益を生み出せる強い企業でなけ
「大きなテーマだな」
と感じました。
特に、
非財務KPIの目標値はかな
ながら、
安定した生産を維持することが私の大きな役割です。
長期
ればならない」
というメッセージが響きました。
私の現在の仕事は、
り高い水準だと思います。
でも、
同時に掲げたサステナビリティ重要
業績ハイライト
ビジョンを初めて見たときに印象的だったのは、
かなり具体的な数
関東工場生産技術課で、
新機種の立ち上げ時に発生しやすい不良
課題
(マテリアリティ)
に注目すると、
人事部門として取り組むべきこ
ESGデータブック
――2035年長期ビジョン
「CREATE THE NEW VALUE」
を初
川口
長期ビジョンについては、
非常にクリアで分かりやすいと感
MORIROKU 46 INTEGRATED REPORT 2026
私は人事部として、
長期ビジョンを初めて見たとき、
率直に
IRサイト
有価証券報告書
特集社員座談会
INDEX
とが見えてくるんです。
私が普段取り組んでいる社員エンゲージメン
最近は増えてきている。
特に第14次中計が始まって以降、
戦略的な
ト向上、
人権尊重やD&I、
働きがいというテーマは、
ともすると社会
人材配置がかなり進んでいる印象です。
貢献的な文脈で語られることもありますが、
実際には人材定着や会
上原
社の存続に直結します。
事業と人事は別の話のようでありながら、
す。
新しいことを吸収するフェーズではありますが、
課題も見えてき
実は密接に連動している。
人事施策は事業を支える土台ですので、
ています。
例えば新機種の立ち上げ時に、
工場側の製品仕様や図
しっかりと貢献していきたいと思っています。
面への理解がもう少し深まれば、
という課題があります。私は設計
そうですね。
まさに組織の成長に向けた取り組みだと思いま
Introduction
会社と社員が
共に成長する組織へ
イントロダクション
関利枝
出身なので、
強みと経験を活かしながら現場全体のレベルアップに
現場で生まれつつある
「新たな価値」
とは
――日々の業務の中で、
これまでとは異なる新しい価値につながる
From Vision to
つなげていきたいですね。
大塚
Progress
私が
「新しい価値」
を実感した取り組みの一つが、
BIツール
の導入です。
これまで分析前のデータ加工に多くの時間を費やして
現場の皆さんの協力が不可欠であり、
改めて現場との連携の重要
いました。
そこで各部門へのヒアリングを重ね、
必要な分析を迅速
性を実感しました。
に行える環境を整備しました。
その結果、
「なぜこうなったのか」
「次
川口
の手をどう打つか」
という本質的な議論に、
より多くの時間を使える
く、
中長期の視点で工場の将来を考えるようになりました。
目先の評
中村 タイ赴任時代の化学品チームでは、
自動車関連以外の新分
ようになりました。
今後AIの活用が広がっていく中で、
人が本当に時
価だけを基準にすると、
どうしても短期的な判断になり、
戦略の幅が
野の開拓にも取り組みました。
その中で印象的だったのは、
仕事の
間を使うべきなのは、次のアクションを考える部分だと思っていま
狭くなってしまいますから、
長期目線で
「工場としての体力をつける」
取り組みや変化はありますか。
2025年に工場長になったことで、
中計や年度目標だけでな
中長期戦略
Driving Strategic
Progress
事業戦略
▶
統合報告書2026のテーマと注目ポイント
▶
森六グループの理念
▶
事業紹介
▶
価値創造プロセス
▶
360年以上続く森六「価値創造の進化」
▶
目次・編集方針
▶
社長メッセージ
▶
中期経営計画
▶
財務戦略
▶
財務・非財務ハイライト
▶
特集
▶
� ゾナック モビリティ事業の�
レ
M&Aによる成長戦略
事業戦略
▶
樹脂加工製品事業
進め方自体が変わっていったことです。
以前は日本人が中心となっ
す。
そこに一定の貢献ができたのではないかと。
引き続きツールの
というイメージを持つようにしています。
また、
現場を俯瞰する立場
て方向性を決めていましたが、
最近は現地スタッフが主体となって
認知度を高めながら、
ITインフラの整備と並行して浸透させていき
になり、
改善アイデアが数多くあることにも改めて気づきました。
そ
▶
日本側とも連携しながら進めています。
日本人の感覚だけにとらわ
たいと思います。
の力を引き出し、
挑戦しやすい環境をつくることが、
自分の役割だと
DX戦略
▶
法務・知財戦略
れず、
多様な価値観を取り入れられるようになったことは、
大きな変
関
考えています。
化でした。
月からクラウド型の人事システムが本格稼働し、
従業員情報を一元
▶
森六グループのサステナビリティ経営
▶
取り組み報告
大塚
人事部門でも、
大きなシステム刷新がありました。
2026年4
もう一つ、
会社の変化としては、
やはり森六ReNovaグループの合
組織の持続的な成長という観点で、
とても良い成果ですね。
管理できるようになりました。
これにより、
人材育成や適材適所の配
流です。
鈴鹿工場は多品種・小ロットに強みがあり、お客様の生産
私も一つの視点にとらわれないよう気を付けています。
例えば後輩
置に活用できる基盤が整い、
人事情報をより戦略的に活用できるよ
変動にも柔軟に対応できる一方で、
人に依存している部分もありま
の育成において、
以前はかなり細かく指示を出していたのですが、
最
うになっています。
今後は、
社員一人ひとりのキャリア自律の促進に
す。
森六モビリティプロダクツ
(以下、
MMP)
の一貫生産ラインを見
近は、
目的や方向性をこちらで示した上で、
やり方は本人に考えて
もつなげていきたいと考えています。
導入にあたっては、
各拠点や
たとき、
互いの強みを補完し合える大きな可能性を感じました。
顧客
もらうようにしています。
ノウハウを次世代へ引き継げる形に変えて
ポートフォリオの面でも補完関係にあり、
新たな価値につながる手
いこうとしている点は、
自分の中で大きな変化だと思っています。
応えを感じています。
上原
私は2025年10月に今の生産技術課へ異動してきました。
そ
れまでは開発部設計課で製品設計をやっていたので、
同じ生産事
業本部でも業務内容はかなり違います。
見ること・聞くこと・やること
のすべてが新鮮で、
非常に良いチャレンジになっています。異なる
変化に対応できる
強い現場をつくる
川口仁志
立場から物事を見られるようになったことで、
新しい視点が持てるよ
川口
上原さんのような異動は、
以前は珍しかったですよね。
でも
MORIROKU 47 INTEGRATED REPORT 2026
Progress toward
Sustainability
価値創造の
基盤
▶
環境
▶
社会
▶
特集
� 員座談会�
社
現場から描くNEW VALUE
ガバナンス
▶
Data
▶
主要財務データ
けて各社のポテンシャルを可視化する作業を進めています。
毎日新
▶
主要非財務データ
しい発見があります。
関東工場はMMP関東事業所と地理的にも非
▶
企業情報
上原
私も統合業務に関わっており、
将来的なシナジー創出に向
常に近い。
まずは生産面での相互補完の可能性を確認することか
ら始めています。
うになった実感があります。
ケミカル事業
▶
IRサイト
自動車業界は今、
EV戦略の見直しなど少し足踏みしている面も
業績ハイライト
あります。お客様が元気でないと我々も利益を創出できない。
だか
ESGデータブック
有価証券報告書
特集社員座談会
INDEX
らこそ、
お客様が困っていることに対してソリューションを提供でき
には、
やはり時間も人手も必要です。
同じ目標に向かって一緒に取
るよう、
ものづくりのレベルをさらに引き上げ、
お客様の競争力を支
り組める仲間や体制が、
もっと必要だと感じます。
そういう意味でも
えていきたいです。
今回の統合には期待しています。
川口 まったく同感です。
お客様の状況が厳しくなると、
当然、
コスト
川口
削減ニーズも高まります。
そこで単純な価格勝負に陥るのではなく、
えて、
今期どんな体制をつくるべきか、
どこまで投資を行うかを判断
我々ならではの価値をしっかり示してアピールしていく。
その
「価値」
しなければならない。
一方で、
もっと長い目で見て
「将来的に必ず効
をどう形にするかが、
今一番問われているところだと思っています。
いてくる」
という投資もある。
そうしたことを経営側にもしっかり説明
関
森六ReNovaやMMPとの統合に関しては、
制度や給与体系
していく必要があります。
自動車業界全体の変化のスピードを踏まえ
など、
森六とは異なる部分があります。
そのため、
将来的な統合を見
つつ、
経営がどの方向を見て、
どの数字を目指しているのか。
そのビ
据え、
今のうちから準備を進めています。
また、
制度の統合だけでな
ジョンを噛み砕いて、
工場の現場一人ひとりにも分かりやすく落とし
いく必要があると思っています。
カーボンナノチューブ
(CNT)
のよう
く、
お互いを理解する機会も設けていきたいと考えています。
例えば、
込んでいく。
そこに、
一番の難しさを感じています。
上原さんのいる関
に独自性のある商材への投資を、
もっと進めていくべきではないか
「これまで何を大切にしてきたのか」
「どのような価値観を持ってい
東工場をはじめ、
生産拠点同士でそうした課題感は共有しています。
と思います。
るのか」
を共有できる場を設け、
双方向のコミュニケーションを通じ
一つひとつ着実に前に進めるよう連携を深めていきたいですね。
大塚
て、
一体感のある組織づくりにつなげていきたいと思っています。
中村
変化に対応するという意味では、
ケミカル事業も同様です。
方では資本力や物量で負けてしまいます。
その中で当社がどう勝っ
正直に言うと、
これまでは、
自社の強みを起点とした商材提案が先
ていくのかを明確にし、
社員全体へ浸透させていくこと。
それが私
2035年長期ビジョンの実現に向けて
見えてきた課題
――長期ビジョンの実現に向けて、
現場で感じている課題や乗り越
最近感じているのは、
調査や検討を進めるためのリソース
森六ならではの価値を
世界へ広げる
中村貴仁
From Vision to
Progress
事業規模が当社を大きく上回る大手競合に対して、
同じやり
Driving Strategic
Progress
事業戦略
統合報告書2026のテーマと注目ポイント
▶
森六グループの理念
▶
事業紹介
▶
価値創造プロセス
▶
360年以上続く森六「価値創造の進化」
▶
目次・編集方針
▶
社長メッセージ
▶
中期経営計画
▶
財務戦略
▶
財務・非財務ハイライト
▶
特集
▶
� ゾナック モビリティ事業の�
レ
M&Aによる成長戦略
事業戦略
▶
樹脂加工製品事業
行していた部分もあったと思います。
これからは、
市場が求めている
の部門の最大の使命だと思っています。
関
社員への浸透という意味では、
「働きがい」
や「D&I」
に関わ
▶
はないでしょうか。
DX戦略
る社員の意識や組織風土は、
短期間で劇的に変わるものではあり
▶
法務・知財戦略
大塚
ません。
だからこそ、
継続して伝え続け、
取り組み続けることが重要
▶
森六グループのサステナビリティ経営
▶
取り組み報告
中村さんのおっしゃるとおりだと思います。
「なぜお客様が森
だと考えています。
と感じています。
社員に
「森六の強みは何ですか」
と聞くと、
部署や
また、
本格稼働した人事システムにより、
人材情報を一元管理し、
立場によって捉え方に幅があると思います。
入社後7〜8年間、
営業
活用できる基盤が整いました。
今後は、
この基盤を活かしながら、
一
が足りないという課題です。
「もっとこうした方が良いのでは」
という
を担当していた頃は、
よく
「360年の歴史」
や
「社内の雰囲気が良い」
人ひとりのキャリアや志向を理解し、
育成や配置、
人材交流につな
アイデア自体はたくさんある。
ただ、
それを一つひとつ形にしていく
というキーワードが挙がりましたが、顧客との会話のきっかけには
げていくことが重要だと考えています。
異動後も上司が部下のこれ
なっても、
実際の取引理由にはなりません。
「スピード」
もよく挙がる
までの経験や希望を把握しやすくすることで、
一人ひとりに適した
強みですが、
「提案スピードが速い」
のか、
「グローバル拠点を活かし
育成や配置につなげ、
所属が変わっても安心してキャリアを築いて
て各地域で迅速に納品できる」
のか、
価値の中身はまったく違いま
いける環境づくりを進めていきたいと思っています。
す。
そこを定義していくことが必要です。
中村
お客様の競争力を支える
ものづくりへ
上原拓也
中長期戦略
▶
ビジネスをいかにつくるかという視点が、
より重要になってくるので
六を選んでくださるのか」
という付加価値の部分が、
まだまだ曖昧だ
えるべき壁はありますか。
上原
例えば「数年後の機種構成はこうなる」
などの見通しを踏ま
Introduction
イントロダクション
ケミカル事業
▶
Progress toward
Sustainability
価値創造の
基盤
▶
環境
▶
社会
▶
特集
� 員座談会�
社
現場から描くNEW VALUE
ガバナンス
▶
Data
▶
主要財務データ
川口 これまでは、
毎年行っている部下の目標管理
(MBO)
評価を
▶
主要非財務データ
やはり
「他の商社とどう差別化するか」
は、
営業として日々感じ
確認するのに、
毎回総務へ足を運ぶ必要がありました。
システム化
▶
企業情報
ている課題です。
森六が扱っている商材は、
基本的には他社でも扱
してもらえて、
管理する側としても本当に助かります。
ルールが明確
えるものが多い。
そうなると、
お客様から見たときに
「なぜ森六から
になるだけでかなり動きやすくなります。
買うのか」
を考え続けなければいけません。
スピードも重要な要素で
大塚
すが、
それだけでは足りない。
森六ならではの製品をもっと強化して
見ていいのかが悩みでした。
人事部が
「ここまでは見ていい」
という
MORIROKU 48 INTEGRATED REPORT 2026
評価や人事データには個人情報も含まれるので、
どこまで
IRサイト
業績ハイライト
ESGデータブック
有価証券報告書
特集社員座談会
INDEX
基準を示してくれることで、
現場も安心して活用できるようになる。
そ
いたことでも、
半年後、
1年後にはちゃんと自分の糧になっている。
あ
れはかなり大きいと思います。
の経験が成長につながっていたなと、
後から思えることは何度もあ
関
データ活用で
意思決定を高度化する
大塚鉄平
皆さんにそう言っていただけると、
導入を進めてきた甲斐が
あります。
これからも、
コーポレートと現場、
どちらの視点も手放さな
いことを大切にしていきたいと思います。
「会社として何を目指すの
りました。
だから、
「一緒に挑戦していきましょう」
と伝えたいですね。
関
私も採用候補者や新入社員には、
そうありたいという想い
も込めて、
「森六は挑戦を続ける会社であり、
自分から意見を発信し
か」
という方向性を示しながら、
現場の声を丁寧に拾い、
会社にとっ
ていける会社」
と説明しています。
入社して20年近くになりますが、
振
ても社員にとってもより良い形を考えていく。
それが、
人事の一番大
り返ると、
森六はずっとそうやって変わり続けてきた。
それが森六の
事な役割だと思っています。
強みだと思います。
変化の大きい時代だからこそ、
一人ひとりが
「自
分はどう成長していきたいのか」
を考え続ける必要がありますし、
会
2035年、
どのような森六を目指すのか
た証しだと思います。
その強みは、
これからも活かせるはずです。
社はそれを多様性や働きがいの観点から後押ししています。
会社の
大塚
成長と社員の成長は、
セットでなければ意味がありません。
会社と
社員や取引先の幸せを考えたとき、
単に存続するのではな
Introduction
イントロダクション
く、
事業を成長させ続けなければならないと思います。
数字を見る
社員が一緒に成長し続けられる組織をつくることができたら嬉しい
――2035年、
森六は社会からどのような会社だと言われていたい
立場として正直に言えば、
ケミカル事業の成長余地を、
まだ十分に
ですね。
ですか。
また、
その実現に向けて今伝えたいことはありますか。
活かしきれていない。
そこにはかなり危機感を持っています。
だから
上原
こそ、
「適度な危機感を持ち続けること」
が大事だと思っています。
必
シンプルに
「370年企業」
への着実な成長を目指します。
当社の歩み
皆さんと本当に同じ気持ちです。
400年企業を見据え、
まず
From Vision to
Progress
中長期戦略
Driving Strategic
Progress
事業戦略
▶
統合報告書2026のテーマと注目ポイント
▶
森六グループの理念
▶
事業紹介
▶
価値創造プロセス
▶
360年以上続く森六「価値創造の進化」
▶
目次・編集方針
▶
社長メッセージ
▶
中期経営計画
▶
財務戦略
▶
財務・非財務ハイライト
▶
特集
▶
� ゾナック モビリティ事業の�
レ
M&Aによる成長戦略
事業戦略
▶
樹脂加工製品事業
中村「少人数でもしっかり利益を出せる商社」
であること。
結局そ
要以上にネガティブになる必要はありませんが、危機感がなけれ
は、
藍の商いに始まり、
化学品商社への発展、
ものづくりへの進出
こに行き着くのかなと思っています。
設備投資で勝負するビジネスモ
ば、
どう変わるべきか考える機会も生まれません。
会社としてどのよ
を経て、
今、
森六ReNova・MMPとの統合という大きな転換点を迎
▶
デルではない分、
一人ひとりがどれだけ高い付加価値を生み出せ
うな方向性を示し、
社員の皆さんを支えていくか。
それを考え続ける
DX戦略
えています。
「チャレンジ精神」
は森六のDNAなんだと思います。
私
▶
法務・知財戦略
るかが問われます。
「あの会社は少数精鋭でしっかり稼げている」
と
責任がある立場だと思っています。
自身も設計から生産技術への異動という新しいチャレンジの真っ
言われるようになりたいですね。
海外で仕事をしていると、
日本にし
川口
最中です。
異なる視点を持てたことで、
できることの幅が広がってい
▶
森六グループのサステナビリティ経営
▶
取り組み報告
社内に向けては、
もっと挑戦していいということを強調したい
かできないこと、
日本が強みを持っている分野はまだまだたくさんあ
ですね。
もちろん致命傷にならないようなリスク管理は必須ですが、
ると感じています。
今後も、
挑戦し続ける企業だとご評価いただける
る。
そうした
「日本ならではの商材」
を海外に展開していきたいです。
もっと失敗してもいいと思っています。
私自身の経験からしても、
森六
ように、
そして我々自身がそう誇れるように、
私自身もチャレンジし続
ライフサイエンス領域で言えば、
これから人口が増えていくアフリカ
は
「挑戦させてくれる会社」
です。
その時は
「勘弁してくれよ」
と思って
ケミカル事業
▶
Progress toward
Sustainability
価値創造の
基盤
▶
けたいと思います。
やインドのような地域に向けて、
他の商社が十分に開拓できていな
環境
▶
社会
▶
特集
い市場へどう入り込んでいくか。
今まさに本格的に着手しています。
� 員座談会�
社
現場から描くNEW VALUE
ガバナンス
▶
360年以上続いてきたのは、
変化に対応し続けてきたからこそだ
Data
▶
主要財務データ
ですね。
▶
主要非財務データ
川口
▶
企業情報
と思います。
今後も変化に柔軟に対応し続けられる会社でありたい
お客様が求める価値は変化し続けています。
だからこそ、
森
六自身も柔軟に変わっていく必要があります。現場の視点で言え
IRサイト
ば、
今後さらに人材確保が難しくなる中、
固定費を最適化しながら、
一人ひとりがしっかり活躍できる風土を整えていかないと勝ち残れ
業績ハイライト
ません。
360年以上続いてきたこと自体が、
変化に柔軟に対応してき
ESGデータブック
MORIROKU 49 INTEGRATED REPORT 2026
有価証券報告書
G
コーポレート・ガバナンス
Governance
Introduction
コーポレート・ガバナンス体制
基本的な考え方
森六グループは、経営理念の実践を通じて、持続的かつ中長期的
イントロダクション
■ 体制図
社内
たします。そのため、透明性・公平性を保ちながら迅速な意思決定を
選任・解任
行うとともに、顧客、取引先、従業員、地域社会、株主など、すべてのス
テークホルダーとの緊密な関係の構築を図ります。
From Vision to
報告・
選任・解任
意見陳述
選任・解任
付議・報告
Progress
中長期戦略
取締役会
指名・報酬諮問委員会
3名
「アジリティ経営」の土台を整備
監督機能の強化と意思決定の迅速化を両立
社外
株主総会
な企業価値の増大を実現するとともに、企業としての社会的責任を果
監査等委員会設置会社への移行の意義
INDEX
委員長
社内 + 社外
1名
2名
取締役(監査等委員を除く)
答申
監査・監督
6名
社内 + 社外
諮問
2名
議長
移行の目的
監督
選定・解職
1 経営監督と業務執行の分離
監査
代表取締役社長
2 経営の意思決定の迅速化
取締役会が業務執行の決定を広く取締役に委任することに
指示
より、業務執行と監督を分離するとともに、経営の意思決定を迅
指示
報告
指示
内部監査室
森六グループの理念
▶
事業紹介
▶
価値創造プロセス
▶
360年以上続く森六「価値創造の進化」
▶
目次・編集方針
▶
社長メッセージ
▶
中期経営計画
▶
財務戦略
▶
財務・非財務ハイライト
▶
特集
▶
指示
移行の成果
移行から2年を経て、取締役会の実効性評価や運営実績を通じ、
以下のような変化を確認しています。
P.54
● 経営戦略やリスクマネジメントに関する議論の深化
重要事項の承認
経営指導
● 執行側の事前検討の充実による上程議案内容の精度向上と
各部門・国内外関係会社
再付議の減少(意思決定の迅速化)
MORIROKU 50 INTEGRATED REPORT 2026
樹脂加工製品事業
ケミカル事業
報告・補助
連携
Progress toward
Sustainability
価値創造の
基盤
▶
DX戦略
▶
法務・知財戦略
▶
森六グループのサステナビリティ経営
▶
取り組み報告
審議・報告
協議・報告
事業戦略
▶
▶
環境
▶
社会
▶
特集
� 員座談会�
社
現場から描くNEW VALUE
ガバナンス
▶
速化しています。
経営会議
� ゾナック モビリティ事業の�
レ
M&Aによる成長戦略
▶
監査等委員会室
報告
統合報告書2026のテーマと注目ポイント
▶
2名
1名
付議・報告
取締役の職務執行の監査等を担う監査等委員を取締役会の
構成員とすることにより、取締役会の監督機能を強化しました。
委員長
3名
社内 + 社外
事業戦略
連携
会計監査人
に移行しました。
Progress
監査等委員会
4名
取締役(監査等委員)
当社は2024年、監査役会設置会社から監査等委員会設置会社
Driving Strategic
▶
監査
監査
Data
▶
主要財務データ
▶
主要非財務データ
▶
企業情報
IRサイト
業績ハイライト
ESGデータブック
有価証券報告書
コーポレート・ガバナンス
INDEX
Introduction
取締役の構成とスキル
当社の取締役会に必要な知識・経験・専門性等のスキルおよび選定理由
取締役の選任にあたっては、取締役会において充実した議論を行い、重要な業務執行に関する意
当社は、取締役会が備えるべきスキルと経営戦略との整合性をより明確にするため、2026年3月、
思決定と、適切な業務執行の監督・監視機能を高いレベルで発揮することを目指しています。そのた
スキルマトリックスの項目と選定理由を見直しました。今回選任した新任社外取締役についても、
こう
め、高い倫理観と遵法精神を備え、当社の取締役会に必要な知識、経験、専門性などを有する人材を、
した経営戦略に基づくスキルの観点から選定しています。
スキルマトリックスに照らし、取締役会全体のバランスおよび多様性を考慮して選任します。
かし、取締役会の実効性を高め、企業価値の向上につなげていきます。
い知見を有する人材を選任します。
企業経営
https://www.moriroku.co.jp/sustainability/governance/cg/basic̲policy.html
■ コーポレート・ガバナンス体制一覧表(2026年6月18日現在)
形態
監査等委員会設置会社
取締役会議長
法務・リスク管理
社長
取締役の人数
9名
うち社外取締役の人数
6名
独立役員の人数
6名
取締役の任期(監査等委員である取締役を除く)
1年
財務・会計
■ 委員会の構成(2026年6月18日現在)
指名・報酬諮問委員会
委員
3名
社外取締役
2名(委員長)
2名
社内取締役
1名
1名(委員長)
■ 取締役の構成(2026年6月18日現在)
社内取締役
社外取締役
6名
3名
5年以上
男性
女性
2名
7名
2名
社外取締役
の人数
(77.8%)
在任期間
2〜4年
2年未満
3名
当社は、行動指針に掲げる
「法令遵守」
を念頭に、法務・リスク管理体制を整え、攻守
双方で当社の企業価値向上に取り組んでいます。
取締役会における経営監督の実効
性を向上させるために、
確かな知識・経験が必要であると考えます。
事業戦略
当社は、2035年長期ビジョンを策定し、
ものづくりの技術と化学の知見を掛け合
わせ、社会に新たな価値を創出する使命を明示しました。
さらなる収益性向上と
持続的成長の実現に向けて、主力事業を核とした新たな事業領域への進出、
グ
ローバル比率拡大により、
「稼ぐ力」の強化に取り組んでいきます。その実現に向
け、事業戦略の経験は取締役会メンバーに必要な重要スキルであると考えます。
人材開発・
ダイバーシティ
サステナビリティ
4名
MORIROKU 51 INTEGRATED REPORT 2026
Progress
中長期戦略
Driving Strategic
Progress
事業戦略
当社が持続的に成長するためには、経営戦略の実行とともに、人材を育て、組織
に多様性を確保することが重要と考え、人材開発、
ダイバーシティ推進に取り組ん
でいます。そのため、取締役会においてもダイバーシティ推進を含む人材開発分
野における確かな知識・経験が必要であると考えます。
当社は、すべてのステークホルダーに配慮し、事業活動を通じて社会課題の解決
に貢献するとともに、長期にわたり社会から信頼される企業であり続けることを
目指しています。取締役会が中長期的な企業価値向上に向けて、サステナビリ
ティに関する方針や重要課題、目標の設定およびその進捗状況を適切にモニタ
リング・監督していくためには、サステナビリティ分野における確かな知識・経験
が必要であると考えます。
▶
統合報告書2026のテーマと注目ポイント
▶
森六グループの理念
▶
事業紹介
▶
価値創造プロセス
▶
360年以上続く森六「価値創造の進化」
▶
目次・編集方針
▶
社長メッセージ
▶
中期経営計画
▶
財務戦略
▶
財務・非財務ハイライト
▶
特集
▶
� ゾナック モビリティ事業の�
レ
M&Aによる成長戦略
事業戦略
▶
当社は、主力事業のさらなる利益追求、製品化につながる開発の推進、事業シナ
ジー創出といった事業利益成長を加速するための財務戦略を実行しています。取
締役会において、企業価値向上のための財務戦略が重要となることから、重要な
スキルとして特定しています。
グローバル
(22.2%)
性別
当社は、
「ものづくりの技と化学の力で、社会に価値あるソリューションを提供す
る」
ことを目指すとともに、顧客ポートフォリオの拡充、外装樹脂部品の拡大、商社
グローバル比率の拡大、
さらには、二輪事業拡大、多目的モビリティ事業進出に取
り組み、企業価値を高めていきます。取締役会として、当社グループの事業構造の
機会とリスクを正しく把握し、持続的な成長に向けた経営の監督と助言を行うた
めに、企業経営に関する豊富な経験が必要であると考えます。
当社は、海外に開発・生産・営業拠点を展開し、世界中のお客様のローカルニー
ズ解決に挑戦しています。国際ビジネスの成長戦略と経営の監督のためには、海
外での事業経験やグローバル企業での実践経験が必要であることから、重要な
スキルとして特定しています。
監査等委員会
3名
今後も各氏の専門知識や経験を活
From Vision to
社外取締役については、経営に関する豊富な経験や、財務・会計、法務などの高度な専門性、幅広
コーポレートガバナンス・コードへの対応
P.52
イントロダクション
樹脂加工製品事業
ケミカル事業
▶
Progress toward
Sustainability
価値創造の
基盤
▶
DX戦略
▶
法務・知財戦略
▶
森六グループのサステナビリティ経営
▶
取り組み報告
▶
環境
▶
社会
▶
特集
� 員座談会�
社
現場から描くNEW VALUE
ガバナンス
▶
Data
▶
主要財務データ
▶
主要非財務データ
▶
企業情報
IRサイト
業績ハイライト
ESGデータブック
有価証券報告書
コーポレート・ガバナンス
INDEX
Introduction
役員一覧
(2026年6月18日現在)
社外
社外取締役
非執行
社内非業務執行取締役
独立
東京証券取引所の定めに基づく独立役員
指・報酬指名・報酬諮問委員
監査
監査等委員
イントロダクション
取締役
From Vision to
Progress
中長期戦略
氏名
黒瀨直樹
菊地耕一
平井謙一
代表取締役社長
最高経営責任者
代表取締役副社長
最高財務責任者
(57歳・男)
役職
重要な兼職の状況
●��森六ReNova株式会社�
取締役会長
(62歳・男)
(71歳・男)
大塚亮
(61歳・男)
横手仁美
独立社外取締役
独立社外取締役
独立社外取締役
(63歳・女)
なし
●��大塚ポリテック株式会社
なし
2年
6年
6年
3年
4,900株
1,000株
700株�
―株
―株
取締役のスキル
●
●
●
●
指・報酬
社外
独立
●
事業紹介
▶
価値創造プロセス
▶
360年以上続く森六「価値創造の進化」
▶
目次・編集方針
▶
社長メッセージ
▶
中期経営計画
▶
財務戦略
▶
財務・非財務ハイライト
▶
特集
▶
(ICB)理事
2年
●
独立
森六グループの理念
▶
社外
独立
指・報酬
グローバル
●
●
●
事業戦略
●
●
●
ケミカル事業
▶
Progress toward
Sustainability
価値創造の
基盤
DX戦略
▶
法務・知財戦略
▶
森六グループのサステナビリティ経営
▶
取り組み報告
●
役員(取締役の経歴)
●
●
社会
▶
特集
●
Data
主要財務データ
▶
主要非財務データ
▶
企業情報
●
IRサイト
ESGデータブック
※2 所有株式数:2026年3月末時点
MORIROKU 52 INTEGRATED REPORT 2026
� 員座談会�
社
現場から描くNEW VALUE
▶
業績ハイライト
https://www.moriroku.co.jp/company/board/index.html
※1 通算在任年数:監査役および取締役の通算年数
環境
▶
ガバナンス
●
●
▶
▶
人材開発・ダイバーシティ
サステナビリティ
樹脂加工製品事業
▶
法務・リスク管理
財務・会計
� ゾナック モビリティ事業の�
レ
M&Aによる成長戦略
事業戦略
▶
●��学校法人アジア学院�評議員
通算在任年数※1
企業経営
社外
代表取締役社長
統合報告書2026のテーマと注目ポイント
▶
●��国際人材創出支援センター
指・報酬
所有株式数
Progress
事業戦略
属性・就任委員
※2
Driving Strategic
▶
有価証券報告書
コーポレート・ガバナンス
役員一覧(2026年6月18日現在)
執行役員
社外
社外取締役
非執行
社内非業務執行取締役
独立
東京証券取引所の定めに基づく独立役員
指・報酬指名・報酬諮問委員
監査
監査等委員
専務執行役員
生産事業本部長
INDEX
Introduction
イントロダクション
森田和幸
ケミカル事業本部長
文字英人
取締役
常務執行役員
ケミカル事業本部
アセアン、自動車分野担当
開発推進室長
Moriroku Chemicals India Pvt.
Ltd. 社長
坂口透
光冨眞哉
氏名
(67歳・男)
役職
独立社外取締役
小池秀紀
辻千晶
(63歳・男)
(73歳・女)
取締役
独立社外取締役
生産事業本部開発、技術担当
西尾陽一
属性・就任委員
なし
社外
通算在任年数
なし
独立
―
※1
所有株式数
―株
※2
企業経営
●
非執行
監査
1年
取締役のスキル
財務・会計
●
事業戦略
●
1,000株
●
●
●
独立
4年
4,400株
法務・リスク管理
グローバル
社外
井熊祐介
独立社外取締役
執行役員
ケミカル事業本部管理、中国担当
事業戦略室長
●
役員(取締役の経歴)
事業戦略
社外
独立
―
400株
●
●
●
●
森六グループの理念
▶
事業紹介
▶
価値創造プロセス
▶
360年以上続く森六「価値創造の進化」
▶
目次・編集方針
▶
社長メッセージ
▶
中期経営計画
▶
財務戦略
▶
財務・非財務ハイライト
▶
特集
▶
▶
水谷英樹
森川直樹
法務、知的財産、
コンプライアンス担当
法務知財部長
斉藤潤子
経営企画、サステナビリティ担当
経営企画部長
サステナビリティ推進部長
Progress toward
Sustainability
価値創造の
基盤
▶
DX戦略
▶
法務・知財戦略
▶
森六グループのサステナビリティ経営
▶
取り組み報告
伴野裕美
生産事業本部 アジア・中国統括
武漢森六汽車配件有限公司総経理
川村直彦
鄭炅喆
生産事業本部
森六ReNova株式会社社長
平田知広
▶
環境
▶
社会
▶
特集
▶
Data
▶
主要財務データ
▶
主要非財務データ
▶
企業情報
IRサイト
業績ハイライト
ESGデータブック
※2 所有株式数:2026年3月末時点
MORIROKU 53 INTEGRATED REPORT 2026
� 員座談会�
社
現場から描くNEW VALUE
ガバナンス
中尾靖
生産事業本部北米統括 Moriroku
Technology North America Inc. 社長
樹脂加工製品事業
ケミカル事業
生産事業本部製造・品質担当
監査
� ゾナック モビリティ事業の�
レ
M&Aによる成長戦略
事業戦略
▶
ケミカル事業本部電機電子分野担当
Moriroku Chemicals Korea Co., Ltd.
社長
https://www.moriroku.co.jp/company/board/index.html
※1 通算在任年数:監査役および取締役の通算年数
Progress
人事、総務担当人事部長
●
●
Driving Strategic
統合報告書2026のテーマと注目ポイント
▶
比企知寿子
なし
●
人材開発・ダイバーシティ
サステナビリティ
監査
中長期戦略
生産事業本部営業、購買担当
●��法律事務所キノール東京�
重要な兼職の状況
Progress
橋本一博
(65歳・男)
パートナー弁護士
●��株式会社ヨロズ�社外取締役
(監査等委員)
From Vision to
▶
有価証券報告書
コーポレート・ガバナンス
INDEX
Introduction
取締役会の運営状況
イントロダクション
取締役会は、法令、定款および「取締役会規定」に従い、経営に関する重要事項の意思決定および業務執行を監督することを目的とし
て、定例の取締役会を毎月1回開催するほか、必要に応じて開催しています。2024年度に監査等委員会設置会社へ移行、2025年度に一社
化および経営会議への権限委譲を行い、取締役会はさらに戦略的な議論の場へと進化しています。
● M&Aについて
2025年度は、取締役会を18回開催しました。なお、会社法第370条に基づく書面決議は3回実施しました。経営会議への権限委譲の結
果、議題件数や所要時間が前年比で減少しましたが、成長戦略や事業構造改革について議論する時間の割合は増加しました。経営計画
や中長期戦略の議論を一層充実させていくことが今後の課題となっています。
■「アジリティ経営」への進化──監督と執行の分離、執行への権限委譲の進展
2024年度
2025年度
(監査役会設置会社)
監査等委員会設置会社へ移行
経営会議の運用開始
一社化に伴い、
意思決定体制を再設計
取締役会
取締役会
取締役会
代表取締役社長
代表取締役社長
コーポレート
社長執行役員
森六テクノロジー
森六ケミカルズ
グループ会社
グループ会社
(樹脂加工製品事業)
経営会議
(ケミカル事業)
コーポレート
(執行)
森六テクノロジー
(樹脂加工製品事業)
グループ会社
執行
監督
■業績・計画
■ガバナンス・内部統制
■人事・組織
■その他
2023年度
(ケミカル事業)
グループ会社
コーポレート
(執行)
生産事業本部
(樹脂加工製品事業)
グループ会社
20%
30%
40%
ケミカル事業本部
(ケミカル事業)
グループ会社
50%
60%
70%
「成長戦略・事業構造改革」が増加
80%
90%
100%
設立・増資・設備投資から売却に至るまでの経緯を振り返り、工
場増設時の需要見込みと実績の乖離、
受注判断、
累損拡大局面
における撤退判断のタイミングなどを多面的に検証しました。
あわせて、
今後は収益性・成長性・投資回収性を客観的に評価し、
事業継続・撤退の判断を取締役会で適切に議論することで、同
様の事態の再発防止につなげる方針を確認しました。
Topic
株主・投資家との対話
当社は、持続的な企業価値向上に向けて、機関投資家との
面談を継続的に実施しています。
対話では、
成長戦略や財務戦
中長期戦略
Driving Strategic
Progress
事業戦略
事業紹介
▶
価値創造プロセス
▶
360年以上続く森六「価値創造の進化」
▶
目次・編集方針
▶
社長メッセージ
▶
中期経営計画
▶
財務戦略
▶
財務・非財務ハイライト
▶
特集
▶
通じた顧客ポートフォリオの多様化や、
高付加価値技術を活用し
た利益改善、統合後のシナジー創出に向けた取り組みについ
1511
150
1620
169
1318
ケミカル事業
Progress toward
Sustainability
価値創造の
基盤
▶
DX戦略
▶
法務・知財戦略
▶
森六グループのサステナビリティ経営
▶
取り組み報告
経営会議への権限移譲により、取締役会議題の適正化が進展
MORIROKU 54 INTEGRATED REPORT 2026
価値向上と情報開示のさらなる充実に取り組んでいきます。
▶
環境
▶
社会
▶
特集
� 員座談会�
社
現場から描くNEW VALUE
ガバナンス
▶
Data
▶
主要財務データ
▶
主要非財務データ
▶
企業情報
に向けた収益性の改善とROEの向上は、引き続き重要な課題
今後も、
株主・投資家の皆さまとの対話を経営に活かし、
企業
樹脂加工製品事業
▶
て、
前向きな評価をいただきました。
一方で、
PBR1倍以上の実現
であると認識しています。
� ゾナック モビリティ事業の�
レ
M&Aによる成長戦略
事業戦略
▶
2025年度は、
株式会社レゾナックのモビリティ事業のM&Aを
■総所要時間(分) ■議題件数(件)
107
Progress
森六グループの理念
▶
略、資本効率、人的資本などについて幅広いご意見をいただ
議題件数・総所要時間の推移
2025年度
From Vision to
統合報告書2026のテーマと注目ポイント
▶
き、
中期経営計画や開示情報の充実につなげています。
2024年度
2025年度
10%
社長決裁案件を
経営会議で審議
権限委譲が進展、経営の意思決定が迅速化
2023年度
2024年度
0%
森六ケミカルズ
経営会議
取締役会では、成長戦略・事業構造改革に関する議論の割合が拡大
議題テーマ別時間配分の推移
■成長戦略・事業構造改革
取締役会付議案件の
事前審議を開始
株式会社レゾナックのモビリティ事業のM&Aについて、
顧客ポー
トフォリオの多様化、外装発泡成形などの高付加価値技術の活
用、
シナジー創出に向けた体制づくりを確認しました。
あわせて、
日産自動車株式会社をはじめとする主要顧客の動向、
タイ市場
の低迷、借入による金利負担、統合後の人材・組織運営など、
M&Aに伴うリスクについても多面的に検証しました。
● メキシコ子会社の株式譲渡について
2023年度
代表取締役
取締役会の主な議題・取り組み
(2025年度)
▶
IRサイト
業績ハイライト
ESGデータブック
有価証券報告書
コーポレート・ガバナンス
INDEX
取締役会の実効性評価
- 分析・評価結果
Introduction
イントロダクション
アンケート結果を踏まえ、取締役会の実効性について検証した結果、当社の企業文化に基づく自由
森六では、取締役会の機能強化と企業価値の向上を目的として、毎年、取締役会の実効性に関する
闊達で建設的な議論や意見交換が行われており、取締役会の実効性が引き続き確保されていること
自己評価・分析を実施しています。評価にあたっては、外部機関の助言を得ながら、全取締役を対象に
を確認しました。
さらに、取締役会での議論を通じて、今後の取締役会運営の改善に向けた具体的な
アンケートを実施し、取締役会の構成、運営、議論の質、情報提供のあり方など、多角的な観点から実
方向性を確認しました。
態を把握しています。評価結果は、取締役会で共有・議論し、改善が必要と認識された点については、
具体的な対応策を講じることで、継続的な機能強化に努めています。
一方で、企業価値の向上に向けては、中長期的な経営戦略、資本効率、事業ポートフォリオに関す
る議論をさらに深める必要があることを課題として確認しました。
また、重要な投資案件等については、
早い段階から背景情報や論点を共有し、取締役会における議論の質を一層高めていきます。加えて、
社内・社外取締役の連携と情報共有を強化し、多角的な視点を取り入れることで、持続的な成長を支
2025年度の実効性評価(概要)
From Vision to
Progress
中長期戦略
える監督機能のさらなる向上を図っていきます。
-
自己評価アンケート
(外部機関にて集計)
2025年度アンケートの質問票は、以下の大項目で構成されています。各設問は5段階評価方式で回
-
2026年度の注力テーマ
これらの検証を踏まえて、2026年度は以下のテーマに取り組んでいきます。
答を求め、各項目には自由記述欄を設けて意見を収集しています。
Driving Strategic
Progress
事業戦略
▶
統合報告書2026のテーマと注目ポイント
▶
森六グループの理念
▶
事業紹介
▶
価値創造プロセス
▶
360年以上続く森六「価値創造の進化」
▶
目次・編集方針
▶
社長メッセージ
▶
中期経営計画
▶
財務戦略
▶
財務・非財務ハイライト
▶
特集
▶
● 中長期的な経営戦略・資本効率に関する議論の深化
自己評価アンケートの項目
(大項目)
-
取締役会のあり方
-
取締役に対する支援体制
-
取締役会の構成
-
トレーニング
-
取締役会の運営
-
株主(投資家)
との対話
-
経営戦略・経営計画
-
ご自身の取り組み
-
内部統制・リスク管理
-
指名・報酬諮問委員会の運営
6.(監査等委員以外の)社内取締役のパフォーマンス
-
監査等委員会の評価
-
社外取締役のパフォーマンス
-
総括
指名・報酬諮問委員会の活動状況
ケミカル事業
Progress toward
Sustainability
価値創造の
基盤
▶
DX戦略
▶
法務・知財戦略
▶
森六グループのサステナビリティ経営
▶
取り組み報告
取締役会の諮問機関として、任意の指名・報酬諮問委員会を設置しています。
これにより取締役の
取締役からのアンケート結果(一例)
指名・報酬に関し、取締役会の機能の独立性・客観性を高めるとともに、外部への説明責任を果たして
● 企業価値向上に向けて、
資本コストや資本収益性、株価を意識した経営、事業ポートフォリオなどに
いきます。
樹脂加工製品事業
▶
● 社内・社外取締役の連携強化による監督機能のさらなる向上
委員会の運営状況
事業戦略
▶
● 取締役会における情報共有・議論プロセスの高度化
� ゾナック モビリティ事業の�
レ
M&Aによる成長戦略
▶
環境
▶
社会
▶
特集
� 員座談会�
社
現場から描くNEW VALUE
ガバナンス
▶
Data
▶
主要財務データ
よび固定基本報酬、取締役・執行役員人事案、
スキルマトリックス、社外取締役の在任期間、後継者計
▶
主要非財務データ
営面の改善が進んでいる。一方で、重要な投資案件や中長期的な経営戦略については、
より早い段
画等について審議し、役員の指名・報酬に関する客観性と透明性の向上に取り組みました。
▶
企業情報
階から背景情報や論点を共有し、議論をさらに充実させることが望ましい。
(
2025年度は指名・報酬諮問委員会を合計11回開催しました。主に役員報酬制度、業績連動報酬お
ついて、取締役会でより踏み込んだ議論を行う必要がある。
● 経営会議の議題や議論状況が取締役会にも共有されるなど、
モニタリング機能の発揮に向けた運
P.57
役員報酬)
● 社外取締役が監督機能を十分に発揮するためには、
議案の周辺情報や決定に至るプロセス、ネガ
IRサイト
ティブ情報を含む適時・適切な情報提供が重要であり、社内取締役と社外取締役の意思疎通をさら
業績ハイライト
に深めることが有効である。
ESGデータブック
MORIROKU 55 INTEGRATED REPORT 2026
有価証券報告書
コーポレート・ガバナンス
INDEX
2025年度の監査を通じ、当社の内部統制は概ね有効に機能していると評価しています。一方で、外
監査等委員会の活動状況
部環境の変化や他企業での不祥事を踏まえ、
コンプライアンス意識の浸透、内部統制の実効性確保、
監査等委員会の基本的姿勢
ガバナンス文化の定着を引き続き重要課題と認識し、継続的な改善に取り組んでいきます。
監査等委員会は、法令遵守、
リスクの未然防止およびグループ内部統制の強化を基本方針とし、取
締役会や、
その他の重要会議への出席を通じて、経営判断の適法性・妥当性を厳正に監視しています。
また、
独立した立場から経営陣との建設的な対話を重ね、
持続的成長に資するガバナンスの実効性向上
■ 2025年度監査等委員会活動内容(詳細)
監査重点分野
に努めています。具体的には、主に以下の取り組みを通じて監査の透明性と実効性を高めています。
①サステナビリティ
③ガバナンス強化
②DX(デジタルトランスフォーメーション)
④リスク管理
⑤グループ一体運営
⑥内部統制(法令遵守、危機管理、情報管理、理念・行動指針の運用状況を含む)
①社外監査等委員による客観性の高い視点からの監査・監督
● 特にサステナビリティ領域では、
労働環境・安全対策・人権尊重など非財務情
②経営陣に依存しない情報入手ルートの確保
報の信頼性確保に留意し、往査を通じて現場実態の把握に努めました。
③内部監査室・法務知財部などとの直接連携
④重要会議への継続的出席
重要会議への出
● 監査等委員は、
取締役会、監査等委員会、株主総会、経営会議、事業計画検討
との対話
● 代表取締役等とは、
監査計画・実施状況の共有、毎月の定例ミーティング、社外
席および経営陣
会等の重要会議に出席し、意思決定プロセスの監視を適切に行いました。
取締役協議会、拠点視察、諮問・答申、必要なヒアリング等を通じて、継続的な
監査等委員会の構成
監査等委員会は、常勤監査等委員1名、社外監査等委員2名で構成されています。各委員は、会社経
営、会計・税務、法務・コンプライアンス、
リスク管理、国際法務、サステナビリティなど、多様な専門性
を有しており、財務・非財務双方の観点から監査を実施できる体制を整えています。
監査等委員は、内部監査部門および会計監査人との連携を図るとともに、定時監査等委員会を原
則として毎月1回開催するほか、必要に応じて臨時監査等委員会を開催しています。委員会には、内部
監査室との連携強化などを目的として、同室スタッフが兼務で参画しています。
情報交換を実施しました。
往査の実施
● 期末・四半期決算、
会社法に基づく計算書類、
有価証券報告書等を中心に、
適時
活動
● 会計監査人との論点共有や期中監査計画の確認、
取締役候補者および会計監
査人再任に関する審議など、
ガバナンス上重要な事項についても適切に対応し
期末監査報告会、四半期レビュー、拠点監査立会い、定例ディスカッション
当社グループの事業拡大や外部環境の変化を踏まえ、以下の領域を重点的に監査していきます。
内部監査室
月次ミーティング、四半期報告、J-SOX状況確認
法務知財部
● 内部統制整備、
PMIのリスク管理、統制水準の整合性を確認する。
内部通報・相談案件の月次報告と意見交換
- 事業統合に伴う
- 内部統制・
● 法令遵守体制、
内部統制の実効性、
コンプライアンス意識の浸透
内部統制・ガバナンス監査
コンプライアンス監査
2025年度の活動内容
2025年度は監査等委員会を合計20回開催しました。サステナビリティ、DX、
ガバナンス強化、
リスク
管理等を重点項目として監査を行い、重要会議への出席、経営陣との対話、関係部署との連携、国内
外拠点への往査を通じて、内部統制の実効性を確認しました。
Driving Strategic
Progress
事業戦略
統合報告書2026のテーマと注目ポイント
▶
森六グループの理念
▶
事業紹介
▶
価値創造プロセス
▶
360年以上続く森六「価値創造の進化」
▶
目次・編集方針
▶
社長メッセージ
▶
中期経営計画
▶
財務戦略
▶
財務・非財務ハイライト
▶
特集
▶
● 文化差異に起因するガバナンス・非財務リスクを注視する。
● 地政学リスク・物価高騰を踏まえ、
取引先の経営状況把握、与信管
- 独立性・公正性を
● 重要会議への出席や内部監査部門との連携を通じ、
取締役等の
基盤とした監査
MORIROKU 56 INTEGRATED REPORT 2026
理の適正性、
リスク管理体制の機能状況を確認する。
職務執行の適法性・妥当性を監査し、監査の実効性向上を図る。
樹脂加工製品事業
ケミカル事業
▶
Progress toward
Sustainability
価値創造の
基盤
▶
DX戦略
▶
法務・知財戦略
▶
森六グループのサステナビリティ経営
▶
取り組み報告
▶
環境
▶
社会
▶
特集
� 員座談会�
社
現場から描くNEW VALUE
ガバナンス
▶
Data
状況を厳正に確認し、
ガバナンス文化の定着状況を評価する。
- 取引先リスク監査
� ゾナック モビリティ事業の�
レ
M&Aによる成長戦略
事業戦略
▶
2026年度の活動方針
会計監査人
会社法内部統制システムに関する四半期報告の受領と協議
中長期戦略
開示や株式配当を含め、法令遵守の観点から監査を実施しました。
ました。
監査等委員会は、以下の関係部署との連携を通じて、監査の網羅性と実効性を確保しています。
Progress
リスク管理、法令遵守体制、内部統制の運用状況等を確認しました。
決算・開示等を
中心とした監査
From Vision to
▶
● 国内外11拠点に対し計14回の往査を実施し、
生産状況、労働環境、安全対策、
関連部署との連携
業務部
Introduction
イントロダクション
▶
主要財務データ
▶
主要非財務データ
▶
企業情報
IRサイト
業績ハイライト
ESGデータブック
有価証券報告書
コーポレート・ガバナンス
INDEX
Introduction
役員報酬
イントロダクション
取締役の報酬体系
基本的な考え方
森六は取締役の報酬制度を、企業価値の持続的な向上を図るために不可欠な人材を確保・維持
し、動機づけるための仕組みと位置づけています。
固定基本報酬
業績連動報酬
株式報酬
65
25
10
比率
From Vision to
役員報酬の水準は、当社の事業内容および経営環境と、当社と同規模の主要企業における報酬水
準を踏まえ、決定しています。
Progress
● 職責の大きさに応じ
た役位ごとの月例の
固定金銭報酬
取締役の報酬
当社の取締役(監査等委員である取締役および社外取締役を除く)の報酬は、固定基本報酬、業績
連動報酬および株式報酬で構成されています。業績に連動する報酬(業績連動報酬および株式報酬)
が報酬総額に占める割合は、概ね35%となるよう設定しています。
業績連動報酬は短期のインセンティブ報酬として、事業年度ごとの業績に基づき変動する業績連動
の金銭報酬としています。その額は、固定基本報酬の月額に一定の係数を乗じた額に対して、連結売
上高(評価ウェイト25%)、連結営業利益(評価ウェイト50%)、親会社株主に帰属する当期純利益(評
価ウェイト25%)の目標への達成度に応じた係数(目標達成時に100%、0%〜200%の範囲で支給額
● 事業年度ごとの業績に連動する
金銭報酬
● 固定基本報酬の月額に一定の
係数を乗じた額に対して、連結
売上高(評価ウェイト25%)、連
結営業利益( 評価 ウェイト
50%)、親会社株主に帰属する
当期純利益
(評価ウェイト25%)
の目標への達成度に応じた係
数(目標達成時に100%、0%〜
200%の範囲で支給額を変動)
を乗じて算出し、
毎年、
一定の時
期に支給します。
● 業績連動の譲渡制限付株式
報酬
● 中計指標の達成により譲渡制
限を解除
に基づき変動する業績連動の譲渡制限付株式報酬としています。原則として、中期経営計画の初年度
に付与します。在任期間中に株式が付与されることで、株主との一層の価値共有を進めるものとし
ます。付与する株式数は、基本報酬に対する割合で設定され、中期経営計画に掲げる財務指標および
サステナビリティ指標を用い、指標に係る目標達成を条件として、
または目標達成度に応じて譲渡制限
を解除します。
報酬の返還等(マルス条項・クローバック条項)
報酬制度の健全性を確保することを目的に、重大な社内規定違反その他の非違行為や報酬額算
定の基礎となった指標に影響を及ぼす会計上その他の重大な過誤や不正等の一定の事由が生じた
場合に、指名・報酬諮問委員会の審議を経た取締役会の判断により、業績連動報酬と株式報酬を対
Driving Strategic
Progress
主な中計指標
事業戦略
● 連結営業利益
取締役(監査等委員)
(うち社外取締役)
▶
価値創造プロセス
▶
360年以上続く森六「価値創造の進化」
▶
目次・編集方針
▶
社長メッセージ
▶
中期経営計画
▶
財務戦略
▶
財務・非財務ハイライト
▶
特集
▶
報酬等の種類別の総額(百万円)
基本報酬
業績連動
報酬等
非金銭
報酬等
対象となる
役員の
員数(名)
132
(32)
107
(32)
25
(―)
―
(―)
6
(4)
34
(16)
34
(16)
―
(―)
―
(―)
4
(2)
(注)1.上記には、2025年6月20日開催の第110期定時株主総会終結の時をもって辞任により退職した取締役(監査等委員)
1名を含んでいます。
2.取締役の報酬等の額には、使用人兼務取締役の使用人分給与は含んでいません。
3.2025年3月期連結業績の結果を踏まえ、業績に対する経営責任を明確にするため、2025年5月から2か月間、代表取締
役社長の月額報酬の30%を減額しました。
事業戦略
樹脂加工製品事業
ケミカル事業
価値創造の
基盤
▶
DX戦略
▶
法務・知財戦略
▶
森六グループのサステナビリティ経営
▶
取り組み報告
▶
環境
▶
社会
▶
特集
� 員座談会�
社
現場から描くNEW VALUE
ガバナンス
▶
Data
▶
主要財務データ
▶
主要非財務データ
▶
企業情報
IRサイト
象に、未支給の報酬の没収(マルス条項)
・支給済みの報酬の返還(クローバック条項)を求めること
業績ハイライト
ができるものとしています。
ESGデータブック
MORIROKU 57 INTEGRATED REPORT 2026
� ゾナック モビリティ事業の�
レ
M&Aによる成長戦略
▶
向上
取締役の報酬等の総額
取締役(監査等委員を除く)
(うち社外取締役)
事業紹介
● 社員エンゲージメントの
Sustainability
区分
森六グループの理念
▶
● CO2排出量削減率
Progress toward
報酬等の
総額
(百万円)
統合報告書2026のテーマと注目ポイント
▶
▶
を変動)
を乗じて算出し、毎年、一定の時期に支給します。
株式報酬は中長期の業績と企業価値向上に対するインセンティブ報酬として、業績や経営指標等
中長期戦略
▶
有価証券報告書
コーポレート・ガバナンス
INDEX
社外取締役からのメッセージ
Introduction
イントロダクション
現場との対話を重ねながら
執行を支援・監督し
企業価値向上を目指します
現場の知見を活かし、
成長戦略と収益性向上を
後押しします
ガバナンス強化を土台に、
挑戦できる組織づくりを
支えていきます
社外取締役
指名・報酬諮問委員
社外取締役
社外取締役
指名・報酬諮問委員長
平井謙一
大塚亮
横手仁美
社外取締役の本質的な役割は、長期ビジョンや第14次中期経営計画
製造業で培った事業運営や現場での知見を活かし、
グループ全体の
森六は、
コーポレート・ガバナンスの強化と経営の透明性向上を目的
の実現に向けた価値創造プロセスに積極的に関与し、
執行サイドのリス
持続的な成長と企業価値向上を意識して提言を行っています。収益性
に、任意の指名・報酬諮問委員会を設置しています。2025年度は社外取
クテイクを支援・監督するとともに、
その成果を評価することだと考えて
向上や成長投資に加え、海外拠点・子会社を含めたグループ全体のガ
締役の任期上限を導入し、選任プロセスの明確化と取締役会の新陳代
います。今回のM&Aは当社として初の試みでしたが、経営陣をはじめ関
バナンス強化についても積極的に意見を述べています。2025年度は、
謝を促すことでガバナンス体制を強化しました。取締役の選任では、森
係者の多大な尽力により実現しました。取締役会でも当初からさまざま
新たにグループへ迎える会社との事業統合に向けたM&Aが、将来の成
六の中長期的な方向性を踏まえ、経営に関する専門性や幅広い知見を
な視点で活発な議論を重ね、意思決定を行うことができました。今後は
長を見据えた重要な戦略的投資でした。投資判断にあたっては、軽量化
重視しています。
PMIによる価値創出が重要な鍵となることから、取締役会としてその進
技術の将来性や新たな顧客基盤、投資採算性、両社の技術融合の可能
捗をフォローしていきます。
また、今後の成長に向け、
さらなるM&Aも選
択肢の一つと考えており、今回の経験を活かしていきたいと思います。
私は2025年度に続き2026年度も、社外取締役協議会の議長、筆頭独
Progress
中長期戦略
Driving Strategic
Progress
事業戦略
統合報告書2026のテーマと注目ポイント
▶
森六グループの理念
▶
事業紹介
▶
価値創造プロセス
▶
360年以上続く森六「価値創造の進化」
▶
目次・編集方針
▶
社長メッセージ
▶
中期経営計画
▶
財務戦略
▶
財務・非財務ハイライト
▶
特集
▶
� ゾナック モビリティ事業の�
レ
M&Aによる成長戦略
事業戦略
▶
樹脂加工製品事業
ケミカル事業
▶
報酬制度は、監査等委員である取締役および社外取締役を除いた取
▶
DX戦略
性を総合的に評価しました。今後はPMIの進捗とシナジーの収益化状
締役を対象に、固定基本報酬に加え、短期業績に応じた金銭報酬と中
▶
法務・知財戦略
況を着実に検証していくことが重要だと考えています。
長期の企業価値向上を促す株式報酬を組み合わせています。社外取締
▶
森六グループのサステナビリティ経営
▶
取り組み報告
サステナビリティについては、
リスク管理にとどまらず、持続的な成長
役についても、報酬の一部を株式報酬とすることを検討していきます。
立社外取締役および指名・報酬諮問委員の任を担っています。2025年
につながる重要な経営課題と捉えています。森六グループが培ってきた
取締役会には、経営陣とともに成長戦略の道筋を描き、攻めの経営を
度から継続する取り組みとして、取締役、特に社外取締役の選任プロセ
材料技術とものづくりの強みに加え、新たに加わった軽量発泡技術な
後押しする役割が求められています。取締役会運営を支えるコーポレー
スの明確化があります。社外取締役の真価は有事に問われます。不正・
どを融合し、環境対応を競争力へと転換していくことを期待しています。
トセクレタリー機能を充実させるとともに、取締役一人ひとりが自己研
不祥事だけでなく、
「同意なき買収」
などに直面した際に主導的に行動
その実現に向け、研究開発など将来を見据えた投資や資源配分につい
鑽に努め、取締役会の実効性を高めていきたいと考えています。
できるか。企業経営の経験も必要だと思いますが、多様なステークホル
て、中長期的な視点から議論を深めていきます。
また、
これまでの経験を
その上で、第14次中期経営計画と長期ビジョンの実現には、
これまで
ダーの利害が交錯する中で、外部の力も借りながら適切な判断ができ
通じ、多様な人材がそれぞれの強みを発揮できる組織づくりが、技術革
の延長線上にはない、企業価値創造を志向した戦略と、その戦略を描
る人材が求められます。時間やリソースが限られている中でそうした人
新や企業価値向上の原動力になると考えています。人材育成に加え、
き、実行できる人材が不可欠です。2023年度から指名・報酬諮問委員を
材を選任できるよう、
これまでの議論を踏まえて取り組んでいきます。
IT・DXを活用した柔軟な働き方など、多様な人材が活躍できる組織づく
務める社外取締役が執行役員候補者全員と面談を重ねており、
こうし
りをさらに後押しし、
その成果を継続的に確認していきます。
社外取締役はマイクロマネジメントになってはいけませんが、現場を
From Vision to
▶
Progress toward
Sustainability
価値創造の
基盤
環境
▶
社会
▶
特集
� 員座談会�
社
現場から描くNEW VALUE
ガバナンス
▶
Data
▶
主要財務データ
た対話を通じて、
経営視点を持った人材の育成にもつなげていきたいと
▶
主要非財務データ
▶
企業情報
含め、会社のことをよく知るべきだと考えます。
そのため、事業所への訪
取締役会の実効性は概ね確保されていると評価しています。今後は
考えています。
また、
攻めの経営のためには、
チャレンジを後押しし、
仮に
問に加え取締役会以外の場でも、経営層から現場まで幅広い社員との
必要な情報に加え現場の一次情報もタイムリーに共有しながら、成長戦
うまくいかなかった場合でも要因を分析し、学び、前進できる組織風土
対話・コミュニケーションを図っていきます。
その上で、私の役割は投資
略や投資判断に関する議論をさらに深めることで、実効性を一層高め
が大切です。
これは森六の行動指針にある
「人間尊重」や、大切にする
IRサイト
業績ハイライト
家をはじめとするステークホルダーの視点に立って発言し続けることだ
ていきたいと考えています。引き続き、現場を知る経営者としての視点を
価値観「進取の精神」
「同心協力」にも通じ、社員エンゲージメント向上
と考えています。今後も社外取締役協議会などで認識を共有しながら、
活かし、技術・品質・収益性を結びつけた実効性ある助言を行い、森六
やダイバーシティ推進にもつながると考えます。私も社外取締役として、
取締役会の実効性を高め、
企業価値向上に取り組んでいきます。
グループの持続的な成長と企業価値向上に貢献していきます。
経営陣の適切なリスクテイクを引き続き支えてまいります。
MORIROKU 58 INTEGRATED REPORT 2026
▶
ESGデータブック
有価証券報告書
コーポレート・ガバナンス
INDEX
社外取締役からのメッセージ
Introduction
イントロダクション
事業変革やPMIの経験を
活かし、変化への挑戦を
後押ししていきます
現場の声を聴き、誰もが
安心して能力を発揮できる
環境づくりに貢献します
社員との対話を通じ
実態を捉えたモニタリングを
行っていきます
社外取締役
社外取締役
監査等委員
社外取締役
監査等委員
光冨眞哉
新任
辻千晶
西尾陽一
From Vision to
Progress
新任
2026年6月、森六の社外取締役に就任いたしました。前職の株式会社
弁護士としての経験を踏まえ、社外の独立した立場から業務執行の
私は、2026年6月に監査等委員である取締役に就任しました。監査等
日立製作所では、鉄道事業のグローバル化やM&A、
ビル事業の経営に
全体を俯瞰し、将来の重要リスクを早期に把握することが、監査等委員
委員である取締役は、監査の役割も担いつつ、取締役会における意思
携わってきました。森六の事業領域とは異なる業界で培った知見に加
である私の役割だと考えています。執行に単にブレーキをかけるのでは
決定にも参加します。昨今、取締役会は企業価値の向上に向けて経営
え、十数年にわたり大胆なグローバル化や事業ポートフォリオ変革を遂
なく、
リスクを見極めて必要な対応を促し、会社が安心して前に進める
陣の適切なリスクテイクを後押しすることも求められるようになってお
げた前職での経験を、森六の成長への助言に活かしていきたいと考え
環境を整えることが責任であると認識しています。
り、監査等委員である取締役は、いわばブレーキ役とアクセル役を同時
ています。
2025年度は、一社化や事業構造改革、M&Aなど、大きな変革が続い
中長期戦略
Driving Strategic
Progress
事業戦略
▶
統合報告書2026のテーマと注目ポイント
▶
森六グループの理念
▶
事業紹介
▶
価値創造プロセス
▶
360年以上続く森六「価値創造の進化」
▶
目次・編集方針
▶
社長メッセージ
▶
中期経営計画
▶
財務戦略
▶
財務・非財務ハイライト
▶
特集
▶
� ゾナック モビリティ事業の�
レ
M&Aによる成長戦略
事業戦略
▶
樹脂加工製品事業
ケミカル事業
▶
に担うような、難しい役割だと認識しています。
DX戦略
事業ポートフォリオの中核である樹脂加工製品事業は、EV化や環境
た一年でした。変革期には新たな成長機会を捉える一方で、組織・制
就任1年目で森六について学ぶ途上ではありますが、現在の森六の
▶
課題の解決を求める社会的要請の高まりなどにより、市場環境の大き
度・内部統制が変化に十分対応できているかを検証することが重要で
あり方は、長い歴史を持ちながら、上場企業としてはまだまだフレッシュ
▶
法務・知財戦略
な転換期にありますが、研究開発力や顧客基盤、パートナー企業との連
す。監査等委員会では、サステナビリティ、DX、
ガバナンス、
リスク管理、
であるというユニークな背景が反映されていると感じています。長い期
携により、基盤事業の革新と新領域の構築が期待できると感じていま
グループ一体運営、内部統制を相互に関連する課題と捉え、見落とされ
間存続してきた真面目な会社が、
コーポレートガバナンス・コードやサス
▶
森六グループのサステナビリティ経営
▶
取り組み報告
す。EV化や車両軽量化に対応する高機能材料やリサイクル材料は、
がちなリスクや制度上の課題を早期に把握し、
適切な改善につなげるこ
テナビリティ経営といった新しい概念を真摯に学び、社会や投資家の要
今後ますます社会的ニーズの高まりが見込まれ、
当社の大きな成長エン
とを基本方針として監査を行いました。特に重視したのは、事業統合後
請に応えようとしていると捉えています。
ジンになり得ると考えています。
これらの強みが売上成長や利益率向上、
に内部統制・コンプライアンス・リスク管理が、実効的に機能する体制と
現在2年目である第14次中期経営計画は、
こうした姿勢を具体的な
ROIC改善にどのように結びつくか、
その可能性を具体的に見極めるべ
なっているかという視点です。事業統合では制度の整備だけでなく、各
項目や計画に落とし込んでおり、進捗もKPIで客観的に把握できるよう
く、取締役会で議論を深めていきたいと考えています。
社が培ってきた企業文化や強みを尊重しながら価値観を共有し、一体
設計されています。社会的な課題に幅広く目配りする一方で、会社の収
また、森六は2025年にM&Aを決定し、2026年度から本格的なPMIの
感あるグループ経営を実現することが重要です。その意味では内部統
益や成長にとっての重要度に応じてメリハリをつけており、企業価値の
フェーズに入っています。
この統合をいかに成功させるかが、
森六が今後
制やガバナンスの強化が着実に進む一方、組織文化の定着は継続的な
向上につながる計画となっています。一方で、第14次中計のKPIの達成
大きく成長していく上で極めて重要であることは言うまでもありません。
課題だと認識しています。
状況を表面的に追うだけでは、株主からの負託を受けた社外取締役の
前職では鉄道事業とビル事業で大きな買収とPMIを経験してきましたの
で、
その経験と知見を役立てていきたいと思います。
監査は会議室で完結するものではなく、
現場を見て、
現場の声を聴くこ
とが重要です。
今後も新たにグループに加わった会社の国内外の拠点に
Progress toward
Sustainability
価値創造の
基盤
環境
▶
社会
▶
特集
� 員座談会�
社
現場から描くNEW VALUE
ガバナンス
▶
Data
▶
主要財務データ
責務を十分に果たしているとは言えません。例えば人的資本に係る項目
▶
主要非財務データ
は、本来数値化の難しい項目であり、社員エンゲージメント向上といっ
▶
企業情報
社員の多様性を尊重し、徹底的に議論し、高い「志」
を抱き、
「情熱」
を
積極的に足を運び、
社員との対話を通じて強みや課題を自ら確認してまい
た人事施策を土台に、
社員が真に主体的に業務に取り組んでこそ、
新た
もって成し遂げることこそ、企業の成長に欠かせないものです。同時に、
ります。
そうした対話の中で改めて実感するのは、
人材こそが最大の財産
な価値創造につながります。幸い、監査等委員は取締役会以外にも往
IRサイト
自社を取り巻く大きな事業環境の変化に果敢に
「挑む」
ことも、
中期経営
だということです。
多様な人材が互いを尊重し、
社員一人ひとりが安心して
査等で多くの社員と接する機会があります。社員との対話などを通じて
計画や長期ビジョンの達成には欠かせません。前職で培った経験を活
能力を発揮できる組織風土を育むことが、
企業価値の向上につながると考
より実態に即したモニタリングを行い、執行サイドに必要に応じて働き
業績ハイライト
かし、
挑戦を後押ししながら、
森六のさらなる発展に貢献してまいります。
えます。
今後もそのような環境づくりに貢献できるよう、
努めてまいります。
かけることで、当社の企業価値の向上に貢献していきたいと思います。
MORIROKU 59 INTEGRATED REPORT 2026
▶
ESGデータブック
有価証券報告書
コーポレート・ガバナンス
INDEX
Introduction
リスクマネジメント
イントロダクション
基本的な考え方
BCPへの取り組み
森六グループでは、事業目的の達成を阻害する、
または望ましくない影響を与える可能性のある事
象や行為を
「リスク」
と定義しています。事業継続と安定的な成長の確保を図るため、事業にまつわる
さまざまなリスクについて、的確に把握、評価、対応すべく、管理体制を整えています。
森六グループは、
「 BCP基本方針」を策定し、従業員の安全が最優先という考えのもと、平時から
防災・BCP体制の整備に取り組んでいます。
2025年度は、備蓄品を含む防災関連資源を拡充したほか、危機管理体制の整備に伴い、危機管理
また、
リスク管理体制を適切に整備・運用するため、
「リスク管理基本方針」および「リスク管理基本
規定・初動対応マニュアルを全面的に見直し、役員机上訓練を実施するなど、防災体制を強化しま
規定」
を制定しています。事業本部や国内外子会社における潜在リスクを予見し、事前に対応すること
した。
各工場や部門においても、
地震や水害を想定したボトルネックの洗い出しと対策を推進し、バック
で、
リスクの極小化を目指しています。
アップサーバーの増強や代替通信手段の確保、代替財務機能に関するBCP訓練の実施など、災害か
コーポレート共通リスクに対応する部門は、事業本部・国内外子会社に対し、
リスク対応の助言・支
らの早期復旧に向けた体制整備を進めています。
援を担います。
リスクが顕在化し、危機が発生した場合は「リスク管理基本規定」に則り、速やかに経
2026年度はこれらの防災・BCP対策をさらに推進するとともに、全従業員の防災意識と対応力の
営層および関係部署に報告され、迅速に対応する仕組みを構築しています。取締役会は、
これらのグ
向上を図るため、教育・訓練に重点的に取り組んでいます。
また、海外拠点における安否確認訓練とリ
ループリスク管理体制および取り組み状況について年に1回議論し、その結果は次年度の対応計画
スク調査を実施することで、
グループ全体のレジリエンス向上に取り組んでいきます。
に反映されます。
こうした活動を通じ、事業本部・国内外子会社でのリスクマネジメント活動を定着さ
BCP基本方針
せ、
グループ全体のリスク低減を図るとともに、従業員一人ひとりのリスク意識向上に努めています。
森六グループにおける主要なリスク
リスク対応の実施
経理、
財務
資産保全、
損失
●法令違反 ●人事
・労務
●知財 ●訴訟
●情報漏洩 ●自然災害
▶
価値創造プロセス
▶
360年以上続く森六「価値創造の進化」
▶
目次・編集方針
▶
社長メッセージ
▶
中期経営計画
▶
財務戦略
▶
財務・非財務ハイライト
▶
特集
▶
� ゾナック モビリティ事業の�
レ
M&Aによる成長戦略
事業戦略
▶
樹脂加工製品事業
●
経営企画担当
情報システム担当
生産事業担当
ケミカル事業担当
事務局長
共有先
MORIROKU 60 INTEGRATED REPORT 2026
Sustainability
DX戦略
▶
法務・知財戦略
▶
森六グループのサステナビリティ経営
▶
取り組み報告
業務部
経営企画部
▶
環境
▶
社会
▶
特集
ガバナンス
Data
国内関係会社
▶
主要財務データ
▶
主要非財務データ
▶
企業情報
IRサイト
情報システム部
� 員座談会�
社
現場から描くNEW VALUE
▶
事業本部各部門
※全社対策本部指示の連絡窓口
●
事務局
Progress toward
▶
コーポレート各部門
業務部管理課
優先対応リスクの選定
年間対応計画の策定
共通リスク
(例)
法務担当
事業本部役員
発生の可能性
● 事業への影響度
●
国内関係会社
財務担当
事業本部総務担当部門
●
リスク識別・評価
リスク対応についての
助言・支援を行う
共有先
業務部管理課
コーポレート共通
リスク担当部門
森六株式会社
各拠点
事業本部役員
●
人事担当
情報共有
報告
事業紹介
全社対策副本部長
事業本部総務担当部門
内部統制上のリスク
業務遂行における
+
リスク
● 危機管理上のリスク
リスク評価基準
全社対策本部長
拠点対策本部
事業本部・国内外子会社
リスク分類
事業戦略
価値創造の
基盤
全社対策本部
報告
リスクが発生する現場としてリスクコントロールを行う
Progress
森六グループの理念
▶
ケミカル事業
事業継続対応(各部門・各社単位)
報告
指示
取締役会
指示
Driving Strategic
統合報告書2026のテーマと注目ポイント
▶
▶
初動対応(拠点単位)
グループリスク管理委員会
中長期戦略
https://www.moriroku.co.jp/sustainability/governance/risk/bcp.html
■ リスク管理体制図
指示
Progress
■ 大規模災害発生時の危機管理体制
https://www.moriroku.co.jp/sustainability/governance/risk/index.html
業務の適正を確保するための
体制を整備する
From Vision to
▶
コーポレート
コミュニケーション室
業績ハイライト
ESGデータブック
有価証券報告書
コーポレート・ガバナンス
INDEX
リスクマネジメント
Introduction
コンプライアンス
情報セキュリティへの取り組み
イントロダクション
基本的な考え方
森六グループは、情報資産の保護を最優先とし、不正アクセスや情報漏洩、不正利用を防ぐため、
リ
森六グループでは、経営理念のもと、行動指針の第1項目に『法令遵守』
を掲げ、森六株式会社に社
スク管理を徹底しています。法令を遵守し適切な情報管理を実施するとともに、全従業員に対して継続
長直轄の法務知財部を設置し、森六グループ全体のコンプライアンス活動を主導しています。行動指
的な教育を行い、セキュリティ知識と意識の定着を推進しています。2025年度は新たな取り組みとし
針は9か国語に展開し、各グループ会社に周知の上、浸透に努めています。
て、攻撃対象領域の把握とリスクの早期検知を目的に、ASM ※を導入し、継続的かつ効率的な監視体
From Vision to
Progress
中長期戦略
森六グループ行動指針
https://www.moriroku.co.jp/company/principle/pki7t90000000jiq-att/conduct̲guideline.pdf
制へ移行しました。
※ASM:Attack Surface Managementの略で、外部に公開されたIT資産や脆弱性を継続的に把握・管理する仕組み。
内部通報制度の整備・運用
Driving Strategic
近年、サイバー攻撃の脅威は増大しており、その被害は個人情報の流出、企業機密の漏洩、システ
法令や社内規則等に反する行為について通報・相談できるよう、内部通報・相談窓口を社内および
事業戦略
ム停止による業務中断など多岐にわたります。当社グループでは、セキュリティインシデントを未然に
社外に設置しています。関係法令に基づき、通報・相談者に対する報復その他の不利益な取り扱いを
防ぐための対策を行うとともに、万が一、
インシデントが発生した際にも迅速かつ的確に対応し、事業
禁止するとともに、匿名でも通報・相談できる体制を整えています。
の継続性を確保できるよう取り組んでいます。2025年度はCSIRT ※ 体制を構築し、サイバーセキュリ
■ 森六グループでの内部通報の概略関係図
セキュリティインシデントへの対応
ティ演習を実施しました。
調査
■ 情報セキュリティ体制の強化による企業価値の向上
+ 調査チーム
予防措置
●
インシデント対応
インシデントの検出・封じ込め・
初動対応
● 外部SOC
・外部機関との連携
● 原因分析と被害状況の特定・
評価
● システム
・業務の復旧対応
● 再発防止策の策定
・実施による
セキュリティ向上
●
被通報者、
関係者
トレーニングと演習
全従業員へのセキュリティ教育
● サイバー攻撃演習の実施
Do
継続的なセキュリティ改善で
企業価値を守る
情報共有と報告
Act
Check
社外取締役等
情報共有・
意見交換
監査等委員
事業紹介
▶
価値創造プロセス
▶
360年以上続く森六「価値創造の進化」
▶
目次・編集方針
▶
社長メッセージ
▶
中期経営計画
▶
財務戦略
▶
財務・非財務ハイライト
▶
特集
▶
メール報告
通報・相談
社外窓口
事業戦略
樹脂加工製品事業
Progress toward
Sustainability
価値創造の
基盤
▶
DX戦略
▶
法務・知財戦略
▶
森六グループのサステナビリティ経営
▶
取り組み報告
コンプライアンス担当役員
▶
環境
▶
社会
▶
特集
� 員座談会�
社
現場から描くNEW VALUE
ガバナンス
▶
メール同時報告
経営トップから社員一人ひとりに至るまでコンプライアンスを徹底するために、
法務・コンプライアンス教
育体系に基づき、
森六グループの役員・社員に対して、
法務・コンプライアンス教育を実施しています。
2025年
Data
▶
主要財務データ
▶
主要非財務データ
▶
企業情報
IRサイト
度は、
関係部門および国内子会社を対象に、
下請法改正
(現:中小受託取引適正化法)
を含むコンプライアン
業績ハイライト
ス研修を実施しました。
今後も事業に密接に関連する法令等に関する研修や情報提供を継続していきます。
ESGデータブック
MORIROKU 61 INTEGRATED REPORT 2026
� ゾナック モビリティ事業の�
レ
M&Aによる成長戦略
ケミカル事業
規定に従い、
報告
社長
是正措置の実施
森六グループの理念
▶
▶
コンプライアンス研修の継続実施
セキュリティポリシーの策定・維
持・見直し・管理
● CSIRTによる継続的な状況把握
● インシデントに関する情報収集
・
状況可視化
● 関係機関との情報共有
●
規定に従い、
協議・報告
違反行為会社社長・
担当役員・部門長
●
通報・相談
コンプライアンス通報対応事務局(社内窓口・調査)
調査
予防・検知・対応・改善のサイクルを継続的に回し、
セキュリティレベルを向上させます。
Plan
通知・報告等
統合報告書2026のテーマと注目ポイント
▶
▶
通報者(役員、正社員、契約社員、派遣社員、取引先等)
※CSIRT:セキュリティインシデントの予防・検知・対応を担う専門チーム
サイバー脅威情報の収集・分析・
対策への反映
● システムに対する脆弱性評価と
リスク評価、
対策実施
Progress
▶
有価証券報告書
最新情報:業績ハイライト
Data 主要財務データ(9か年)
経営成績
売上高
18.3期
19.3期
20.3期
21.3期
22.3期
https://www.moriroku.co.jp/ir/financial̲information/highlight/index.html
23.3期
24.3期
25.3期
(単位:百万円)
26.3期
Introduction
イントロダクション
182,177
189,554
170,773
155,460
128,842
142,019
145,638
146,174
133,871
114,998
122,331
106,929
93,304
101,786
112,259
118,740
120,103
108,413
67,178
67,222
63,844
62,155
27,055※1
29,759※1
26,898※1
26,070※1
25,458※1
9,417
8,686
5,497
5,672
2,846
1,335
5,706
4,135
4,638
5.2
4.6
3.2
3.6
2.2
0.9
3.9
2.8
3.5
8,074
7,532
4,553
4,579
1,253
100
4,604
3,445
5,562※2
1,382
1,177
1,215
1,389
1,836
1,575
1,538
1,235
1,544
経常利益
9,256
8,827
5,668
5,595
2,965
1,596
6,183
2,204
3,993
親会社株主に帰属する当期純利益
6,805
6,112
3,525
375
4,259
1,346
3,022
△ 7,814
2,447
1株当たり当期純利益(円)
446.00
369.42
212.89
22.68
258.92
86.34
200.95
△ 532.37
170.79
減価償却費
7,526
7,993
7,943
7,801
7,916
8,320
8,699
7,899
6,344
研究開発費
2,408
2,701
2,570
2,579
2,609
3,030
3,255
3,724
3,567
樹脂加工製品事業
ケミカル事業
営業利益
営業利益率[%]
INDEX
セグメント利益
樹脂加工製品事業
ケミカル事業
キャッシュ・フロー
※2
営業活動によるキャッシュ・フロー
15,388
18,358
6,042
9,693
3,434
9,495
14,764
9,348
7,721
投資活動によるキャッシュ・フロー
△ 8,819
△ 7,186
△ 12,857
△ 5,260
△ 1,140
△ 5,311
△ 6,630
△ 3,751
△ 7,546
財務活動によるキャッシュ・フロー
1,562
△ 9,016
△ 112
1,633
△ 2,824
△ 5,310
△ 7,221
△ 6,407
現金および現金同等物残高(期末)
17,190
18,906
11,653
17,933
18,358
17,658
19,444
19,088
財政状態
Progress
事業戦略
価値創造プロセス
▶
360年以上続く森六「価値創造の進化」
▶
目次・編集方針
▶
社長メッセージ
▶
中期経営計画
▶
財務戦略
▶
財務・非財務ハイライト
▶
特集
▶
樹脂加工製品事業
ケミカル事業
▶
15,305
法務・知財戦略
▶
森六グループのサステナビリティ経営
▶
取り組み報告
132,887
137,125
131,797
140,556
124,634
123,733
純資産
66,672
67,440
66,467
70,136
72,067
70,683
76,423
64,911
67,355
49.1
51.8
53.3
51.8
51.6
52.6
53.4
51.1
53.5
25,948
19,397
20,869
24,282
26,786
26,574
24,830
21,018
19,820
投下資本利益率(ROIC)
[%]※3
7.5
6.8
4.4
4.4
2.1
1.0
4.0
3.1
3.8
自己資本利益率(ROE)
[%]
11.6
9.3
5.4
0.6
6.1
1.9
4.2
△ 11.3
3.8
総資産利益率(ROA)
[%]
5.4
4.7
2.8
0.3
3.2
1.0
2.2
△ 5.9
2.0
1株当たり配当金(円)
90
94
94
50
94
100
100
105
115
配当利回り
[%]
3.1
3.6
6.3
2.2
5.2
5.4
3.8
5.2
4.8
運転資本回転率[回]
9.0
7.6
12.5
9.5
6.1
7.0
5.8
7.3
5.8
自己資本配当率(DOE)
[%]
―
―
―
―
―
2.2
2.2
2.1
2.7
21.9
25.4
44.2
220.5
62.1
214.3
82.8
△ 27.9
104.9
Sustainability
価値創造の
基盤
▶
環境
▶
社会
▶
特集
� 員座談会�
社
現場から描くNEW VALUE
ガバナンス
▶
Data
▶
主要財務データ
▶
主要非財務データ
▶
企業情報
IRサイト
業績ハイライト
ESGデータブック
MORIROKU 62 INTEGRATED REPORT 2026
� ゾナック モビリティ事業の�
レ
M&Aによる成長戦略
事業戦略
▶
Progress toward
※1 2022年3月期より
「収益認識に関する会計基準」
を適用しています。
※2 一社化に伴い、2026年3月期より、
セグメント利益の算定における本社費用の配分方法を変更しています。
※3 ROIC=税引後営業利益÷
(有利子負債+自己資本)。有利子負債および自己資本は期首期末平均値です。
▶
DX戦略
122,493
総還元性向[%]
Driving Strategic
事業紹介
▶
128,063
財務指標
中長期戦略
森六グループの理念
▶
△ 4,428
133,824
有利子負債
Progress
統合報告書2026のテーマと注目ポイント
▶
▶
総資産
自己資本比率[%]
From Vision to
▶
有価証券報告書
主要非財務データ(5か年)
環境
20.3期
(基準年)
CO2排出量
[t-CO2]
INDEX
22.3期
23.3期
24.3期
25.3期
26.3期
Scope1+2
111,598
―
81,698
69,983
67,925
62,800
Scope3※1
―
445,505
409,061
429,354
438,903
412,007
281,394
273,731
262,265
256,177
235,131
225,152
総エネルギー消費量[MWh]
廃棄物排出量※1[t]
―
電力使用量 [MWh]
水使用量※2[千m3]
※1
975
1,257
1,112
741
757
169,605
161,797
155,789
156,611
141,932
133,232
―
―
―
337
318
288
対象範囲:森六グループ全社(国内/海外)
※1 国内/海外の連結子会社および関連会社を除く。
※2 賃貸ビルは、
ビル全体で水使用量を管理しており、当社使用分の取水量を把握できないため、集計対象外としています。
ガバナンス
取締役数[人]
22.3期
23.3期
24.3期
25.3期
26.3期
5
6
7
9
9
独立社外取締役比率[%]
60
50
67
67
67
女性取締役比率[%]
0
0
11
22
22
指名・報酬諮問委員会
独立社外取締役構成比率[%]
67
67
67
75
75
監査等委員会
独立社外取締役構成比率[%]
コンプライアンス相談窓口への相談件数
(内部通報相談・人権侵害相談を含む)
―
―
10
11
―
9
67
67
12
14
取締役会、監査役会/監査等委員会、指名・報酬諮問委員会
取締役会開催回数[回]
19
17
20
19
18
取締役会出席率[%]
100
100
100
100
99
監査役会/監査等委員会開催回数
[回]
22
19
22
19※3
20※3
監査役会/監査等委員会出席率[%]
100
92
100
100※3
98※3
指名・報酬諮問委員会開催回数[回]
11
8
10
11
11
指名・報酬諮問委員会出席率[%]
100
100
100
100
100
※3 当社は2024年6月18日開催の第109期定時株主総会の承認を経て、監査役会設置会社から監査等委員会設置会社へ移
行しています。2025年3月期の開催回数は、移行前の監査役会7回および移行後の監査等委員会12回の合算値です。2026
年3月期は監査等委員会の開催回数および出席率を記載しています。
環境マネジメントシステム認証取得状況
https://www.moriroku.co.jp/sustainability/environment/iso.html
品質マネジメントシステム認証取得状況
https://www.moriroku.co.jp/sustainability/social/quality.html
社会
人材
22.3期
従業員数(単体)
[人]
900
従業員数(単体)
に占める女性の
17.3
割合[%]
連結従業員数(全体)※4
[人]
4,521
外国籍従業員割合[%]
1.8
平均勤続年数(男性)
[年]
16.0
平均勤続年数(女性)
[年]
11.9
年間研修時間※5
[時間]
―
※5
年間研修費 [円]
―
1人当たりの研修時間[時間]
5.3
1人当たりの研修費※5
[円]
―
離職率[%]
6.3
社員エンゲージメント肯定回答率
37
[%]
社員を活かす環境肯定回答率
[%]
38
全従業員平均給与[円]
5,853,865
給与
男女の賃金差異※7
[%]
73.6
管理職数[人]
181
管理職
女性執行役員比率[%]
9.1
女性管理職比率[%]
2.2
リーダークラス女性比率[%]
6.3
外国籍管理職比率[%]
1.7
新卒採用人数[人]
35
採用
新卒採用女性割合[%]
31.4
中途採用人数[人]
26
中途採用女性割合[%]
15.4
年間採用人数[人]
61
年間採用女性割合[%]
24.6
総合職へのコース転換人数[人]
4
多様な
総合職へのコース転換
働き方
0.0
(女性割合)
[%]
―
労働安全死亡災害件数[件]
労働災害度数率
―
衛生・
―
健康管理労働災害強度率
平均残業時間(月)
[時間]
18.4
有休取得率[%]
67.1
11
育児休業全体人数[人]
男性人数[人]
6
取得者
男性取得率※8
[%]
25.0
男性の平均育休取得日数[日]※9
136
男性復職率[%]
100
女性人数[人]
5
女性取得率※8
[%]
62.5
女性復職率[%]
100
23.3期
898
24.3期
903
25.3期
903
26.3期
895
18.0
18.7
19.5
20.7
4,342
2.1
16.2
11.8
―
―
10.5
―
5.3
4,447
2.1
16.4
11.2
―
―
11.9
―
4.4
4,360
2.3
17.8
11.7
―
―
11.0
―
4.9
3,873
2.8
18.2
12.1
1,004.4
20,802,544
22.5
23,243
6.5
―
―
40
―
5,909,022
75.4
179
8.3
2.2
6.0
1.7
28
14.3
23
47.8
51
29.4
12
―
6,020,987
74.5
184
18.2
2.7
5.1
1.6
26
42.3
23
39.1
49
40.8
11
42
6,229,767
74.6
190
27.3
3.2
6.5
2.1
17
41.2
32
25.0
49
30.6
14
MORIROKU 63 INTEGRATED REPORT 2026
▶
統合報告書2026のテーマと注目ポイント
▶
森六グループの理念
▶
事業紹介
▶
価値創造プロセス
▶
360年以上続く森六「価値創造の進化」
▶
目次・編集方針
▶
社長メッセージ
▶
中期経営計画
―※6
▶
財務戦略
―
6,442,564
76.9
199
17.6
5.6
6.5
2.0
18
44.4
21
28.6
39
35.9
5
▶
財務・非財務ハイライト
▶
特集
From Vision to
Progress
中長期戦略
※6
50.0
9.1
21.4
20.0
―
―
―
17.5
70.9
12
6
30.0
110
100
6
120.0
100
0
1.25
0.05
19.4
74.4
9
4
30.8
132
100
5
125.0
100
0
0.60
0.00
17.0
74.1
8
4
44.4
146
100
4
133.3
100
0
0.00
0.00
16.9
77.1
13
8
61.5
84
100
5
83.3
100
対象範囲:森六株式会社
(2025年3月期以前は森六ホールディングス株式会社、
森六テクノロジー株式会社、
森六ケミカルズ株式会社)
※4 森六グループ全社(国内/海外)
※5 2026年3月期より公表
※6 2026年3月期は社員エンゲージメント調査を実施してい
ないため、数値を掲載していません。
※7 男性の賃金を100とした場合の女性の値
Introduction
イントロダクション
※8 「育休取得者数÷出産者数」。子どもが生まれた年度に
育児休業を取得せず、翌年度に取得した従業員が含ま
れるため、100%を超えることがあります。
※9 各年度における取得日数
Driving Strategic
Progress
事業戦略
▶
� ゾナック モビリティ事業の�
レ
M&Aによる成長戦略
事業戦略
▶
樹脂加工製品事業
ケミカル事業
▶
Progress toward
Sustainability
価値創造の
基盤
▶
DX戦略
▶
法務・知財戦略
▶
森六グループのサステナビリティ経営
▶
取り組み報告
▶
環境
▶
社会
▶
特集
� 員座談会�
社
現場から描くNEW VALUE
ガバナンス
▶
Data
▶
主要財務データ
▶
主要非財務データ
▶
企業情報
IRサイト
業績ハイライト
ESGデータブック
有価証券報告書
企業情報(2026年3月31日現在)
INDEX
■ 会社概要
■ 株式情報
設立
1916年(大正5年)3月 ※創業は
「嶋屋」
(寛文3年)
上場市場
東京証券取引所 プライム市場
資本金
16億4,010万円
証券コード
4249
〒107-0062 東京都港区南青山1-1-1
発行可能株式総数
60,000,000株
発行済株式総数
14,410,000株(自己株式40,119株を含む)
株主数
5,760名
本社
新青山ビル東館18階
■ グループ会社(連結子会社・持分法適用会社)
樹脂加工製品事業
森六テクノロジー・オーバーシーズ・ホールディングス
(株)
(株)
ユーコウ
熊本森六化成(株)
Moriroku Technology North America Inc.
Listowel Technology, Inc.
Moriroku Philippines, Inc.
Moriroku Technology India Pvt. Ltd.
Moriroku Technology(Thailand) Co., Ltd.
PT. Moriroku Technology Indonesia
広州森六塑件有限公司
武漢森六汽車配件有限公司
※2026年4月1日付で、森六ReNova株式会社等がグループに加わりました。
ケミカル事業
森六ケミカルズ・オーバーシーズ・ホールディングス
(株)
四国化工(株)
森六アグリ
(株)
五興化成工業(株)
森六(香港)有限公司
Moriroku (Singapore) Pte., Ltd.
Moriroku (Thailand) Co., Ltd.
森六(上海)貿易有限公司
森六(広州)貿易有限公司
森六(天津)化学品貿易有限公司
Moriroku Chemicals Korea Co., Ltd.
Moriroku Austria GmbH
Moriroku America, Inc.
PT. Moriroku Chemicals Indonesia
Moriroku Chemicals India Pvt. Ltd.
M&C Tech Indiana Corporation
アイ・エム・マテリアル(株)
■ 外部評価
Introduction
イントロダクション
C D P 2 0 2 5「気候変動」
「水セキュリ
ティ」の2分野にてBスコアを獲得
S&P/JPXカーボン・エフィシェント指
数の構成銘柄に選定
From Vision to
所有者別の株式保有比率
その他の法人
10.93%
Progress
自己株式
0.28%
「大和インターネットIR表彰� 2025」
で
2年連続「優良賞」受賞
金融商品取引業者
0.99%
個人・その他
50.57%
金融機関
24.63%
外国法人等
12.60%
■ 大株主の状況
株式会社日本カストディ銀行
(三井住友信託銀行再信託分・三井化学株式会
社退職給付信託口)
持株数
(株)
持株比率
(%)
1,416,000
9.85
日本マスタートラスト信託銀行株式会社
(信託口) 1,264,500
8.80
森六従業員持株会
1,092,238
7.60
森茂
966,560
6.73
本田技研工業株式会社
792,000
5.51
株式会社阿波銀行
526,000
3.66
CHARLES SCHWAB FBO CUSTOMER
(常任代理人 シティバンク、
エヌ・エイ東京支店)
461,100
3.21
井染敏子
260,476
1.81
森豊子
257,823
1.79
INTERACTIVE BROKERS LLC(常任代理人
インタラクティブ・ブローカーズ証券株式会社)
238,900
1.66
(注)1.当社は、
自己株式を40,119株保有しています。
2.持株比率は自己株式を控除して計算しています。
MORIROKU 64 INTEGRATED REPORT 2026
日興アイ・アール「2025年度�全上場企
業ホームページ充実度ランキング」
にて
「総合部門�最優秀サイト」
に初選出
制作チームメッセージ
『森六株式会社統合報告書2026』
をご覧いただき、誠にあ
りがとうございます。本報告書は、株主・投資家をはじめとす
るすべてのステークホルダーの皆さまに、森六グループの持
続的な企業価値向上への取り組みをご理解いただくことを
目的に制作しました。
第3回の発行となる本年は、第14次中期経営計画の実行
やM&Aなど、大きな変革期を迎えた当社グループの現在地
を、多面的にお伝えすることを意識しました。当社グループの
事業や成長戦略だけでなく、それらを支える社員一人ひとり
の挑戦や現場での取り組みもご紹介することで、当社グルー
プの変革と成長の歩みをより身近に感じていただける一冊
を目指しました。
最後に、誌面の制作にあたり、
ご協力いただいたすべての
皆さまに心より感謝申し上げます。今後も皆さまとの対話を大
切にしながら、
より分かりやすく価値ある情報発信に努めてま
いります。本報告書を通じて、当社グループへの理解を深め、
皆さまとの建設的な対話につながる一助となれば幸いです。
中長期戦略
Driving Strategic
Progress
事業戦略
▶
統合報告書2026のテーマと注目ポイント
▶
森六グループの理念
▶
事業紹介
▶
価値創造プロセス
▶
360年以上続く森六「価値創造の進化」
▶
目次・編集方針
▶
社長メッセージ
▶
中期経営計画
▶
財務戦略
▶
財務・非財務ハイライト
▶
特集
▶
事業戦略
▶
樹脂加工製品事業
ケミカル事業
▶
Progress toward
Sustainability
価値創造の
基盤
▶
DX戦略
▶
法務・知財戦略
▶
森六グループのサステナビリティ経営
▶
取り組み報告
▶
環境
▶
社会
▶
特集
� 員座談会�
社
現場から描くNEW VALUE
ガバナンス
▶
Data
▶
主要財務データ
▶
主要非財務データ
▶
企業情報
IRサイト
業績ハイライト
統合報告書2026 制作チーム
� ゾナック モビリティ事業の�
レ
M&Aによる成長戦略
ESGデータブック
有価証券報告書
ホームページのご案内
森六株式会社 https://www.moriroku.co.jp/
スポーツ支援
森六は、スポーツ支援を通じて、挑戦する人々を応援し、
「良き企業市民」
として豊かな社会の創造に貢献します
森六グループは、夢に向かって世界で挑戦し続けるアスリートたちを応援しています。2019年からサポートするプロゴルファー・山路晶(やまじ あきら)選手
に加え、2025年には車いすテニス選手として活躍する城智哉(たち ともや)選手をアスリート社員として迎えました。
グローバルに事業を展開する当社グループでは、
ダイバーシティ&インクルージョンを重要な経営課題と捉え、
さまざまな取り組みを推進しています。常に前
を向き、挑戦を続け、自ら未来を切り拓く両選手の姿勢は、当社が大切にする
「進取の精神」
と重なります。両選手の挑戦を、今後も応援してまいります。
山路晶選手
城智哉選手
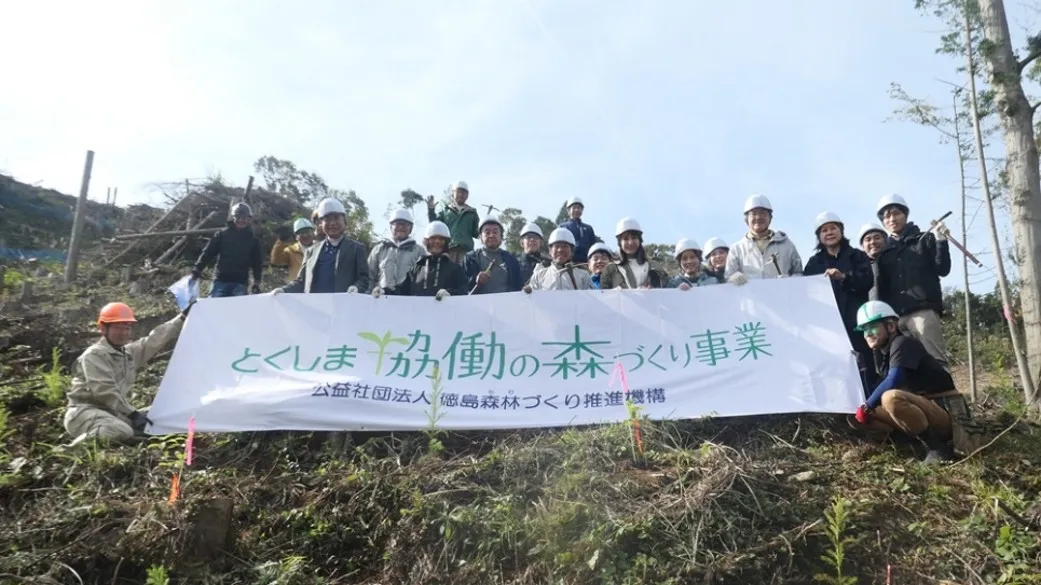
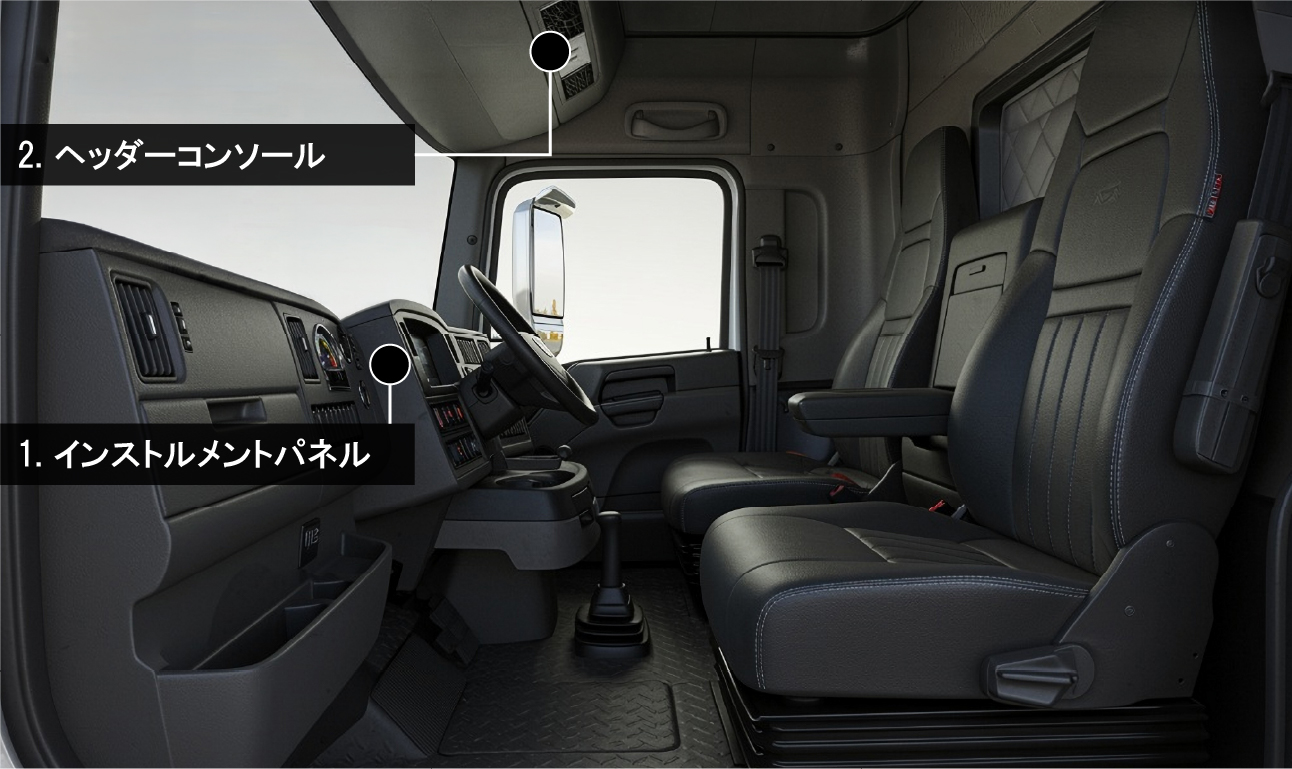 ](
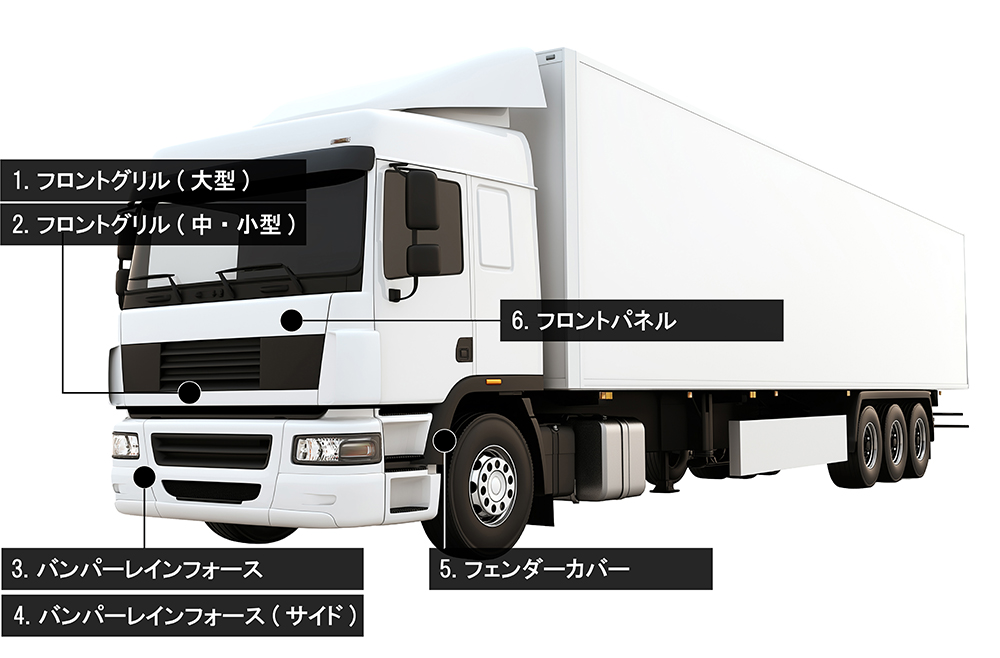 ](
 ](
 ](