自己株券買付状況報告書(法24条の6第1項に基づくもの)
Bull 2
Bear 0
Routine
Fiscal year ends March
Quarters are offset from the calendar — Q1 is Apr–Jun
|
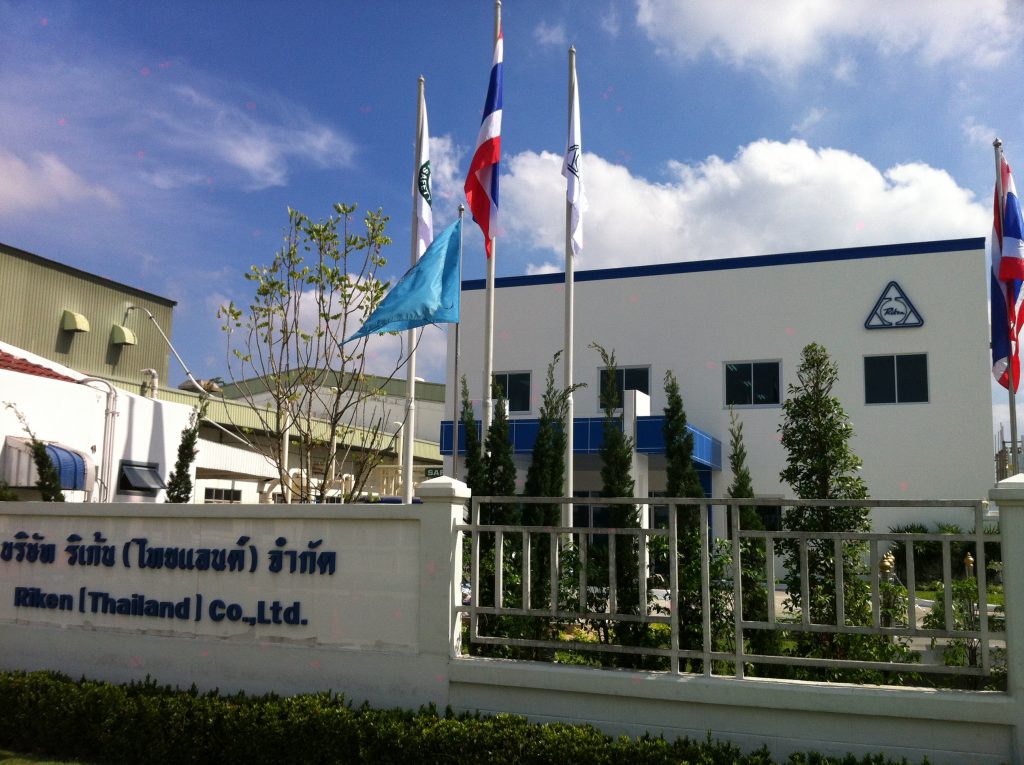
Riken Technos Corporation is a synthetic resin processing company that manufactures and sells compounds, films, and food packaging materials. The company operates through four market-based segments: Transportation, Daily Life & Healthcare, Electronics, and Building & Construction. Its products serve the automotive, railway, and shipbuilding markets; the medical, healthcare, and daily consumer goods sectors; the energy, information communication, and IT equipment industries; and the residential, commercial building, and civil engineering markets. Key subsidiaries involved in manufacturing and sales include RIKEN AMERICAS CORPORATION, RIMTEC CORPORATION, RIKEN ELASTOMERS CORPORATION, RIKEN(THAILAND)CO.,LTD., RIKEN ELASTOMERS(THAILAND)CO.,LTD., PT.RIKEN INDONESIA, RIKEN VIETNAM CO.,LTD., Shanghai Riken Plastic Co., Ltd., RIKEN U.S.A. CORPORATION, RIKEN TECHNOS INTERNATIONAL KOREA CORPORATION, and Riken Food Packaging (Jiangsu) Co., Ltd. Riken Chemical Products Co., Ltd. acts as an outsourced processor for compound manufacturing. Summarised from the annual report, fiscal year ended Mar 2026 |
Industry Specialty Chemicals | Homepage rikentechnos.co.jp |
| Sector Basic Materials | IR page rikentechnos.co.jp | |
|
Tags
synthetic resin processing, compounds, films, food packaging, automotive components, medical materials, electrical wire insulation, building materials, RIKEN AMERICAS CORPORATION, RIMTEC CORPORATION, RIKEN ELASTOMERS CORPORATION, RIKEN(THAILAND)CO. LTD., RIKEN ELASTOMERS(THAILAND)CO. LTD., PT.RIKEN INDONESIA, RIKEN VIETNAM CO. LTD., Shanghai Riken Plastic Co. Ltd., Riken Chemical Products Co. Ltd., RIKEN U.S.A. CORPORATION, RIKEN TECHNOS INTERNATIONAL KOREA CORPORATION, Riken Food Packaging (Jiangsu) Co. Ltd.
|
Press page rikentechnos.co.jp/ir/news |
Metrics
| Valuation | |
|---|---|
| Market cap | ¥ 119.419B |
| Market cap (USD) | $ 746.378M |
| P/E | 10.68 |
| PEG | 0.58 |
| P/BV | 1.56 |
| P/S | 0.86 |
| P/OCF | 8.58 |
| P/FCF | 13.67 |
| Dividend yield | 2.3% |
| Turnover / mcap | — |
| Returns | |
|---|---|
| ROE | 9.8% |
| ROI | 8.5% |
| ROIC | 9.5% |
| Profit margin | 5.8% |
| Growth | |
|---|---|
| Revenue growing | Yes |
| Profits growing | Yes |
| Revenue up 3y | Yes |
| Revenue up 5y | Yes |
| Earnings growth 3y (net profit CAGR) | 18.4% |
| Quality | |
|---|---|
| Profitable | Yes |
| Margin expanding | Yes |
| Buying back stock | Yes |
| Diluting (TTM) | No |
| Debt/Equity | — |
| Podcast bulls (TTM) | Sign up |
| Podcast bears (TTM) | Sign up |
| Podcast sentiment (TTM) | Sign up |
| Podcast sentiment % (TTM) | Sign up |
| News sentiment (TTM) | 0 |
| Quality score | 50.0% |
| Insiders | |
|---|---|
| Buys, 1w | Sign up |
| Buys, 1m | Sign up |
| Buys, 1y | Sign up |
| Sells, 1w | Sign up |
| Sells, 1m | Sign up |
| Sells, 1y | Sign up |
Sign up to see this company's insider trades
| Figure | FY 2026 | FY 2025 | FY 2024 | FY 2023 | FY 2022 | FY 2021 | FY 2020 | FY 2019 | FY 2018 | FY 2017 | FY 2016 | FY 2015 | FY 2014 | FY 2013 |
|---|---|---|---|---|---|---|---|---|---|---|---|---|---|---|
| Revenue | 131.377B | 128.141B | 125.739B | 123.498B | 109.924B | 88.224B | 98.809B | 97.814B | 94.601B | 88.3B | 90.589B | 91.939B | 82.856B | 73.544B |
| Net profit | 7.57B | 7.371B | 6.88B | 4.558B | 3.941B | 3.234B | 3.064B | 3.061B | 2.538B | 2.717B | 2.482B | 1.9B | 1.926B | 1.351B |
| Free cash flow | 8.471B | 6.768B | 6.505B | 4.849B | 2.292B | 6.806B | 6.067B | 3.708B | 2.25B | 1.965B | 1.204B | — | — | — |
| Figure | FY 2026 | FY 2025 | FY 2024 | FY 2023 | FY 2022 | FY 2021 | FY 2020 | FY 2019 | FY 2018 | FY 2017 | FY 2016 | FY 2015 | FY 2014 | FY 2013 |
|---|---|---|---|---|---|---|---|---|---|---|---|---|---|---|
| Share price | 1.659K | 1.047K | 1.004K | 590.28 | 457.22 | 517.02 | 385.09 | 454.85 | 508.31 | 531.35 | 388.18 | 436.97 | 585.14 | 253.22 |
| Price performance 12m | 0.58 | 0.04 | 0.7 | 0.29 | -0.12 | 0.34 | -0.15 | -0.11 | -0.04 | 0.37 | -0.11 | -0.25 | 1.31 | — |
Filed figures
Lines the statements and their notes report beside the headline figures, read from the filings' XBRL as filed (no restatement applied), with figures computed from one filing's own lines. Cash-flow lines carry their cash direction: an outflow is negative. Each period links to its filing; a figure's period, report date and tag are in its tooltip.
| Figure | Mar 2017 | Mar 2018 | Mar 2019 | Mar 2020 | Mar 2021 | Mar 2022 | Mar 2023 | Mar 2024 | Mar 2025 | Mar 2026 |
|---|---|---|---|---|---|---|---|---|---|---|
| Balance sheet detail | ||||||||||
| Trade receivables (JPY) | 23.8B | 25.2B | 26B | 24.4B | 23.3B | 26.3B | 28.5B | 29.9B | 26.9B | 26.3B |
| ↳ YoY growth | +4.3% | +6.1% | +3.3% | -6.2% | -4.5% | +13.0% | +8.2% | +5.0% | -10.2% | -2.2% |
| ↳ 5y CAGR | +0.5% | +2.1% | +2.5% | +2.8% | +1.9% | +2.4% | ||||
| Borrowings, current (JPY) | 6.86B | 6.93B | 9.66B | 7.94B | 7.43B | 7.26B | 8.27B | 8.33B | 9.5B | 8.26B |
| Borrowings, non-current (JPY) | 8.87B | 5.57B | 4.12B | 3.46B | 2.82B | 2.57B | 2.26B | 1.77B | 2.2B | 3.15B |
| Bonds payable (JPY) | 4B | 1.17B | 800M | — | — | — | — | — | — | — |
| Lease liabilities (JPY) | 31.7M | 41.2M | 46.3M | 33.8M | 46.9M | 35.2M | 47.1M | 56.6M | 102M | 101M |
| Cash and deposits (JPY) | 14.5B | 14.8B | 17.6B | 18.3B | 21.1B | 20.7B | 23.5B | 21.9B | 24.5B | 26.6B |
| Intangible assets (JPY) | 3.14B | 2.45B | 1.8B | 2.02B | 2.35B | 2.11B | 2.29B | 2.25B | 2.65B | 2.42B |
| Net debt (borrowings + leases - cash) (JPY) | 1.25B | -2.25B | -3.73B | -6.91B | -10.8B | -10.8B | -12.9B | -11.7B | -12.7B | -15B |
| Cash flow detail | ||||||||||
| Operating cash flow (JPY) | 6.56B | 5.67B | 7.32B | 8.81B | 9.39B | 4.57B | 8.52B | 10.8B | 11.5B | 13.4B |
| Purchases of property, plant and equipment (JPY) | -4.17B | -3.42B | -3.61B | -2.74B | -2.58B | -2.28B | -3.68B | -4.04B | -4.3B | -4.84B |
| Purchases of intangible assets (JPY) | -428M | -154M | -213M | -940M | -1.02B | -455M | -312M | -211M | -481M | -88.4M |
| Change in receivables (cash effect) (JPY) | -1.12B | -1.46B | -407M | 1.73B | 729M | -2.47B | -1.12B | -797M | 4.13B | 707M |
| Change in inventories (cash effect) (JPY) | -736M | -1.07B | -784M | 1.04B | -634M | -4.58B | -128M | 67.8M | -1.32B | 1.52B |
| Change in payables (cash effect) (JPY) | 242M | 836M | 290M | -1.92B | -58.8M | 3.96B | 94.6M | -382M | -1.73B | -2.62B |
| Dividends paid (cash effect) (JPY) | -599M | -717M | -770M | -1.03B | -755M | -1.28B | -1.28B | -1.79B | -1.87B | -2.4B |
| Share buybacks (cash effect) (JPY) | -1.43B | -196,000 | -215,000 | -1.51B | -24,000 | -49,000 | -94,000 | -7B | -4.02B | -4.57B |
| Interest paid (cash effect) (JPY) | -129M | -184M | -212M | -222M | -140M | -114M | -160M | -283M | -287M | -364M |
| Income taxes paid (cash effect) (JPY) | -1.46B | -1.39B | -1.47B | -1.85B | -1.27B | -2.38B | -1.7B | -1.97B | -3.62B | -2.57B |
| Operating cash flow before change in receivables (JPY) | 7.68B | 7.13B | 7.72B | 7.07B | 8.66B | 7.04B | 9.64B | 11.6B | 7.42B | 12.7B |
| Free cash flow (OCF - PPE - intangibles) (JPY) | 1.96B | 2.1B | 3.5B | 5.13B | 5.79B | 1.84B | 4.54B | 6.5B | 6.77B | 8.47B |
| Income detail | ||||||||||
| Research and development expense (JPY) | 1.31B | 1.4B | 1.47B | 1.45B | 1.44B | 1.57B | 1.63B | 1.89B | 1.98B | 1.98B |
| ↳ 5y CAGR | +2.1% | +3.6% | +3.2% | +5.2% | +6.4% | +6.5% | ||||
| Total comprehensive income (JPY) | 4.72B | 4.44B | 3.2B | 4.28B | 5.36B | 6.46B | 8.93B | 12.1B | 9.16B | 11.6B |
| Comprehensive income to owners (JPY) | 3.52B | 3.03B | 2.13B | 2.76B | 4.81B | 5.27B | 6.67B | 10B | 6.27B | 9.66B |
| Provision for credit losses (JPY) | -25.2M | -13.5M | -12.4M | -12.5M | -886,000 | -1.05M | 119,000 | -697,000 | 15.3M | -1.74M |
| Credit cost ratio (credit losses / average receivables) (%) | 0.1% | 0.1% | 0.0% | 0.0% | 0.0% | 0.0% | 0.0% | 0.0% | 0.1% | 0.0% |
| Segments | ||||||||||
| Building And Construction · Segment revenue (JPY) | — | — | 20.9B | 23.3B | 21B | 25.2B | 27.2B | 26.6B | 25.5B | 26.3B |
| ↳ YoY growth | +11.7% | -9.7% | +19.6% | +8.1% | -2.2% | -4.3% | +3.5% | |||
| Building And Construction · Segment operating income (JPY) | — | — | 471M | 561M | -33.6M | 1.13B | 1.05B | 1.06B | 1.01B | 1.04B |
| Daily Life And Healthcare · Segment revenue (JPY) | — | — | 24.2B | 24.3B | 25B | 30.7B | 33.5B | 34.1B | 36.8B | 36.5B |
| ↳ YoY growth | +0.2% | +3.0% | +22.6% | +9.1% | +1.7% | +8.1% | -0.9% | |||
| Daily Life And Healthcare · Segment operating income (JPY) | — | — | 1.67B | 1.86B | 2.74B | 1.86B | 1.48B | 2.74B | 3.52B | 3.94B |
| Electronics · Segment revenue (JPY) | — | — | 21.2B | 20.9B | 17.4B | 21.5B | 24.6B | 25B | 24.7B | 25.7B |
| ↳ YoY growth | -1.3% | -16.5% | +23.3% | +14.6% | +1.6% | -1.3% | +4.1% | |||
| Electronics · Segment operating income (JPY) | — | — | 408M | 283M | 379M | 439M | 997M | 1.26B | 978M | 1.84B |
| Transportation · Segment revenue (JPY) | — | — | 30.9B | 29.8B | 24.3B | 32.5B | 38.1B | 40B | 41.1B | 42.8B |
| ↳ YoY growth | -3.7% | -18.3% | +33.5% | +17.4% | +5.0% | +2.8% | +4.2% | |||
| Transportation · Segment operating income (JPY) | — | — | 3B | 2.74B | 2.15B | 2.74B | 3.86B | 3.65B | 4.87B | 4.46B |
| Reported | Jun 23, 2017 | Jun 22, 2018 | Jun 19, 2020 | Jun 19, 2020 | Jun 18, 2021 | Jun 17, 2022 | Jun 16, 2023 | Jun 21, 2024 | Jun 18, 2025 | Jun 10, 2026 |
Sign up to see institutional holdings
Sign UpPodcast Mentions
Sign up to see podcast mentions and sentiment
Sign UpTimely disclosures published on TDnet, newest first, titles as filed in Japanese. The link opens the disclosure on TDnet. Filings with EDINET (periodic reports, extraordinary reports, offerings, holding and buy-back reports), newest first, titles as filed in Japanese. The link opens the filing on EDINET. Press releases from the company's own website, newest first.
適時開示 自己株式立会外買付取引(ToSTNeT-3)による自己株式の取得結果に関するお知らせ
Bull 2
Bear 0
Capital return
2026 年 11 月6日 各
位 会社名 代表者名 問合せ先
リ ケ ン テ ク ノ ス 株式会社 代表取締役社長執行役員常盤和明 (コ ー ド 番号 : 4220 東証 プ ラ イ ム ) 代表取締役副社長執行役員 入江淳二 管 理 本 部 長 ( T E L 0 3 - 5 2 9 7 - 1 6 5 0 )
自己株式立会外買付取引(ToSTNeT-3)による 自己株式の取得結果に関するお知らせ 当社は、2026 年 11 月5日にお知らせした自己株式の取得について、本日下記のとおり買付けを 行いましたので、お知らせいたします。
記 1.自己株式の取得を行った理由 経営環境の変化に対応した機動的な資本政策を遂行し、資本効率を向上させ株主還元に 資するため。 2.取得の内容 (1) 取得対象株式 の 種類 (2) 取得 し た 株式 の 総数 (3) 取 得 価 額 (4) 取 得 日 (5) 取 得 方 法
普通株式 850,000 株 2,038,300,000 円 2026 年 11 月6日 東京証券取引所の自己株式立会外買付取引 (ToSTNeT-3)による買付け
(ご参考)自己株式の取得に関する決議内容(2026 年7月 31 日公表分) ・取得対象株式 の 種類 普通株式 ・取得しうる株式の総数 4,000,000 株 (上限) ・株式の取得価額の総額 8,800,000,000 円 (上限) ・取 得 期 間 2026 年8月3日~2026 年 12 月 30 日 ・2026 年 11 月6日現在における進捗状況 取得した株式の総数 3,414,300 株 取得価額の総額 8,254,947,600 円
以
上


Prompts
Click prompts to add them under the company line, click again to take one out, then copy the result into your AI chat. Shared by Asian Century Stocks and Uncovered Thai Stocks. Thank you.
Riken Technos Corporation (ticker 4220), listed in Japan.
Copied
ETFs Holding Riken Technos Corporation
Exchange-traded funds whose newest published daily portfolio holds one of the company's listings, largest weight first.
| ETF | Weight in ETF | Shares | Market value | As of |
|---|---|---|---|---|
| AVDV | 0.05% | 563,700 | $ 8.984M | Nov 16, 2026 |
| AVDS | 0.02% | 5,200 | $ 82.877K | Nov 16, 2026 |
| DISV | 0.02% | 54,100 | $ 886.103K | Nov 12, 2026 |
| DFIS | 0.01% | 43,400 | $ 710.848K | Nov 12, 2026 |
| DXIV | 0.01% | 1,300 | $ 21.293K | Nov 12, 2026 |
| DFSI | 0.00% | 3,200 | $ 52.413K | Nov 12, 2026 |
| DFIC | 0.00% | 37,100 | $ 607.66K | Nov 12, 2026 |
| DFAX | 0.00% | 27,200 | $ 445.508K | Nov 12, 2026 |
| DFAI | 0.00% | 36,200 | $ 592.919K | Nov 12, 2026 |
| AVDE | 0.00% | 55,000 | $ 876.579K | Nov 16, 2026 |