|
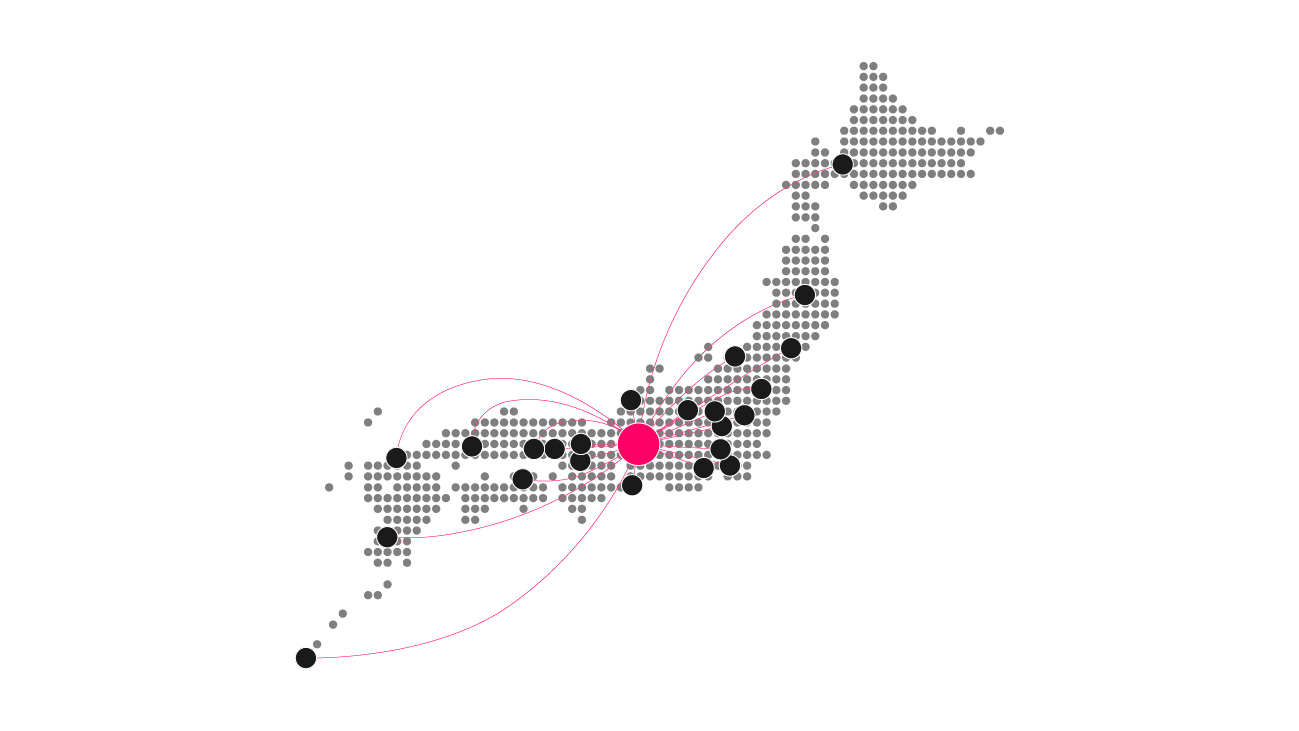
Aica Kogyo Company, Limited is a chemical and building materials manufacturer operating through two main business segments. The chemicals segment produces exterior and interior finishing coatings, floor coatings, various adhesives, and organic microparticles. The building materials segment manufactures melamine laminates, decorative plywood, interior doors, interior building materials, counters, storage doors, non-combustible decorative materials, and extruded cement boards. The company serves domestic and international markets through a network of subsidiaries and affiliates, including operations in Indonesia, China, Thailand, India, Vietnam, and New Zealand. Key subsidiaries involved in these activities include Nishi Tokyo Chemicals, Aica Indonesia, Kunshan Aika Resin, Shenyang Aika Haobo Chemical, Aica Asia Pacific Holdings, Aica Don Nai, Aica Hachai, Aica Guangdong, Aica India, Aica New Zealand, Aica Nanjing, Aica Adtech, Aica T Chemical, ADB Sealant, Evamoa Chemical Industry, Aica Interior Industry, Aica Harima Industry, Aica Tech Building Materials, Techno Wood, Mycalaminate, Aica Laminates India, Aica Laminates Vietnam, Aica Asia Laminates Holdings, Aica Wilsonart Thailand, and Aica Wilsonart Shanghai. Summarised from the annual report, fiscal year ended Mar 2026 |
Industry Specialty Chemicals | Homepage aica.co.jp |
| Sector Basic Materials | IR page aica.co.jp | |
|
Tags
coatings, adhesives, melamine laminates, decorative plywood, interior doors, building materials, organic microparticles, floor coatings, cement boards, Nishi Tokyo Chemicals, Aica Indonesia, Kunshan Aika Resin, Shenyang Aika Haobo Chemical, Aica Asia Pacific Holdings, Aica Don Nai, Aica Hachai, Aica Guangdong, Aica India, Aica New Zealand, Aica Nanjing, Aica Adtech, Aica T Chemical, ADB Sealant, Evamoa Chemical Industry, Aica Interior Industry, Aica Harima Industry, Aica Tech Building Materials, Techno Wood, Mycalaminate, Aica Laminates India, Aica Laminates Vietnam, Aica Asia Laminates Holdings, Aica Wilsonart Thailand, Aica Wilsonart Shanghai
|
Press page aica.co.jp/company/ir/news |
Metrics
| Valuation | |
|---|---|
| Market cap | ¥ 282.529B |
| Market cap (USD) | $ 1.766B |
| P/E | 13.93 |
| PEG | 0.62 |
| P/BV | 1.20 |
| P/S | 1.01 |
| P/OCF | 10.68 |
| P/FCF | 15.57 |
| Dividend yield | 3.3% |
| Turnover / mcap | — |
| Returns | |
|---|---|
| ROE | 9.3% |
| ROI | 7.6% |
| ROIC | 8.0% |
| Profit margin | 7.4% |
| Growth | |
|---|---|
| Revenue growing | Yes |
| Profits growing | Yes |
| Revenue up 3y | No |
| Revenue up 5y | No |
| Earnings growth 3y (net profit CAGR) | 22.6% |
| Quality | |
|---|---|
| Profitable | Yes |
| Margin expanding | Yes |
| Buying back stock | No |
| Diluting (TTM) | No |
| Debt/Equity | — |
| Podcast bulls (TTM) | Sign up |
| Podcast bears (TTM) | Sign up |
| Podcast sentiment (TTM) | Sign up |
| Podcast sentiment % (TTM) | Sign up |
| News sentiment (TTM) | 5 |
| Quality score | 16.7% |
| Insiders | |
|---|---|
| Buys, 1w | Sign up |
| Buys, 1m | Sign up |
| Buys, 1y | Sign up |
| Sells, 1w | Sign up |
| Sells, 1m | Sign up |
| Sells, 1y | Sign up |
Sign up to see this company's insider trades
| Figure | FY 2026 | FY 2025 | FY 2024 | FY 2023 | FY 2022 | FY 2021 | FY 2020 | FY 2019 | FY 2018 | FY 2017 | FY 2016 | FY 2015 | FY 2014 | FY 2013 |
|---|---|---|---|---|---|---|---|---|---|---|---|---|---|---|
| Revenue | 251.764B | 248.696B | 236.625B | 242.055B | 214.514B | 174.628B | 191.501B | 191.363B | 163.726B | 151.633B | 150.061B | 143.843B | 141.096B | 101.353B |
| Net profit | 18.533B | 16.896B | 15.135B | 10.059B | 13.117B | 10.759B | 12.732B | 13.316B | 11.996B | 11.064B | 9.962B | 10.137B | 8.221B | 7.633B |
| Free cash flow | 336M | 17.789B | 20.007B | 12.206B | 4.99B | 14.153B | 12.377B | 6.256B | 12.123B | 15.142B | 11.769B | — | — | — |
| Figure | FY 2026 | FY 2025 | FY 2024 | FY 2023 | FY 2022 | FY 2021 | FY 2020 | FY 2019 | FY 2018 | FY 2017 | FY 2016 | FY 2015 | FY 2014 | FY 2013 |
|---|---|---|---|---|---|---|---|---|---|---|---|---|---|---|
| Share price | 3.622K | 3.305K | 3.715K | 3.035K | 2.988K | 3.99K | 3.102K | 3.689K | 3.937K | 2.935K | 2.366K | 2.797K | 2.298K | 1.733K |
| Price performance 12m | 0.1 | -0.11 | 0.22 | 0.02 | -0.25 | 0.29 | -0.16 | -0.06 | 0.34 | 0.24 | -0.15 | 0.22 | 0.33 | — |
Filed figures
Lines the statements and their notes report beside the headline figures, read from the filings' XBRL as filed (no restatement applied), with figures computed from one filing's own lines. Cash-flow lines carry their cash direction: an outflow is negative. Each period links to its filing; a figure's period, report date and tag are in its tooltip.
| Figure | Mar 2017 | Mar 2018 | Mar 2019 | Mar 2020 | Mar 2021 | Mar 2022 | Mar 2023 | Mar 2024 | Mar 2025 | Mar 2026 |
|---|---|---|---|---|---|---|---|---|---|---|
| Balance sheet detail | ||||||||||
| Trade receivables (JPY) | 50.5B | 59.3B | 60.3B | 61.7B | 57.9B | 69.5B | 69.7B | 72.3B | 72.3B | 73.5B |
| ↳ YoY growth | +2.5% | +17.2% | +1.8% | +2.3% | -6.2% | +20.0% | +0.3% | +3.7% | +0.1% | +1.7% |
| ↳ 5y CAGR | +3.3% | +6.6% | +3.3% | +3.7% | +3.2% | +4.9% | ||||
| Borrowings, current (JPY) | 1.31B | 4.05B | 4.56B | 5.95B | 6.02B | 14.5B | 7.3B | 6.03B | 6.25B | 35.2B |
| Borrowings, non-current (JPY) | 532M | 777M | 432M | 914M | 1.26B | 2.17B | 22.3B | 22.5B | 22B | 12.4B |
| Bonds payable (JPY) | — | — | — | — | — | — | 18.1B | 18.1B | 18B | 11.1B |
| Cash and deposits (JPY) | 47.6B | 49.5B | 45.6B | 40.7B | 42.4B | 47.2B | 51B | 62B | 59.6B | 59.2B |
| Intangible assets (JPY) | 3.26B | 2.86B | 3.1B | 10.1B | 12.5B | 14.2B | 12.5B | 11.4B | 10.4B | 9.03B |
| Net debt (borrowings + leases - cash) (JPY) | -45.8B | -44.7B | -40.6B | -33.8B | -35.2B | -30.5B | -21.4B | -33.5B | -31.4B | -11.6B |
| Cash flow detail | ||||||||||
| Operating cash flow (JPY) | 18.3B | 16.4B | 13.3B | 18.2B | 19.7B | 11.7B | 19.9B | 28.5B | 26.8B | 8.78B |
| Purchases of property, plant and equipment (JPY) | -3.19B | -4.09B | -7.02B | -5.86B | -5.56B | -6.7B | -7.65B | -8.48B | -8.27B | -7.69B |
| Purchases of intangible assets (JPY) | -112M | -225M | -571M | -2.3B | -1.31B | -738M | -938M | -636M | -697M | -753M |
| Change in receivables (cash effect) (JPY) | -1.63B | -3.63B | -1.74B | 178M | 3.86B | -9.39B | 1.55B | -717M | 1.79B | -641M |
| Change in inventories (cash effect) (JPY) | -96M | -1.07B | -2.71B | 659M | 1.08B | -6.83B | -1.48B | 1.43B | -909M | -1.39B |
| Change in payables (cash effect) (JPY) | 1.33B | 3.59B | 785M | -3.67B | -1.81B | 7.19B | -3.14B | -393M | -2.05B | -3.99B |
| Dividends paid (cash effect) (JPY) | -4.11B | -5.81B | -6.33B | -6.85B | -6.92B | -7.06B | -6.98B | -7.11B | -7.43B | -8.53B |
| Share buybacks (cash effect) (JPY) | — | — | — | — | — | -2M | -4B | -2M | -4B | -6B |
| Interest paid (cash effect) (JPY) | -38M | -79M | -102M | -126M | -137M | -186M | -267M | -205M | -216M | -321M |
| Income taxes paid (cash effect) (JPY) | -5.45B | -6.55B | -7.04B | -6.17B | -6.58B | -7.16B | -6.95B | -8.54B | -9.31B | -8.79B |
| Operating cash flow before change in receivables (JPY) | 20B | 20.1B | 15B | 18.1B | 15.9B | 21.1B | 18.3B | 29.2B | 25B | 9.42B |
| Free cash flow (OCF - PPE - intangibles) (JPY) | 15B | 12.1B | 5.69B | 10.1B | 12.8B | 4.25B | 11.3B | 19.4B | 17.8B | 336M |
| Income detail | ||||||||||
| Research and development expense (JPY) | 2.67B | 2.86B | 3.21B | 3.45B | 3.33B | 3.45B | 4B | 4.07B | 4.41B | 4.71B |
| ↳ 5y CAGR | +5.1% | +5.3% | +7.0% | +4.9% | +5.0% | +7.2% | ||||
| Total comprehensive income (JPY) | 11.9B | 15B | 10.7B | 12B | 12.4B | 20.3B | 17.9B | 26.2B | 27.4B | 26.6B |
| Comprehensive income to owners (JPY) | 11B | 13.7B | 10B | 10.4B | 11.6B | 17.6B | 15.7B | 23.7B | 24.4B | 24.7B |
| Reported | Jun 26, 2017 | Jun 25, 2018 | Jun 26, 2019 | Jun 24, 2020 | Jun 25, 2021 | Jun 26, 2023 | Jun 26, 2023 | Jun 26, 2024 | Jun 23, 2025 | Jun 19, 2026 |
Sign up to see institutional holdings
Sign UpPodcast Mentions
Sign up to see podcast mentions and sentiment
Sign UpFilings with EDINET (periodic reports, extraordinary reports, offerings, holding and buy-back reports), newest first, titles as filed in Japanese. The link opens the filing on EDINET. Press releases from the company's own website, newest first.
創立90周年を機にコーポレートブランドをリニューアル
No.127A33
2026年10月20日
創立90周年を機にコーポレートブランドをリニューアル
通称「AICA」の使用を開始し、コーポレートロゴおよびコーポレートカラーを改定
アイカ工業株式会社(通称:AICA 代表取締役 社長執行役員:海老原健治 本社:愛知県名古屋市中村区)は、創立90周年を機に通称「AICA」の使用を開始するとともに、コーポレートロゴおよびコーポレートカラーを改定します。
背景
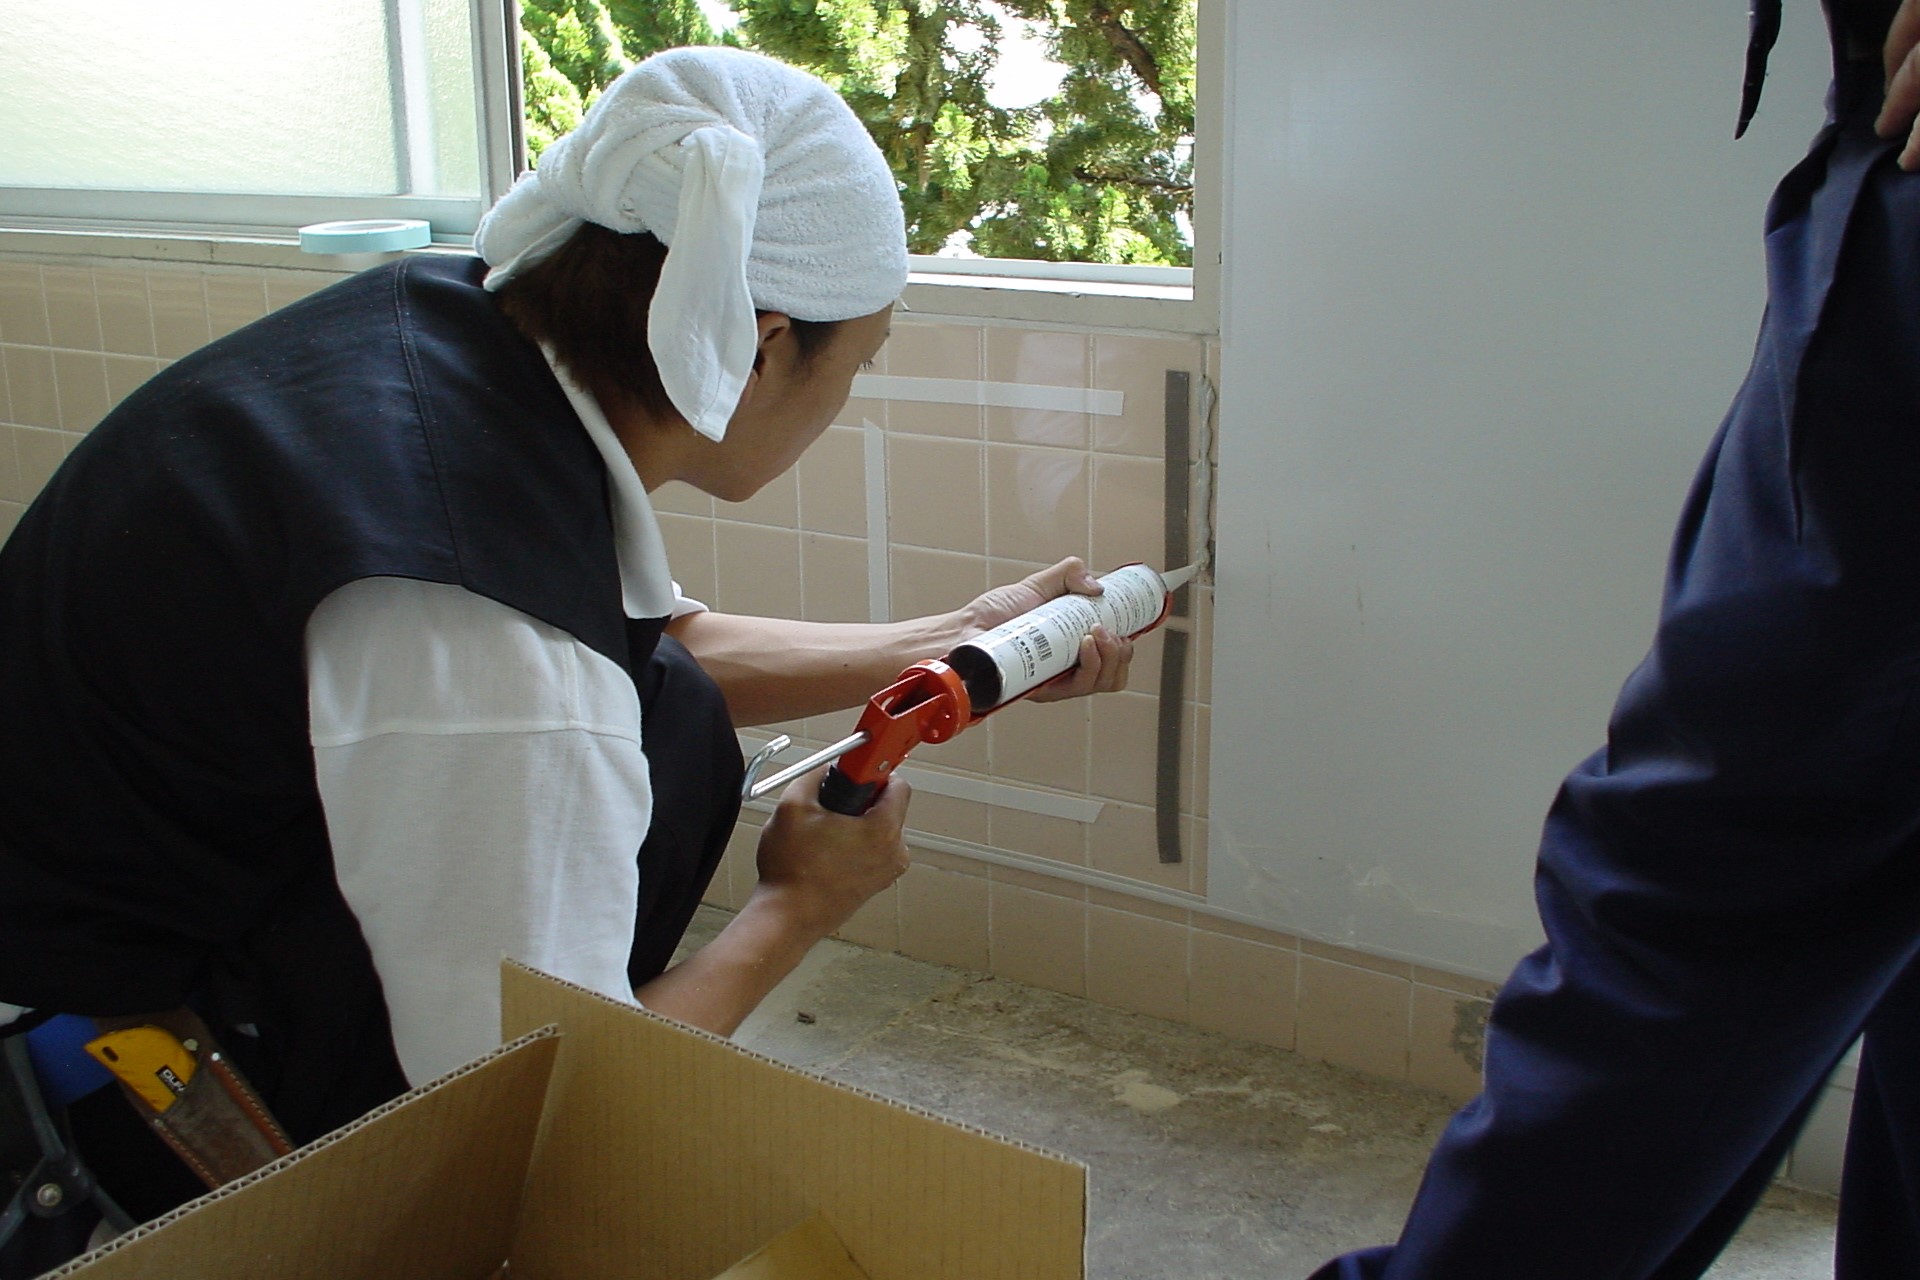
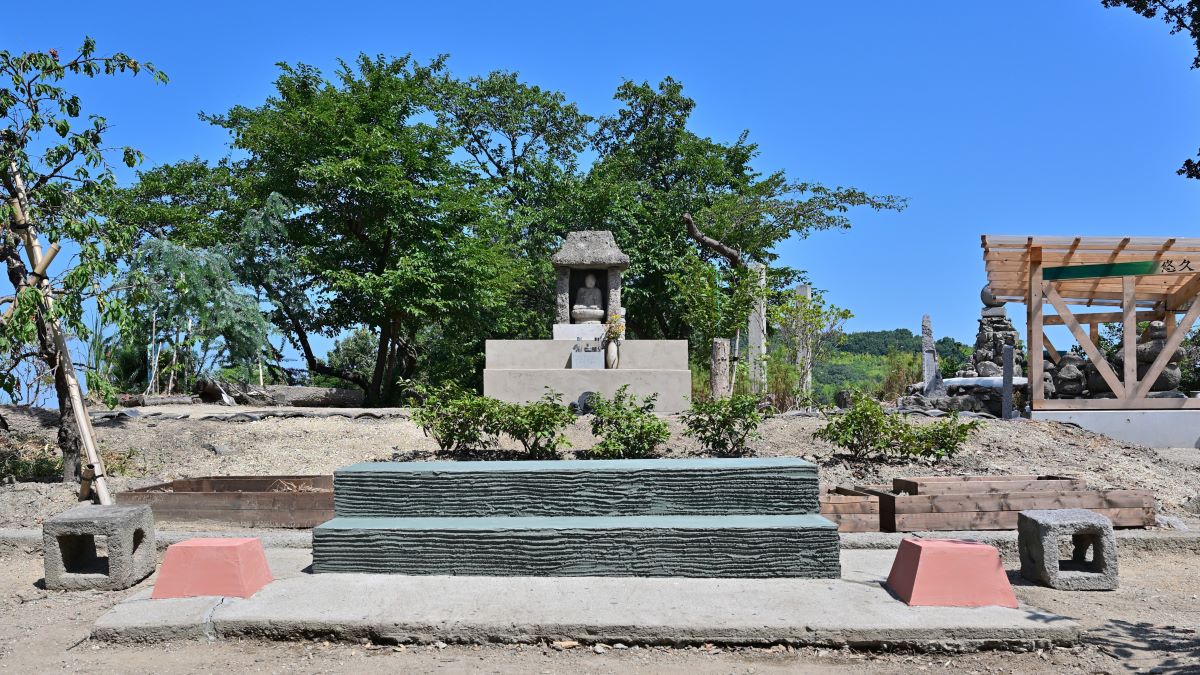
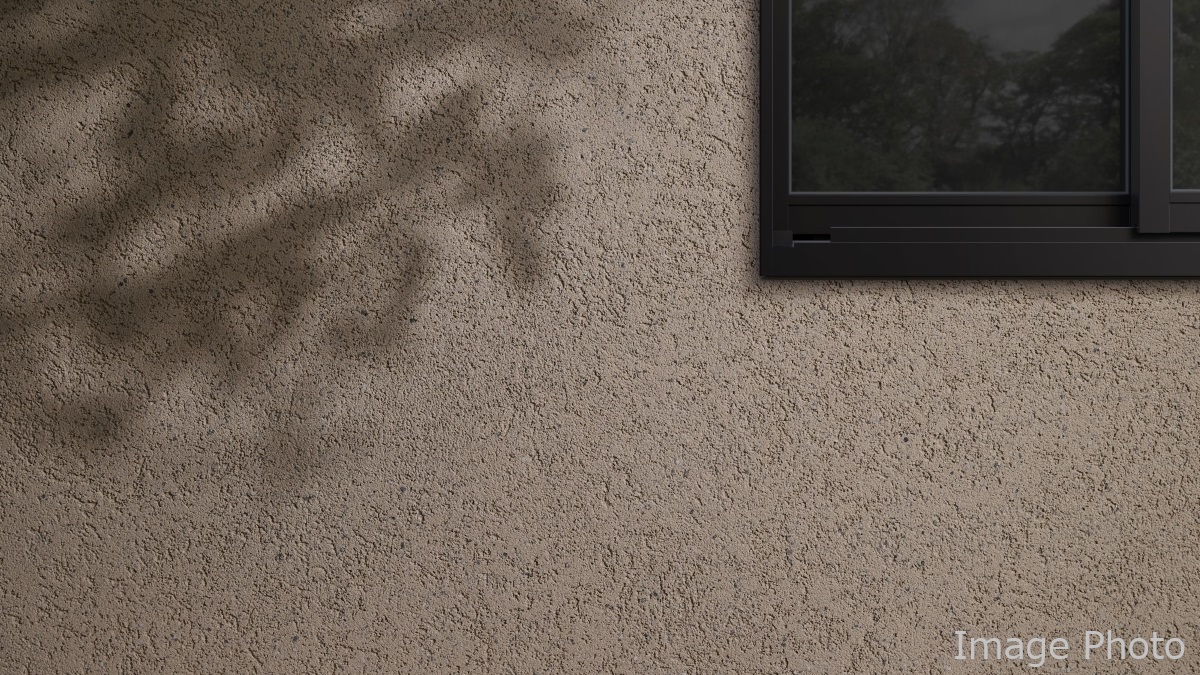
当社は、1936年10月20日に愛知化学工業株式会社として創立して以来、樹脂合成技術を核に幅広い分野で事業を展開してきました。現在は、「化学」の強みと「デザイン」の強みを融合しながら、「化成品」と「建装建材」の2つの事業領域で多種多様な「素材」を開発しています。
このたび、創立90周年を機に、社内外で広く親しまれている「アイカ」の呼称とコーポレートロゴ「AICA」の表記を統一し、「AICA」を通称として使用します。あわせて、コーポレートロゴおよびコーポレートカラーを見直し、ブランドアイデンティティの再定義を行いました。細部の見直しにより、これまで培ってきたブランド認知を継承しながら、洗練された印象のロゴとカラーにしています。
当社は今後も、90年の歴史の中で培ってきた技術と信頼を礎に、新たな価値の創造に挑戦してまいります。
通称使用について
当社はこれまで、社名は「アイカ工業」である一方、社内外において「アイカ」の呼称で広く認知されるとともに、コーポレートロゴには「AICA」を使用してきました。呼称とブランド表記の統一を図るため、通称として「AICA」を使用することを決定しました。なお、会社法その他の法令に基づく手続きや契約書等、正式名称の使用が必要な場面においては、従来通り「アイカ工業株式会社」を使用します。
コーポレートロゴおよびコーポレートカラーについて
コーポレートロゴ(AICAロゴ)およびコーポレートカラー(AICAレッド)は、これまで培ってきたブランド認知を継承するため、変更は最小限にとどめながら細部を見直し、再定義しました。長年親しまれてきたロゴとカラーの印象を損なうことなく、より洗練されたブランドアイデンティティの実現を目指しました。














Prompts
Click prompts to add them under the company line, click again to take one out, then copy the result into your AI chat. Shared by Asian Century Stocks and Uncovered Thai Stocks. Thank you.
ETFs Holding Aica Kogyo Company, Limited
Exchange-traded funds whose newest published daily portfolio holds one of the company's listings, largest weight first.
| ETF | Weight in ETF | Shares | Market value | As of |
|---|---|---|---|---|
| AVDS | 0.05% | 7,400 | $ 186.563K | Nov 16, 2026 |
| DFIS | 0.04% | 75,600 | $ 2.028M | Nov 12, 2026 |
| DXIV | 0.02% | 1,700 | $ 45.599K | Nov 12, 2026 |
| DFSI | 0.01% | 6,000 | $ 160.938K | Nov 12, 2026 |
| DFIC | 0.01% | 70,100 | $ 1.88M | Nov 12, 2026 |
| DFAX | 0.01% | 45,900 | $ 1.231M | Nov 12, 2026 |
| DFAI | 0.01% | 45,700 | $ 1.226M | Nov 12, 2026 |