|
Mitsubishi Gas Chemical Company, Inc. is a chemical manufacturer operating through the Green Energy & Chemical and Functional Chemicals business segments. The company produces methanol, ammonia-based chemicals, general and specialty aromatic chemicals, foamed plastics, and power. Its functional chemicals portfolio includes inorganic chemicals, engineering plastics, optical materials, electronic materials, and deoxidizers. Key subsidiaries include Mitsubishi Gas Chemical Next, MGC Terminal, Toho Earthtech, MGC Specialty Chemicals Netherlands, Mitsubishi Gas Chemical Trading, Mitsubishi Gas Chemical Singapore, Mitsubishi Gas Chemical America, MGC Energy, MGC Woodchem, and Japan-Saudi Arabia Methanol. The group also operates through Metanol de Oriente, Brunei Methanol Company, Japan Trinidad Methanol, and geothermal ventures such as Yuzawa Geothermal and Anbi Geothermal. In the functional chemicals segment, subsidiaries include Samyoung Pure Chemicals, MGC Pure Chemicals America, MGC Pure Chemicals Singapore, MGC Film Sheet, Global Polyacetal, Thai Polyacetal, Korea Polyacetal, Mitsubishi Engineering Plastics, Thai Polycarbonate, Ageless Thailand, Korea Engineering Plastics, MGC Electrotechno, MGC Electrotechno Thailand, and Samyang Kasei. The company serves industrial customers in Japan, the Americas, Europe, and Asia, with operations in Singapore, the United States, the Netherlands, Thailand, South Korea, and China. Summarised from the annual report, fiscal year ended Mar 2026 |
Industry Specialty Chemicals | Homepage mgc.co.jp |
| Sector Basic Materials | IR page mgc.co.jp/ir | |
|
Tags
methanol, aromatic chemicals, engineering plastics, optical materials, electronic materials, inorganic chemicals, foamed plastics, green energy, geothermal power, bio-methanol, Mitsubishi Gas Chemical Next, MGC Terminal, Toho Earthtech, MGC Specialty Chemicals Netherlands, Mitsubishi Gas Chemical Trading, MITSUBISHI GAS CHEMICAL SINGAPORE, MITSUBISHI GAS CHEMICAL AMERICA, MGC Energy, MGC Woodchem, Kokuka Sangyo, Japan-Saudi Arabia Methanol, Metanol de Oriente, Brunei Methanol Company, Japan Trinidad Methanol, Yuzawa Geothermal, JSP, Anbi Geothermal, Taikei Rinsu Functional New Materials, SAMYOUNG PURE CHEMICALS, MGC PURE CHEMICALS AMERICA, MGC PURE CHEMICALS SINGAPORE, Juling Precision Chemical, MGC Film Sheet, Global Polyacetal, THAI POLYACETAL, KOREA POLYACETAL, Mitsubishi Gas Chemical Engineering Plastics Shanghai, MGC Electrotechno, MGC ELECTROTECHNO THAILAND, Eiwa Chemical Industry, Mitsubishi Engineering Plastics, THAI POLYCARBONATE, AGELESS THAILAND, KOREA ENGINEERING PLASTICS, MGC Otsuka Chemical, Riden Chemical, Taifeng Printed Circuit Industry, Granopto, Samyang Kasei
|
Press page — |
Metrics
| Valuation | |
|---|---|
| Market cap | ¥ 798.482B |
| Market cap (USD) | $ 4.991B |
| P/E | 31.90 |
| PEG | — |
| P/BV | 1.12 |
| P/S | 0.98 |
| P/OCF | 10.17 |
| P/FCF | 49.03 |
| Dividend yield | 2.7% |
| Turnover / mcap | — |
| Returns | |
|---|---|
| ROE | -5.9% |
| ROI | -4.8% |
| ROIC | 4.0% |
| Profit margin | -5.5% |
| Growth | |
|---|---|
| Revenue growing | No |
| Profits growing | No |
| Revenue up 3y | No |
| Revenue up 5y | No |
| Earnings growth 3y (net profit CAGR) | — |
| Quality | |
|---|---|
| Profitable | No |
| Margin expanding | No |
| Buying back stock | Yes |
| Diluting (TTM) | No |
| Debt/Equity | — |
| Podcast bulls (TTM) | Sign up |
| Podcast bears (TTM) | Sign up |
| Podcast sentiment (TTM) | Sign up |
| Podcast sentiment % (TTM) | Sign up |
| News sentiment (TTM) | 0 |
| Quality score | -55.6% |
| Insiders | |
|---|---|
| Buys, 1w | Sign up |
| Buys, 1m | Sign up |
| Buys, 1y | Sign up |
| Sells, 1w | Sign up |
| Sells, 1m | Sign up |
| Sells, 1y | Sign up |
Sign up to see this company's insider trades
| Figure | FY 2026 | FY 2025 | FY 2024 | FY 2023 | FY 2022 | FY 2021 | FY 2020 | FY 2019 | FY 2018 | FY 2017 | FY 2016 | FY 2015 | FY 2014 | FY 2013 |
|---|---|---|---|---|---|---|---|---|---|---|---|---|---|---|
| Revenue | 738.243B | 773.591B | 813.417B | 781.211B | 705.656B | 595.718B | 613.344B | 648.986B | 635.909B | 556.48B | 593.502B | 529.57B | 534.443B | 467.979B |
| Net profit | -40.318B | 45.544B | 38.818B | 49.085B | 48.295B | 36.07B | 21.158B | 55B | 60.531B | 47.958B | 34.134B | 43.346B | 14.921B | -7.793B |
| Free cash flow | -2.005B | -9.926B | -7.342B | -7.499B | -4.257B | 17.23B | 30.781B | 26.633B | 54.174B | 50.42B | 55.599B | — | — | — |
| Figure | FY 2026 | FY 2025 | FY 2024 | FY 2023 | FY 2022 | FY 2021 | FY 2020 | FY 2019 | FY 2018 | FY 2017 | FY 2016 | FY 2015 | FY 2014 | FY 2013 |
|---|---|---|---|---|---|---|---|---|---|---|---|---|---|---|
| Share price | 2.326K | 2.326K | 2.59K | 1.963K | 2.081K | 2.714K | 1.176K | 1.578K | 2.549K | 2.311K | 1.212K | 1.184K | 1.164K | — |
| Price performance 12m | 0 | -0.1 | 0.32 | -0.06 | -0.23 | 1.31 | -0.25 | -0.38 | 0.1 | 0.91 | 0.02 | 0.02 | — | — |
Filed figures
Lines the statements and their notes report beside the headline figures, read from the filings' XBRL as filed (no restatement applied), with figures computed from one filing's own lines. Cash-flow lines carry their cash direction: an outflow is negative. Each period links to its filing; a figure's period, report date and tag are in its tooltip.
| Figure | Mar 2017 | Mar 2018 | Mar 2019 | Mar 2020 | Mar 2021 | Mar 2022 | Mar 2023 | Mar 2024 | Mar 2025 | Mar 2026 |
|---|---|---|---|---|---|---|---|---|---|---|
| Balance sheet detail | ||||||||||
| Trade receivables (JPY) | 138B | 166B | 156B | 141B | 159B | 353B | 353B | 331B | 316B | 299B |
| ↳ YoY growth | +1.5% | +19.6% | -6.1% | -9.1% | +12.6% | +121.7% | +0.2% | -6.2% | -4.7% | -5.2% |
| ↳ 5y CAGR | +3.1% | +20.6% | +16.4% | +16.3% | +17.4% | +13.5% | ||||
| Borrowings, current (JPY) | 74.7B | 71.2B | 58.7B | 44B | 40.1B | 38.9B | 47.9B | 51.8B | 85.6B | 64.2B |
| Borrowings, non-current (JPY) | 43.5B | 35.3B | 36.6B | 29B | 56.2B | 66.6B | 94.7B | 99.7B | 114B | 157B |
| Bonds payable (JPY) | 10B | 10B | 10B | 10B | 20B | 20B | 20B | 30B | 45B | 55B |
| Lease liabilities (JPY) | 547M | 478M | 387M | 1.69B | 2.19B | 2.1B | 4.35B | 3.51B | 2.92B | 2.59B |
| Cash and deposits (JPY) | 75B | 101B | 91.1B | 78.2B | 102B | 102B | 108B | 71.4B | 68.2B | 69B |
| Intangible assets (JPY) | 8.37B | 8.41B | 8.61B | 10.6B | 10.5B | 11.3B | 12B | 24.9B | 25B | 23.5B |
| Net debt (borrowings + leases - cash) (JPY) | 43.7B | 5.87B | 4.62B | -3.52B | -3.31B | 5.6B | 38.6B | 83.6B | 135B | 155B |
| Cash flow detail | ||||||||||
| Operating cash flow (JPY) | 82.7B | 90.7B | 64B | 74.2B | 55.5B | 52.1B | 55.2B | 73.5B | 75.4B | 74.7B |
| Purchases of property, plant and equipment (JPY) | -32.3B | -36.5B | -37.4B | -43.5B | -38.2B | -56.3B | -62.7B | -80.8B | -85.4B | -76.7B |
| Change in receivables (cash effect) (JPY) | -3.93B | -28.6B | 8.06B | 19B | -16.3B | -9.27B | 2.41B | 16.9B | 9.27B | 12.5B |
| Change in inventories (cash effect) (JPY) | 3.95B | -9.76B | -15.8B | 5.69B | -5.53B | -29B | -19.7B | -742M | -5.48B | 5.57B |
| Change in payables (cash effect) (JPY) | 8.42B | 21.4B | -7.29B | -13.8B | 2.69B | 9.79B | -6.87B | -14.3B | -7.63B | -15B |
| Dividends paid (cash effect) (JPY) | -6.99B | -9.93B | -15B | -14.9B | -14.6B | -16.6B | -15.5B | -16.4B | -17B | -19.5B |
| Share buybacks (cash effect) (JPY) | -6.27B | -7.01B | -6M | -8.73B | -4M | -5M | -7.08B | -10B | -15B | -7M |
| Interest paid (cash effect) (JPY) | -1.39B | -974M | -1.02B | -1.03B | -791M | -818M | -1.65B | -2.57B | -2.26B | -2.11B |
| Income taxes paid (cash effect) (JPY) | -5.23B | -5.84B | -6.55B | -7.17B | -9.26B | -10.4B | -20.7B | -12.6B | -11.1B | -16.1B |
| Operating cash flow before change in receivables (JPY) | 86.6B | 119B | 56B | 55.2B | 71.7B | 61.4B | 52.8B | 56.6B | 66.2B | 62.3B |
| Free cash flow (OCF - PPE - intangibles) (JPY) | 50.4B | 54.2B | 26.6B | 30.8B | 17.2B | -4.26B | -7.5B | -7.34B | -9.93B | -2.01B |
| Income detail | ||||||||||
| Research and development expense (JPY) | 19.3B | 19B | 18.6B | 19.7B | 19.9B | 21.1B | 23.5B | 25.6B | 26.2B | 26.6B |
| ↳ 5y CAGR | +1.0% | +1.8% | +4.4% | +6.6% | +5.9% | +6.0% | ||||
| Total comprehensive income (JPY) | 60.9B | 67.6B | 54.3B | 14B | 53.1B | 66.2B | 69.8B | 87.8B | 48.2B | 5.08B |
| Comprehensive income to owners (JPY) | 56.5B | 60.6B | 50.8B | 11.9B | 49.2B | 60.1B | 61.3B | 75.2B | 42.9B | -2.6B |
| Provision for credit losses (JPY) | — | — | — | — | — | 960M | 410M | 200M | 250M | 595M |
| Credit cost ratio (credit losses / average receivables) (%) | — | — | — | — | — | 0.4% | 0.1% | 0.1% | 0.1% | 0.2% |
| Reported | Jun 27, 2017 | Jun 26, 2018 | Jun 25, 2019 | Jun 25, 2020 | Jun 25, 2021 | Jun 28, 2022 | Jun 27, 2023 | Jun 25, 2024 | Jun 24, 2025 | Jun 22, 2026 |
Sign up to see institutional holdings
Sign UpPodcast Mentions
Sign up to see podcast mentions and sentiment
Sign UpTimely disclosures published on TDnet, newest first, titles as filed in Japanese. The link opens the disclosure on TDnet. Filings with EDINET (periodic reports, extraordinary reports, offerings, holding and buy-back reports), newest first, titles as filed in Japanese. The link opens the filing on EDINET. Press releases from the company's own website, newest first.

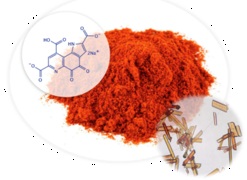
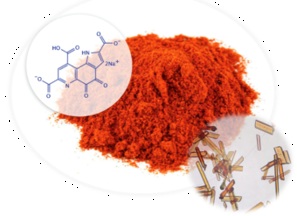
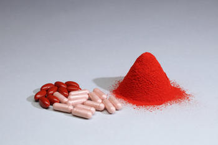 「BioPQQTM」
 「インフォームド原材料」認証

 三菱ガス化学の「ガス化学」って何?
 MGCレポート(統合報告書)
 3分でわかる!三菱ガス化学


 三菱ガス化学の製品家系図
 事業紹介動画「価値創造への挑戦」
 製品・技術トピックス
 中期経営計画「Grow UP 2026」
 個人投資家の皆さまへ
 MGCグループ環境貢献製品
 社会の中の三菱ガス化学




Prompts
Click prompts to add them under the company line, click again to take one out, then copy the result into your AI chat. Shared by Asian Century Stocks and Uncovered Thai Stocks. Thank you.
ETFs Holding Mitsubishi Gas Chemical Company, Inc.
Exchange-traded funds whose newest published daily portfolio holds one of the company's listings, largest weight first.
| ETF | Weight in ETF | Shares | Market value | As of |
|---|---|---|---|---|
| GTEK | 1.25% | 119,488 | $ 2.973M | Aug 31, 2026 |
| DFIV | 0.08% | 792,900 | $ 17.013M | Nov 12, 2026 |
| AVDS | 0.03% | 4,900 | $ 96.824K | Nov 16, 2026 |
| DFSI | 0.03% | 16,500 | $ 354.043K | Nov 12, 2026 |
| DFIC | 0.02% | 149,700 | $ 3.212M | Nov 12, 2026 |
| DISV | 0.02% | 46,600 | $ 999.904K | Nov 12, 2026 |
| DFAI | 0.02% | 143,500 | $ 3.079M | Nov 12, 2026 |
| DFAX | 0.01% | 80,300 | $ 1.723M | Nov 12, 2026 |
| AVDE | 0.01% | 60,700 | $ 1.199M | Nov 16, 2026 |
| DXIV | 0.01% | 1,000 | $ 21.457K | Nov 12, 2026 |
| DFIS | 0.00% | 7,700 | $ 165.22K | Nov 12, 2026 |