2026年12月期 第3四半期 決算説明資料
Bull 6
Bear 0
Results
4180
|
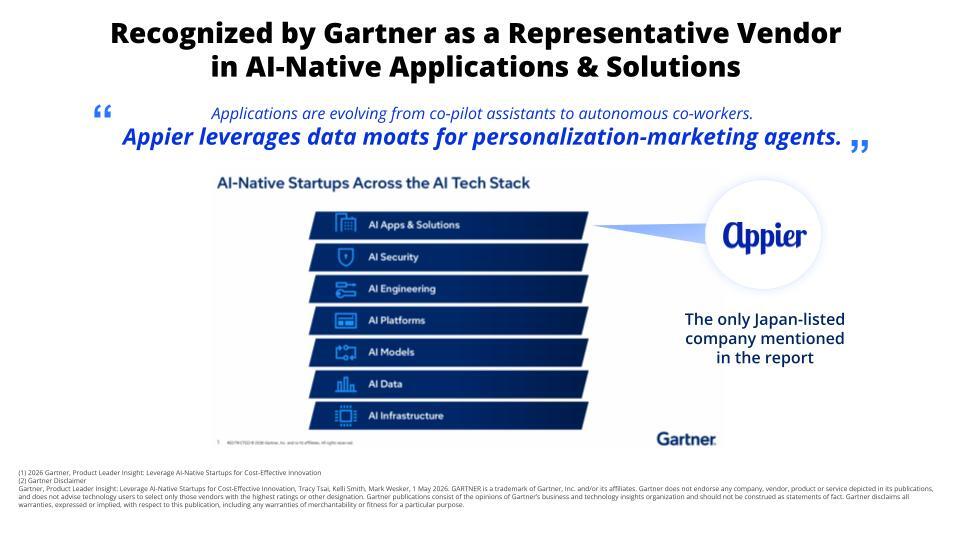
Appier Group, Inc. is an AI-native technology company providing Agentic AI as a Service (AaaS) solutions for digital marketing and sales. The company offers an AI platform that integrates fragmented first-party data and automatically builds predictive, generative, and agentic AI models to optimize customer acquisition, retention, and conversion across the full marketing funnel. Its product portfolio is organized into three categories: the Advertising Cloud, which includes CrossX and AIXPERT for high-LTV user targeting and automated campaign management, and AdCreative.ai for AI-generated ad creative; the Personalization Cloud, featuring AIQUA and BotBonnie for personalized messaging and conversational engagement; and the Data Cloud, which includes AIRIS, a customer data platform. The company serves consumer-facing businesses in Asia, Europe, and the Americas. Founded in 2012, the group has expanded through acquisitions of Quantumgraph Solutions, Emotion Intelligence, BotBonnie, Woopra, and ADYOUNEED SAS. Summarised from the annual report, fiscal year ended Dec 2025 |
Industry Software - Application | Homepage appier.com |
| Sector Technology | IR page appier.com/en | |
|
Tags
marketing automation, customer data platform, ad creative generation, predictive analytics, conversational commerce, agentic ai, deep learning, b2b software, CrossX, AIXPERT, AdCreative.ai, AIQUA, BotBonnie, AIRIS, Appier Inc., Appier Pte. Ltd., Appier Japan, Quantumgraph Solutions Private Limited, Emotion Intelligence, Woopra Inc., ADYOUNEED SAS
|
Press page — |
Metrics
| Valuation | |
|---|---|
| Market cap | ¥ 138.432B |
| Market cap (USD) | $ 868.359M |
| P/E | 32.72 |
| PEG | 0.08 |
| P/BV | 3.44 |
| P/S | 2.69 |
| P/OCF | 42.30 |
| P/FCF | -77.73 |
| Dividend yield | 0.17% |
| Turnover / mcap | — |
| Returns | |
|---|---|
| ROE | 7.2% |
| ROI | 5.5% |
| ROIC | 6.1% |
| Profit margin | 5.8% |
| Growth | |
|---|---|
| Revenue growing | Yes |
| Profits growing | No |
| Revenue up 3y | Yes |
| Revenue up 5y | Yes |
| Earnings growth 3y (net profit CAGR) | 393.2% |
| Quality | |
|---|---|
| Profitable | Yes |
| Margin expanding | Yes |
| Buying back stock | No |
| Diluting (TTM) | No |
| Debt/Equity | — |
| Podcast bulls (TTM) | Sign up |
| Podcast bears (TTM) | Sign up |
| Podcast sentiment (TTM) | Sign up |
| Podcast sentiment % (TTM) | Sign up |
| News sentiment (TTM) | 0 |
| Quality score | 0% |
| Insiders | |
|---|---|
| Buys, 1w | Sign up |
| Buys, 1m | Sign up |
| Buys, 1y | Sign up |
| Sells, 1w | Sign up |
| Sells, 1m | Sign up |
| Sells, 1y | Sign up |
Sign up to see this company's insider trades
Filed figures
Lines the statements and their notes report beside the headline figures, read from the filings' XBRL as filed (no restatement applied), with figures computed from one filing's own lines. Cash-flow lines carry their cash direction: an outflow is negative. Each period links to its filing; a figure's period, report date and tag are in its tooltip.
| Figure | Dec 2019 | Dec 2020 | Dec 2021 | Dec 2022 | Dec 2023 | Dec 2024 | Dec 2025 |
|---|---|---|---|---|---|---|---|
| Balance sheet detail | |||||||
| Trade receivables (JPY) | 980M | 1.17B | 1.92B | 2.84B | 3.73B | 6.39B | 10.6B |
| ↳ YoY growth | +19.6% | +63.9% | +48.0% | +31.0% | +71.4% | +65.9% | |
| ↳ 5y CAGR | +45.5% | +55.3% | |||||
| Borrowings, current (JPY) | 975M | 1.9B | 2.1B | 2.15B | 600M | 1.5B | 3.79B |
| Borrowings, non-current (JPY) | — | — | — | — | — | — | 5.75B |
| Lease liabilities (JPY) | 601M | 643M | 3.05B | 2.91B | 2.75B | 2.28B | 1.57B |
| Cash and deposits (JPY) | 4.12B | 1.63B | 6.56B | 3.8B | 6.13B | 5.5B | 11.7B |
| Intangible assets (JPY) | 598M | 1.3B | 2.98B | 6.94B | 9.35B | 12.5B | 20.5B |
| Right-of-use assets (JPY) | 554M | 607M | 3.05B | 2.88B | 2.69B | 2.2B | 1.49B |
| Net debt (borrowings + leases - cash) (JPY) | -2.54B | 911M | -1.41B | 1.26B | -2.79B | -1.72B | -623M |
| Cash flow detail | |||||||
| Operating cash flow (JPY) | -1.81B | -840M | -747M | 996M | 2.22B | 1.93B | 3.27B |
| Purchases of property, plant and equipment (JPY) | -52.6M | -20.6M | -103M | -97.6M | -118M | -74M | -20M |
| Purchases of intangible assets (JPY) | — | -830M | -1.42B | -2.33B | -3.23B | -4.19B | -5.03B |
| Change in receivables (cash effect) (JPY) | 107M | -218M | -633M | -882M | -797M | -2.35B | -4.08B |
| Change in payables (cash effect) (JPY) | -63.5M | 292M | 338M | 210M | 493M | 661M | 1.88B |
| Dividends paid (cash effect) (JPY) | — | — | — | — | — | — | -203M |
| Share buybacks (cash effect) (JPY) | — | — | — | -246,000 | -109,000 | -1B | 0.00 |
| Interest paid (cash effect) (JPY) | -18.7M | -20.6M | -36.1M | -73.3M | -88.8M | -76M | -118M |
| Income taxes paid (cash effect) (JPY) | -33.4M | -29.6M | -42.3M | -40.6M | -87M | -67M | -38M |
| Share-based compensation (JPY) | 65.8M | 82.8M | 91.6M | 76.3M | 187M | 262M | 148M |
| Operating cash flow before change in receivables (JPY) | -1.91B | -622M | -114M | 1.88B | 3.02B | 4.28B | 7.35B |
| Free cash flow (OCF - PPE - intangibles) (JPY) | -1.86B | -1.69B | -2.27B | -1.43B | -1.12B | -2.34B | -1.78B |
| Income detail | |||||||
| Research and development expense (JPY) | 1.78B | 1.49B | 1.71B | 2.28B | 3.14B | 4.65B | 5.34B |
| ↳ 5y CAGR | +21.2% | +29.1% | |||||
| Total comprehensive income (JPY) | -2.36B | -1.73B | 245M | 3.29B | 2.7B | 5.96B | 2.89B |
| Comprehensive income to owners (JPY) | -2.36B | -1.73B | 245M | 3.29B | 2.7B | 5.96B | 2.89B |
| Reported | Mar 31, 2021 | Mar 31, 2021 | Mar 30, 2022 | Mar 30, 2023 | Mar 29, 2024 | Mar 31, 2025 | Mar 26, 2026 |
Sign up to see institutional holdings
Sign UpPodcast Mentions
Sign up to see podcast mentions and sentiment
Sign UpTimely disclosures published on TDnet, newest first, titles as filed in Japanese. The link opens the disclosure on TDnet. Filings with EDINET (periodic reports, extraordinary reports, offerings, holding and buy-back reports), newest first, titles as filed in Japanese. The link opens the filing on EDINET. Press releases from the company's own website, newest first.
通期連結業績予想の修正及び配当予想の修正(増配)に関するお知らせ
Bull 4
Bear 0
Guidance
2026年12月期 第3四半期決算短信〔IFRS〕(連結)
Bull 5
Bear 0
Results


















 ###



Prompts
Click prompts to add them under the company line, click again to take one out, then copy the result into your AI chat. Shared by Asian Century Stocks and Uncovered Thai Stocks. Thank you.
Appier Group, Inc. (ticker 4180), listed in Japan.
Copied
ETFs Holding Appier Group, Inc.
Exchange-traded funds whose newest published daily portfolio holds one of the company's listings, largest weight first.
| ETF | Weight in ETF | Shares | Market value | As of |
|---|---|---|---|---|
| AVDS | 0.04% | 12,900 | $ 130.988K | Nov 16, 2026 |
| DFIS | 0.03% | 181,900 | $ 1.655M | Nov 12, 2026 |
| DXIV | 0.01% | 3,900 | $ 35.488K | Nov 12, 2026 |
| AVDE | 0.01% | 106,800 | $ 1.084M | Nov 16, 2026 |
| DFSI | 0.01% | 11,100 | $ 101.004K | Nov 12, 2026 |
| DFIC | 0.01% | 127,100 | $ 1.157M | Nov 12, 2026 |
| DFAX | 0.00% | 64,300 | $ 585.094K | Nov 12, 2026 |
| DFAI | 0.00% | 75,572 | $ 687.663K | Nov 12, 2026 |