2026年12⽉期第2四半期決算説明資料 株式会社 S u n A s t e r i s k | 証券コード: 4 0 5 3 2026.09.14 Notice Regarding the Results of an Internal Investigation into an Overseas Consolidated Subsidiary and Measures to Prevent Recurrence, released on Se…
2026年12⽉期第2四半期決算説明資料
株式会社 S u n A s t e r i s k | 証券コード: 4 0 5 3
2026.09.14
Notice Regarding the Results of an Internal Investigation into an Overseas Consolidated Subsidiary and Measures to Prevent Recurrence, released on September 14, 2026
2026 年 9 ⽉ 14 ⽇公表「海外連結⼦会社に関する社内調査結果及び再発防⽌策に関するお知らせ」
当社は、2026年8⽉13⽇付「2026年12⽉期半期報告書の提出期限延⻑に関する承認申請書提出のお知らせ」にて
お知らせいたしましたとおり、当社海外連結⼦会社であるSun Asterisk Vietnam Co., Ltd*1に
おいて、会計帳簿に計上されていない資⾦*2の存在が確認されたことを受け、内部監査室及び当社の
顧問弁護⼠を中⼼とする調査体制を構築し、事実関係の確認及び原因分析を進めてまいりました。
当社は、引き続き事実関係の確認及び必要な会計処理の検討に努めるとともに、
再発防⽌策を着実に実⾏し、当社グループのガバナンス体制強化に取り組んでまいります。
株主‧投資家の皆様をはじめ、お取引先その他の関係者の皆様には、
多⼤なるご⼼配をおかけしておりますことを深くお詫び申し上げます。
今後とも、信頼回復に向けて役職員⼀同取り組んでまいります。
*1:以降SVN
*2:以降簿外現⾦
次⾴において、調査結果および再発防⽌策をご説明いたします。
© 2026 Sun * In c . | 株式会社 Sun As te r is k (証券コード:4053)
2
Summary of the Investigation Results and Measures to Prevent Recurrence
調査結果および再発防⽌策の概要
①本件の概要
• SVNにおいて2013年頃から、教育⽀援事業に関連する資⾦授受を帳簿外で処理し、約24百万円の簿外現⾦が発⽣
• 講師からの資⾦移動は受贈、教育関係者への⽀払いは役務対価と判断
②経営陣の関与
• 経営陣による簿外現⾦の認識‧指⽰‧承認、資産流⽤‧財務数値操作の意図は確認されず
1.調査結果
2.原因分析
(1)内部統制に対する意識の不⾜
(2)特定のSVN担当者による対外折衝業務の属⼈化と牽制不⾜
(3)海外⼦会社に対するモニタリング‧内部統制が不⼗分
3.再発防⽌策
(1)簿外資産‧負債及び簿外での資⾦管理の禁⽌と定期確認の徹底
(2)通常と異なる取引‧会計処理発⽣時の本社への報告‧エスカレーションのルール化
(3)外部への資⾦提供に関する取引管理(契約書の整備‧承認プロセス)の強化
(4)SVNに対する本社の経営管理及びモニタリングの強化
(5)特定のSVN担当者への業務の属⼈化防⽌と適切な職務分掌の徹底
(6)当社グループ役職員に対する内部統制に係る研修の定期的な実施
4.財務諸表に
与える影響及び
会計処理
• 本件簿外現⾦24百万円を計上
• 販売費および⼀般管理費6百万円、営業外収益30百万円(うち、過年度影響額22百万円)を計上
• 過年度影響は僅少であり、過年度訂正は実施せず
5.今後の対応
• 事実確認および必要な会計処理の検討を継続
• 再発防⽌策の実⾏、グループガバナンスの強化
• 関係者からの信頼回復に向けた取り組みを推進
© 2026 Sun * In c . | 株式会社 Sun As te r is k (証券コード:4053)
3
Agenda
⽬次
- 会社概要
- 2026 年 12 ⽉期第2四半期実績
- 事例紹介
- トピックス
- Appendix
© 2026 Sun * In c . | 株式会社 Sun As te r is k (証券コード:4053)
4
1
会社概要
Our Vision
誰もが価値創造に
夢中になれる世界
MAKE
AWESOME
THINGS
THAT MATTER
Create a world where everyone has the
freedom to make awesome things that matter.
社名に含まれる“Sun”はまさに「太陽」。地球上のすべての⽣命を育むインフラです。
⾰新的なサービスや、新しいイノベーターの「種」を、私たちの光で照らし、それらを
育む最強のインフラになることを⽬指しています。Sun*が価値創造をするためのインフ
ラとなることで、全⼈類が⽣まれた時から持っているクリエイティブへの情熱を呼び起
こし「誰もが価値創造に夢中になれる世界」を実現させます。
Our Mission
本気で課題に挑む⼈たちと事業を通して社会に
ポジティブなアップデートを仕掛けていくこと
Create radical products and businesses with
people who actually care about what they do.
“*(Asterisk)”は、多くのプログラミング⾔語で掛け算を表す記号です。
スタートアップや⼤企業の垣根を超え、価値創造に最適なチームを編成し、本気で社会
課題に挑むヒト‧モノ‧コトとのコラボレーションを通じて、様々な産業のデジタライ
ゼーションを促進することで、社会にポジティブなアップデートを仕掛けていきます。
Company Profile / Our Works
事業概要
事業創造から
サービスの成⻑まで
包括的に⽀援
*売上構成⽐は2025年度実績
© 2026 Sun * In c . | 株式会社 Sun As te r is k (証券コード:4053)
7
Company Profile / Our Works
3つのサービスラインで構成する売上ポートフォリオ
主⼒事業
安定収益
成⻑余地
Creative & Engineering
Talent Platform
Incubation
プロダクト開発‧DX⽀援
⼈材‧開発リソース提供
新規事業‧⾃社IP開発
• 新規事業‧プロダクト開発
• 常駐型エンジニアリング(SES)
• ⾃社IP開発(エンタメ‧ゲーム等)
• モダナイゼーション‧基幹システム開発
• ⼈材紹介‧リソース提供
• ファンコミュニティ‧プロダクト運営
• AI実装‧業務DX‧保守‧運⽤
• 採⽤⽀援‧内製化⽀援
売上の柱。顧客数‧案件規模‧単価の
増加が売上に影響
3サービスラインのシナジー
⾃社IPを保有
SESを中⼼とした安定的な収益
⼈材‧チームの最適配置
IP成功時の売上ポテンシャル
ナレッジ‧データの共有
顧客基盤の連動
© 2026 Sun * In c . | 株式会社 Sun As te r is k (証券コード:4053)
Company Profile / Our Works
構想から事業成⻑まで伴⾛する独⾃モデル
コンサルティングファーム
SIer
戦略‧構想中⼼
システム導⼊‧開発中⼼
上流⽀援‧⼤規模変⾰に強み
プロジェクト単位で提供
システム実装領域に強み
戦略‧構想領域に強み
1
構想‧戦略
事業アイデア
‧戦略⽴案
2
UX/UIデザイン
ユーザー体験設計
‧UI/UX
3
開発‧実装
プロダクト開発
‧AI実装
4
⼈材基盤
運⽤‧グロース
5
データ‧クラウド
‧セキュリティ
グローバル⼈材
プラットフォーム
6
⾃社事業創出
⾃社IP、
ToC事業の企画
戦略‧UX/UI‧実装‧AI‧クラウド/セキュリティ‧⼈材基盤‧⾃社事業創出を⼀体で持ち、継続的な価値創出を実現
© 2026 Sun * In c . | 株式会社 Sun As te r is k (証券コード:4053)
Company Profile / Our Works
Creative & Engineering
事業創造と業務変⾰の両⾯から、企業の成⻑を実現
新しい価値創出
既存事業の変⾰
新規事業‧プロダクト開発
モダナイゼーション‧業務DX
新規事業の⽴ち上げやプロダクト開発を通じて、
新たな価値創出を⽀援
レガシーシステムの刷新から業務DXまで、
事業基盤の変⾰を⽀援
AI活⽤ノウハウを備えた
BCTケイパビリティ
実⾏を⽀える
開発体制
価値創出と
変⾰の循環
構想
設計
実装
Business
Creative / UX
Technology
AI
⽇本拠点を中⼼とした
事業創出‧開発マネジメント
400
⼈+
ベトナム拠点を中⼼とした
スケーラブルな開発⽀援
1,000
人+
© 2026 Sun * In c . | 株式会社 Sun As te r is k (証券コード:4053)
2
2026年12⽉期第2四半期実績
FY2026 Q2 Performance
2026年度第2四半期ハイライト
売上⾼、営業利益、EBITDAのいずれも前年同期に対して⼤きく伸⻑
通期業績予想に対する進捗率は、計画を⼤きく上回る⽔準となった
⽇本基準
単位:百万円
2025年度
2Q累計実績
2026年度
2Q累計実績
前年同期⽐
通期業績予想
進捗率
売上⾼
7,058
8,881
+25.8%
18,201
48.8%
売上総利益
3,204
4,424
+38.1%
9,113
48.6%
売上総利益率
45.4%
49.8%
-
50.1%
-
営業利益
415
1,004
+141.8%
1,469
68.4%
営業利益率
5.9%
11.3%
-
8.1%
-
EBITDA
513
1,168
+127.5%
1,849
63.2%
• 売上⾼はクリエイティブ&エンジニアリングの受注増加等により前年同期に対して⼤きく伸⻑
• グローバルギア社(FY2025Q3以降)、MIXENSE社(FY2026Q1以降)の連結も寄与
• FY2025Q2累計は不採算のプロジェクト影響により売上総利益率が低⽔準、当該プロジェクトがFY2025Q3に終了したことでFY2026Q1以降は正常⽔準へと回復
• 売上⾼、段階利益ともに期初の業績予想を上回る⽔準で進捗
© 2026 Sun * In c. | 株式会社 Sun As te r is k (証券コード:4053)
12
FY2026 Q2 Performance
2026年度第2四半期実績
売上⾼は前年同期⽐+25.8%、営業利益は+141.8%と⼤幅に伸⻑
通期業績予想に対する進捗率は、売上⾼が48.8%、営業利益は68.4%、当期純利益が69.3%
⽇本基準
単位:百万円
2025年度
第2四半期累計実績
2026年度
第2四半期累計実績
前年同期⽐
通期業績予想
進捗率
売上⾼
7,058
8,881
+25.8%
18,201
48.8%
売上原価
3,853
4,456
+15.7%
9,088
49.0%
売上総利益
3,204
4,424
+38.1%
9,113
48.6%
(売上総利益率)
45.4%
49.8%
-
50.1%
-
販売費及び⼀般管理費
2,789
3,419
+22.6%
7,644
44.7%
営業利益
415
1,004
+141.8%
1,469
68.4%
(営業利益率)
5.9%
11.3%
-
8.1%
-
EBITDA*
513
1,168
+127.5%
1,849
63.2%
経常利益
452
1,189
+163.1%
1,655
71.8%
当期純利益
347
792
+128.0%
1,144
69.3%
0.00570円
0.00600円
期中平均為替レート
(1ベトナムドン)
0.00590円
*EBITDA:営業利益+減価償却費+のれん償却費等
© 2026 Sun * In c. | 株式会社 Sun As te r is k (証券コード:4053)
13
FY2026 Q2 Performance
四半期売上⾼の推移
2026年度第2四半期の売上⾼は、第1四半期を上回る過去最⾼の44.7億円で着地
C&Eの営業組織強化による受注増加が成⻑を牽引、M&Aによる効果も売上⾼の増加に寄与
■インキュベーション(INC)
■タレントプラットフォーム(TPF)
FY2026Q 2
■クリエイティブ&エンジニアリング(C&E)
44.7 億円
+27.1 %
単位:百万円
4,500
FY2025Q 2
4,000
35.1 億円
3,500
サービス
ライン
3,000
2,500
C&E
前年
同期⽐
増減要因
+30.8%
営業活動が好調に推移し受注⾦額が増加
FY2026Q1から連結のMIXENSE社売上も寄与
+0.1%
中⼼であるSES事業は堅調で前年同期⽐で増加
⼈材紹介の売上が減少
+36.5%
ファンコミュニティプラットフォームの売上増加
FY2025Q3から連結のグローバルギア社売上も寄与
2,000
1,500
TPF
1,000
500
0
INC
Q1
Q2
Q3
FY2021
Q4
Q1
Q2
Q3
FY2022
Q4
Q1
Q2
Q3
FY2023
Q4
Q1
Q2
Q3
FY2024
Q4
Q1
Q2
Q3
FY2025
Q4
Q1
Q2
FY2026
© 2026 Sun * In c. | 株式会社 Sun As te r is k (証券コード:4053)
14
FY2026 Q2 Performance
重要KPIの推移(四半期)
ユニーク顧客数は、エンタープライズ顧客への注⼒によりSMBが減少し、全体では187社となり前四半期から減少
ARPUは、エンタープライズの既存顧客向け⼤型案件の増加により上昇
ユニーク顧客数の推移 *1
単位:社
⽉額平均顧客売上(ARPU)の推移
■ エンタープライズ顧客数 *3
単位:万円
■ SMB顧客数*4
1,000
240
210
180
150
120
129 132 133
38 38 42
139
39
147 149 144
154
39 39 42 50
165
52
179
159 162
53 59
73
170
68
181
190
77 86
200 195 204 201 201 204
88 83 88 92 92 96
93
30
92 94 91
800
111 104 105 114 107 104 106 102 104 104 112 112 116 109 109 108
108
100
935
94
0
705
799 797
840
200
772
731
660
601
600
400
90
60
■ 全顧客平均
■ エンタープライズ顧客平均 *3
■ SMB顧客平均 *4
850
187
*2
427 412
479
442
314 312 313 303
476 464
358
500
462
403 398
331
493
360
802 820
541 542
413
389
757
876
720
732 750
683 679 695
588
564
502
768
803
485
342 328 331
641
508 503 507 498 514 520
310 319 330
338
383
367
349
348
0
1Q
2Q
3Q
FY2021
4Q
1Q
2Q
3Q
FY2022
4Q
1Q
2Q
3Q
FY2023
4Q
1Q
2Q
3Q
FY2024
4Q
1Q
2Q
3Q
FY2025
4Q
1Q
2Q
FY2026
1Q 2Q 3Q 4Q 1Q 2Q 3Q 4Q 1Q 2Q 3Q 4Q 1Q 2Q 3Q 4Q 1Q 2Q 3Q 4Q 1Q 2Q
FY2021
FY2022
FY2023
FY2024
FY2025
FY2026
*1 当該期間内(四半期)において取引を⾏った顧客の実数
*2 当該期間(四半期)の総売上⾼÷同期間の延べ取引顧客数
*3 エンタープライズ:上場企業のうち、⽇経225、⽇経400、⽇経500のいずれかに採⽤されている企業、⼜は同企業のグループ企業や上記企業に準ずる時価総額、売上規模、従業員数規模を有している企業
*4 SMB: スモール‧ミッドサイズビジネスの略称。当社がエンタープライズと定義した以外の全ての企業
© 2026 Sun * In c. | 株式会社 Sun As te r is k (証券コード:4053)
15
FY2026 Q2 Performance
売上総利益および営業利益増減要因(前年同期⽐較)
増収が労務費および外注費の増加を⼤きく上回り、売上総利益は前年同期差+12.2億円の44.2億円へ増加
販売管理費は前年同期に対し増加したものの、売上総利益の増加が上回り、営業利益は前年同期差+5.8億円の10.0億円で着地
単位:百万円
売上総利益の増減要因
営業利益の増減要因
1,823
前年同期差
+1,220百万円
1,823
▲ 403
▲ 70
▲ 68
▲ 60
4,424
▲ 543
3,204
前年同期差
+589百万円
▲ 329
▲ 257
▲ 103
1,004
415
FY2025Q2
累計
増収
労務費増加
外注費増加
その他
売上原価増加
為替影響
FY2026Q2
累計
FY2025Q2
累計
増収
売上原価増加
⼈件費
増加
その他販管費
増加
為替影響
FY2026Q2
累計
注記:各項⽬の合計は、端数処理により合計値と⼀致しない場合あり
© 2026 Sun * In c. | 株式会社 Sun As te r is k (証券コード:4053)
16
FY2026 Q2 Performance
販売管理費実績の内訳
事業規模拡⼤のため、⼈件費、採⽤費、営業活動費等が前年同期⽐で増加
販売管理費全体では前年同期⽐+22.6%であり、売上⾼の増加率を下回る⽔準で着地
単位:百万円
2025年度第2四半期
2026年度第2四半期
累計実績
累計実績
構成⽐
構成⽐
前年同期⽐
詳細
⼈件費
2,013
72.2%
2,378
69.6%
+18.2% ⼈員数増加
採⽤費
139
5.0%
178
5.2%
+28.0% 採⽤⼈数増加
業務委託費
127
4.6%
203
5.9%
+59.7% 営業関連費⽤等の増加
営業活動費
99
3.6%
159
4.7%
+59.7% 広告宣伝費等増加
ファシリティ費
301
10.8%
369
10.8%
+22.5% システム費の増加(⼈員数増加/AIツール等)
その他販管費
108
3.9%
130
3.8%
+20.7%
2,789
100.0%
3,419
100.0%
+22.6%
合計
© 2026 Sun * In c. | 株式会社 Sun As te r is k (証券コード:4053)
17
FY2026 Q2 Performance
貸借対照表⽐較
M&Aに伴うのれん等の計上および運転資本需要への対応により総資産は増加
⾃⼰資本⽐率は61.3%と⾼い⽔準を維持
単位:百万円
流動資産
2025年12⽉末
2026年6⽉末
増減額
主な要因
13,150
15,365
+2,214
現⾦及び預⾦、契約資産等の増加
10,560
12,269
+1,708
短期借⼊⾦の増加等による増加
固定資産
2,958
3,934
+975
資産合計
16,109
19,299
+3,189
流動負債
3,154
5,000
+1,846
固定負債
2,291
2,438
+147
純資産
10,662
11,859
+1,196
負債‧純資産合計
16,109
19,299
+3,189
⾃⼰資本⽐率
66.2%
61.3%
ー
うち現⾦及び預⾦
MIXENSE社株式取得によるのれん等の計上
運転資本需要への対応に伴う短期借⼊⾦の増加
利益剰余⾦および為替換算調整勘定の増加
注記:⾃⼰資本⽐率は、純資産合計から新株予約権及び⾮⽀配株主持分を控除した⾃⼰資本に基づき算定
© 2026 Sun * In c. | 株式会社 Sun As te r is k (証券コード:4053)
18
FY2026 Q2 Performance
2026年度の重点課題
重点課題
新規顧客および
既存顧客新規案件の
獲得
対応⽅針
2026年度第2四半期の振り返り
• エンタープライズ新規開拓の強化(Account Based
Marketing推進)
• エンタープライズに注⼒したことによりSMBのユニー
ク顧客数は減少
• 既存顧客の深耕強化(Up-sell / Cross-sellによるLTV最
⼤化)
• エンタープライズ顧客の新規獲得ペースの加速が今後
の売上規模拡⼤には必要
• カスタマーサクセス強化による解約防⽌と追加受注創
出
• 既存エンタープライズ顧客の深耕および案件の⼤型化
が進捗しARPUは2025年度⽐で⼤きく上昇
• 4つのソリューション事業ラインの設置(ソリューショ
ン開発およびプリセールス体制の拡充)
Creative&
Engineering
営業組織の強化
• アカウント情報基盤の整備とアカウントプランの標準
化
• Principal Director(顧客統括責任者) / Account
Program Manager(プロジェクト統括責任者) /
Customer Successの採⽤‧育成強化
• アカウント情報基盤の整備が進捗
• ⼈材採⽤/育成を継続的に推進
• 社内リソースに合致した案件獲得への注⼒
稼働率の向上
• 稼働モニタリングの⾼度化
• 稼働率は前年同四半期を上回る⽔準で着地
• 市場ニーズに対応した⼈材のリスキリング
• ⼈材採⽤は好調に推移
• 社内⼈材が不⾜する技術領域での採⽤
© 2026 Sun * In c . | 株式会社 Sun As te r is k (証券コード:4053)
19
3
事例紹介
Our Works
FY26上期実績|⼤⼿企業を中⼼に、AI駆動開発の取り組みが拡⼤
AI駆動開発の
⽀援実績
17社
新規事業開発から⼤規模刷新、モダナイゼーション‧基幹システム刷新、運⽤⾼度化まで
⽀援業界
製造
ロボティクス
⾦融
建設
環境‧資源
エンター
テインメント
教育
⼈材‧BPO
コンサルティング
モビリティ
⼩売‧流通
ヘルスケア
Sun*のAIDDの定義
(FY26上期)
約 39% (FY26上期)
AI駆動開発を取り⼊れた⽀援実績(抜粋)
01
保険
AI駆動開発を含む企業の
C&E売上構成⽐
13業界にわたる
⽀援実績
新規事業の
⽴ち上げ⽀援
事業計画‧サービスデザインから
MVP開発、事業基盤構築まで⼀体で⽀援。
04
モダナイゼーション‧
基幹システム刷新
既存資産を活かしながら、次世代基盤へ
段階的に刷新。コストと業務効率を向上。
02
03
⼤規模
デジタル刷新
⼤規模Web‧業務システムの
全⾯刷新をAI駆動開発で実現。
05
プラットフォーム
‧業務基盤構築
複数の機能‧業務を統合する
共通基盤を構築。
06
開発体制の引継ぎ‧
スケール⽀援
複数ベンダー体制を統合し、
開発速度と品質を両⽴。
運⽤⾼度化‧
システム再構築
継続改善や外部サービス連携、
再構築まで段階的に⽀援。
AIが成果物の⼤部分を⽣成し、開発プロセスをチームで標準化‧運⽤する開発⽅式
※ 守秘義務のため、社名‧業界と⽀援内容の対応関係は記載していません
© 2026 Sun * In c . | 株式会社 Sun As te r is k (証券コード:4053)
21
Our Works
AI駆動開発 × 新規事業⽀援:Trans Digital LifeStyle
クライアント
イベント参画者
ジャカルタ初開催の⽇本⽂化イベントを、AI駆動開発「HEART Dev」で⽀援
2週間で開発、2⽇間で7,000件の来場者
データを安定取得し、現地改善にも即応
2026年5⽉にインドネシア‧ジャカルタで開催された「Merah! Merah! Anime Japan!!」(以下、
MMAJ)。Trans Digital LifeStyle Group様(CT Corpグループ⼦会社)主催のもと、三井物産様 (以下、
三井物産)が参画する本イベントで、Sun*はブースのガチャ利⽤に必要なアプリを開発しました。着⼿は開
催⽇のわずか2週間前。多国籍の来場者が迷わず使える操作性、個⼈情報を守るセキュリティ、混雑したモ
バイル回線でも安定するレスポンスと可⽤性が求められました。AI駆動開発「HEART Dev」を⽤い、実
装‧要件確認‧改善を短いサイクルで推進。アプリはイベント期間中も安定稼働し、2⽇間で7,000件の⼊
⼒データを取得。さらに現地でUI‧UXを改善するなど、会場で得た気づきにも迅速に対応しました。CT
Corpグル―プ様および三井物産様との連携を継続し、幅広い領域での価値創出をともに進めていきます。
※三井物産は、インドネシアを代表する⼤⼿複合企業グループ「CT Corp」と2018年より戦略的提携を進めています。
AI駆動開発
I S S UE
Webアプリ開発
UI/UXデザイン
商社
クライアントの課題
MMAJ とは
• 開催まで2週間という限られた期間で、確実にリリースする必要があった
• 多国籍の来場者が迷わず使え、ブース運営を妨げないUXが求められた
• インドネシアの法律に準拠し個⼈情報を安全に扱い、混雑した通信環境でも安定させる必要があった
S O LUT I O N
課題に対するSun*の対応
• ⾼速AI駆動開発「HEART Dev」を活⽤し、実装‧要件確認‧改善を短いサイクルで推進
• 多⾔語UXを構築し、現地で利⽤状況を観察しながらUI‧UXを即時改善
• テストコードを⼗分に整備し、短期開発でも不具合の発⽣リスクを低減
• Google Cloudで、セキュリティ‧可⽤性‧レスポンスと低コストを両⽴
⾼速AI駆動開発 HEART Devで画⾯仕様書を⽣成し、
要件確認と開発を加速
アニメを⼊⼝に、⽇本のエンターテ
インメント‧産業‧⽂化の魅⼒を世
界へ届ける国際イベント。インドで
2回にわたり延べ10万⼈を動員した
姉妹イベントとして、2026年5⽉に
ジャカルタで初開催。⽇本‧インド
ネシア両国の関係機関による後援の
もと、ドラえもん、ポケモン、ウル
トラマン、ハイキュー!!など、⽇本
を代表する⼈気IPが集結しました。
© 2026 Sun * In c. | 株式会社 Sun As te r is k (証券コード:4053)
22
Our Works
DX推進、新規事業開発⽀援:あいおいニッセイ同和損害保険株式会社
100を超える事業探索から「トラめぐり」を事業化、パートナー開拓も伴⾛
保険外収益の柱づくりを、構想から
サービス開始まで⼀気通貫で⽀援
2026年8⽉、あいおいニッセイ同和損保が中古トラック⼀括査定サービス「トラめぐり」の提供を開
始しました。Sunは、同社が2024年4⽉に始動した新規事業プロジェクトに構想段階から参画。保
険外収益の創出をテーマに108案の事業機会を探索し、複数のテーマでサービスデザインを実施。そ
の⼀つである「トラめぐり」では、数⼗社の運送事業者へのインタビューや買取事業者の開拓、PoC
まで、企画にとどまらない事業開発を両社⼀体で推進。市場‧競合の分析を重ね、同社の全国営業網
や保険データが競争優位として活きる事業へ磨き上げました。Sunは、コンセプト策定‧具体化に
加え、現場検証やPoC、ローンチ後を⾒据えたマーケティング‧セールス戦略の設計まで、⼀気通貫
で伴⾛。実証実験では、他社査定額の約10.6倍で成約した⾞両も⽣まれています。今後5年間で
2,600社の利⽤を⾒込むサービスのグロース実現に向け、引き続き伴⾛して参ります。
サービスデザイン
ISSUE
UI/UXデザイン
開発実装
保険
クライアントの課題
• 本業を伸ばしながら、シナジーのある保険外収益の柱を育てる必要があった
• 事業案の発散から⽬利きまで、新規事業開発の⽅法論を社内に築く必要があった
• 中古トラック流通という未知の領域で、検証と販路開拓をやり切る実⾏⼒が求められた
SOL UTI ON
※本サービスの⽴ち上げは、⽇本経済新聞(2026年8⽉24⽇付)でも報じられました。
構想からサービス開始までの伴⾛プロセス
市場‧競合を⾒極め、損保ならではの強みを活かし、サービス開始まで⼀気通貫で⽀援
1
2
3
4
成果
事業機会
探索
市場‧競合
分析
検証‧具体化
サービス
開始準備
『トラめぐり』
提供開始
108案を発散‧選
市場‧競合を分析
現場検証‧事業者
マーケ‧セールス
⾃社アセットで事
抜、注⼒テーマを
⾃社アセットの
開拓‧PoCを両
戦略を設計し、提
業化、ローンチ後
具体化
優位性を整理
社で推進
供開始へ
もグロース⽀援
課題に対するSun*の対応
• 新規事業プロジェクトの構想段階から参画し、108案から既存アセットが活きる事業機会を選抜
• 独⾃フレームワークを使った隔週の壁打ち会を約1年運営し、各部⾨の事業案を磨き込み
• 企画にとどまらず、現場インタビューや営業開拓も担い、複数のパートナーおよびユーザーを獲得
• サービスコンセプトの策定から具体化‧サービス開始まで伴⾛し、ローンチ後のグロースも継続⽀援
© 2026 Sun * In c. | 株式会社 Sun As te r is k (証券コード:4053)
23
Company Profile / Our Works
670社 1,300以上
Creative & Engineeringの⽀援事例
の開発⽀援実績
新規事業から基幹システムまで、⼀気通貫で開発を⽀援
新規事業‧プロダクト開発
2025年12⽉末時点
業務DX‧基幹システム開発
住信SBIネット銀⾏∕⽇本航空
⼤和証券
ダイキン⼯業
⼤⼿ヘルスケア企業
JT(⽇本たばこ産業)
タイミー
FLEET PITLOCK
⽇本⽡斯
JALマイレージバンクアプリ
マインドフルネス実践アプリbeSelf
資産プラットフォーム『D-Port』
スキマバイト、スポットワーク
物流関連システム
クラウド型メンタルヘルス管理システム
⾃動⾞整備プラットフォーム
基幹システムの機能開発
© 2026 Sun * In c . | 株式会社 Sun As te r is k (証券コード:4053)
24
4
トピックス
Topics Related to Growth Strategy & Sustainability
「DesignSync.AI」提供開始|既存Webサイトからデザインシステムを⾃動⽣成
URL⼊⼒だけで、既存サイトのデザインルールを解析‧構造化し、再利⽤可能な資産へ(2026年8⽉4⽇提供開始)
既存サイトのデザインルールをAIが解析し、
再利⽤可能なデザイン資産として構造化
自動抽出:カラー・タイポグラフィ・コンポーネント等を解析・構造化
品質チェック:WCAG準拠状況やブランドルールとの乖離を可視化
そのまま活用:Figma・コード連携へ展開予定
導⼊メリット
棚卸し⼯数を
最⼤90%削減※
数分でデザイン
資産化
設計から実装ま
で⼀貫⽀援
既存サイトの画⾯‧デザ
URL⼊⼒から解析‧構造
Sun*のAI-Ready SDLCと
イン要素を⾃動解析し、
化‧プレビューまでを短
連携し、デザインシステ
⼿作業による棚卸し‧整
時間で実⾏
ムの構築から実装‧運⽤
理⼯数を⼤幅に削減
まで⽀援
※当社検証条件に基づく
提供フロー(5ステップ)
01 URL⼊⼒
02 構造解析‧ページ選択
03 デザイン要素をAI抽出
04 デザインシステムを⾃動⽣成
05 Figma∕コード連携
対象サイトのURLを⼊⼒するだけで、サ
サイト構造を可視化し、解析対象ペー
カラー‧タイポグラフィ‧コンポーネン
抽出結果を、すぐに確認‧再利⽤できる形でプレ
Figma Pluginやコード連携を通じて、
イト全体を⾃動読み込み
ジを選択
ト等を解析‧構造化
ビュー
制作‧開発⼯程へ接続
出典:Sun* プレスリリース「Sun*、企業に蓄積するデザインを⾃動で資産化する『DesignSync.AI』ソリューションを提供開始」(2026年8⽉4⽇)∕画像は同リリース掲載
© 2026 Sun * In c . | 株式会社 Sun As te r is k (証券コード:4053)
26
Topics Related to Growth Strategy & Sustainability
「Regen*」提供開始|独⾃のAIエージェントエンジンを活⽤したモダナイズソリューション
コード⽣成と同時に脆弱性を分析する「⾃動セキュリティ検証」を標準実装。エンタープライズ品質の安全性を担保(2026年6⽉30⽇提供開始)
AIと⼈で進める4つの移⾏⼯程
AIが移⾏作業を⾼速化
AI⾃動化
AI⾃動化
AI⾃動化
レガシーシステムの仕様をAIが復元し、
品質を担保しながら段階的にモダナイズ
仕様の復元:ソースコードから仕様書を⾃動⽣成‧可視化
品質の担保:テスト⾃動⽣成で新旧システムの挙動⼀致を検証
段階的移⾏:審査ゲート付き3フェーズで、いつでも引き返し可能
AIが移⾏作業を⾼速化し、⼈のレビューとゲート判定で品質を担保
基盤技術|Sun*Takumi 22の専⾨AIエージェントが⾃律協調
導⼊メリット
ブラックボックス
化を解消
移⾏速度を
最⼤約3倍※
刷新リスクを
最⼩化
01
仕様の復元
02
コード再構成
03
パリティテスト
04
⼈による最終判断
ソースコードと実⾏挙動か
単なる構⽂変換ではなく、
新旧で同じ業務結果にな
シニアSEが品質ゲートで
ら、業務仕様‧例外処理‧
責務分離‧API化‧テスト
るかを確認し、差分をマ
判断し、進める‧⽌める‧
暗黙知を可視化。
可能性を含めて再構成。
ージ前に検出。
戻すを決定。
※ ローリング‧リニューアル後半の移⾏速度(プロジェクト初期⽐)。当社検証条件に基づく
出典:Sun* プレスリリース「Sun*、独⾃のAIエージェントエンジンを活⽤したモダナイズソリューション『Regen*』を提供開始」(2026年6⽉30⽇)∕画像は同リリース掲載
© 2026 Sun * In c . | 株式会社 Sun As te r is k (証券コード:4053)
27
Topics Related to Growth Strategy & Sustainability
NEWh、起案者の問いと企業の戦略から⽣成AIを動かす新規事業開発OS「CI-OS(シーアイオーエス)」を発表
起案者の問いと企業の戦略から⽣成AIを動かす Corporate Innovation OS。有償PoCプログラムの参加企業募集を開始(2026年7⽉14⽇発表)
⽣成AIの出⼒を結論にせず、
社内外の知⾒‧資産から固有解をつくる
課題:⽣成AIで資料作成‧アイデア出しは速くなった⼀⽅、「なぜ⾃社がやるの
か」「どの前提が弱いのか」が⾒えにくい。もっともらしい答えが増えても、判
断の道筋と学びが組織に残らなければ事業として前に進まない
提供元
株式会社NEWh(代表取締役社⻑神⾕憲司)
位置づけ
Corporate Innovation OS(新規事業開発OS)
対象
現在の状況
主に⼤企業の新規事業開発部⾨‧事業開発プログラム
有償PoCプログラムの参加企業を募集中
CI-OS 4つの原則
① ⼈の意思から、AIを動かす
② 答えを出すより、問いを深くする
③ 知⾒と資産から、固有解をつくる
④ 個⼈の試⾏錯誤を、組織の⼒へ
起案者が問いを⽴て、材料を読み、仮説をつくり
、採⽤‧除外を決める。⼈の意思を先に⼊⼒して
から⽣成AI⽀援へ進む
⽣成AIを結論への近道にせず、各フェーズで問い
返し‧反論‧別案‧未確定論点を返す
社内資料や過去判断を戦略テーマ‧組織資源‧判
断基準として意味づけ、勝ち筋の仮説と検証論点
を組み⽴てる
検討や評価をプロジェクト内で終わらせず、次の
プロジェクトや起案者育成に活かせる知⾒として
蓄積する
出典:Sun* プレスリリース「NEWh、起案者の問いと企業の戦略から⽣成AIを動かす新規事業開発OS『CI-OS』を発表」(2026年7⽉14⽇)
© 2026 Sun * In c . | 株式会社 Sun As te r is k (証券コード:4053)
28
Topics Related to Growth Strategy & Sustainability
注⽬のα‧Z世代ナンバーワンアーティスト「PG」が公式ファンクラブサイト「PG CLASS」を開設
エイベックス‧マネジメントが⼿掛けるヴォーカル&ダンスカンパニー「PG」の公式ファンクラブサイトの開発‧運営をSun*が提供(2026年7⽉21⽇公表)
トップアーティストのファンコミュニティ
運営で培った知⾒を、
次世代アーティストへ展開
サイト名
「PG」の注⽬度
SNS 総フォロワー数
TikTok 総再⽣数
メンバー構成
活動開始からデビューまで
77万⼈超
3億回超
14⼈ ∕平均13歳
4カ⽉ の異例のスピード
※ フォロワー数‧再⽣数はプレスリリース公表時点(2026年7⽉21⽇)の数値。2024年7⽉ TikTokで活動開始、同年11⽉デビュー
公式ファンクラブサイト「PG CLASS」
アーティスト
PG(ピージー)∕エイベックス‧マネジメントが⼿掛け
るヴォーカル&ダンスカンパニー
提供システム
Sun*が独⾃開発したファンコミュニティシステム
「ALLLY」
導⼊実績
浜崎あゆみ、倖⽥來未などトップアーティスト
現在の状況
ファンクラブ「準備室」として無料会員を募集中
今後の展開
今秋にファンクラブアプリのリリースを予定。
ファンコミュニティ限定機能を順次追加していく
ファンコミュニティシステム「ALLLY」
アーティストとファン同⼠の交流機能をOEMで提供。プラットフォーム内でのトレンドマーケティ
ングや攻撃的なコメントの規制により、本来のファンへ充実した価値を届ける
有料コンテンツの収益を、アーティストサイドとSun*でシェアする協業事業モデル
出典:Sun* プレスリリース「注⽬のα‧Z世代ナンバーワンアーティスト『PG』が公式ファンクラブサイト『PG CLASS』を開設」(2026年7⽉21⽇)∕画像は同リリース掲載
© 2026 Sun * In c . | 株式会社 Sun As te r is k (証券コード:4053)
29
5
Appendix
Macro View
マクロ視点
⽇本企業のAI活⽤は、組織的な取り組みと効果の最⼤化が課題
総務省調査では、⽇本は他国に⽐べAI活⽤の全社展開や業務変⾰、データ活⽤に遅れ
0%
20%
40%
※1
60%
80%
21.5
⽇本
39.9
24.5
35.6
⽶国
62.7
57.2
40.9
中国
71.7
73.0
全社横断的に事業変⾰や
業務プロセスの⾒直し‧必要なスキル‧ノウハウ
⽣成AIに社内データを学習させたり
イノベーションに取り組んでいる企業
を学べる環境がある企業
⽣成AIが参照可能なデータベースを構築している企業
※1 令和8年版情報通信⽩書 (概要)より抜粋 https://www.soumu.go.jp/main_content/001082851.pdf
© 2026 Sun * In c . | 株式会社 Sun As te r is k (証券コード:4053)
31
Sun*’s Position and Value Proposition
Sun*のポジションと提供価値
SunのAI活⽤基盤は、事業成果の創出に貢献
Sunは、事業成果に必要なAIを⾒極め、構想‧実装‧運⽤‧改善まで⼀気通貫で⽀援する
Sun*のAI活⽤基盤
構想
実装
BTCの専⾨⼈材
⽇本‧ベトナムの開発⼒
R&D組織
運用
改善
実案件による運⽤‧改善サイクル
MoMorph‧Takumi‧Regen*などのAIプロダクト群
L&Dの⼈材育成スキーム
Sun*および⽀援企業の事業成果へ貢献
事業成⻑
収益性向上
顧客価値向上
●
新たな商品‧サービスの⽴ち上げ
●
開発‧業務⼯数の削減
●
顧客体験‧利⽤率の向上
●
既存事業の⾼度化
●
品質低下や⼿戻りの抑制
●
継続率‧LTVの改善
●
顧客単価‧市場機会の拡⼤
●
⼈員増に依存しない利益成⻑
●
顧客課題への提供価値の⾼度化
© 2026 Sun * In c . | 株式会社 Sun As te r is k (証券コード:4053)
32
Profit Growth
利益成⻑への転換
AI戦略を、持続的な利益成⻑へ
AI活⽤‧採算管理‧⼈材配置の3つのレバーで、⼤型案件の成⻑を利益へ転換
01|AI駆動開発を拡⼤
02|AIで社内プロセス‧採算を改善
03|AIで配置を最適化
顧客売上を伸ばす
案件採算を改善する
リソース⽣産性を⾼める
AI駆動開発で顧客価値を創出し、
⼤型案件を、⾒積‧契約‧実⾏まで
稼働‧スキル‧案件需要を可視化し、
顧客内の追加テーマ‧複数案件へ展開
採算を⼀貫管理
⼈材と外注リソースを最適配置
独⾃AI開発ツールを主要顧客の案件へ展開
AIで⾒積精度向上‧採算リスクを早期検知
AIで稼働‧スキル‧需要を可視化し最適配置
P/Lへの効果
売上総利益額の拡⼤
P/Lへの効果
案件粗利率の改善‧安定
P/Lへの効果
⼈員‧外注コスト効率の改善
© 2026 Sun * In c . | 株式会社 Sun As te r is k (証券コード:4053)
33
Sun*’s Value Creation Cycle
Sun*の価値創造サイクル
⼈の資本がAIによる価値創造を最⼤化する
⼈の専⾨性と経験をAIに蓄積‧再利⽤することで、知的資産は複利的に増えていく
「⼈」の資本
×
学習‧蓄積の仕組み
評価する
⼈的資本
2
BTC⼈材
専⾨性/連動性/協働⼒
新領域に対する学習⼒
3
×
4
1
使う
学習ループ
再利⽤可能なAI資産
AIによる知的資産
AIプロダクト群
蓄積する
業務特化AIエージェント
評価モデル‧品質基準
顧客理解モデル
R&D組織
改善する
価値提供対象と領域の拡⼤‧AI時代の新たな企業資産の創出
© 2026 Sun * In c. | 株式会社 Sun As te r is k (証券コード:4053)
34
Learning & Knowledge Building
学習ループ
BTC⼈材
R&D組織
AIによる知的資産
学習し蓄積するための仕組み
① ⼈的資本とAI知的資産を相互に⾼める学習ループ
⼈の学びをAIに蓄積し、AIの知⾒を再び⼈へ還元。⼈的資本と知的資産が相互に増幅する成⻑循環を構築
R&D
最先端技術のリサーチを
⾏う研究開発ユニット
AIプロダクト‧
ソリューション
技術
プロダクト開発
開発⼯程における
AIソリューションを
⼀気通貫で開発‧運⽤
研究開発
⼈材‧知⾒の還元
実案件
フィードバック
AI SDLC
クライアント課題に向き合い
価値提供を⾏う部⾨
⼈材‧学習ニーズの提供
知⾒‧データの蓄積‧還元
相互連携
事業部(CEV)
学習カリキュラム提供
エンジニア⼈材のリスキリング
データフィードバック
Learning & Development(L&D)
AIを使いこなす⼈材を、内製で育て続ける仕組み(年間150名育成)
⼈がAIから学ぶ
AIが⼈から学ぶ
両⽅が強くなる
© 2026 Sun * In c. | 株式会社 Sun As te r is k (証券コード:4053)
35
AI-Enhanced Expertise
学習ループ
BTC⼈材
R&D組織
AIによる知的資産
AIによる専⾨性の拡張
② AIが、BTCの専⾨性を進化させる
⼈の専⾨性にAIを掛け合わせ、横断‧共創‧拡張を促進する
アップデートされた職種‧役割
横断する
Business
専⾨性の壁を超えてつなぐ
ビジネスの専⾨性
Tech
テクノロジーの専⾨性
共創型
プロダクト⼈材
AIによる接続‧増幅
AIが専⾨性同⼠をつなぎ、
知⾒‧発想‧スキルを増幅する
拡張する
Creative
知⾒‧スキルをさらに広げる
共創する
掛け合わせて新たな価値を⽣む
クリエイティブの専⾨性
専⾨性の進化
課題解決型
エンジニア
ビジネス×
テクノロジー⼈材
価値創造領域の拡⼤
より⼤きな課題に挑み、持続的な価値創出を実現
© 2026 Sun * In c. | 株式会社 Sun As te r is k (証券コード:4053)
36
Sun*'s Human Capital
学習ループ
BTC⼈材
R&D組織
AIによる知的資産
Sun*の⼈的資本
③ 次の事業価値を⽣み出す知⾒と技術を蓄積する
全⼈材の約3%をR&Dに配置し、⼈材‧技術‧実装を循環させながら次の競争優位を⽣む
社会実装と先端研究をつなぎ、
次の競争優位を育てるR&D
3つの機能が連携‧循環することで、実践知と先端知を
組織の技術資産へ転換し、持続的な競争優位を創出します。
R&Dの3つの柱
1
⼈材
2
技術
3
実践
AI活⽤⼈材の育成
全社ITリテラシーの底上げと
専⾨⼈材の育成‧強化
AIプロダクト‧基盤の開発
共通基盤‧プロダクト‧開発アセット
として蓄積‧強化
実ワークフローへのAI適⽤
顧客‧社内業務に適⽤し
効果検証と改善を継続
R&Dの実績‧アセット
40+名
4基盤
メンバー
プラットフォーム
多様な専⾨性を持つ
50+の社内向け
R&D⼈材
サービス‧基盤
40本
50+件
国際カンファレンスでの
論⽂採択‧発表
⼤⼩さまざまな規模の
クライアント案件に対応
研究成果をグローバルに発信
幅広い業界‧テーマで実績
⼈材を育て、技術を創り、現場で活かす。その循環が、AI-Readyの組織を構築
© 2026 Sun * In c. | 株式会社 Sun As te r is k (証券コード:4053)
37
AI-Enhanced Human Capital
学習ループ
BTC⼈材
R&D組織
AIによる知的資産
AIと共に進化する⼈的資本
④ AIと共に学習する⼈に向けたプロダクトを内製
Who(AIと共に学習する⼈)‧Why(判断‧意図‧試⾏錯誤の履歴)‧What(プロダクト開発)の3層で、組織の⼒を構造的に強化
WHO
AIと共に学習する⼈(⼈的資本)
AIに集まった情報と意思決定ログから学び、問い、決め、担う⼈材が
Sun*のエコシステムの中⼼
学習
フィードバック
WHY
判断‧意図‧
試⾏錯誤の履歴
WHAT
プロダクト開発
AI*deation
Ailla
Sun*Takumi
AI活⽤基盤
事業のアイデアや
仮説を構造化して整理
情報や意⾒を整理し
本質的な問いを深掘り
「なぜそう決めたか」の
記録と学びの蓄積
運⽤の気づきを
次の事業戦略へ還元
⽂脈の蓄積
展開
MoMorph
AI SDLC
QA E2E
Regen*
デザインとコードの
整合性を保ち連動
テスト‧検証プロセスを
⾃律的に実⾏
品質を継続的に検証し
信頼性を担保
既存コードから仕様を復元し
改善サイクルを加速
© 2026 Sun * In c. | 株式会社 Sun As te r is k (証券コード:4053)
38
AI Product Roadmap
AIプロダクト展開ロードマップ
内製AIプロダクトを順次展開予定
モダナイズ‧デザイン‧データの3領域へ、AIプロダクトを順次展開
2026.6.30
2026.8.4
2026年予定
LAUNCHED
LAUNCHED
PLANNED
Regen*
DesignSync.AI
既存システムを可視化し、
モダナイズを加速
デザイン資産を構造化し、
開発へ接続
データ統合AI基盤
同時翻訳‧⽂字起こし
開発ナレッジのデータ化
実案件で磨き、機能を拡張し、継続的な収益貢献を⽬指す
© 2026 Sun * In c. | 株式会社 Sun As te r is k (証券コード:4053)
39
About Sun*
会社概要
経営陣
会社情報
設⽴
従業員数(1)
2013年
2,060⼈
Sun Asterisk : 500
Sun Asterisk Vietnam :1,222
Sun Asterisk Software Development:
35
Sun terras: 132
NEWh:
26
Trys:
60
GlobalGear:
49
MIXENSE:
36
(1) 2026年3⽉末実績(有期雇⽤等含む)
(2) 2025年12⽉期実績
(3) EBITDA:営業利益+減価償却費+のれん償却費等
(4) 2016年2⽉期から2025年12⽉期の年平均成⻑率
財務指標(2025年12⽉期実績)
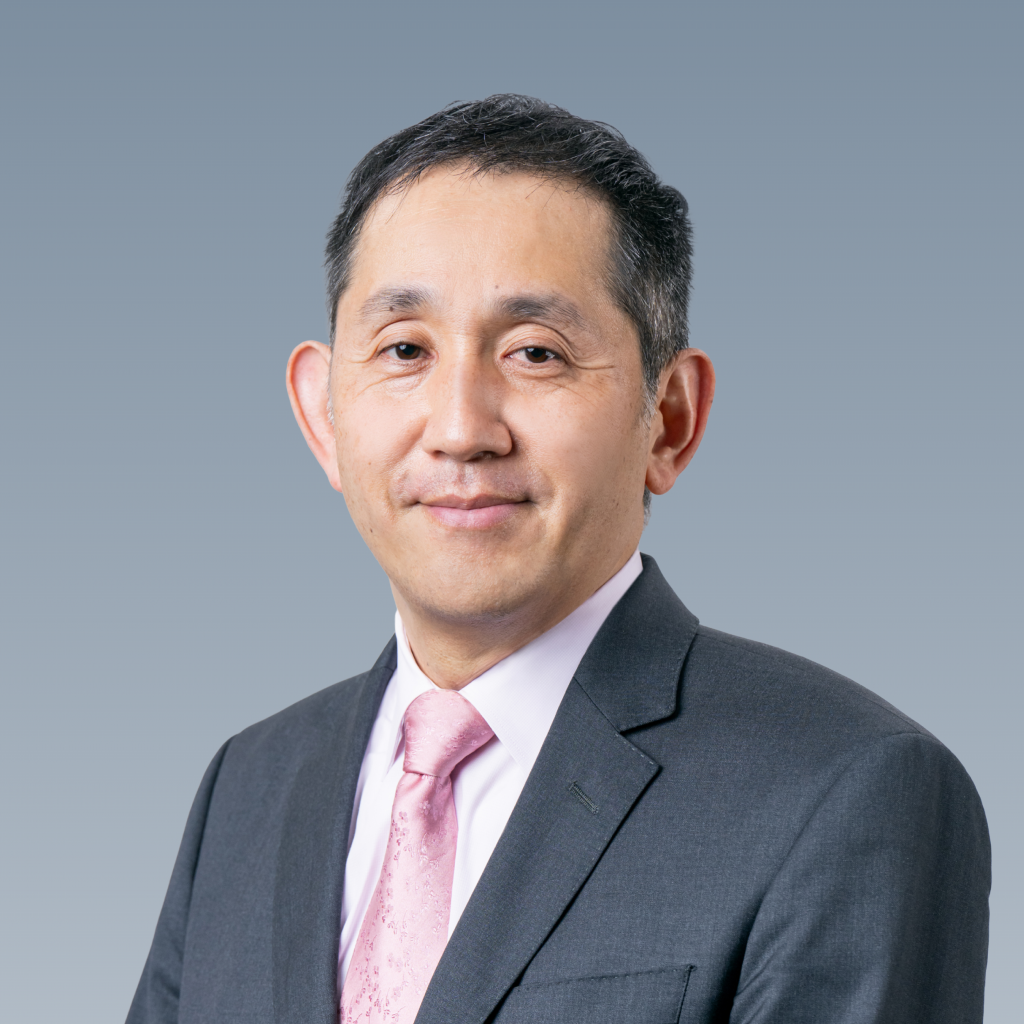
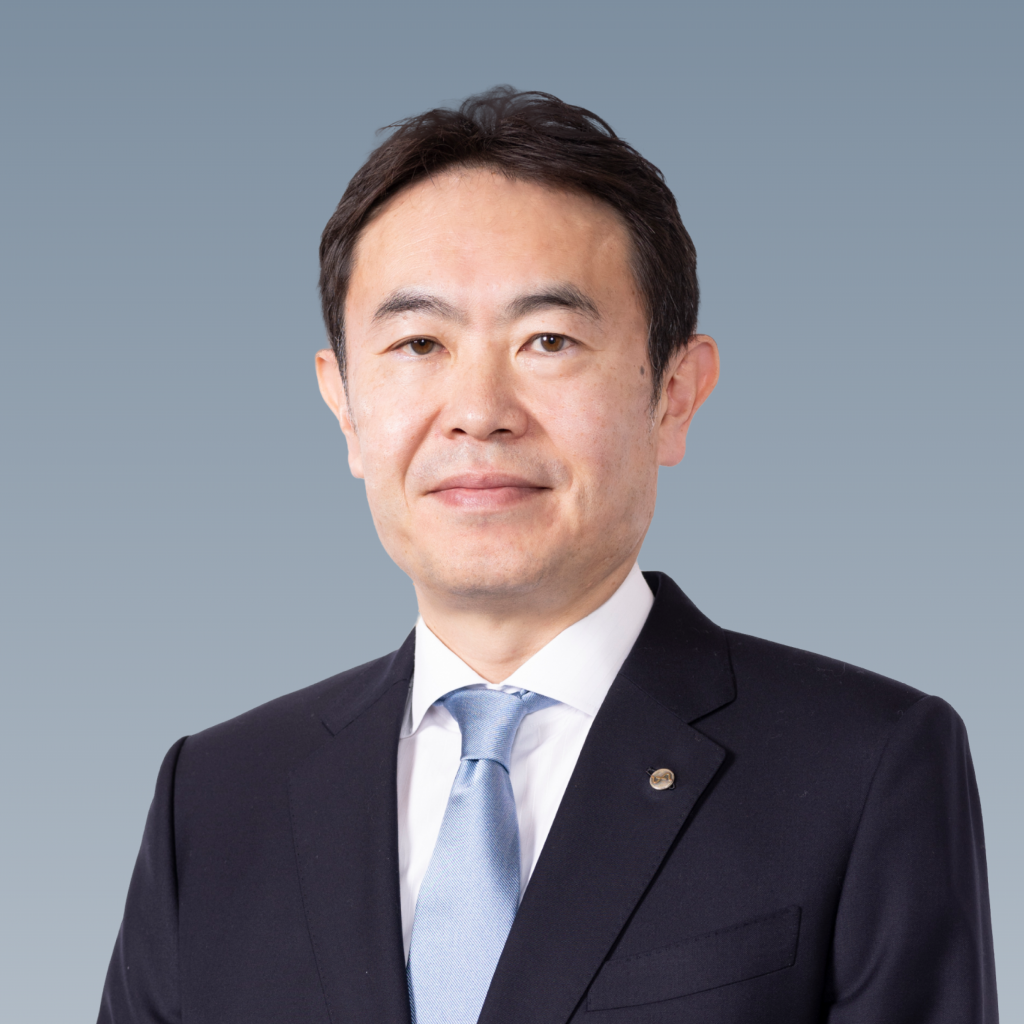
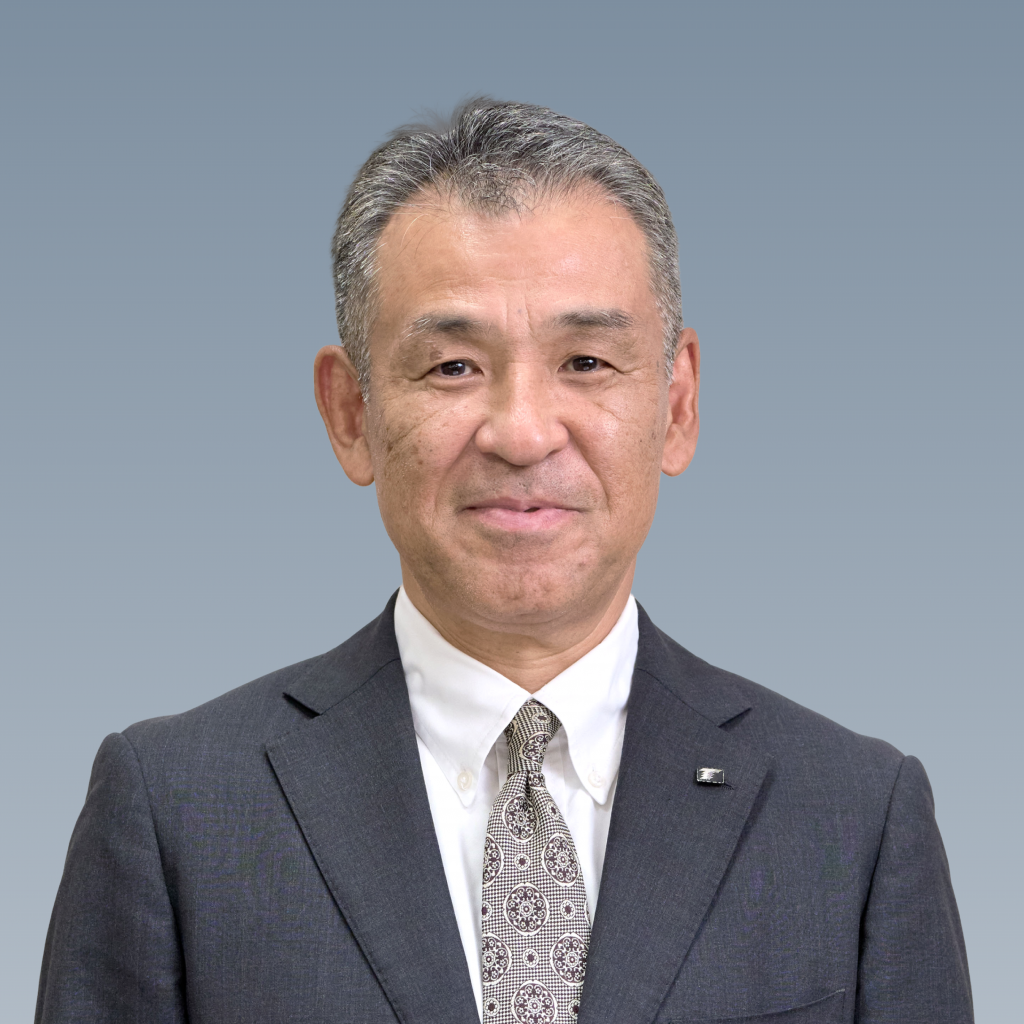
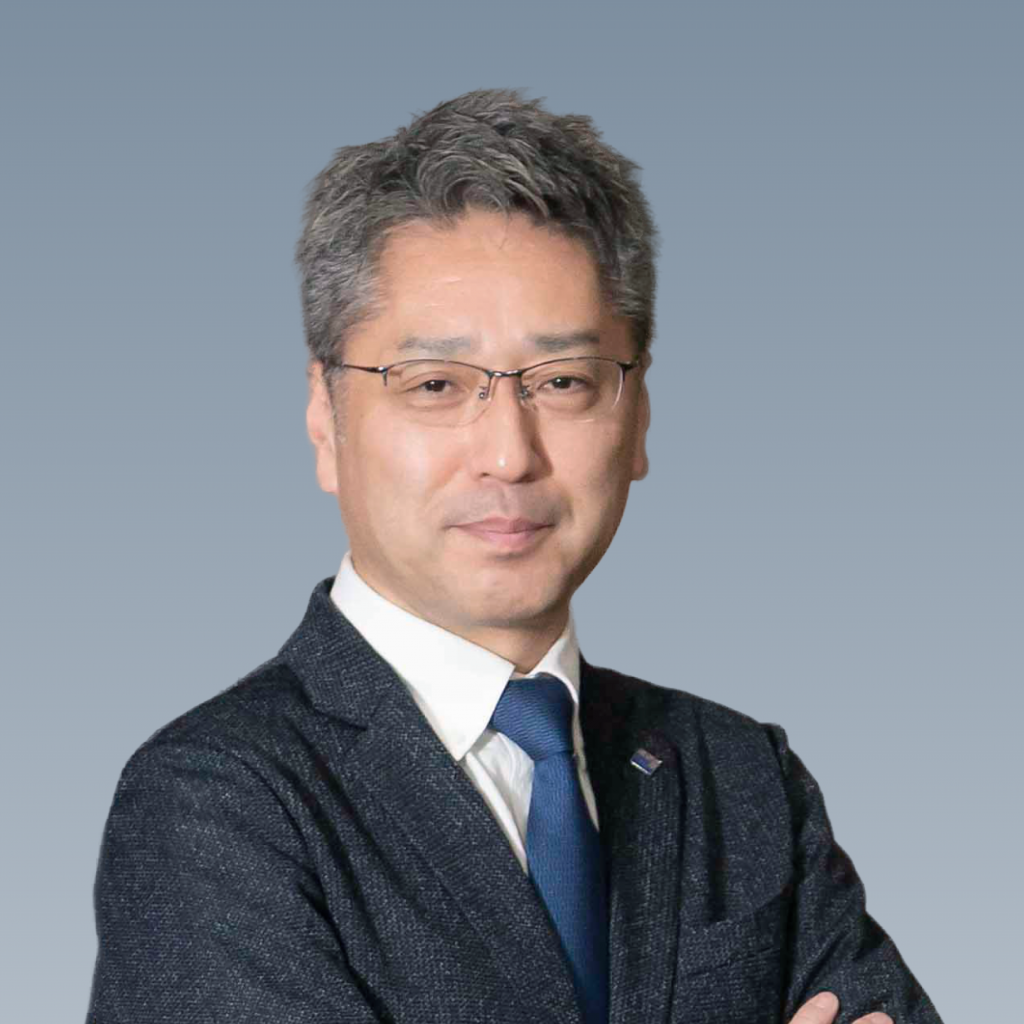
代表取締役CEO
⼩林泰平
取締役
服部裕輔
取締役
平井誠⼈
取締役(常勤監査等委員)
⼆本柳健
社外取締役(監査等委員)
⼩澤稔弘
社外取締役(監査等委員)
⽯井絵梨⼦
社外取締役
⽯渡万希⼦
その他指標
売上⾼(2)
148.3億円
ユニーク顧客数(5)
285社
営業利益(2)
10.5億円
⽉額平均顧客単価(6)
506万円
EBITDA (2)(3)
12.6億円
⽉次平均取引継続率(7)
92.6%
売上⾼CAGR (4)
32.9%
(5)2025年12⽉期内において取引を⾏った顧客の実数
(6)2025年12⽉期の総売上⾼÷同期間の延べ取引顧客数
(7)100%-(当⽉の解約顧客数÷前⽉の取引顧客数)、2020年1⽉から2025年12⽉までの72ヶ⽉間の平均値
© 2026 Sun * In c . | 株式会社 Sun As te r is k (証券コード:4053)
40
FY2026 Forecast
2026年度通期業績予想
⽇本基準とIFRSのいずれも売上⾼182.0億円を計画
営業利益は⽇本基準では14.6億円、IFRSでは営業利益17.1億円を計画
単位:百万円
⽇本基準
⽇本基準
IFRS
2025年度
実績
2026年度
業績予想
2026年度
業績予想
増減率
売上⾼
14,835
18,201
+22.7%
売上収益
18,201
売上総利益
7,189
9,113
+26.8%
売上総利益
9,113
売上総利益率
48.5%
50.1%
-
売上総利益率
50.1%
EBITDA(1)
1,262
1,849
+46.5%
EBITDA (2)
1,849
営業利益
1,052
1,469
+39.6%
営業利益
1,714
営業利益率
7.1%
8.1%
-
営業利益率
9.4%
経常利益
998
1,655
+65.8%
税引前利益
1,900
当期純利益
476
1,144
+140.2%
当期利益
1,389
0.00570円
0.00590円
期中平均為替レート
(1ベトナムドン)
0.00590円
(1)営業利益+減価償却費+のれん償却費等
(2)営業利益+減価償却費
© 2026 Sun * In c. | 株式会社 Sun As te r is k (証券コード:4053)
41
Voluntary Adoption of IFRS
IFRS(国際会計基準)の任意適⽤
任意適⽤の⽬的
資本市場における財務情報の国際的な⽐較可能性の向上
主な変更点
項⽬
のれん償却
有償ストック
オプション費⽤
⽇本基準
変更内容
IFRS
影響⾦額
2026年度通期業績予想
IFRS 対⽇本基準
• 15年以内で償却
• 償却せず
• 毎年減損テストを実施
• 移⾏⽇時点ののれん評価額
を引き継ぎ、以降は⾮償却
とする
• 販売管理費:▲145百万円
• 営業利益:+145百万円
• ⼀定の費⽤が発⽣
• 設定条件によって費⽤が発⽣
しない
‧当社の有償ストックオプシ
ョンの設定条件を前提とす
ると費⽤が発⽣しない
• 販売管理費:▲100百万円
• 営業利益:+100百万円
IFRSの任意適⽤に伴う開⽰スケジュール(予定)
決算期
2025年12⽉期
期末
開⽰資料
適⽤会計基準
決算短信、有価証券報告書、連結計算書類
⽇本基準
第1〜3四半期
四半期決算短信、半期報告書
期末
決算短信、有価証券報告書、連結計算書類
2026年12⽉期
IFRS
© 2026 Sun * In c . | 株式会社 Sun As te r is k (証券コード:4053)
42
Sales, Operating Profit, and Ordinary Profit
売上⾼‧営業利益‧経常利益の推移
2025年度以前の実績および2026年度予想は、いずれも⽇本基準
■クリエイティブ&エンジニアリング
■タレントプラットフォーム
■インキュベーション
売上⾼
(1)
(2)
(3)
通期業績予想
単位:億円
182.0
180
19.3
160
140
125.1
120
107.4
100
80.3
80
60
45.2
40
13.3
20
31.8
53.6
3.4
11.9
10.3
64.9
15.6
135.6
12.7
11.8
19.8
148.3
14.6
25.2
営業利益
経常利益
単位:億円
単位:億円
25
25
20
20
21.3
通期業績予想
通期業績予想
15
16.7
15
14.6
137.4
77.1
95.6
104.0
10
112.2
5
2018年
2018年
2019年
2020年
2021年
2022年
2023年
2024年
2025年
2026年
2⽉期
12⽉期
12⽉期
12⽉期
12⽉期
12⽉期
12⽉期
12⽉期
12⽉期
12⽉期
10ヶ⽉決算
15.7
14.6
14.4
10.5
9.0
43.2
0
10
17.7
14.1
22.7
0
14.5
11.4
5
16.5
9.9
0
2021年 2022年 2023年 2024年 2025年 2026年
2021年 2022年 2023年 2024年 2025年 2026年
12⽉期
12⽉期
12⽉期
12⽉期
12⽉期
12⽉期
12⽉期
12⽉期
12⽉期
12⽉期
12⽉期
12⽉期
(1)2018年12⽉期は、決算期変更により10カ⽉決算になっております。
(2)売上⾼の推移について、2018年2⽉期以前は単体、2018年12⽉期以降は連結での売上⾼を記載しております
(3)2018年12⽉にグルーブ‧ギア株式会社(現株式会社Sun terras)の株式を取得し、⼦会社化しております。2019年12⽉期連結決算においては同社の通期業績が寄与しております。
内部取引考慮前の2019年12⽉期の同社売上⾼は1,144百万円、当期純利益は60百万円となります。
2018年2⽉期以前の数値については、監査法⼈による監査を受けておりません。
© 2026 Sun * In c. | 株式会社 Sun As te r is k (証券コード:4053)
43
Overview of Shareholder Returns
株主還元の概要
配当⽅針の概要
配当⽅針
基準⽇
健全な財務体質を維持できるよう、経営成績および財
務状況等を総合的に判断したうえで、継続的に実施し
ていくことを基本⽅針とする
2026年12⽉31⽇
株主優待制度の概要
制度
(株)ウィルズが提供するポイント型の株主優待
サービスである「プレミアム優待倶楽部」
対象
12⽉末の当社株主名簿に記録された600株以上保有の株主
利回り
総合(優待+配当)利回りは最⼤9.13%
(2026年5⽉12⽇終値438円を基準に算出)
拡充の内容 1年以上継続保有の株主様を対象として優待ポイントを追加
1株当たり配当⾦
10円
(期末)
詳細
次ページで説明
© 2026 Sun * In c . | 株式会社 Sun As te r is k (証券コード:4053)
44
Shareholder Benefits and Total Yield
株主優待制度および総合利回り
保有株式数に応じた総合利回り*
Sun Asterisk 優待倶楽部の詳細
サイト名称
サイトURL
Sun Asterisk優待倶楽部
https://sun-asterisk.premium-yutaiclub.jp/
保有する株式数に応じて株主優待ポイントを
付与。ポイントは下記と交換可能
優待内容
贈呈時期
対象株主
• 特設サイト「Sun Asterisk優待倶楽部」掲載商品
• 「プレミアム優待倶楽部」における共通株主優待
コイン『WILLS Coin』
保有株式数
1年未満株主
優待ポイント
1年以上株主
追加優待ポイント
1年未満株主
総合利回り
1年以上株主
総合利回り
600株未満
0ポイント
0ポイント
2.28%
2.28%
600〜899株
5,000ポイント
1,000ポイント
3.55%〜4.19%
3.81%〜4.57%
900〜999株
10,000ポイント
2,000ポイント
4.57%〜4.82%
5.03%〜5.33%
1,000〜1,999株
15,000ポイント
3,000ポイント
4.00%〜5.71%
4.34%〜6.39%
2,000〜2,999株
40,000ポイント
5,000ポイント
5.33%〜6.85%
5.71%〜7.42%
3,000〜3,999株
80,000ポイント
5,000ポイント
6.85%〜8.37%
7.14%〜8.75%
4,000株以上
80,000ポイント
40,000ポイント
〜6.85%
〜9.13%
毎年3⽉
毎年12⽉末の当社株主名簿に記載された
6単元(600株以上)保有の株主
*2026年5⽉12⽇終値438円を基準に算出
© 2026 Sun * In c . | 株式会社 Sun As te r is k (証券コード:4053)
45
Overview of Group Companies
グループ会社の概要
会社名
資本⾦
議決権⽐率
事業内容
Sun Asterisk Vietnam Co., Ltd.
55千USD
100%
当社創業の地であり、ハノイ⼯科⼤学等と提携することで、多数の優秀なエンジ
Sun terras
10百万円
100%
国内においてIT⼈材の育成‧紹介‧派遣の事業を展開。2024年2⽉にGROOVE
NEWh
10百万円
100%
⼤企業の新事業‧サービス開発に特化したイノベーションデザイン&スタジオ。
Trys
100百万円
100%
ゲーム開発全般をはじめ、イラストやマンガ制作、動画制作の事業を展開
Sun Asterisk
Software Development Inc.
900千PHP
グローバルギア
100百万円
MIXENSE
99.9%
ニアを有するベトナム開発拠点
GEARから社名変更
2021年1⽉に設⽴
元々当社が2015年に設⽴したフィリピンの開発拠点であり、2019年に⼀度独⽴
したが、2024年5⽉に⼦会社化。開発⽀援のみならず、IT‧プログラミング教育
事業も運営
10百万円
100%
100%
「『楽しい!』を気軽に、すべての⼈へ」というビジョンのもと、スマートフォ
ン向けゲームアプリを企画‧開発‧運営。2025年7⽉に⼦会社化
「お客様⾃⾝のビジネスに集中できる環境を提供する」を掲げ、業務系システム
開発及び制御系システム開発等、様々な分野において、顧客のニーズに応じた各
種システム開発を展開。2026年1⽉に⼦会社化
© 2026 Sun * In c . | 株式会社 Sun As te r is k (証券コード:4053)
46
Sustainability Initiatives
サステナビリティへの取り組み
10のマテリアリティを特定し、5つのカテゴリに分類
カテゴリ
マテリアリティ項⽬
ESG
理し、Sun*が事業活動を通じて⻑期的に価値創造していく基盤となる
あらゆる産業のDX推進
DX‧事業共創
これまで感覚的に進めていたサステナビリティ推進活動を体系的に整
マテリアリティ(重要課題)を⾃社視点‧ステークホルダー視点で分
析して評価‧決定
様々なパートナーとのバリューチェーンの発展
顧客体験・サービス品質の向上
Social
価値創造⼈材・チームの発掘・育成‧活躍促進
⼈材‧チーム
コミュニティ
ダイバーシティ&インクルージョン推進
地域社会や各種コミュニティへの貢献
コーポレート・ガバナンス‧リスクマネジメントの⾼度化
コーポレート‧
ガバナンス
企業倫理・コンプライアンス・腐敗防⽌の徹底
Governance
プライバシーと情報セキュリティ管理の徹底
環境
気候変動や環境汚染等の地球環境問題解決への貢献
詳細はサステナビリティ
サイトにて公開開始!
Environment
https://sun-asterisk.com/sustainability
© 2026 Sun * In c . | 株式会社 Sun As te r is k (証券コード:4053)
47
ビジョン
誰もが価値創造に夢中になれる世界
Create a world where everyone has the freedom
to make awesome things that matter.
Sun*は世界平和を⽬指します。
世界を⾒渡せば、SDGsで語られるような⼤きな社会課題から、⾝の回りの⼩さな⽣活の課題まで様々な課題があふ
Vision
れています。
ぼくらはそういった課題解決に、デジタルテクノロジーとクリエイティブで挑んでいきます。
そして課題解決の先の未来、⼈がそれぞれ思い描く価値を⾃由に創造できる世界の実現を⽬指します。
だれもが⼦供の頃のように、新たな価値を創造することにワクワクし、新しい朝を迎えるのが楽しみでしかたない状
態、それがぼくらにとっての世界平和です。
Sun*はそんな「誰もが価値創造に夢中になれる世界」を実現するためのインフラを構築していきます。
© 2026 Sun * In c. | 株式会社 Sun As te r is k (証券コード:4053)
48
本資料の取り扱いについて
• 当資料に記載された内容は、現時点において⼀般的に認識されている経済‧社会等の情勢および当社が合理
的と判断した⼀定の前提に基づいて作成されておりますが、経営環境の変化等の事由により、予告なしに変
更される可能性があります。
• 当社は、本資料の情報の正確性‧完全性について表明および保証するものではありません。
• それらリスクや不確実性には、⼀般的な業界ならびに市場の状況、⾦利、通貨為替変動といった⼀般的な国
内および国際的な経済状況が含まれます。
• 今後、新しい情報‧将来の出来事等があった場合であっても、当社は、本発表に含まれる「⾒通し情報」の
更新‧修正を⾏う義務を負うものではありません。
© 2026 Sun * In c . | 株式会社 Sun As te r is k (証券コード:4053)
49
Let’s make awesome things that matter.
© 2026 Sun * In c . | 株式会社 Sun As te r is k (証券コード:4053)