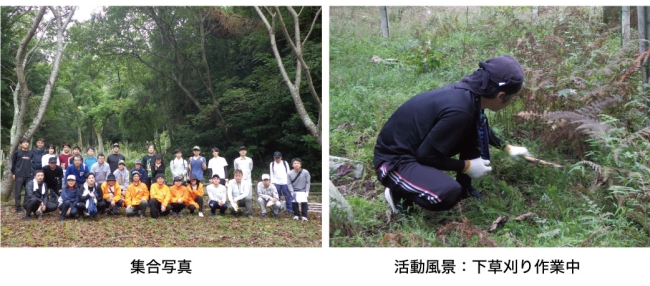
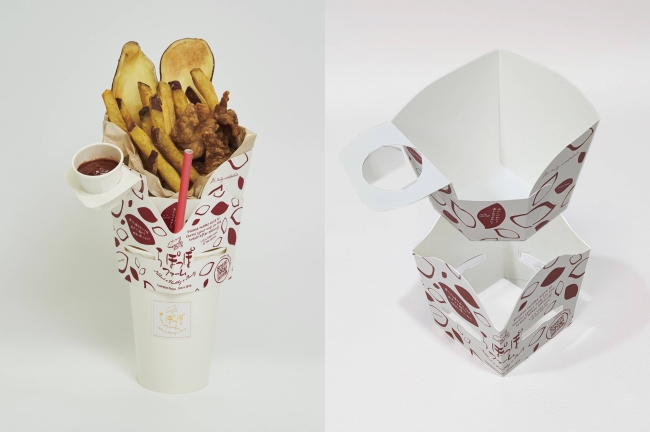
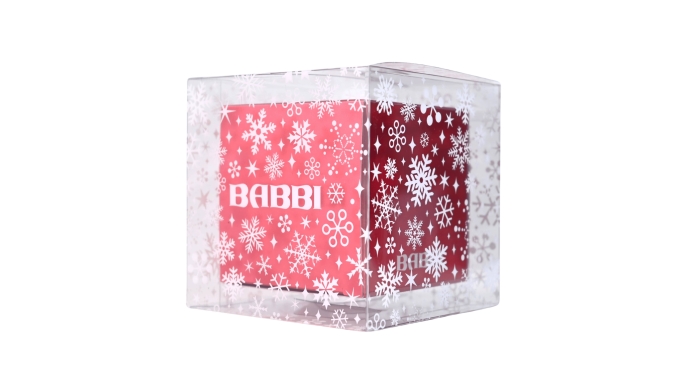
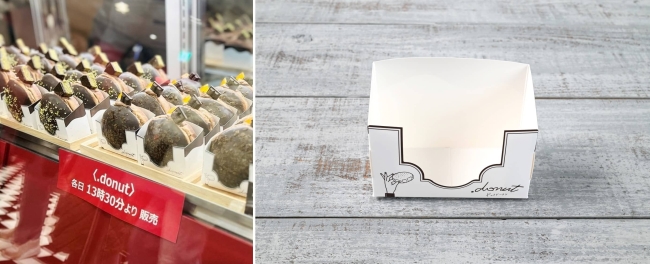
THE PACK CORPORATION Briefing Materials on Business Results for the Second Quarter of the Year Ending December 31, 2026 September 1, 2026 Contents 01 Business Results for the Second Quarter of the Year Ending December 31, 2026, and Full-year…
THE PACK CORPORATION
Briefing Materials on Business Results for
the Second Quarter of the Year Ending
December 31, 2026
September 1, 2026
Contents
01 Business Results for the Second Quarter of the Year Ending
December 31, 2026, and Full-year Forecasts
P. 3
02 Progress on Growth Strategies
P. 15
03 Initiatives to Increase Corporate Value
P. 27
04 Reference Materials
P. 32
Copyright© 2026 The Pack Corporation. All Rights Reserved.
2
01
Business Results for the Second Quarter of
the Year Ending December 31, 2026, and
Full-year Forecasts
Copyright© 2026 The Pack Corporation. All Rights Reserved.
3
- Business Results for the Second Quarter of the Year Ending December 31, 2026
Highlights
Business results were as planned due to sales growth in priority markets.
Business
environment
•
Anti-inflationary measures contributed to gentle economic recovery.
•
Steady trends in service consumption centered on recreational services
•
The uncertainty associated with conditions in the Middle East and concerns about inflation attributable
to ongoing yen devaluation are eroding consumer confidence.
(1) Business results for the second quarter of
the year ending December 31, 2026
✓
Securing sales and profit growth
by offsetting rising costs
(2) Growth strategy results
✓
Progress in proposing solutions
and cross-selling in priority
markets
➢ Net sales reached 50,134 million yen.
- Up 5.8% year on year
- Up 2.3% vs. plans
➢ Sales in the food products market
were 15.3 billion yen.
➢ Operating profit was 2,974 million yen.
- Up 3.9% year on year
- Down 0.9% vs. plans
➢ Sales in the e-commerce and
shipment packaging markets were
9.8 billion yen.
(3) Initiatives to increase corporate value
✓
Promoting various human capital,
shareholder returns, and ESG
measures
➢ Purchases of 500 million yen in
treasury shares
➢ Continuing investment in human
capital
➢ Promoting sustainable management
➢ Enhanced dialogue with
shareholders
Copyright© 2026 The Pack Corporation. All Rights Reserved.
4
- Business Results for the Second Quarter of the Year Ending December 31, 2026
Summary of Business Results
Business results trended as planned.
Second quarter of
year ended
December 31, 2025
(Million yen)
Net sales
Operating profit
Operating profit margin
Actual
Second quarter of
year ending
December 31, 2026
Actual
Review of second quarter
YoY change
Net sales
47,385
50,134
5.8%
2,863
2,974
3.9%
6.04%
5.93%
-
Ordinary profit
3,038
3,076
1.2%
Profit attributable to
owners of parent
2,428
2,038
-16.1%
Basic earnings per
share (yen)
43.09
36.70
-14.8%
Dividend per share
(yen)*
19.33
17.00
-
Operating
profit
✓ Sales grew in the priority
markets of food products,
e-commerce, and shipment
packaging.
✓ Profit increased due to higher
sales and expanded sales of
high-value-added products.
✓ Operating profit was up year on
year as we continued to make
human capital and capital
investments.
- We recorded gains on sales of
strategic shareholdings in the
previous fiscal year (490 million yen).
Shareholder
returns
✓ Purchased treasury shares
(500 million yen)
- Effective July 1, 2025, we implemented a 3-for-1 stock split for common shares.
The figure given for the dividend per share at the end of the second quarter of the fiscal year ended December 31, 2025, reflects the stock split.
Copyright© 2026 The Pack Corporation. All Rights Reserved.
5
- Business Results for the Second Quarter of the Year Ending December 31, 2026
Factors Underlying Changes in Operating Profit
Customer development efforts and efforts to promote cross-selling to address rising costs
led to higher profit.
Key underlying factors
Higher sales
680
Operating profit
in first half of year
ended December 31,
2025
2,863
■Higher raw material costs -140
■Higher manufacturing expenses -40
(labor costs etc.)
■Improved productivity etc. +20
(through machinery updates etc.)
Lower gross
profit margin
-160
-130
■Results of securing
new customers
+148
■Results of building on
existing customers
+532
- Calculated using ratios of
composition of the increase in
sales
2,974
Higher logistics
costs
-98
The primary factors leading to higher sales
were approx. 1.1 billion yen in orders from
new customers and efforts to promote
cross-selling to existing customers.
✓
The primary factors leading to the lower
gross profit margin were higher
manufacturing costs, due to factors such
as rising prices of raw materials and
manufacturing labor costs.
✓
The increase in labor costs was due to
wage hikes.
✓
The increase in logistics costs was due to
higher costs directly related to logistics.
✓
The primary factors leading to higher other
selling, general, and administrative
expenses were higher rents on land and
buildings associated with enhanced
logistical functions and the opening of new
facilities.
(Million yen)
Operating profit in
first half of year
ending December 31,
2026
Higher labor
costs
✓
Higher other
selling,
general, and
administrative
expenses
-181
Copyright© 2026 The Pack Corporation. All Rights Reserved.
6
- Business Results for the Second Quarter of the Year Ending December 31, 2026
[Supplemental Material]
The Pack's Proposal of Solutions and Cross-selling
The hybrid sales structure combining specialization with comprehensive strengths is a
competitive advantage for The Pack.
(1) Solutions proposal
(2) Cross-selling
✓ A team of specialized human resources provides
optimal package solutions to meet customer needs.
✓ Improving customer business efficiency and optimizing
costs by meeting the demand for bulk procurement
Package Laboratories
Proposing optimal
solutions that go beyond
mere packaging to
address issues across
all packaging operations
Graphic
design
Manufacturing
design
Planning
Sales
Production
Division
Package solutions
development
Materials
development
Key points
✓ Streamlining
packaging lines
✓ Making assembly
work more efficient
✓ Product sorting
services under
contract
✓ Design and
fabrication
✓ Structural design
etc.
Handing by manufacturers
of individual products
▪
Increased workloads
associated with order handling
▪
Troublesome
schedule management
The Pack‘s cross-selling
▪
Proposing various packages
▪
Handling all stages from
planning to manufacture and delivery
Paper bag manufacturer A
Paper carton manufacturer B
Customer
Corrugated packaging
manufacturer C
Consistency in packaging
Copyright© 2026 The Pack Corporation. All Rights Reserved.
7
- Business Results for the Second Quarter of the Year Ending December 31, 2026
[Supplemental Material]
Boosting Name Recognition and Creating Contact Points
with Prospective Customers by Exhibiting at Trade Shows
Exhibiting at TOKYO PACK 2026
➢ The Pack will exhibit October 14-16 at TOKYO PACK 2026 at Tokyo Big Sight.
➢ We plan to boost name recognition by communicating our comprehensive strengths and special capabilities
at this international packaging trade show to
a broad audience. The trade show covers
various fields, centered on packaging
materials, containers, and packaging
machinery, and various aspects, ranging
from procurement through production, sales,
consumption, waste, recycling, materials
handling, and logistics.
➢ This initiative will expand entry points to the
sales process, create contact points and
sales opportunities for new customers, and
grow business performance, generating
future growth.
Copyright© 2026 The Pack Corporation. All Rights Reserved.
8
- Business Results for the Second Quarter of the Year Ending December 31, 2026
Performance by Product
Growing demand for materials for e-commerce and shipment packaging drove higher sales
and profits, particularly in the Paper Products segment.
Second quarter of
year ended
December 31, 2025
(Million yen)
Net sales
Actual
Composition
Topics
YoY change
34,881
36,767
73.3%
5.4%
Paper bags
14,485
14,882
29.7%
2.7%
Paper cartons
12,704
12,759
25.4%
0.4%
Corrugated boxes
6,745
8,403
16.8%
24.6%
Printing
945
721
1.4%
-23.7%
Film Packaging
6,337
6,364
12.7%
0.4%
Others
6,166
7,002
14.0%
13.6%
Paper Products
2,488
2,782
93.5%
11.8%
Film Packaging
286
333
11.2%
16.4%
Others
389
529
17.8%
35.9%
-302
-671
-22.5%
Paper Products
Operating profit
Actual
Second quarter of
year ending
December 31, 2026
Adjustments
✓
Domestic sales of paper bags held steady.
Overseas sales grew, centered on North
America and China.
✓
Sales of paper cartons remined steady for
both the souvenir market and the market
for primary containers for food products
and cartons for takeout/delivery food
products.
✓
Robust sales of food product packages,
including packaging for the takeout market,
coupled with sales of corrugated boxes for
the e-commerce and shipment packaging
sectors, drove sharp growth in sales of
corrugated boxes.
✓
Film packaging sales growth with
increased demand for events and
expanded sales of flexible packaging for
food products
✓
Other businesses expanded their sales for
products used by recreation facilities and
for sewn products for gifts.
Copyright© 2026 The Pack Corporation. All Rights Reserved.
9
- Business Results for the Second Quarter of the Year Ending December 31, 2026
Summary of Performance by Priority Market
Sales expansion chiefly in the food products and apparel markets
Topics
Second
quarter of
year ended
December 31,
2025
(Million yen)
Food
products
e-Commerce
Retail
Other
Second quarter of
year ending
December 31, 2026
Actual
Actual
Composition
YoY change
Snacks, food products,
convenience stores
14,536
15,363
30.6%
5.7%
e-Commerce*
2,025
1,943
3.9%
-4.1%
Department stores
2,203
2,174
4.3%
-1.3%
Apparel
7,821
8,400
16.8%
7.4%
Supermarkets, drug
stores
1,806
2,033
4.1%
12.5%
Pharmaceuticals,
cosmetics
2,271
2,235
4.5%
-1.6%
Sundries
1,020
1,251
2.5%
22.6%
15,703
16,735
33.3%
6.5%
Other
Total
47,385
50,134
100%
[Food products] Proposing packaging material
solutions for the souvenir snacks market and
enhancing cross-selling to expand sales
[e-Commerce] Although sales declined for
customers selling only through e-commerce,
enhanced proposals to individual markets for ecommerce and shipment packaging use
contributed to sales of corrugated packages.
[Retail] Sales of high-value-added products grew,
chiefly to the apparel market.
[Other] New customer development and efforts to
promote cross-selling led to sales growth.
Sales
composition
―
Other
33.3%
Sundries
2.5%
Pharmaceuticals,
cosmetics
4.5% Supermarkets,
drug stores
4.1%
- e-Commerce includes customers selling via e-commerce platforms. Sales via customers' own websites are included in sales by each customer industry.
- Other includes the home electronics, automotive, life care, and intermediate industries
Snacks,
food products,
convenience
stores
30.6%
Apparel
16.8%
e-Commerce
3.9%
Department
stores
4.3%
Copyright© 2026 The Pack Corporation. All Rights Reserved.
10
- Business Results for the Second Quarter of the Year Ending December 31, 2026
Financial Summary
Promoting balance sheet management through investments in growth and enhanced
shareholder returns
Year ended
December 31,
2025
Second quarter of
year ending
December 31, 2026
Change
61,667
53,521
-8,145
Cash and deposits
26,061
22,004
-4,056
Accounts
receivable−trade
24,809
18,357
Inventories
9,445
Other
(Million yen)
Year ended
December 31,
2025
Second quarter of
year ending
December 31, 2026
Change
25,920
19,828
-6,091
Notes and accounts
payable−trade
19,607
14,641
-4,966
-6,452
Other
6,312
5,186
-1,125
10,559
1,114
Non-current liabilities
1,294
1,188
-106
1,352
2,599
1,247
Long-term loans payable
334
265
-69
Non-current assets
42,544
45,002
2,457
Other
960
923
-37
Property, plant, and
equipment
30,352
33,646
3,294
76,997
77,507
509
Intangible assets
4,310
4,558
247
Shareholders’ equity
74,186
74,553
366
Investments and other
assets
7,881
6,797
-1,084
Accumulated other
comprehensive income
2,791
2,935
143
104,212
98,524
-5,688
Total liabilities and net
assets
104,212
98,524
-5,688
Assets
Current assets
Total assets
Liabilities,
net assets
Current liabilities
Net assets
Copyright© 2026 The Pack Corporation. All Rights Reserved.
11
- Business Results for the Second Quarter of the Year Ending December 31, 2026
Consolidated Statement of Cash Flows
Cash on hand decreased due to investments in growth and measures taken to boost working
capital.
Second quarter of
year ended
December 31, 2025
(Million yen)
Actual
Second quarter of
year ending
December 31, 2026
Actual
Key underlying factors
Change
5,435
3,649
-1,786
Profit before income taxes
3,524
3,006
-518
Depreciation
1,403
1,404
1
884
-4,653
-5,569
Purchase of property, plant, and equipment
-1,530
-5,106
-3,576
Purchase of intangible assets
-607
-534
73
Purchase of investment securities
-13
-42
-29
Proceeds from sales of investment securities
779
0
-779
-1,378
-3,243
-1,865
Cash dividends paid
-1,239
-1,222
17
Cash and cash equivalents at end of period
21,399
19,494
-1,905
Cash flows from operating activities
Cash flows used in investment activities
Cash flows used in financing activities
✓ Cash flows from operating
activities decreased due to
increased inventories
associated with sales
expansion and the negative
rebound after shorter accounts
receivable collection cycle
during the previous year.
✓ Investments increased due to
enhanced production capacity
and the acquisition of a site for
the Nara Plant.
✓ Expenditures increased with
the purchase of treasury
shares.
Copyright© 2026 The Pack Corporation. All Rights Reserved.
12
- Business Results for the Second Quarter of the Year Ending December 31, 2026
Full-year Performance Forecasts
Appropriate pricing is projected to improve operating profit margin.
(Million yen)
Net sales and operating income trends
Second quarter of
year ended
December 31, 2025
(Million yen)
Actual
Year ending December 31, 2026
(announced August 12)
Performance
(projected)
YoY change
(projected)
125,000
100,000
Net sales (left axis)
Operating profit
Operating profit margin
103,125
106,000
12,500
100,000
10,000
8,009
7,743
7,207
75,000
Net sales
120,000
106,000
103,125
101,461
97,714
Operating income (right axis)
7,500
7,500
2.8%
50,000
5,000
2,500
7,207
7,500
4.1%
25,000
6.99%
7.08%
-
0
0
FY2023/12
Ordinary profit
7,532
7,700
2.2%
Profit attributable to
owners of parent
6,024
5,300
-12.0%
Basic earnings per
share (yen)
107.13
95.35
-11.0%
Dividend per share
(yen)
41.33
42.00
-
FY2024/12
FY2025/12
FY2026/12
(projected)
FY2030/12
(targets)
Key points of full-year forecasts
✓ Continued sales growth through new customer
development and efforts to promote cross-selling
✓ Effects of appropriate pricing to contribute in the second
half
✓ Continued stable shareholder returns (steadily increasing
dividends)
Copyright© 2026 The Pack Corporation. All Rights Reserved.
13
- Business Results for the Second Quarter of the Year Ending December 31, 2026
Factors Underlying Projected Changes in Operating Profit
Continuing appropriate pricing, new customer development, and efforts to promote crossselling
(Million yen)
Higher gross
profit margin
Higher sales
1,100
50
Higher raw material costs + higher manufacturing expenses
Operating profit
in year ending
December 31,
2026
Higher labor
costs
Operating profit in
year ended
December 31, 2025
Key underlying factors
Appropriate pricing + productivity improvements
-220
-200
7,207
■Results of securing
new customers
+250
■Results of building on
existing customers
+850
7,500
Higher logistics
costs
Higher other
selling,
general, and
administrative
expenses
✓ Continued growth in sales through
new customer development and
efforts to promote cross-selling
✓ Appropriate pricing expected to
improve profit margins
✓ Rising costs associated with
enhanced logistical functions and
human capital investments
-437
- Calculated using ratios of composition of the increase in sales
Copyright© 2026 The Pack Corporation. All Rights Reserved.
14
02
Progress on Growth Strategies
Copyright© 2026 The Pack Corporation. All Rights Reserved.
15
- Progress on Growth Strategies
Growth Strategies Toward 2030
Achieving the targets set by strengthening each segment and drawing on robust business
foundations
KPI
Consolidated
net sales
Strategic roles of
individual projects and businesses
Other indicators
(FY2025 → FY2030)
Paper bags
(Billion yen)
❶ Robust earnings foundations
35.0
Food products market sales
32.0 billion yen → 40.0 billion yen
Paper cartons
32.0
❷ Core growth driver
17.7 billion yen → 21.0 billion yen
35.0
Corrugated packages
26.9
14.7
13.3
❸ Strategic products and proprietary
solutions to respond to change
18.0
Film packaging
❹ Main pillar of cross-selling leveraging
the customer base
15.0
Other
(FY)
16.2
17.0
2025
103.1 billion yen
2030
120.0 billion yen
e-Commerce/logistics
market sales
❺ Domains for comprehensive solutions
that take advantage of market barriers
to entry
- Printing, which is included in the Paper Products segment in financial results,
is classified under Other products for the purpose of growth strategies.
Retail and other market
sales
53.4 billion yen → 59.0 billion yen
Overseas sales
7.4 billion yen → 9.0 billion yen
Film packaging sales
2.6 billion yen → 5.0 billion yen
Copyright© 2026 The Pack Corporation. All Rights Reserved.
16
- Progress on Growth Strategies
Progress by Product Type: (1) Paper Bags
Strategic role
(Million yen)
Robust earnings foundations
Net sales and operating income trends
20,000
3,000
Net sales (left axis)
Operating income (right axis)
- Operating profit margin in parentheses
✓
✓
Business
environment
✓
✓
✓
Measures
✓
✓
Weakening consumer confidence due to inflation
Strong sales of higher-priced products due to growing inbound
tourism backed by the weak yen
Strengthening efforts to control packaging material costs even as
demand for takeout food products remains strong
Full-scale negotiations on product price revisions as papermakers
grapple with rising raw paper prices
Expanding sales channels in food products, e-commerce, and retail
markets
Pursuing productivity and efficiency
Increasing staffing and facilities for overseas markets to enhance
sales structures
14,882
14,485
14,279
15,000
12,993
2,000
1,765
10,000
1,482
(12.4%)
(11.4%)
1,464
(10.1%)
1,403
(9.4%)
1,000
5,000
0
0
FY2023/12 1H
FY2024/12 1H
FY2025/12 1H
FY2026/12 1H
Sales volume and average unit price trends
■ Paper bags with no turned-over tops, square bottom paper bags, flat paper bags
■ Paper bags with turned-over tops
Average unit price of all paper bags (right axis)
(Million bags)
(yen)
900
25.0
800
700
127
127
127
131
600
✓
Progress on
measures
✓
✓
Enhancing the production capacity for paper delivery bags to grow
market shares among major e-commerce firms
Securing revenue by proposing revised specifications in response to
shifting to paid services and cost-control demands
Negotiations toward appropriate pricing proceeding as planned
20.0
500
400
19.6
18.6
19.1
630
638
632
626
FU2023/12
23/12期1H
FU2024/12
24/12期1H
FU2025/12
25/12期1H
FU2026/12
26/12期1H
中間期
中間期
中間期
中間期
17.0
300
200
15.0
100
0
10.0
Copyright© 2026 The Pack Corporation. All Rights Reserved.
17
- Business Results for the Second Quarter of the Year Ending December 31, 2026
[Reference] Examples of Paper Bag Products
(1) Paper bags with turned-over tops
✓
✓
Paper bags reinforced with turned-over
tops
Reinforced tops make the bags stronger
and easier to reuse.
(2) Paper bags with no turned-over tops
✓
✓
Paper bags with serrated tops
High cost performance: ideally suited to
mass production
(3) Square bottom paper bags and flat paper bags
✓
✓
Product formats widely used as delivery bags and as primary
packages for food products
These bags can be fitted with two-sided tape or given oilresistance features, depending on the application.
Copyright© 2026 The Pack Corporation. All Rights Reserved.
18
- Progress on Growth Strategies
Progress by Product Type: (2) Paper Cartons
Product type
Position
The largest growth driver of the current
Medium-Term Management Plan
Net sales and operating income trends
Net sales (left axis)
Operating income (right axis)
(Million yen)
- Operating profit margin in parentheses
15,000
12,704
12,120
3,000
12,759
11,262
✓
Business
environment
✓
✓
✓
✓
Measures
✓
✓
Inflation has led to modest reductions in the use of paper cartons
for food products in general distribution.
Demand is growing for high-value-added packages associated with
premium strategies in the food products industry.
Steady trend in the souvenirs market, backed by tourism demand
Full-scale negotiations on product price revisions as papermakers
grapple with rising raw paper prices
Accelerating sales expansion of paper cartons through the valueadded logistics services business
Broadening the scope of application of water-based flexography
printers
Expanding sales of primary containers for food products
10,000
2,000
907
(8.1%)
5,000
1,050
999
(8.7%)
(7.9%)
1,154
(9.0%)
1,000
0
0
FY2023/12 1H
FY2024/12 1H
FY2025/12 1H
FY2026/12 1H
Sales volume and average unit price trends
(Million bags)
(yen)
800
20.0
Sales volume (left axis)
Average unit price (right axis)
684
700
685
19.5
646
618
19.0
600
✓
Progress on
measures
✓
✓
Growing market share for major Japanese confectionary shops
through the value-added logistics services business
Expanding use of water-based flexography printers, which pose low
environmental impact
Negotiations toward appropriate pricing proceeding as planned
18.5
18.6
500
18.6
18.5
18.0
18.2
400
17.5
300
17.0
FY2023/12 1H
FY2024/12 1H
FY2025/12 1H
FY2026/12 1H
Copyright© 2026 The Pack Corporation. All Rights Reserved.
19
- Progress on Growth Strategies
Progress by Product Type: (3) Corrugated Boxes
Strategic products for responding to change
through proprietary solutions
Product type
Position
Net sales and operating income trends
(Million yen)
10,000
2,000
Net sales (left axis)
Operating income (right axis)
- Operating profit margin in parentheses
✓
Business
environment
✓
✓
Raw paper price hikes for the first time in three years beginning in
February took hold.
Product shipments by value increased sharply in domestic electronics,
semiconductors, and other fields.
Trends remain positive for both e-commerce platforms and the ecommerce businesses of specialized retail businesses.
7,500
8,403
1,500
6,745
6,343
5,926
5,000
1,000
2,500
257
(4.1%)
321
500
(5.4%)
178
33
(2.1%)
(0.5%)
0
✓
Measures
✓
✓
✓
Progress on
measures
✓
✓
Expanding sales channels in e-commerce and shipment packaging
fields
Increasing productivity by reducing labor and energy requirements
Promoting cross-selling to existing customers
Growing market share among e-commerce customers based on our
reputation for domestic and international production and procurement
capabilities
Drawing on our design capabilities to expand orders received for
packaging materials for home electronics and energy-related equipment
Promoting proposal activities to improve profit margins; improvements
largely completed during the first half
0
FY2023/12 1H
FY2024/12 1H
FY2025/12 1H
FY2026/12 1H
Sales volume and average unit price trends
(Million bags)
150
140
Sales volume (left axis)
Average unit price (right axis)
100
50
82
85
69.6
64.7
(yen)
150
129
100
50
49.7
53.9
0
0
FY2023/12 1H
FY2024/12 1H
FY2025/12 1H
FY2026/12 1H
Copyright© 2026 The Pack Corporation. All Rights Reserved.
20
- Progress on Growth Strategies
Progress by Product Type: (4) Film Packaging
Product type
Position
Main pillar of cross-selling leveraging
the customer base
Net sales and operating income trends
Net sales (left axis)
(Million yen)
Operating income (right axis)
- Operating profit margin in parentheses
7,500
6,654
6,347
2,000
6,364
6,337
1,500
✓
Business
environment
✓
✓
Market turmoil related to raw materials supplies and cost hikes due to
conditions in the Middle East
Growing demand for high function film packaging in the retail food
products field
Trend toward higher added value in the maturing sanitary products
market
5,000
1,000
403
2,500
Measures
✓
✓
Accelerating sales expansion of film packaging through the valueadded logistics services business
Broadening the scope of application of water-based flexography
printers
Promoting the development of materials and products with low
environmental impact
333
286
(4.3%)
(5.2%)
(4.5%)
0
FY2024/12 1H
FY2025/12 1H
FY2026/12 1H
Sales trends for key products
Disposable diaper bags
Plastic bags
Film packaging
Progress on
measures
✓
✓
(Million yen)
2,500
1,648
2,000
1,831
1,910
1,783
1,743
1,585
1,545
1,500
✓
500
0
FY2023/12 1H
✓
(6.4%)
288
1,322
1,254
Steady trends in the use of film packaging in the Japanese
confectionery and souvenir confectionery markets
Enhancing domestic and international supply chains to achieve
recovery in the sanitary products market
Strong sales of character and event products in the retail market
998
969
1,000
790
500
0
FY2023/12 1H
FY2024/12 1H
FY2025/12 1H
FY2026/12 1H
Copyright© 2026 The Pack Corporation. All Rights Reserved.
21
- Progress on Growth Strategies
Progress by Product Type: (5) Other
(printing, sewn products, PAS system,* etc.)
- PAS system: A vendor business delivering supplies and other products bundled with packaging materials (see p. 41)
Domains for comprehensive solutions that take
advantage of market barriers to entry
Product type
Position
Net sales and operating income trends
10,000
2,000
Net sales (left axis)
Operating income (right axis)
- Operating profit margin in parentheses
7,943
7,624
7,724
7,111
7,500
✓
Business
environment
✓
✓
Market turmoil related to raw materials supplies and cost hikes due to
conditions in the Middle East
Enactment of amended Act on Advancement of Integration and
Streamlining of Distribution Business (April)
High expectations that printing and coating technologies will reduce
plastic use
✓
✓
✓
Enhancing logistics and order receipt/placement systems
Developing services to lessen customer workloads
New market development in the printing business
1,000
553
✓
Progress on
measures
✓
✓
Improving the convenience of the in-house Web-based order
receipt/placement system
Halting the decline in PAS system business traceable to changing
business environments for customers
Increasing the average unit price of sewn bags by joining the
movement toward higher value added
Strong printing demand for gravure and offset rotary presses etc. in
primary containers for food products
575
546
(7.3%)
(7.4%)
(6.9%)
380
2,500
500
(5.4%)
0
0
FY2024/12 1H
FY2025/12 1H
FY2026/12 1H
Sewn product and PAS system sales trends
(Million yen)
2,500
Sewn products
2,051
✓
1,500
5,000
FY2023/12 1H
Measures
(Million yen)
PAS system
1,898
2,000
1,773
1,542
1,485
1,500
1,513
1,379
1,221
1,000
500
0
FY2023/12 1H
FY2024/12 1H
FY2025/12 1H
FY2026/12 1H
Copyright© 2026 The Pack Corporation. All Rights Reserved.
22
- Progress on Growth Strategies
Progress in Priority Markets [Food Products Market]
Steadily manifesting results of measures under the previous Medium-Term Management Plan
Food products market sales results and targets
■ 1H results
■ 2H results (FY2026/12 plan)
40.0
400
40
30.3
32.0
(planned)
30
300
20
200
Measure (2)
Expanding sales of paper cartons
through the value-added logistics
services business
17.7
14.9
17.0
18.4
✓ Expanding in-house facilities in the
value-added logistics services business
(from two in 2025 to five as of June
2026)
✓ These facilities have helped secure 340
million yen/year in new commercial
rights as of June 30, 2026.
15
150
10
100
13.3
13.3
13.6
15.3
505
0
FY2023/12
FY2024/12 FY2025/12 FY2026/12
Measure (1)
Expanding sales of primary
packaging for food products
✓ Specifications changes and new
product and promotional measures in
response to rising costs contributed to
growth.
33.0
28.2
25
250
Indicators
Sales trends for primary packaging for food products
(Billion yen)
450
45
350
35
Initiatives in this market
FY2030
target
(Million yen)
5,000
4,500
Paper bags
Paper cartons
4,311
4,305
4,178
4,000
3,454
3,500
3,000
2,500
2,000
1,500
1,000
500
410
261
305
369
FY2023/12 1H
FY2024/12 1H
FY2025/12 1H
0
1,000
Sales trends for film packaging for the food
products market
(Million yen)
843
900
800
700
FY2026/12 1H
650
701
744
600
500
Measure (3)
Expanding sales of film packaging
400
✓ High growth achieved through crossselling
✓ Up 99 million yen (13.4%) from last year
100
300
200
0
FY2023/12 1H
FY2024/12 1H
FY2025/12 1H
FY2026/12 1H
Copyright© 2026 The Pack Corporation. All Rights Reserved.
23
- Progress on Growth Strategies
Progress in the e-Commerce and Logistics Markets
Growing shares among customers in the e-commerce market
e-Commerce and shipment packaging
market sales results and targets
■ 1H results
■ 2H results (FY2026/12 plan)
Sales trends for e-commerce materials
(Billion yen)
25025
21.0
19.0
17.7
20020
(planned)
16.3
14.7
15015
EC用資材売上高
Indicators
Initiatives in this market
9.2
Measure (1) Expanding sales of
e-commerce materials
(Million yen)
4,000
3,500
✓ Shares expanded for each e-commerce
firm through capital investments and other
measures during the period covered by
the previous Medium-Term Management
Plan (intended to contribute to results in
the second half and later)
✓ Helps expand sales of thin corrugated
delivery materials in particular
3,000
2,197
2,000
1,500
1,000
859
659
716
414
500
FY2023/12 1H
Measure (2) Expanding sales of
shipment packaging materials
7.7
10010
✓ Positive trends in orders for materials
related to home electronics and storage
cells
9.8
7.4
2,655
2,410
2,500
8.9
7.0
3,414
0
9.3
50 5
Paper delivery bags
Other e-commerce materials
8.4
FY2024/12 1H
FY2025/12 1H
FY2026/12 1H
Sales trends for shipment packaging materials
(Million yen)
5,000
4,446
4,368
3,944
4,125
4,000
3,000
2,000
00
FY2023/12
FY2024/12 FY2025/12 FY2026/12
FY2030
target
1,000
0
FY2023/12 1H
FY2024/12 1H
FY2025/12 1H
FY2026/12 1H
Copyright© 2026 The Pack Corporation. All Rights Reserved.
24
- Progress on Growth Strategies
Progress in the Retail Market and Overseas Businesses
Promoting a high-value-added strategy
Retail market sales results and targets
■ 1H results
■ 2H results (FY2026/12 plan)
600
60
54.8
54.9
53.4
Initiatives in this market
(Billion yen)
54.0
57.0
✓ Promoting sales of high-value-added
paper bags with turned-over tops suitable
for bags provided for a fee
✓ Expanding sales of rigid boxes by
improving manufacturing and procurement
capacity
✓ Enhancing proposals of sewn bags in
response to demand for premium bags
offering higher value and environmental
considerations
(planned)
500
50
40
400
29.0
29.0
28.0
Measure (1) Expanding sales of
high-value-added products
29.1
30
300
Indicators
Sales trends by product in the market for specialized retail
businesses (apparel and sundries)
4,000
Paper bags with turned-over tops
Other packaging materials
2,500
(Million yen)
3,404
3,368
3,500
3,000
Paper cartons (including rigid boxes)
3,149
2,761
2,210
1,994
2,214
2,231
2,272
2,051
2,030
2,007
2,000
1,500
1,000
500
0
FY2023/12 1H
FY2024/12 1H
FY2025/12 1H
FY2026/12 1H
Trend in overseas market sales
20
200
25.8
25.9
25.4
Measure (2)
Sales in overseas markets
(Million yen)
4,000
3,620
3,301
24.9
10
100
✓ Gaining new customers by enhancing
sales capacity (increasing staffing) at
overseas subsidiaries
2,867
3,000
2,349
2,000
0
FY2023/12
FY2024/12 FY2025/12 FY2026/12
FY2030
target
1,000
0
FY2023/12 1H
FY2024/12 1H
FY2025/12 1H
FY2026/12 1H
Copyright© 2026 The Pack Corporation. All Rights Reserved.
25
- Progress on Growth Strategies
Overview of Capital Allocation Strategy
Initiating business infrastructure development for the next generation
New Medium-Term Management Plan
(2026-2030)
2026 1H capital and strategic investments
Added value
Net cash provided by
operating activities
Approximately
Growth investments
44.0
billion yen
Depreciation
Approximately
Growth investment
Approximately
35.0
billion yen
15.0
billion yen
Net profit, etc.
Approximately
29.0
Dividends
Approximately
billion yen
12.0
Debt financing
Approximately
13.0
billion yen
Purchase of treasury shares
Approximately
10.0
billion yen
billion yen
Cash inflows
Cash outflows
Paper carton
manufacturing capacity
enhancements
29 million yen
Paper bag manufacturing
capacity enhancements
20 million yen
Streamlining, labor saving
17 million yen
Purchase of land
(plant site)
3,841 million yen
Human capital investment
◆Completed purchase of land
needed to renovate and expand
the Nara Plant (June).
More than 50 years have passed since the
current Nara Plant was built. This project is
intended to enhance production capacity,
improve working environments, and
reduce labor and energy through plant
automation and other measures.
52 million yen
163 million yen
Other
Total
4,122 million yen
Copyright© 2026 The Pack Corporation. All Rights Reserved.
26
03
Initiatives to Increase Corporate Value
Copyright© 2026 The Pack Corporation. All Rights Reserved.
27
- Initiatives to Increase Corporate Value
Progress in Human Capital Strategy
Realizing sustained growth through enhancement of human capital
Status of initiatives
(1) Hiring and
placement
⚫ Steadily securing human resources and enhancing
the assignment of the right people to the right places
・ Midcareer hires and continued-employment employees
・ Appropriate assignments using the talent management
system
Nonconsolidated
2022
2023
2024
2025
2026
(as of June 30)
Midcareer hires
(employees)
28
39
27
16
9
Continued-employment
employees (employees)
58
67
74
104
106
⚫ Developing the human resources needed to lead reforms
(2) Skills
development
・ Digital transformation (DX) training: Training continues to achieve the target level of 5% earning the status of business architects
(human resources who play leading roles)
From 1% of all employees in 2024 to 2.8% in 2025
・ Skills improvement support program: Encouraging employees to earn DX promotion qualifications
⚫ Developing systems and environments to harness diverse human resources
(3) Utilization
・ Promoting evaluation systems with a focus on creating added value
・ Developing workplaces where men and women can thrive together: encouraging men to take childcare leave etc., promoting the role of
women in the workplace
・ Supporting career-building through career design training
⚫ Promoting initiatives to improve wellbeing
(4) More
comfortable
work
・ Improving compensation: Revising detailed rules on regular raises and various allowances, raising wages (by 5.09% in FY2026),
increasing subsidies for the employee stock ownership program
・ Health management: Appropriate labor management, healthcare training, expanding applicable scope of menstrual leave, establishing
new wellness leave
Copyright© 2026 The Pack Corporation. All Rights Reserved.
28
- Initiatives to Increase Corporate Value
Progress in IR and SR Activities
Taking steps to ensure appropriate market valuations through effective two-way
communication with shareholders and investors
Status of initiatives
Expanding name
recognition
Disclosure
⚫ Communicating information via Web media
⚫ Promoting interviews with financial journals, etc.
⚫ Publishing Sustainability Report 2026 and Integrated Report 2026
⚫ Revising the Medium-Term Management Plan page on the website
⚫ Making proactive disclosures through IR information services: Distributing Briefing Materials on
Business Results and transcripts
⚫ Expanding points of contact with individual investors
Promoting
understanding
・ Web seminar: Held in July 2026 for 4,138 viewers
・ Company briefing video released on website
・ Continuing to enhance content to promote public
understanding of The Pack
⚫ Enhancing dialogue with institutional investors
・ 22 IR meetings held (January-June 2026)
・ Hosting tours of the Packaging Laboratories
Internal feedback
2022
2023
2024
2025
2026
(as of June 30)
Individual meetings
(meetings)
19
39
29
29
22
Packaging Laboratory
tours (tours)
1
6
6
4
3
⚫ Reporting details of dialogue with institutional investors to the Board of Directors at regular intervals
Copyright© 2026 The Pack Corporation. All Rights Reserved.
29
- Initiatives to Increase Corporate Value
Sustainability Improvement Initiatives
Addressing materiality topics to boost corporate value
Materiality topic
(1) Promoting
eco-friendly
product planning
and technological
development
(2) Reducing
environmental
impact
throughout our
business
activities
(3) Contributing
to environmental
conservation and
preservation
KPIs
Achieving 50% or
better ratio of sales
of FSC®-certified
products (paper
bags, paper cartons,
corrugated boxes) to
total sales*
- Sales: The Pack
(nonconsolidated) paper
products business as a
whole
Reducing CO2
emissions
(Scopes 1 and 2) by
46% vs. FY2018
figures (targeting
8,997 t in FY2030)
Implementing 15
The Pack Forest®
Environment Fund
activities, with 500
participants, per
year
Status of initiatives
(%)
⚫ Sales of FSC®-certified products as of June 30, 2026:
6.27 billion yen (up 1.03% YoY)
⚫ Enhancing supply structures for FSC®-certified
products throughout the supply chain (FSC® C020517)
⚫ Continuing to enhance proposals to switch to paper
packages
KPI
60
50.0
40
20
17.4
・ Launched vacuum pump concentration projects at the
Osaka and Tokyo plants
・ Continuing to transition to LED lighting at the Nara and
Osaka plants
・ Launched solar panel expansion project at the Tokyo Plant
⚫ Forest conservation activity performance as of June 30,
2026
・ Activities conducted five times
First activity conducted at 10th afforestation site, in Kinokawa,
Wakayama Prefecture
・ 161 individuals participated (including 20 customers and 49 members
of the general public)
⚫ Visits underway to develop the 11th afforestation site
21.1
21.5
2023
2024
2025
0
2022
⚫ Scopes 1 + 2 emissions as of June 30, 2026: 8,540 t
⚫ Continuing energy conservation measures in
preparation for plant renovations and upgrades
20.2
2030
(t)
20,000
15,399
16,756
16,149
16,319
KPI
15,000
8,997
10,000
5,000
0
2022
20
2023
2024
2025
2030
Annual activities (times)
KPI
Annual participants (persons)
500
600
15
400
253
10
273
15
230
9
5
111
200
8
8
2024
2025
4
0
0
2022
2023
2030
Copyright© 2026 The Pack Corporation. All Rights Reserved.
30
- Initiatives to Increase Corporate Value
Sustainability Improvement Initiatives
Addressing materiality topics to boost corporate value
Materiality topic
(4) Promoting
diverse
workstyles that
help all
employees thrive
KPIs
Boosting the
percentage of
women holding
management
positions (managers
or above) to 15% or
more
Status of initiatives
⚫ As of June 30, 2026, women accounted for 8.94% of all
management positions.
⚫ To boost the representation of women among our permanent,
full-time employees, setting a target of at least 35% of new
graduate hires being women and cultivating environments
in which both men and women can thrive
(%)
KPI
20
15.0
15
10
8.8
6.7
6.3
7.2
5
・ Women accounted for 38.7% of all new graduate hires in April 2026.
0
(target of 35% or more now achieved for six consecutive years)
2022
2023
2024
2025
・ Expanding the scope of menstrual leave
・ Establishing new wellness leaves, including leave for fertility treatment and menopausal symptoms
・ Revising detailed rules on regular raises to ensure opportunities for raises during maternity and childcare leave
400 (Companies)
(5) Co-creating
brand value with
our customers
Won support
pledges from 300
firms for The Pack
Forest® Environment
Fund*
- Number of companies
with sales results
⚫ Won support pledges from 136 firms as of June 30, 2026
⚫ The Pack Forest® product sales as of June 30, 2026:
954 million yen
⚫ Promoting the growth of supporting companies by
enhancing tools to provide information on the activities
2030
KPI
300
300
200
158
177
123
100
94
0
2022
2023
2024
2025
2030
Other initiatives in the January-June 2026 timeframe
⚫ Enhancing risk management structures
・ Project to promote business continuity planning (BCP): Workshop held to formulate initial action plans
・ Enhancing supply chain risk management: Formulated and published ethics policy, environmental policy, human rights policy, and sustainable procurement policy
⚫ Quality maintenance and improvements in cooperation with suppliers
・ 28 quality auditing and guidance activities implemented for Company plants, Group companies, and partners
Copyright© 2026 The Pack Corporation. All Rights Reserved.
31
04
Reference Materials
Copyright© 2026 The Pack Corporation. All Rights Reserved.
32
Corporate Overview
Name
THE PACK CORPORATION
Founded
May 1952 (shares listed September 1991; listed on TSE Prime Market April 2022)
Headquarters
9-3 Higashiobase 2-chome, Higashinari-ku, Osaka, Osaka Prefecture
Lines of
business
Planning, manufacturing and sale of paper bags, folding paper cartons, corrugated boxes, film packaging, etc.
Executives
Naoki Nakamura, President and CEO, seven other directors (including three outside directors), and four auditors
(including two outside auditors)
Number of
employees
1,233 consolidated, 888 nonconsolidated
Group
companies
Nine consolidated subsidiaries (in Japan, the United States, and China)
Main banks
MUFG Bank, Sumitomo Mitsui Banking Corporation, Mitsubishi UFJ Trust and Banking Corporation, Sumitomo Mitsui
Trust Bank, Mizuho Bank
Main
shareholders
Morita Kinen Fukushizaidan 11.30%, partner companies’ stock ownership program 6.86%, BBH for Fidelity Low-Priced
Stock Fund (Standing proxy: MUFG Bank, Ltd.) 6.56%, Nippon Active Value Fund PLC 5.63%, Navf Select LLC 5.13%,
The Master Trust Bank of Japan, Ltd. (trust account) 4.58%, Custody Bank of Japan, Ltd. (Resona re-trust
account/Hokuetsu Corporation retirement benefits trust account) 3.96%, Daio Paper Corporation 3.11%, Shichijo Paper
Trading Co., Ltd. 2.58%, Morita Shoji Co., Ltd. 2.25%
- As of June 30, 2026
Copyright© 2026 The Pack Corporation. All Rights Reserved.
33
The Pack Group (Nine Consolidated Subsidiaries)
The Pack Corporation
Headquarters (Osaka)
(The four plants in Japan have earned ISO 9001 and ISO 14001 certification.)
Tokyo Head Office Building
Osaka Plant
Nara Plant
Tokyo Plant
Ibaraki Plant
Domestic subsidiaries
Keihin Tokushu
Printing Corp.
Pack Takeyama Co., Ltd.
Nishinihon Printing Co., Ltd.
Kannaru Printing Co., Ltd.
Hikari Packs Ishikawa
Co., Ltd.
Overseas subsidiaries
Consolidated
subsidiaries
in China
Consolidated
subsidiaries
in China
U.S. consolidated
subsidiary
The Pack (Shanghai)
Corporation
The Pack
(Changshu) Co., Ltd.
The Pack America
Corporation (NY)
Copyright© 2026 The Pack Corporation. All Rights Reserved.
34
Trends in Net Sales and Ordinary Profit (Consolidated) from
the Company’s Founding (1952) through 2025
(Million yen)
100,000
10,000
Net sales (left axis)
Ordinary profit (right axis)
90,000
9,000
80,000
8,000
70,000
7,000
60,000
6,000
50,000
5,000
40,000
4,000
30,000
3,000
20,000
2,000
10,000
1,000
0
0
1955
1960
1965
1970
1975
1980
1985
1990
1995
2000
2005
2010
2015
2020
2025
- As of June 30, 2026
Copyright© 2026 The Pack Corporation. All Rights Reserved.
35
Distribution Structure for Major Products
Consumers
Main buyers
Department
stores
Convenience
stores
Supermarkets
and drug
stores
Apparel
Pharmaceuticals
and
cosmetics
Sundries
Food
products
Home electronics
and home
installations
e-commerce
(mail order)
etc.
Raw materials makers
Paper, fabric, plastic film
Ink
Adhesive
Other
materparts
and ials
etc.
Copyright© 2026 The Pack Corporation. All Rights Reserved.
36
The Pack’s Strengths (1)
Specifics
内容
Strength
- A wide-ranging
customer base
◆Transaction counterparties:
approx. 15,000 companies
Food products, department stores,
specialty stores, large retailers, general
retailers, convenience stores, fast food,
apparel, home electronics manufacturers,
e-commerce, etc.
Sales
composition
Other
33.3%
Snacks, food
products,
convenience
stores
30.6%
Sundries
2.5%
Pharmaceuticals,
cosmetics
4.5%
A customer base resistant to the
negative effects of downturns
in specific industries
Supermarkets,
drug stores
4.1%
Apparel
16.8%
e-Commerce
3.9%
Department
stores
4.3%
(As of June 30, 2026)
Product
samples
Apparel, department stores
e-Commerce
Snacks, food products, convenience
stores
Other
Copyright© 2026 The Pack Corporation. All Rights Reserved.
37
The Pack’s Strengths (2)
Specifics
Strength
◆ (Full support structure)
Solutions proposed by joint efforts of the sales, research and planning, engineering, and design
sections
◆ (Thorough expertise and access to large body of information)
Operating one of Japan’s largest packaging labs
- A total packaging
solutions provider
Providing solutions only a general package maker can provide
Choosing materials
and processes
More efficient
work
Total packaging
solutions
Box assembly
work and product
soring services
Solutions in the
package use phase
Streamlining
packaging
lines
Choosing optimal
production sites
and methods
Solutions for the
package production
phase
Structural
design
Packaging
Laboratories
Cost
savings
Graphic
design
Copyright© 2026 The Pack Corporation. All Rights Reserved.
38
The Pack’s Strengths (2)
Strength
2. A total packaging solutions
provider
Specifics
◆The Packaging Laboratories
Two Packaging Laboratory employee training facilities have opened in Tokyo and Fukuoka.
These facilities collect and exhibit a broad range of packaging solutions from across Japan and
around the world to grasp packaging trends and evaluate optimal specifications.
- Packaging Laboratory Osaka will close temporarily in September 2026 in connection with the
Osaka Plant renovation.
Packaging Laboratory
Tokyo (881 m2)
Packaging Laboratory
Fukuoka (89 m2)
Copyright© 2026 The Pack Corporation. All Rights Reserved.
39
The Pack’s Strengths (3)
Strength
Specifics
- Integrated manufacturing,
sales, and logistics
structure
Risk management for disasters, accidents, and other incidents through joint efforts involving the
four plants, Group companies, and subcontractor plants
The Pack Group
Manufacturing
Paper bag plant
Paper cartons plant
直販営業体制
Direct sales
structure
Hokkaido Branch
Niigata Sales Office
Aomori Sales Office
Keihin Tokushu Printing Corp.
Matsumoto Sales Office
Headquarters, division
Kanazawa Sales Office
Branch, sales office
Hikari Packs Ishikawa Co., Ltd.
Subsidiary
Kyoto Branch
Printing plant
Tokyo Plant
Tokyo Head Office Building
Yonago Sales Office
Okayama Branch
Ibaraki Plant
Kanto Branch
Hiroshima Branch
Yokohama Branch
Shizuoka Sales Office
Nagoya Branch
Fukuoka Branch
Kagoshima
Sales Office
Okinawa
Sales Office
Nationwide direct sales structure
Pack Takeyama Co., Ltd.
Nishinihon Printing Co., Ltd.
Kumamoto Sales Office
Corrugated board plant
Tohoku Branch
Kobe Branch
Nagasaki Sales Office
Film packaging plant
Takamatsu
Sales Office
Shikoku Branch
Osaka Plant
Kannaru Printing Co., Ltd.
Logistics
Products
Nara Plant
Headquarters (HQ)
Customers across Japan
Copyright© 2026 The Pack Corporation. All Rights Reserved.
40
The Pack’s Strengths (4) (5)
Strength
4. Quality control structure
Specifics
◆ Four domestic plants earned ISO 9001 certification for quality management systems.
◆ Tokyo and Osaka plants have earned FSSC 22000 international food-safety
management system certification.
- IT-driven customer networks
◆ Delivering packaging materials, supplies, and other
products as an integrated service (Pack Assortment
Service System)
Streamlined logistics based on combined
deliveries also helps cut CO2 emissions.
Example of
ordering services
Packaging
materials
Product
registration and
revision
Order lists
Customer stores
Office
materials
Supplies
(Internet)
Store A
Ordering
instructions
Customer
order
(Internet)
Store B
◆ Offering Pack-Web web-ordering services
Streamlining customers’ ordering
operations.
Customer
headquarters
Items handled
◆ The entire organization is pursuing a policy of improving customer satisfaction
through enhanced quality.
◆ We are working to strengthen quality across the entire supply chain through means
including quality meetings with partner companies and group companies.
Our logistics center
Our system
Order
management
Store C
Delivery to
each store
Our production plans
Status of order receipt
Restocking management
and purchasing sections
Copyright© 2026 The Pack Corporation. All Rights Reserved.
41
ESG Initiatives (1)
Initiatives
- Planning and proposing
packages to support social
contribution activities
Specifics
◆ Sales begin for KAISONAL® (eco-friendly next-generation oil-resistant coating).
KAISONAL® is a coating agent made from seaweed-derived raw material to meet increasing
demands for takeout food packages and reduced environmental impact.
PFAS-free, plastic-free primary paper packaging coated with this agent offer
oil-resistance equal to conventional oil-proof packaging.
This alternative to plastic takeout food packages satisfies demands in the food products market.
Relationship to the SDGs
Read the The Pack blog for more product information.
https://www.thepack.co.jp/blog/products/a197
Copyright© 2026 The Pack Corporation. All Rights Reserved.
42
ESG Initiatives (2)
Strength
2. Environmental initiatives
Specifics
◆Four plants in Japan had earned ISO 14001 certification.
◆Continuing to reduce the use of materials appearing on the Pollutant Release and Transfer
Register (PRTR) and in industrial waste
◆Developing and expanding sales of eco-friendly products and FSC® products
◆We fulfill our obligations as a core member of the Japan Clean Ocean Material Alliance, which
promotes activities aimed at developing and promoting products to reduce ocean plastic waste.
◆Promoting the use and spread of renewable energy by investing in renewable energy funds
◆Disclosing information according to TCFD and setting CO2 emission reduction targets by FY2030
⇒ Reducing CO2 emissions (Scopes 1+2) by 46% from the FY2018 level
Changes in CO2 emissions (Scopes 1+2)
Materiality
KPIs
46%
reductions from
FY2018 levels
Relationship to the SDGs
FY2018
FY2019
FY2020
FY2021
FY2022
FY2023
FY2024
FY2025
FY2030
target
(t-CO2)
Copyright© 2026 The Pack Corporation. All Rights Reserved.
43
ESG Initiatives (3)
Specifics
内容
Initiatives
取り組み
®
- Activities of The Pack Forest
Environment Fund
(forest conservation activities)
◆In 2000, we established an independent The Pack Forest® Environment Fund and launched
volunteer activities to plant and thin forested areas. Currently we have ten planting sites across
Japan.
◆We contribute a portion of the sales from eco-friendly products to the Forest Environment Fund.
◆Operation of the Fund is subcontracted to the nonprofit Eco Future Fund (EFF).
We carry out forest conservation activities with the participation of not just The Pack employees,
but customers and the general public.
Paper
makers
Materials
makers
Eco-friendly
base paper,
non-wood-based
paper, etc.
Forest
Products
(e.g., bagasse)
Eco-friendly
materials
THE PACK
Product
proceeds
Customers
Volunteering
The Pack Forest® ®
ザ・パックフォレスト
Mark
マーク
(e.g.,
biodegradable
rope)
Volunteering
Contributions
Tree planting and forest
conservation activities
in Japan
Relationship to the SDGs
Funding activities
The Pack Forest®
Environment Fund
Subcontractor nonprofit:
Eco Future Fund (FFF)
http://www.eco-future.net/
Funds contributed
Trees planted
Total participants
Planted land area
CO2 emissions absorbed
222 million yen
24,903
7,992
20.24 Ha
2,411.28 t
(Totals as June 30, 2026)
Copyright© 2026 The Pack Corporation. All Rights Reserved.
44
ESG Initiatives (4)
Initiatives
4. Human resource
development and
workplace development
Specifics
◆ In accordance with our Company Motto, “Passionate and Dedicated to Our Partnerships,” and our
Corporate Philosophy, “We Value and Nurture People,” we are implementing initiatives to
contribute to employee welfare, including human resource development, support for childcare and
long-term care, and employment stability.
◆ Chosen by the Certified Health & Productivity Management
Outstanding Organizations Recognition Program 2026
(for the eight consecutive year)
Thorough health checkups and secondary examinations, smoking
cessation challenge, stress checks, health training, etc.
◆ Adoption and use of evaluation and support
programs to improve skills
Relationship to the SDGs
HR system (career development stage)
Wage structure
The various activities include the integrated
management of employee information implemented via
the talent management system, fair and appropriate
evaluations made at HR development meetings, digital
transformation (DX) training, career design training,
tiered training programs, and financial aid for those
seeking to earn official qualifications through the skills
improvement support program.
Action requirements
-
Level
-
Job qualifications
-
HR course
-
Position
-
Basic skills
-
Job skills
-
Management skills
Training
programs
Management
by objectives
HR development meetings
(decisions on treatment)
- Wage raises, promotions
- Bonuses
- Advancement 4. Reassignment
HR evaluation
- Skills evaluation
- Bonus evaluation
- Overall evaluation
Operation
◆ Making the most of diverse human resources
Promoting women in the workplace, comprehensive program of shortened working
hours, improving the employment conditions of post-retirement employees and
part-time employees, encouraging men to take childcare leave, opening the Kainan
Office to employ people with disabilities, adoption of a referral employment program,
etc.
Copyright© 2026 The Pack Corporation. All Rights Reserved.
45
ESG Initiatives (5)
Initiatives
5. Social contribution activities
Specifics
◆As part of our environmental education initiatives, in cooperation with the city of Higashi-Osaka,
we organize hands-on manufacturing classes at elementary schools.
◆Supporting the Kansai Philharmonic Orchestra
◆Donations to Yoshinoyama Hoshoukai
◆Sponsoring the Kids Earth Fund
◆Hosting junior high school students for work experience
◆Providing a lecturer to Oshigoto (Job) Fair
Relationship to the SDGs
Oshigoto Fair is an event aimed at junior high schoolers who live with
foster families in small-scale foster group homes known as family
homes and in group homes for children in Nara Prefecture. Its
objective is to serve as an opportunity for them to listen to the stories
of working adults and choose suitable future paths and occupations.
Copyright© 2026 The Pack Corporation. All Rights Reserved.
46
Note
This document is intended to provide information on management policies and business results for the second quarter of the year
ended December 31, 2026. It is not intended to solicit investment in securities issued by the Company. In addition, this document
was prepared based on data as of June 30, 2026.
Views, forecasts, and other information contained in this document are based on the Company’s judgments at the time the document
was prepared. No guarantees are made concerning the accuracy or completeness of such information. The contents of this
document are subject to change without notice.
Address IR inquiries to:
IR & Public Relations Department, The Pack Corporation
2-8-4 Tomigaya, Shibuya-ku, Tokyo 151-0063, Japan
Tel.: +81-3-3469-1221; fax: +81-3-3469-1353
E-mail: [email protected]
Copyright© 2026 The Pack Corporation. All Rights Reserved.
47