|
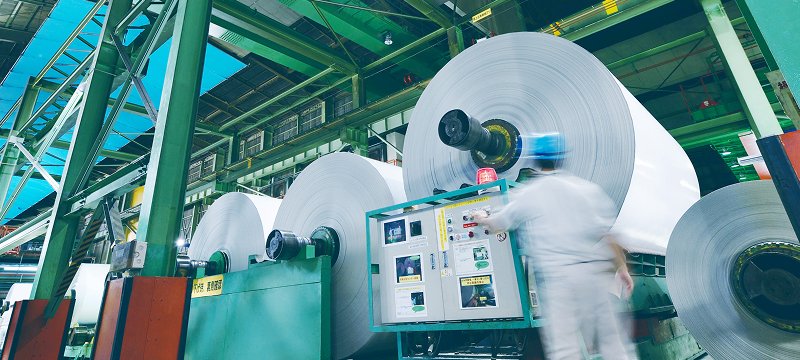
Hokuetsu Corporation is a Japanese manufacturer of pulp, paper, and packaging products. The company operates through two main business segments: Paper & Pulp and Packaging & Paper Processing. In the Paper & Pulp segment, it manufactures and sells pulp and paper products through subsidiaries including Alberta-Pacific Forest Industries Inc., Bernard Dumas S.A.S., and Hoketsu Toyo Fiber Co., Ltd., with sales facilitated by Hoketsu Paper Sales Co., Ltd. and other agents. The Packaging & Paper Processing segment involves the production and sale of paper containers, liquid containers, and processed paper products via Hoketsu Packaging Co., Ltd. and Tokutaku (Shanghai) Electric Materials Co., Ltd. The group also engages in supporting activities such as biomass fuel chip supply through Hoketsu Material Co., Ltd., engineering and construction services via Hoketsu Engineering Co., Ltd., and logistics and warehousing through Hoketsu Logistics Co., Ltd. and Hoketsu Water Transport Co., Ltd. The company serves industrial customers requiring paper-based packaging and raw paper materials, with operations spanning Japan and international markets through its foreign subsidiaries. Summarised from the annual report, fiscal year ended Mar 2026 |
Industry Paper & Paper Products | Homepage hokuetsucorp.com |
| Sector Basic Materials | IR page hokuetsucorp.com | |
|
Tags
pulp manufacturing, paper manufacturing, paper packaging, liquid containers, paper processing, biomass fuel, logistics, engineering services, Alberta-Pacific Forest Industries Inc., Bernard Dumas S.A.S., Hoketsu Toyo Fiber Co. Ltd., Hoketsu Paper Sales Co. Ltd., Hoketsu Paper Tech Niigata Co. Ltd., Hoketsu Paper Tech Kishu Co. Ltd., Hoketsu Paper Tech Katsuta Co. Ltd., Techno Hoketsu Co. Ltd., MC Hoketsu Energy Services Co. Ltd., Hoketsu Packaging Co. Ltd., Tokutaku (Shanghai) Electric Materials Co. Ltd., Nikkan Co. Ltd., Hoketsu Material Co. Ltd., Hoketsu Engineering Co. Ltd., Hoketsu Logistics Co. Ltd., Hoketsu Water Transport Co. Ltd., Hoketsu Pallet Co. Ltd.
|
Press page hokuetsucorp.com/newsrelease |
Metrics
| Valuation | |
|---|---|
| Market cap | ¥ 142.998B |
| Market cap (USD) | $ 893.745M |
| P/E | 26.11 |
| PEG | — |
| P/BV | 0.57 |
| P/S | 0.48 |
| P/OCF | 11.74 |
| P/FCF | -21.22 |
| Dividend yield | 3.0% |
| Turnover / mcap | — |
| Returns | |
|---|---|
| ROE | 2.8% |
| ROI | 2.4% |
| ROIC | 1.6% |
| Profit margin | 2.5% |
| Growth | |
|---|---|
| Revenue growing | No |
| Profits growing | No |
| Revenue up 3y | No |
| Revenue up 5y | No |
| Earnings growth 3y (net profit CAGR) | -4.3% |
| Quality | |
|---|---|
| Profitable | Yes |
| Margin expanding | No |
| Buying back stock | Yes |
| Diluting (TTM) | No |
| Debt/Equity | — |
| Podcast bulls (TTM) | Sign up |
| Podcast bears (TTM) | Sign up |
| Podcast sentiment (TTM) | Sign up |
| Podcast sentiment % (TTM) | Sign up |
| News sentiment (TTM) | 16 |
| Quality score | -44.4% |
| Insiders | |
|---|---|
| Buys, 1w | Sign up |
| Buys, 1m | Sign up |
| Buys, 1y | Sign up |
| Sells, 1w | Sign up |
| Sells, 1m | Sign up |
| Sells, 1y | Sign up |
Sign up to see this company's insider trades
| Figure | FY 2026 | FY 2025 | FY 2024 | FY 2023 | FY 2022 | FY 2021 | FY 2020 | FY 2019 | FY 2018 | FY 2017 | FY 2016 | FY 2015 | FY 2014 | FY 2013 |
|---|---|---|---|---|---|---|---|---|---|---|---|---|---|---|
| Revenue | 287.736B | 305.718B | 297.056B | 301.204B | 261.616B | 222.454B | 264.618B | 275.807B | 269.099B | 262.398B | 246.849B | 228.4B | 223.864B | 208.28B |
| Net profit | 7.299B | 15.529B | 8.396B | 8.325B | 21.206B | 14.172B | 8.072B | 9.155B | 10.327B | 10.38B | 7.476B | 8.359B | 6.105B | 8.169B |
| Free cash flow | -6.498B | 23.279B | 8.826B | -10.769B | 7.268B | 8.234B | 29.117B | 6B | 6.036B | 15.986B | 12.564B | — | — | — |
| Figure | FY 2026 | FY 2025 | FY 2024 | FY 2023 | FY 2022 | FY 2021 | FY 2020 | FY 2019 | FY 2018 | FY 2017 | FY 2016 | FY 2015 | FY 2014 | FY 2013 |
|---|---|---|---|---|---|---|---|---|---|---|---|---|---|---|
| Share price | 913.88 | 1.222K | 1.924K | 887 | 695.15 | 518.25 | 404.12 | 647.16 | 686.05 | 776.08 | 671.07 | 538.04 | 517.9 | 448.91 |
| Price performance 12m | -0.25 | -0.36 | 1.17 | 0.28 | 0.34 | 0.28 | -0.38 | -0.06 | -0.12 | 0.16 | 0.25 | 0.04 | 0.15 | — |
Filed figures
Lines the statements and their notes report beside the headline figures, read from the filings' XBRL as filed (no restatement applied), with figures computed from one filing's own lines. Cash-flow lines carry their cash direction: an outflow is negative. Each period links to its filing; a figure's period, report date and tag are in its tooltip.
| Figure | Mar 2017 | Mar 2018 | Mar 2019 | Mar 2020 | Mar 2021 | Mar 2022 | Mar 2023 | Mar 2024 | Mar 2025 | Mar 2026 |
|---|---|---|---|---|---|---|---|---|---|---|
| Balance sheet detail | ||||||||||
| Trade receivables (JPY) | 68B | 75.1B | 73.9B | 56.5B | 55.4B | 128B | 160B | 163B | 145B | 140B |
| ↳ YoY growth | +2.9% | +10.5% | -1.6% | -23.6% | -2.0% | +132.1% | +24.8% | +1.5% | -11.0% | -3.0% |
| ↳ 5y CAGR | -3.5% | +13.6% | +16.4% | +17.1% | +20.7% | +20.5% | ||||
| Borrowings, current (JPY) | 37.8B | 42.9B | 36.2B | 26.3B | 42.9B | 43.7B | 37.1B | 32.9B | 27.2B | 33B |
| Borrowings, non-current (JPY) | 78.5B | 65.1B | 73.3B | 78.5B | 69.1B | 53.5B | 64.9B | 69.7B | 60.2B | 62.9B |
| Bonds payable (JPY) | 30B | 30B | 30B | 30B | 30B | 20B | 20B | 25B | 25B | 40B |
| Lease liabilities (JPY) | 389M | 232M | 238M | 2.03B | 1.92B | 1.84B | 1.73B | 1.75B | 1.6B | 1.47B |
| Cash and deposits (JPY) | 19.5B | 14.3B | 15.2B | 21.4B | 29.8B | 30.3B | 18.1B | 22.1B | 27.6B | 30.1B |
| Intangible assets (JPY) | 3.17B | 3.09B | 2.91B | 2.98B | 2.67B | 2.41B | 2.47B | 2.54B | 3.23B | 3.6B |
| Net debt (borrowings + leases - cash) (JPY) | 97.3B | 93.9B | 94.5B | 85.4B | 84.1B | 68.8B | 85.7B | 82.2B | 61.3B | 67.2B |
| Cash flow detail | ||||||||||
| Operating cash flow (JPY) | 28.9B | 19.7B | 21.6B | 44B | 23.8B | 20.2B | 1.75B | 22.3B | 40.9B | 10.2B |
| Purchases of property, plant and equipment (JPY) | -12.9B | -13.7B | -15.6B | -14.9B | -15.5B | -12.9B | -12.5B | -13.5B | -17.7B | -16.7B |
| Change in receivables (cash effect) (JPY) | -2.34B | -6.65B | 110M | 17.6B | 980M | -11.6B | -16B | -29M | 9.11B | 1.84B |
| Change in inventories (cash effect) (JPY) | 1.66B | -3.71B | -7.11B | 801M | 6.52B | -7.46B | -5.96B | -3.08B | -1.77B | -5.41B |
| Change in payables (cash effect) (JPY) | 176M | 890M | -563M | -2.34B | -2.18B | 2.85B | 2.07B | 1.41B | 1.79B | -2B |
| Dividends paid (cash effect) (JPY) | -2.27B | -2.27B | -2.27B | -2.27B | -2.19B | -2.35B | -4.38B | -3.04B | -3.37B | -4.05B |
| Share buybacks (cash effect) (JPY) | -1M | -1M | -1M | -10.1B | 0.00 | — | — | — | -2M | -11B |
| Interest paid (cash effect) (JPY) | -670M | -761M | -720M | -605M | -349M | -396M | -730M | -868M | -772M | -724M |
| Income taxes paid (cash effect) (JPY) | -2.16B | -2.16B | -3.22B | -4.86B | -1.57B | 1.76B | -7.45B | -5.3B | -590M | -6.01B |
| Operating cash flow before change in receivables (JPY) | 31.3B | 26.4B | 21.5B | 26.4B | 22.8B | 31.8B | 17.7B | 22.3B | 31.8B | 8.35B |
| Free cash flow (OCF - PPE - intangibles) (JPY) | 16B | 6.04B | 6B | 29.1B | 8.23B | 7.27B | -10.8B | 8.83B | 23.3B | -6.5B |
| Income detail | ||||||||||
| Research and development expense (JPY) | 778M | 713M | 783M | 681M | 666M | 614M | 702M | 745M | 805M | 904M |
| ↳ 5y CAGR | -1.2% | -4.6% | -0.3% | -1.0% | +3.4% | +6.3% | ||||
| Total comprehensive income (JPY) | 13.8B | 13B | 3.21B | 677M | 16.8B | 24.1B | 13.5B | 30.3B | 17.7B | 17.5B |
| Comprehensive income to owners (JPY) | 14B | 12.8B | 3.46B | 652M | 16.7B | 24B | 13.4B | 30.3B | 17.5B | 17.4B |
| Provision for credit losses (JPY) | — | — | — | — | — | 240M | — | 2.74B | — | — |
| Credit cost ratio (credit losses / average receivables) (%) | — | — | — | — | — | 0.3% | — | 1.7% | — | — |
| Segments | ||||||||||
| Engineering · Segment revenue (JPY) | — | — | — | 7.75B | 6.92B | — | — | — | — | — |
| ↳ YoY growth | -10.7% | |||||||||
| Engineering · Segment operating income (JPY) | — | — | — | 340M | 228M | — | — | — | — | — |
| Logistics · Segment revenue (JPY) | — | — | — | 15.5B | 13B | — | — | — | — | — |
| ↳ YoY growth | -16.3% | |||||||||
| Logistics · Segment operating income (JPY) | — | — | — | -27M | -159M | — | — | — | — | — |
| Wood Material · Segment revenue (JPY) | — | — | — | 5.2B | 5.26B | — | — | — | — | — |
| ↳ YoY growth | +1.2% | |||||||||
| Wood Material · Segment operating income (JPY) | — | — | — | 283M | 317M | — | — | — | — | — |
| Reported | Jun 28, 2017 | Jun 27, 2018 | Jun 26, 2019 | Jun 29, 2021 | Jun 29, 2021 | Jun 29, 2022 | Jun 29, 2023 | Jun 27, 2024 | Jun 25, 2026 | Jun 25, 2026 |
Sign up to see institutional holdings
Sign UpPodcast Mentions
Sign up to see podcast mentions and sentiment
Sign UpFilings with EDINET (periodic reports, extraordinary reports, offerings, holding and buy-back reports), newest first, titles as filed in Japanese. The link opens the filing on EDINET. Press releases from the company's own website, newest first.

メニュー開閉
検索する
-
会社情報
-
製品情報
-
技術・研究開発
-
サステナビリティ
-
投資家情報
-
採用情報
-
会社情報
北越グループは1907年の創業以来、「こころを込めた紙づくり」を通じて社会に貢献してきました。
100年を超える歴史で培われてきたのは、すべてのステークホルダーの皆様との信頼関係に支えられた紙づくりの志です。
今後もその信頼に応えるべく、持続的成長と環境負荷の低減をさらに追求していきます。
-
製品情報
洋紙・板紙・機能材・パルプの多様な事業を展開し、確かな技術と品質で社会の幅広いニーズに応える製品を提供しています。
-
技術・研究開発
セルロースナノファイバー、電磁波対策素材、環境配慮包材の研究開発を通じて、新たな素材価値と持続可能な社会の実現に貢献します。

-
サステナビリティ
北越グループは、環境・社会・ガバナンスの取り組みと持続可能な経営を通じて、豊かな未来と価値創造を実現していきます。

-
投資家情報
持続的な企業価値向上を目指し、経営戦略・財務情報を適時・適切に開示し、透明性の高いIR活動を推進します。

-
採用情報
多様な事業フィールドで挑戦し、成長できる環境があります。ともに未来の素材産業を切り拓く人材を歓迎します。

プレスリリース・お知らせ 2022年
ローカルメニュー
-
2022年08月12日
2023年3月期第2四半期連結累計期間の連結業績予想の修正に関するお知らせ [130.9 KB] -
2022年04月08日
「生物多様性のための 30by30 アライアンス」への参加に関するお知らせ [153.4 KB]
もっと見る
-
会社情報 会社情報TOP
-
製品情報 製品情報TOP
-
技術・研究開発 技術・研究開発TOP
-
サステナビリティ サステナビリティTOP
-
投資家情報 投資家情報TOP
-
採用情報 採用情報TOP
Copyright Hokuetsu Corporation 2026, All Rights Reserved.
Prompts
Click prompts to add them under the company line, click again to take one out, then copy the result into your AI chat. Shared by Asian Century Stocks and Uncovered Thai Stocks. Thank you.
ETFs Holding Hokuetsu Corporation
Exchange-traded funds whose newest published daily portfolio holds one of the company's listings, largest weight first.
| ETF | Weight in ETF | Shares | Market value | As of |
|---|---|---|---|---|
| AVDS | 0.02% | 10,900 | $ 56.86K | Nov 16, 2026 |
| DFIS | 0.01% | 102,600 | $ 524.229K | Nov 12, 2026 |
| DXIV | 0.01% | 3,200 | $ 16.35K | Nov 12, 2026 |
| DFAX | 0.00% | 68,100 | $ 347.953K | Nov 12, 2026 |
| DFIC | 0.00% | 82,900 | $ 423.573K | Nov 12, 2026 |
| DFSI | 0.00% | 4,800 | $ 24.525K | Nov 12, 2026 |
| DFAI | 0.00% | 43,300 | $ 221.239K | Nov 12, 2026 |
| AVDE | 0.00% | 38,300 | $ 199.792K | Nov 16, 2026 |