臨時報告書(第19条第2項第19号)
Bull 0
Bear 3
Results
3853
Fiscal year ends March
Quarters are offset from the calendar — Q1 is Apr–Jun
|
ASTERIA Corporation develops and sells package software and cloud services that connect enterprise information systems, cloud platforms, and digital devices. Founded in 1998, the company operates through two segments: a software business and an investment business. The software segment offers no-code data integration middleware, digital content platforms, and mobile application creation tools. Key products include the ASTERIA Warp series for enterprise data integration, the Handbook series for managing and distributing digital content on smart devices, and the Platio series for no-code mobile app development. Newer offerings include Click, a drag-and-drop app development tool; Gravio, an AI-enabled IoT edge computing platform; Artefacts, a simulation platform for robot development; and JPYC Gateway, a stablecoin payment infrastructure. The company also provides AI adoption consulting through the AI Utilization Transformation Center. The investment segment is managed by its US-based subsidiary Asteria Vision Fund Inc., which focuses on investments in data, devices, decentralized technologies, and design. The company serves enterprise customers in Japan and international markets, with a focus on digital transformation, IoT, and generative AI integration. Summarised from the annual report, fiscal year ended Mar 2026 |
Industry Software - Application | Homepage en.asteria.com |
| Sector Technology | IR page en.asteria.com | |
|
Tags
no-code development, data integration middleware, digital content platform, mobile app creation, edge computing, robot simulation, stablecoin payments, generative ai consulting, enterprise software, cloud services, ASTERIA Warp, Handbook, Handbook X, Platio, Platio Studio, Platio Connect, Platio One, Platio Canvas, Click, Gravio, Artefacts, JPYC Gateway, AI Utilization Transformation Center, Asteria Vision Fund Inc.
|
Press page en.asteria.com/news |
Metrics
| Valuation | |
|---|---|
| Market cap | ¥ 18.698B |
| Market cap (USD) | $ 116.865M |
| P/E | 9.58 |
| PEG | — |
| P/BV | 2.01 |
| P/S | 5.27 |
| P/OCF | 36.18 |
| P/FCF | 40.25 |
| Dividend yield | 0.84% |
| Turnover / mcap | — |
| Returns | |
|---|---|
| ROE | 11.3% |
| ROI | 9.3% |
| ROIC | 10.1% |
| Profit margin | 23.6% |
| Growth | |
|---|---|
| Revenue growing | Yes |
| Profits growing | Yes |
| Revenue up 3y | No |
| Revenue up 5y | No |
| Earnings growth 3y (net profit CAGR) | — |
| Quality | |
|---|---|
| Profitable | Yes |
| Margin expanding | Yes |
| Buying back stock | No |
| Diluting (TTM) | No |
| Debt/Equity | — |
| Podcast bulls (TTM) | Sign up |
| Podcast bears (TTM) | Sign up |
| Podcast sentiment (TTM) | Sign up |
| Podcast sentiment % (TTM) | Sign up |
| News sentiment (TTM) | 17 |
| Quality score | 26.3% |
| Insiders | |
|---|---|
| Buys, 1w | Sign up |
| Buys, 1m | Sign up |
| Buys, 1y | Sign up |
| Sells, 1w | Sign up |
| Sells, 1m | Sign up |
| Sells, 1y | Sign up |
Sign up to see this company's insider trades
| Figure | FY 2026 | FY 2025 | FY 2024 | FY 2023 | FY 2022 | FY 2021 | FY 2020 | FY 2019 | FY 2018 | FY 2017 | FY 2016 | FY 2015 | FY 2014 | FY 2013 |
|---|---|---|---|---|---|---|---|---|---|---|---|---|---|---|
| Revenue | 3.389B | 3.171B | 2.909B | 3.378B | 2.968B | 2.688B | 2.677B | 3.478B | 3.11B | 1.621B | 1.592B | 1.451B | 1.488B | 1.331B |
| Net profit | 798.652M | 588.623M | -1.811B | -1.683B | 2.51B | 807.348M | -175.525M | 270.595M | 196.998M | 230.401M | 68.733M | -75.872M | 70.087M | 34.65M |
| Free cash flow | 545.916M | 816.918M | 507.277M | -157.68M | -5.391M | 757.433M | 467.842M | -116.292M | — | — | — | — | — | — |
| Figure | FY 2026 | FY 2025 | FY 2024 | FY 2023 | FY 2022 | FY 2021 | FY 2020 | FY 2019 | FY 2018 | FY 2017 | FY 2016 | FY 2015 | FY 2014 | FY 2013 |
|---|---|---|---|---|---|---|---|---|---|---|---|---|---|---|
| Share price | 1.408K | 521.11 | 689.58 | 972.55 | 972.55 | 837.47 | 313.98 | 942.97 | 1.274K | 765.06 | 1.27K | 242.76 | 242.76 | 196.11 |
| Price performance 12m | 1.7 | -0.24 | -0.29 | 0 | 0.16 | 1.67 | -0.67 | -0.26 | 0.67 | -0.4 | 4.23 | 0 | 0.24 | — |
Filed figures
Lines the statements and their notes report beside the headline figures, read from the filings' XBRL as filed (no restatement applied), with figures computed from one filing's own lines. Cash-flow lines carry their cash direction: an outflow is negative. Each period links to its filing; a figure's period, report date and tag are in its tooltip.
| Figure | Mar 2017 | Mar 2018 | Mar 2019 | Mar 2020 | Mar 2021 | Mar 2022 | Mar 2023 | Mar 2024 | Mar 2025 | Mar 2026 |
|---|---|---|---|---|---|---|---|---|---|---|
| Balance sheet detail | ||||||||||
| Trade receivables (JPY) | — | 296M | 709M | 343M | 256M | 392M | 183M | 177M | 244M | 245M |
| ↳ YoY growth | +139.7% | -51.7% | -25.2% | +52.9% | -53.4% | -3.2% | +37.9% | +0.7% | ||
| ↳ 5y CAGR | -9.2% | -24.3% | -6.6% | -0.8% | ||||||
| Borrowings, current (JPY) | — | 100M | 100M | 243M | 243M | 243M | 243M | 243M | 100M | 140M |
| Borrowings, non-current (JPY) | — | — | — | 786M | 643M | 500M | 357M | 215M | — | 525M |
| Cash and deposits (JPY) | 1.74B | 4.22B | 3.28B | 2.48B | 2.45B | 1.82B | 1.74B | 1.73B | 2.81B | 3.26B |
| Intangible assets (JPY) | — | 221M | 144M | 76M | 69.1M | 94.1M | 151M | 241M | 317M | 398M |
| Right-of-use assets (JPY) | — | — | — | — | — | 415M | 358M | 410M | 348M | 715M |
| Net debt (borrowings + leases - cash) (JPY) | — | -4.12B | -3.18B | -1.45B | -1.57B | -1.07B | -1.14B | -1.27B | -2.71B | -2.6B |
| Cash flow detail | ||||||||||
| Operating cash flow (JPY) | 267M | 853M | 34M | 503M | 776M | 58M | 235M | 630M | 829M | 571M |
| Purchases of property, plant and equipment (JPY) | — | -29.6M | -148M | -33.9M | -18.2M | -62.6M | -392M | -119M | -12.4M | -25.1M |
| Purchases of intangible assets (JPY) | — | -8.35M | -2.13M | -1.29M | -318,000 | -806,000 | -718,000 | -3.53M | — | — |
| Change in receivables (cash effect) (JPY) | — | 128M | -418M | 331M | 90.6M | -120M | 209M | -39M | -67M | -3.04M |
| Change in payables (cash effect) (JPY) | — | 14.3M | -48.1M | -16.3M | -106M | 204M | -248M | -133M | -13.1M | 186M |
| Dividends paid (cash effect) (JPY) | — | -57.4M | -101M | -66.8M | -66.9M | -75.3M | -75.5M | -109M | -75.4M | -134M |
| Share buybacks (cash effect) (JPY) | — | -213M | -596M | -131M | — | — | — | — | — | -301M |
| Interest paid (cash effect) (JPY) | — | -2.38M | -688,000 | -4.63M | -5.21M | -6.27M | -6.79M | -4.61M | -4.54M | -10.4M |
| Operating cash flow before change in receivables (JPY) | — | 725M | 452M | 172M | 685M | 178M | 25.9M | 669M | 896M | 574M |
| Free cash flow (OCF - PPE - intangibles) (JPY) | — | 815M | -116M | 468M | 757M | -5.39M | -158M | 507M | 817M | 546M |
| Income detail | ||||||||||
| Research and development expense (JPY) | — | 90.4M | 90.9M | 147M | 206M | 197M | 180M | 285M | 236M | 275M |
| ↳ 5y CAGR | +14.8% | +25.7% | +9.9% | +5.9% | ||||||
| Total comprehensive income (JPY) | — | 424M | 91.7M | -433M | 941M | 3.29B | -1.3B | -2.09B | 600M | 1.43B |
| Comprehensive income to owners (JPY) | 279M | 424M | 89.3M | -430M | 919M | 2.89B | -1.17B | -1.77B | 599M | 1.39B |
| Reported | Jun 26, 2017 | Jun 24, 2019 | Jun 24, 2019 | Jun 25, 2020 | Jun 28, 2021 | Jun 26, 2023 | Jun 26, 2023 | Jun 24, 2024 | Jun 20, 2025 | Jun 22, 2026 |
Sign up to see institutional holdings
Sign UpPodcast Mentions
Sign up to see podcast mentions and sentiment
Sign UpFilings with EDINET (periodic reports, extraordinary reports, offerings, holding and buy-back reports), newest first, titles as filed in Japanese. The link opens the filing on EDINET. Press releases from the company's own website, newest first.






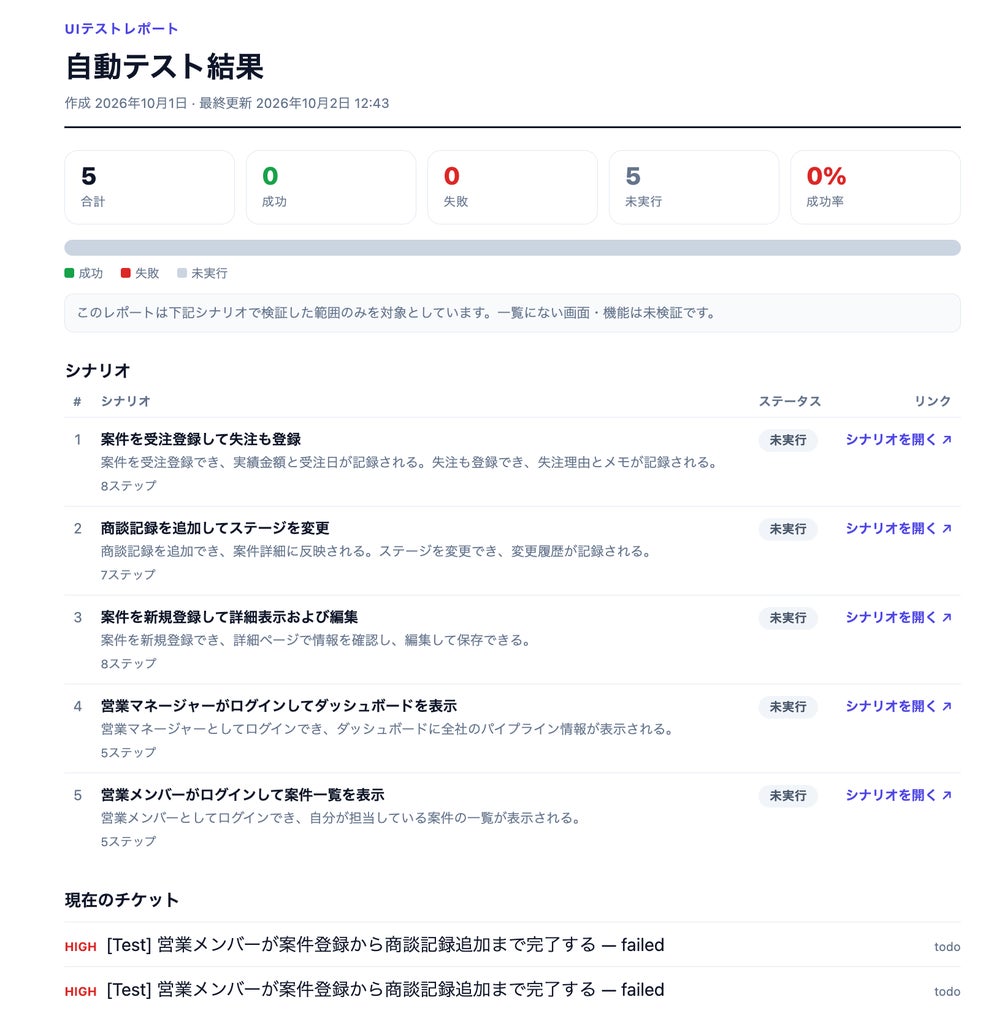
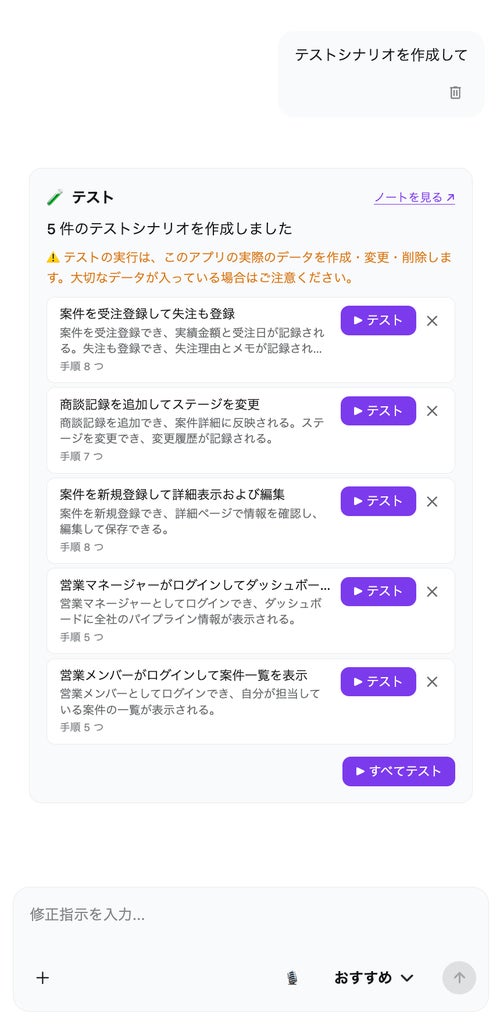









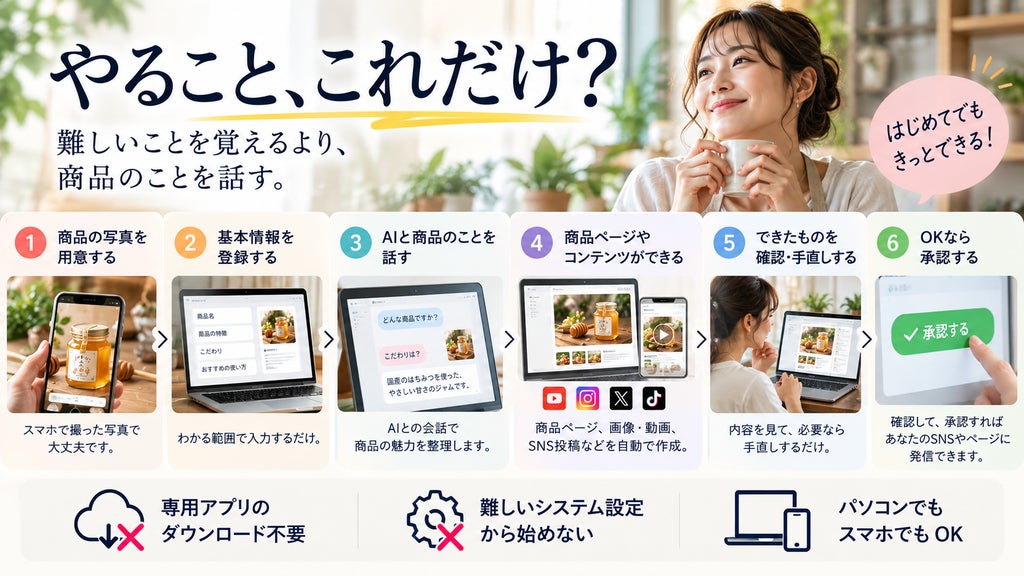




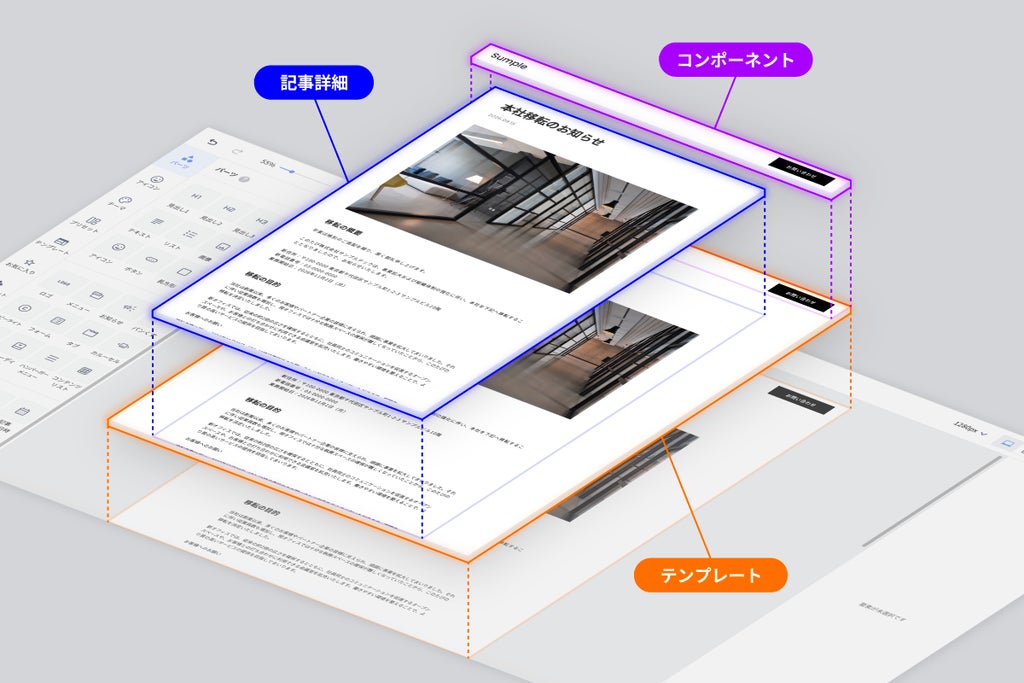























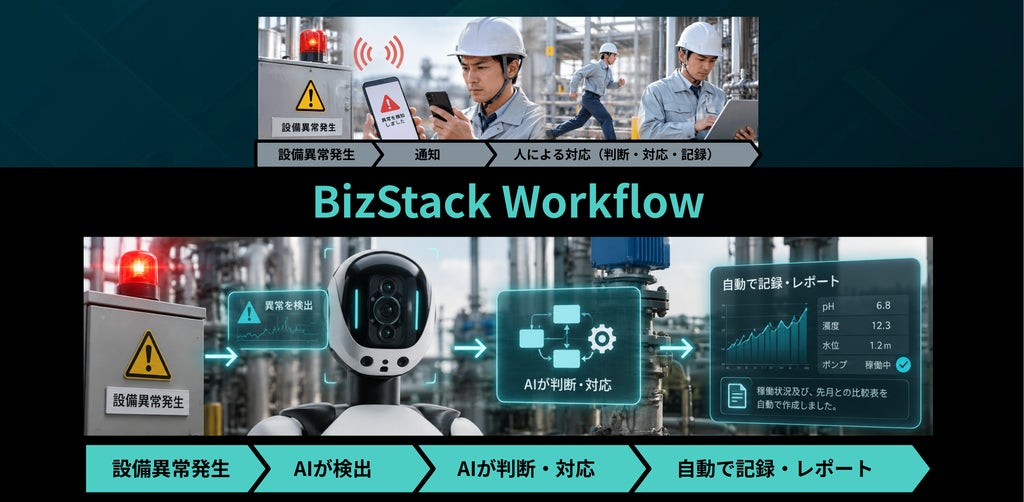















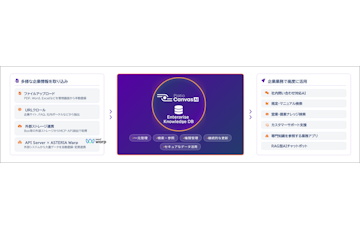
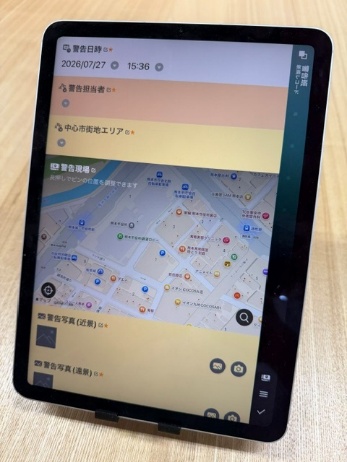 アステリアと中央復建コンサルタンツが共同提案した「ノーコードアプリを活用した放置自転車管理の効率化」が、熊本市のスマートシティ実証事業に採択された。現場向け業務アプリ「Platio」を使い、従来は紙帳票で記録していた放置自転車のパトロールや撤去情報をデジタル化する。
































 VOIX編集部 公開2026-10-14


































 ビットコイン
 イーサリアム
 ソラナ
 BNB
 XRP
 カルダノ
 チェーンリンク
 シバイヌ
 アバランチ
 ドージコイン






 印刷 / PDF
 URLをコピー


























 初心者におすすめのクレジットカード特集
 PayPay あと払い(ペイペイ あと払い)のデメリットとは?
 楽天カード2枚目のデメリットとは? 楽天カード2枚目 キャンペーンも実施中
 【2026年9月最新】プレスリリース無料 配信サイト&PR配信サービス おすすめ34選と効果的な使い方
 三井住友カードナンバーレスの審査と還元率を評判や口コミから分析
 イオンカードは映画が1100円!イオンシネマなら同伴者も映画が割引きされる方法がスゴイ!






















Prompts
Click prompts to add them under the company line, click again to take one out, then copy the result into your AI chat. Shared by Asian Century Stocks and Uncovered Thai Stocks. Thank you.
ASTERIA Corporation (ticker 3853), listed in Japan.
Copied
ETFs Holding ASTERIA Corporation
Exchange-traded funds whose newest published daily portfolio holds one of the company's listings, largest weight first.
| ETF | Weight in ETF | Shares | Market value | As of |
|---|---|---|---|---|
| AVDV | 0.00% | 13,100 | $ 68.84K | Nov 16, 2026 |