臨時報告書(第19条第2項第9号の2)
Bull 0
Bear 0
Routine
Fiscal year ends July
Quarters are offset from the calendar — Q1 is Aug–Oct
|
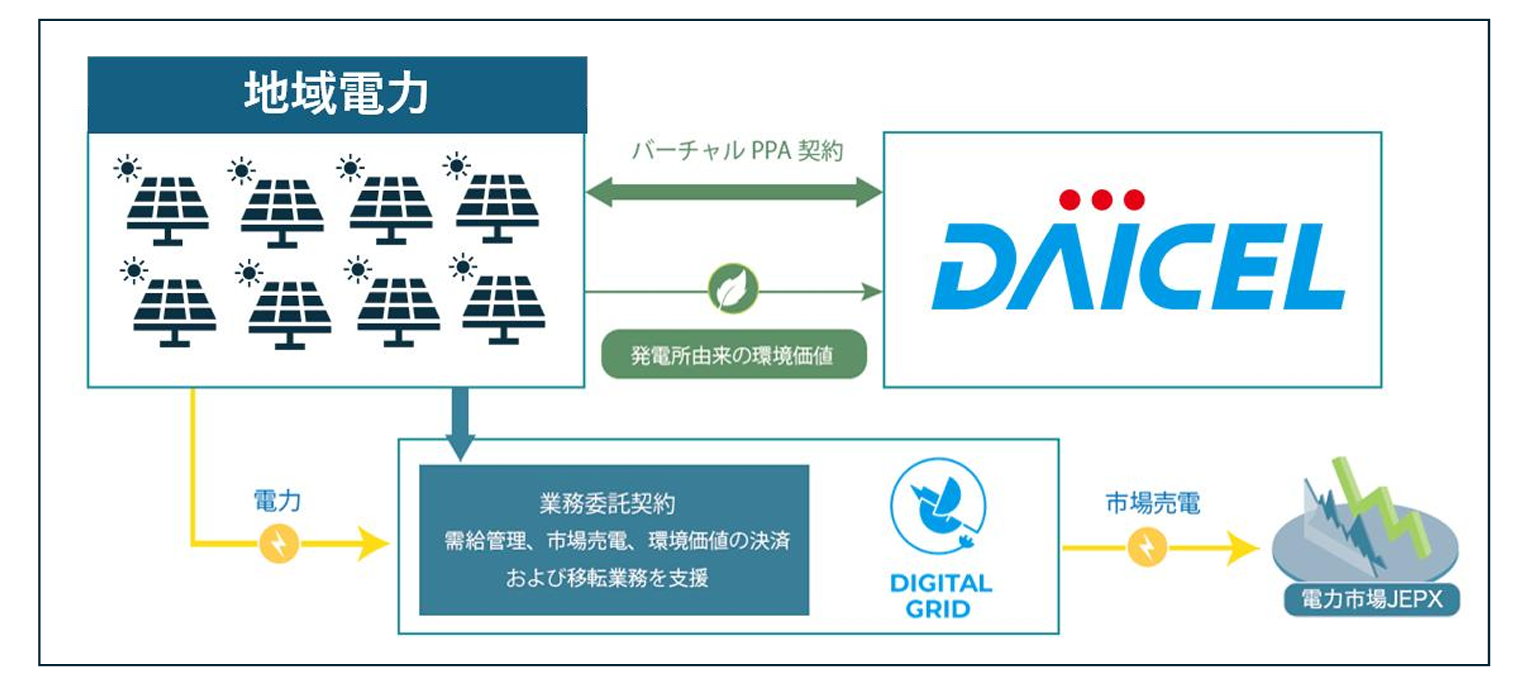
Digital Grid operates a digital electricity trading platform in Japan that enables direct transactions between power generators and consumers. The company provides DGP, a system that handles supply-demand management, contract execution, and settlement, allowing users to trade electricity without requiring a retail license or specialized expertise. Its business is divided into three segments: the electricity platform business for non-renewable power, the renewable energy platform business, and other services. In the renewable energy segment, the company offers RE Bridge, a matching platform for corporate power purchase agreements, and Eco no Hashi, a service for procuring FIT non-fossil certificates. It also provides Green Purchase Agreement (GPA) services for virtual power purchase agreements. The company manages grid-connected stationary batteries through its subsidiary Digital Grid Asset Management, offering aggregation services for revenue in wholesale, supply-demand adjustment, and capacity markets. Additionally, it provides GX navi, an online learning platform for decarbonization, and handles spot trading of J-Credits and other environmental value certificates. Digital Grid collaborates with the University of Tokyo on AI models for power generation forecasting and works with major electric utility companies for renewable energy supply outside their service areas. Summarised from the annual report, fiscal year ended Jul 2025 |
Industry Utilities - Independent Power Producers | Homepage digitalgrid.com |
| Sector Utilities | IR page — | |
|
Tags
electricity trading platform, renewable energy, power purchase agreements, virtual ppa, corporate ppa, non-fossil certificates, grid-connected batteries, energy storage, supply-demand management, electricity market, decarbonization education, j-credits, DGP, RE Bridge, Eco no Hashi, GPA, Green Purchase Agreement, GX navi, Digital Grid Asset Management
|
Press page — |
Metrics
| Valuation | |
|---|---|
| Market cap | ¥ 28.354B |
| Market cap (USD) | $ 177.215M |
| P/E | 13.35 |
| PEG | 0.29 |
| P/BV | 2.69 |
| P/S | 3.99 |
| P/OCF | -15.33 |
| P/FCF | -4.58 |
| Dividend yield | — |
| Turnover / mcap | — |
| Returns | |
|---|---|
| ROE | 21.7% |
| ROI | 10.4% |
| ROIC | 10.7% |
| Profit margin | 28.6% |
| Growth | |
|---|---|
| Revenue growing | Yes |
| Profits growing | Yes |
| Revenue up 3y | Yes |
| Revenue up 5y | Yes |
| Earnings growth 3y (net profit CAGR) | 45.8% |
| Quality | |
|---|---|
| Profitable | Yes |
| Margin expanding | No |
| Buying back stock | No |
| Diluting (TTM) | — |
| Debt/Equity | — |
| Podcast bulls (TTM) | Sign up |
| Podcast bears (TTM) | Sign up |
| Podcast sentiment (TTM) | Sign up |
| Podcast sentiment % (TTM) | Sign up |
| News sentiment (TTM) | 0 |
| Quality score | 37.5% |
| Insiders | |
|---|---|
| Buys, 1w | Sign up |
| Buys, 1m | Sign up |
| Buys, 1y | Sign up |
| Sells, 1w | Sign up |
| Sells, 1m | Sign up |
| Sells, 1y | Sign up |
Sign up to see this company's insider trades
Filed figures
Lines the statements and their notes report beside the headline figures, read from the filings' XBRL as filed (no restatement applied), with figures computed from one filing's own lines. Cash-flow lines carry their cash direction: an outflow is negative. Each period links to its filing; a figure's period, report date and tag are in its tooltip.
| Figure | Jul 2024 | Jul 2025 | Jul 2026 |
|---|---|---|---|
| Balance sheet detail | |||
| Trade receivables (JPY) | — | 1.32B | 2.12B |
| ↳ YoY growth | +60.8% | ||
| Other receivables (JPY) | — | 9.77B | 15.2B |
| Borrowings, current (JPY) | — | 614M | 8.02B |
| Borrowings, non-current (JPY) | — | 999M | 1.27B |
| Cash and deposits (JPY) | 3.98B | 4.65B | 6.3B |
| Intangible assets (JPY) | — | 40.3M | 37.2M |
| Net debt (borrowings + leases - cash) (JPY) | — | -3.04B | 3B |
| Cash flow detail | |||
| Operating cash flow (JPY) | -1.33B | 321M | -1.85B |
| Purchases of property, plant and equipment (JPY) | — | -93.8M | -4.34B |
| Purchases of intangible assets (JPY) | — | -36.9M | — |
| Change in receivables (cash effect) (JPY) | — | -5.32B | -6.19B |
| Change in payables (cash effect) (JPY) | — | 221M | 1.72B |
| Interest paid (cash effect) (JPY) | — | -80.4M | -78.9M |
| Income taxes paid (cash effect) (JPY) | — | -150M | -1.17B |
| Operating cash flow before change in receivables (JPY) | — | 5.64B | 4.34B |
| Free cash flow (OCF - PPE - intangibles) (JPY) | — | 191M | -6.19B |
| Income detail | |||
| Research and development expense (JPY) | 88.7M | 101M | 85.7M |
| Total comprehensive income (JPY) | — | 1.87B | 2.04B |
| Comprehensive income to owners (JPY) | — | 1.87B | 2.04B |
| Provision for credit losses (JPY) | 8.37M | 41.9M | 119M |
| Credit cost ratio (credit losses / average receivables) (%) | — | — | 0.8% |
| Segments | |||
| Power PF Business · Segment revenue (JPY) | — | 5.42B | 5.88B |
| ↳ YoY growth | +8.6% | ||
| Power PF Business · Segment operating income (JPY) | — | 3.53B | 3.5B |
| REPF Business · Segment revenue (JPY) | — | 449M | 711M |
| ↳ YoY growth | +58.5% | ||
| REPF Business · Segment operating income (JPY) | — | 120M | 370M |
| Reported | Oct 30, 2025 | Oct 30, 2025 | Oct 28, 2026 |
Sign up to see institutional holdings
Sign UpPodcast Mentions
Sign up to see podcast mentions and sentiment
Sign UpFilings with EDINET (periodic reports, extraordinary reports, offerings, holding and buy-back reports), newest first, titles as filed in Japanese. The link opens the filing on EDINET. Press releases from the company's own website, newest first.
Prompts
Click prompts to add them under the company line, click again to take one out, then copy the result into your AI chat. Shared by Asian Century Stocks and Uncovered Thai Stocks. Thank you.
DIGITAL GRID Corporation (ticker 350A), listed in Japan.
Copied