訂正報告書(大量保有報告書・変更報告書)(樋口 龍)
Bull 0
Bear 0
Routine
Fiscal year ends October
Quarters are offset from the calendar — Q1 is Nov–Jan
|
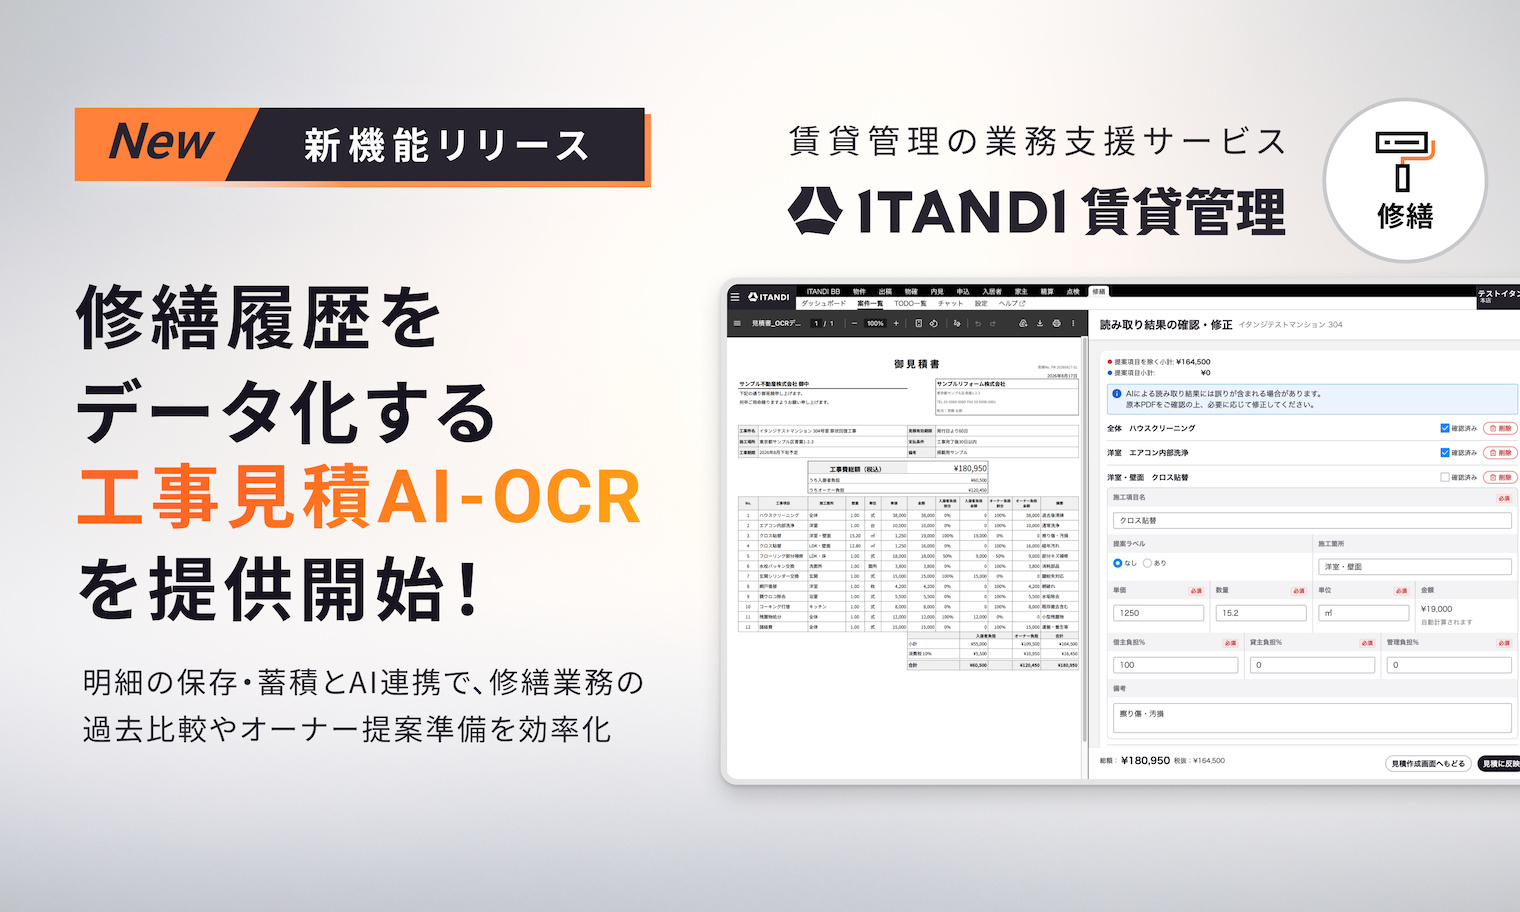
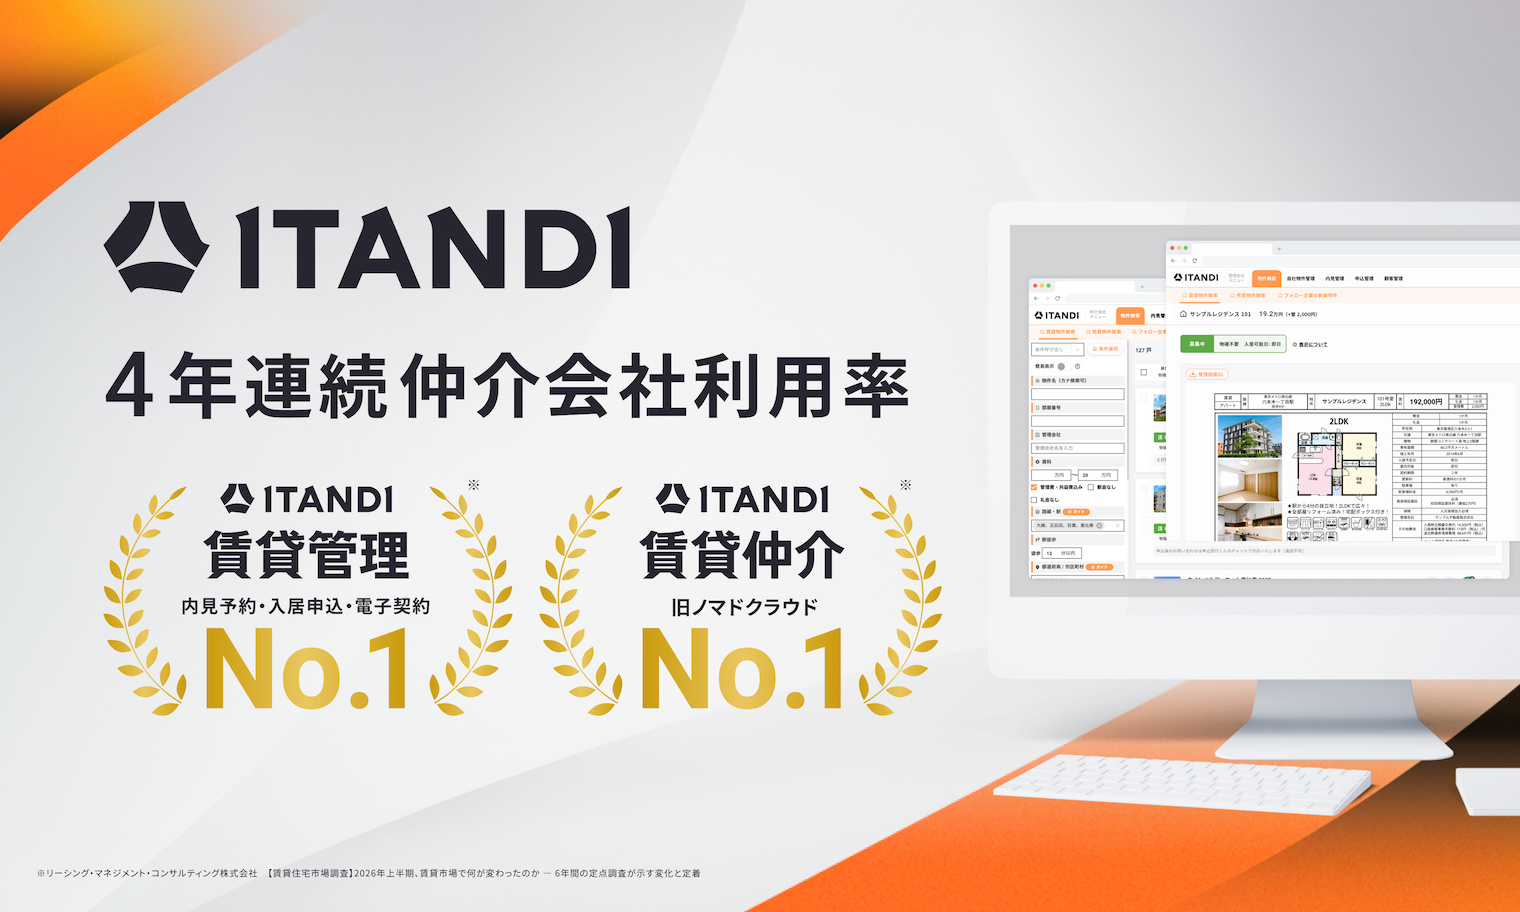
GAtechnologies Co., Ltd. is a real estate technology company operating through three main business segments. The RENOSY Marketplace segment provides AI-driven real estate investment services, including purchase and sale digitalization, high-end rental brokerage, and one-stop US real estate investment services. It also operates subscription-based property management plans, a rental platform for Japanese expatriates in Thailand called dearlife by RENOSY, and a real estate platform for investors in the Chinese-speaking region named Shinkyo Byousan. The ITANDI segment offers business support systems for real estate agents and management companies, including SaaS products for rental management, brokerage matching, and sales support, as well as industry data platforms. The Other segment provides industry-specialized M&A brokerage and consulting services. Key subsidiaries include Partners, RENOSY Ricordi, Modern Standard, RW OpCo, LLC, RENOSY ASSET MANAGEMENT, Core Asset Management, RENOSY(Thailand) Co., Ltd., Shinkyo Byousan, ITANDI, Dangonet, Housmart, Mercury, and Spica Consulting. Summarised from the annual report, fiscal year ended Oct 2025 |
Industry Real Estate Services | Homepage ga-tech.co.jp |
| Sector Real Estate | IR page ga-tech.co.jp | |
|
Tags
real estate technology, property management, real estate brokerage, saas, m&a brokerage, us real estate, high-end rentals, ai scoring, digital marketplace, data platform, RENOSY, dearlife by RENOSY, ITANDI, ITANDI BB, PropoCloud, MODERN STANDARD, Partners, RENOSY Ricordi, RW OpCo LLC, RENOSY ASSET MANAGEMENT, Core Asset Management, RENOSY(Thailand) Co. Ltd., Dangonet, Housmart, Mercury, Spica Consulting
|
Press page ga-tech.co.jp/news |
Metrics
| Valuation | |
|---|---|
| Market cap | ¥ 52.795B |
| Market cap (USD) | $ 329.97M |
| P/E | 14.22 |
| PEG | 0.12 |
| P/BV | 1.57 |
| P/S | 0.19 |
| P/OCF | 10.47 |
| P/FCF | 11.74 |
| Dividend yield | 0.62% |
| Turnover / mcap | — |
| Returns | |
|---|---|
| ROE | 14.2% |
| ROI | 12.4% |
| ROIC | 14.7% |
| Profit margin | 1.6% |
| Growth | |
|---|---|
| Revenue growing | Yes |
| Profits growing | Yes |
| Revenue up 3y | Yes |
| Revenue up 5y | Yes |
| Earnings growth 3y (net profit CAGR) | 114.3% |
| Quality | |
|---|---|
| Profitable | Yes |
| Margin expanding | Yes |
| Buying back stock | No |
| Diluting (TTM) | No |
| Debt/Equity | — |
| Podcast bulls (TTM) | Sign up |
| Podcast bears (TTM) | Sign up |
| Podcast sentiment (TTM) | Sign up |
| Podcast sentiment % (TTM) | Sign up |
| News sentiment (TTM) | 39 |
| Quality score | 47.4% |
| Insiders | |
|---|---|
| Buys, 1w | Sign up |
| Buys, 1m | Sign up |
| Buys, 1y | Sign up |
| Sells, 1w | Sign up |
| Sells, 1m | Sign up |
| Sells, 1y | Sign up |
Sign up to see this company's insider trades
| Figure | FY 2025 | FY 2024 | FY 2023 | FY 2022 | FY 2021 | FY 2020 | FY 2019 | FY 2018 | FY 2017 | FY 2016 | FY 2015 | FY 2014 |
|---|---|---|---|---|---|---|---|---|---|---|---|---|
| Revenue | 248.947B | 189.883B | 146.647B | 113.569B | 85.388B | 63.07B | 39.286B | 20.127B | 9.557B | 5.373B | 3.187B | 703.722M |
| Net profit | 3.89B | 1.841B | 1.01B | 395M | -1.269B | 903M | 510.213M | 399.198M | 258M | -133M | 43.379M | 27.098M |
| Free cash flow | 15.635B | 1.645B | 5.141B | 1.127B | -1.693B | 1B | -384.138M | -110.287M | 375.266M | — | — | — |
Filed figures
Lines the statements and their notes report beside the headline figures, read from the filings' XBRL as filed (no restatement applied), with figures computed from one filing's own lines. Cash-flow lines carry their cash direction: an outflow is negative. Each period links to its filing; a figure's period, report date and tag are in its tooltip.
| Figure | Oct 2017 | Oct 2018 | Oct 2019 | Oct 2020 | Oct 2021 | Oct 2022 | Oct 2023 | Oct 2024 | Oct 2025 |
|---|---|---|---|---|---|---|---|---|---|
| Balance sheet detail | |||||||||
| Trade receivables (JPY) | 885,000 | 3.44M | 37.7M | 147M | 284M | 667M | 867M | 1.25B | 1.29B |
| ↳ YoY growth | +288.7% | +996.9% | +289.6% | +134.9% | +30.0% | +44.5% | +2.6% | ||
| Borrowings, current (JPY) | 74.7M | 354M | 875M | 2.49B | 3.5B | 5.92B | 10.4B | 14.1B | 12.5B |
| Borrowings, non-current (JPY) | 155M | 423M | 2.33B | 4.49B | 3.04B | 2.94B | 4.5B | 9.28B | 9.99B |
| Bonds payable (JPY) | — | — | 190M | 2.15B | 2.46B | — | — | — | — |
| Lease liabilities (JPY) | 26.8M | 24M | 256M | 207M | 19.6B | 19.9B | 15.4B | 14.7B | 6.3B |
| Cash and deposits (JPY) | 461M | 2.02B | 4.28B | 6.39B | 15.3B | 11.8B | 17.5B | 19.3B | 30.4B |
| Intangible assets (JPY) | 116M | 637M | 4.33B | 7.37B | 3.45B | 3.58B | 4.46B | 4.74B | 7.17B |
| Right-of-use assets (JPY) | — | — | — | — | 1.77B | 2.43B | 1.86B | 2.46B | 1.91B |
| Net debt (borrowings + leases - cash) (JPY) | -204M | -1.22B | -818M | 806M | 10.8B | 16.9B | 12.9B | 18.8B | -1.59B |
| Cash flow detail | |||||||||
| Operating cash flow (JPY) | 467M | 479M | 1.24B | 2.31B | 2.59B | 2.24B | 6.8B | 3.64B | 15.9B |
| Purchases of property, plant and equipment (JPY) | -23.4M | -118M | -425M | -212M | -227M | -259M | -322M | -405M | -300M |
| Purchases of intangible assets (JPY) | -68.3M | -471M | -1.19B | -1.1B | -987M | -852M | -1.34B | -1.59B | -1.93B |
| Change in receivables (cash effect) (JPY) | -3.44M | -7.09M | -13.6M | -87M | -78M | -206M | -208M | 2M | -27M |
| Change in inventories (cash effect) (JPY) | 69.4M | -338M | -257M | -420M | -1.31B | -4.48B | -2.13B | -3.76B | 2.27B |
| Change in payables (cash effect) (JPY) | 14.2M | 7.79M | — | — | 314M | 455M | 1.38B | -177M | 2.82B |
| Share buybacks (cash effect) (JPY) | — | — | -347,000 | 0.00 | 0.00 | — | — | — | — |
| Interest paid (cash effect) (JPY) | -7.53M | -9.91M | -55.3M | -66M | -207M | -288M | -308M | -476M | -732M |
| Income taxes paid (cash effect) (JPY) | 15.4M | -136M | -279M | -517M | -1.09B | — | — | — | — |
| Operating cash flow before change in receivables (JPY) | 471M | 486M | 1.25B | 2.4B | 2.66B | 2.44B | 7.01B | 3.63B | 16B |
| Free cash flow (OCF - PPE - intangibles) (JPY) | 376M | -110M | -384M | 1B | 1.37B | 1.13B | 5.14B | 1.65B | 13.7B |
| Income detail | |||||||||
| Research and development expense (JPY) | 39.9M | 50.3M | 16.5M | 5M | 47M | 135M | 184M | 216M | 285M |
| Total comprehensive income (JPY) | — | — | 506M | 893M | -1.04B | 462M | 1.14B | 2.07B | 3.81B |
| Comprehensive income to owners (JPY) | — | — | 506M | 893M | -1.04B | 462M | 1.14B | 2.06B | 3.68B |
| Reported | Jan 30, 2019 | Jan 30, 2019 | Jan 29, 2020 | Jan 29, 2021 | Jan 27, 2023 | Jan 27, 2023 | Jan 26, 2024 | Jan 30, 2025 | Jan 28, 2026 |
Sign up to see institutional holdings
Sign UpPodcast Mentions
Sign up to see podcast mentions and sentiment
Sign UpTimely disclosures published on TDnet, newest first, titles as filed in Japanese. The link opens the disclosure on TDnet. Filings with EDINET (periodic reports, extraordinary reports, offerings, holding and buy-back reports), newest first, titles as filed in Japanese. The link opens the filing on EDINET. Press releases from the company's own website, newest first.
訂正報告書(大量保有報告書・変更報告書)(樋口 龍)
Bull 0
Bear 0
Routine
上席執行役員 CSO(Chief Strategy Officer) | 田中 正道(たなか まさみち)
Bull 1
Bear 0
Management

<プロフィール> キヤノン株式会社にて半導体エンジニアとしてドイツおよびイタリアに4年間赴任。その後、ソニー株式会社にて10年間にわたり商品企画や技術企画に従事したのち、日本マイクロソフト株式会社にてエバンジェリストを3年間経験。この間、夜間で青山学院大学大学院(MBA)を修了。その後、シアトルでコンサルファームを起業し、PwC USに売却。同日本支社を株式会社ウフルに売却し、ウフルの取締役CSOとしてIoTプラットフォーム開発とビジネス責任者を7年間務める。その後、アマゾンウェブサービスジャパン(AWS)にてHead of Spatial Computing技術ドメイン責任者、およびSr. Principalとして複数の超大型コンサルプロジェクトの責任者を歴任。2026年11月、当社上席執行役員CSOに就任。
<略歴>
| 1996年06月 | キヤノン株式会社 入社 |
| 2000年06月 | ソニー株式会社 入社 |
| 2006年03月 | 日本マイクロソフト株式会社 入社 |
| 2008年07月 | ソニー株式会社 再入社 |
| 2009年03月 | 青山学院大学大学院(MBA)修了 |
| 2010年10月 | シアトルにてコンサルファーム「Ant's Eye View」を共同起業 |
| 2012年09月 | 「Ant's Eye View」をPwC米国へ売却 |
| 2013年03月 | 株式会社ウフル 取締役CSO 就任 |
| 2022年07月 | アマゾンウェブサービスジャパン(AWS)入社 |
| 2026年11月 | 株式会社GA technologies 執行役員CSO 就任 |
<就任コメント> GA technologiesグループの中長期的な成長と企業価値向上に向け、上席執行役員 CSOとして経営に参画できることを大変光栄に思います。これまで培ってきたIT・AI領域での事業開発および戦略立案の経験を活かし、グループ全体のAI戦略の推進とRENOSYマーケットプレイス事業の進化に全力を注いでまいります。テクノロジーの力で事業と組織を大きく前進させ、ステークホルダーの皆様のご期待に応えてまいります。
執行役員 SVP of Real Estate Finance | 成田 友樹(なりた ゆうき)

<プロフィール> 住友不動産販売株式会社(現 住友不動産ステップ株式会社)にて法人向け不動産仲介を経験後、株式会社三井住友銀行にて約9年間不動産ファイナンス業務(ノンリコースローン組成・実行、アセットマネジメント会社への出向等)に従事。東急不動産株式会社都市事業本部でのオフィスビル・商業施設用地の取得・開発を経て、2020年より運用資産10兆円を超える物流不動産ファンド・日本GLP株式会社の財務部長として開発ファンドおよびインカムファンドの資金調達全般を統括。2026年11月、当社執行役員 SVP of Real Estate Financeに就任。
<略歴>
| 2003年4月 | 住友不動産販売株式会社 入社 |
| 2006年6月 | 株式会社三井住友銀行 入行 |
| 2015年4月 | 東急不動産株式会社 入社 |
| 2020年11月 | 日本GLP株式会社 入社 |
| 2026年11月 | 株式会社GA technologies 執行役員 SVP of Real Estate Finance 就任 |
<就任コメント> このたび、執行役員 SVP of Real Estate Financeに就任することを大変身の引き締まる思いで受け止めております。金融機関・デベロッパー・ファンドで培った不動産ファイナンスの知見とネットワークを最大限に活かし、ファンド事業の成長加速と持続可能な財務基盤の構築に尽力いたします。不動産と金融の融合を通じてRENOSYの更なる発展に貢献してまいります。
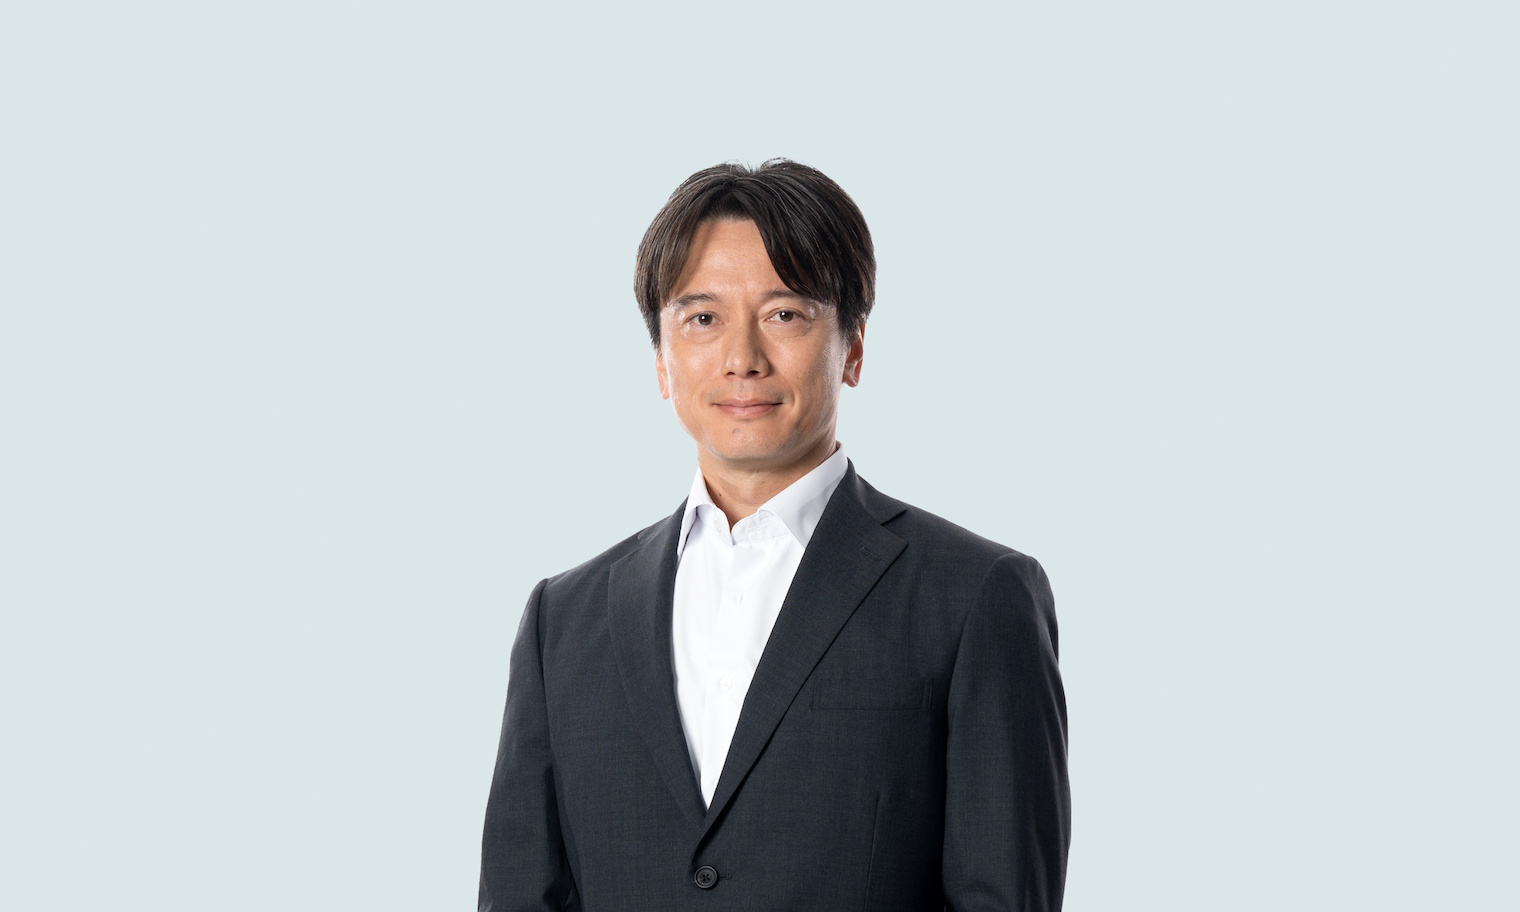
◆ GA technologies 代表取締役 社長執行役員 CEO 樋口 龍のコメント
この度、当社の上席執行役員 CSOとして田中氏、執行役員 SVP of Real Estate Financeとして成田氏の2名を新たに経営陣として迎えられたことを大変心強く感じております。
新体制では、国内大手IT・メガテック企業において最先端技術を活用した事業企画の経験を持ち、企業経営においても豊富な実績を有する田中氏が上席執行役員 CSOに就任します。田中氏は、グループ全体のAI戦略の策定を担うとともに、既存の事業・組織・業務プロセスをゼロベースで再設計し、AIを基軸とした企業への抜本的な変革をリードします。また、AIを活用した新たな顧客体験の創出や事業モデルの進化を推進し、グループ全体の生産性向上と持続的な成長の実現を目指します。
また成田氏は、金融機関・不動産開発・グローバルファンドの財務責任者という、まさに今のRENOSYに必要な実績を持ち、当社のファンド事業推進と財務基盤の高度化を牽引してくれると確信しております。
当社グループはさらなる高みを目指す成長フェーズにあり、新体制のもと、グループ一丸となって企業価値の向上に邁進してまいります。
関連ニュース
- [

GA technologies、東京証券取引所「プライム市場」に上場市場区分を変更
-
プレスリリース コーポレート](https://www.ga-tech.co.jp/news/e0ggmkfju8c03350/)
-
[
GA technologies、グループ間シナジーを加速。マーキュリーの不動産ビッグデータを「モダンスタンダード」に連携
-
プレスリリース コーポレート](https://www.ga-tech.co.jp/news/xu0eoixb6nufyg2o/)
-
[
GA technologiesのデータ人材が「Snowflake World Tour Tokyo 2026」にて2セッションに登壇
-
プレスリリース コーポレート](https://www.ga-tech.co.jp/news/5vc1yoh7r4p0c37/)
-
[
GA technologies、植松 隆が上席執行役員に就任
-
プレスリリース コーポレート](https://www.ga-tech.co.jp/news/7a54ptfd7zbgdiv/)
-
[
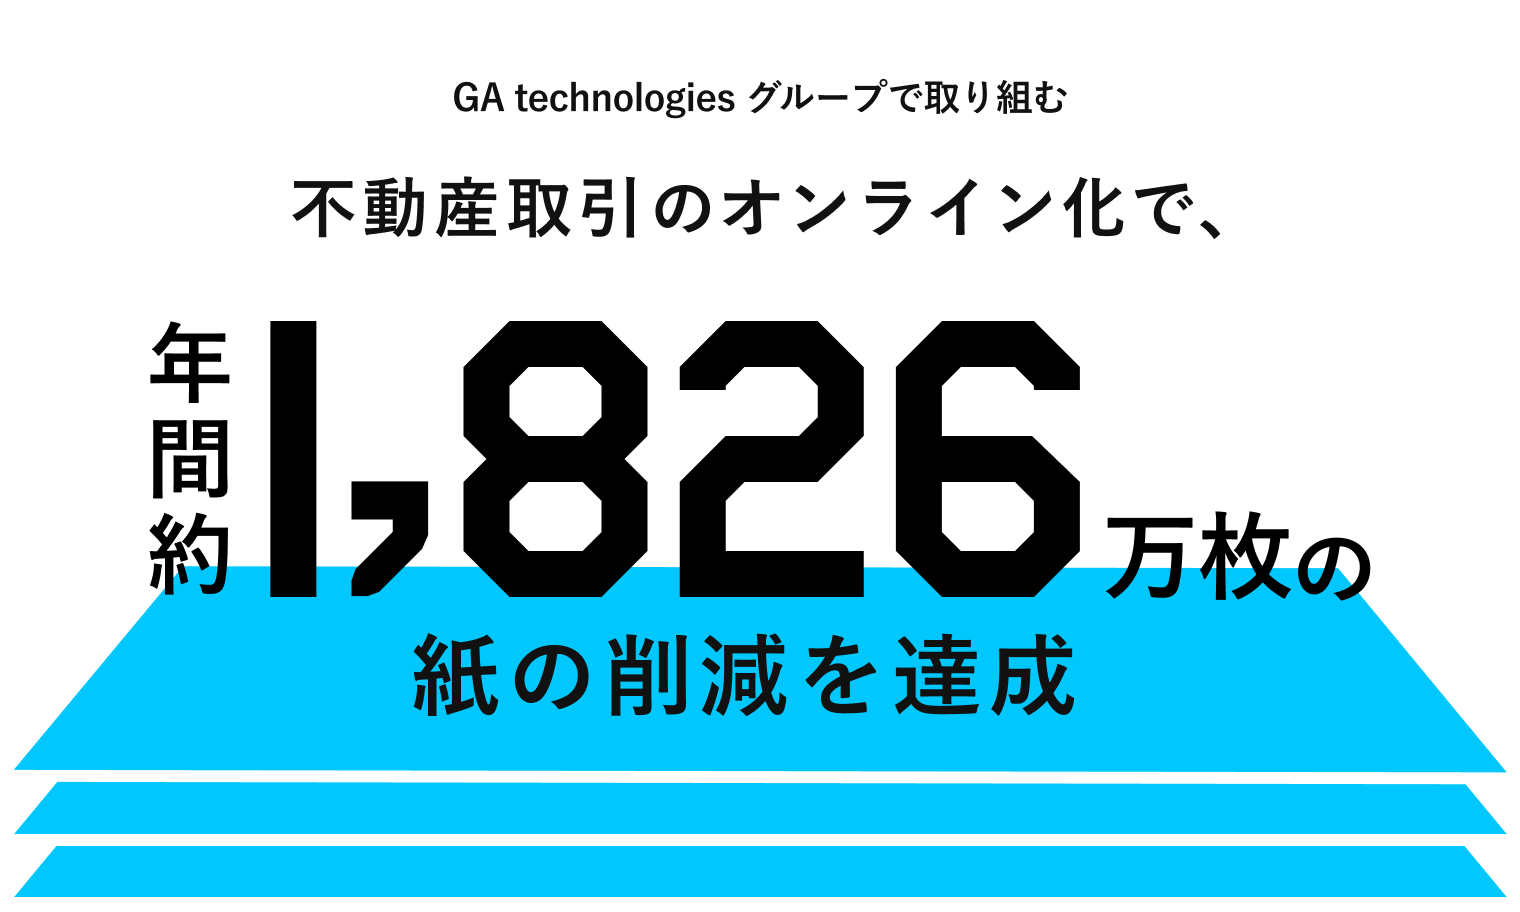
GA technologies、不動産取引のオンライン化で年間1,826万枚の紙の削減を達成
-
プレスリリース コーポレート](https://www.ga-tech.co.jp/news/dy82npm2tyfefbz/)
-
[
エスピーシー証券株式会社の株式取得に関するお知らせ
- プレスリリース コーポレート](https://www.ga-tech.co.jp/news/8ziu0mv6w4pt193w/)
株式会社GA technologies
不動産領域
M&A領域
株主・投資家の皆さまへ
IRライブラリ
ESG・サステナビリティ情報
株式について
その他情報
-
日本語
-
English












Prompts
Click prompts to add them under the company line, click again to take one out, then copy the result into your AI chat. Shared by Asian Century Stocks and Uncovered Thai Stocks. Thank you.
GAtechnologies Co., Ltd. (ticker 3491), listed in Japan.
Copied
ETFs Holding GAtechnologies Co., Ltd.
Exchange-traded funds whose newest published daily portfolio holds one of the company's listings, largest weight first.
| ETF | Weight in ETF | Shares | Market value | As of |
|---|---|---|---|---|
| DXIV | 0.01% | 2,900 | $ 26.824K | Nov 12, 2026 |
| DFIS | 0.01% | 50,074 | $ 463.161K | Nov 12, 2026 |
| DFIC | 0.00% | 47,300 | $ 437.503K | Nov 12, 2026 |
| DFSI | 0.00% | 3,200 | $ 29.599K | Nov 12, 2026 |
| DFAX | 0.00% | 21,900 | $ 202.565K | Nov 12, 2026 |
| DFAI | 0.00% | 21,508 | $ 198.939K | Nov 12, 2026 |
| AVSD | 0.00% | 1,100 | $ 10.047K | Nov 16, 2026 |
| AVDS | 0.00% | 300 | $ 2,740.06 | Nov 16, 2026 |