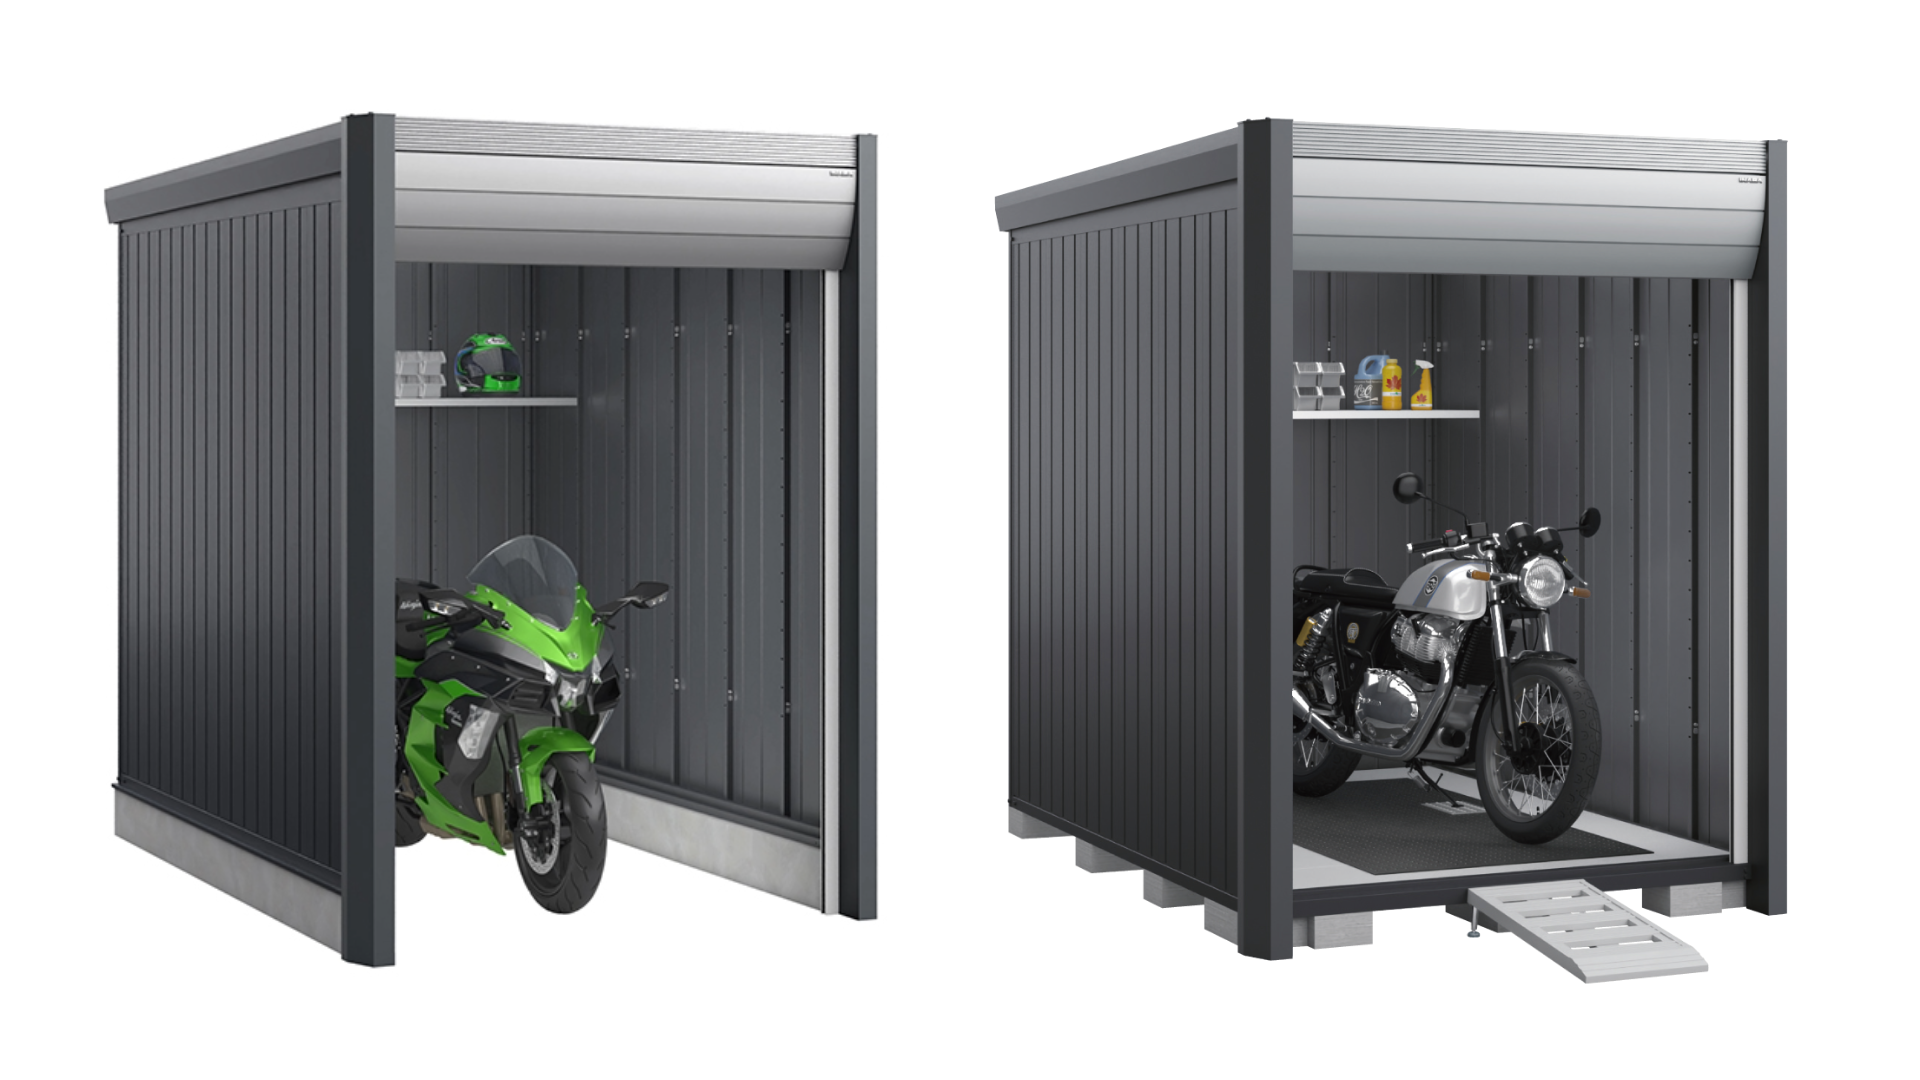
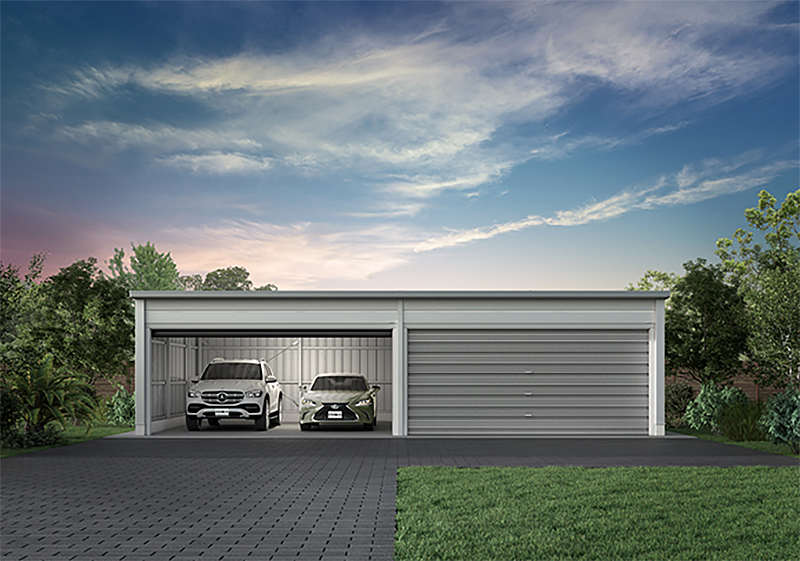
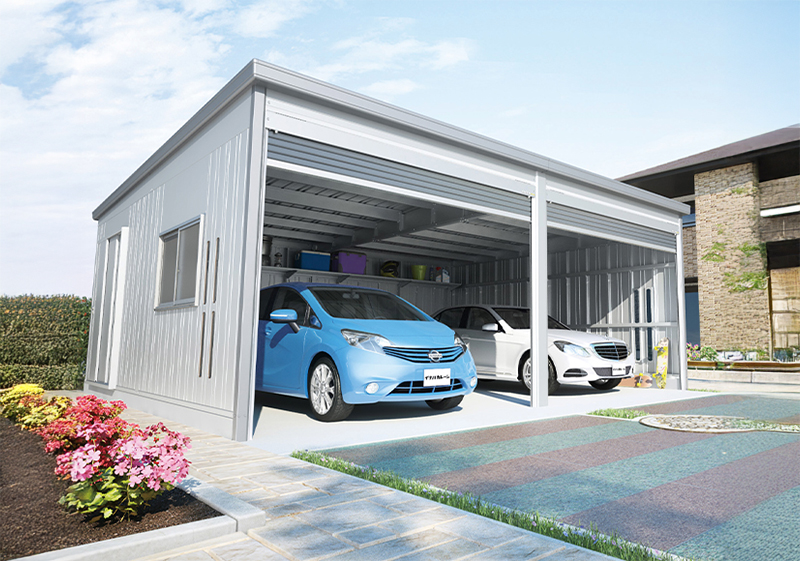
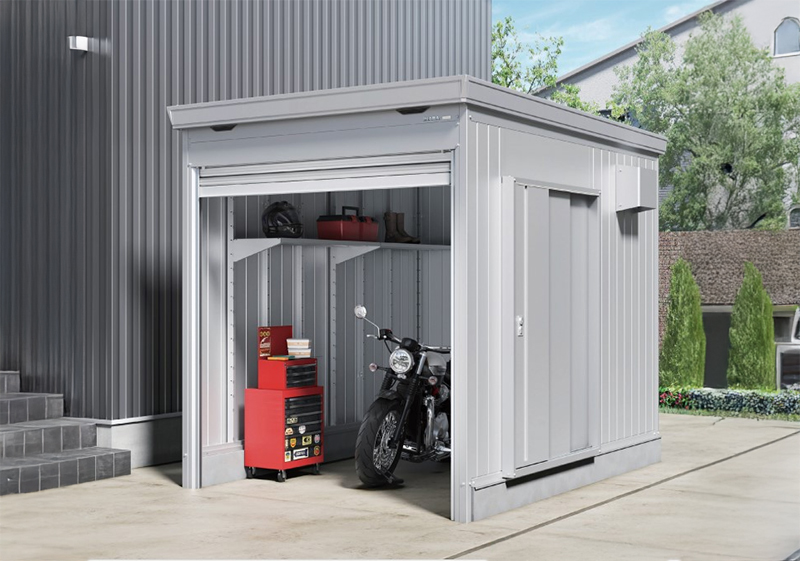
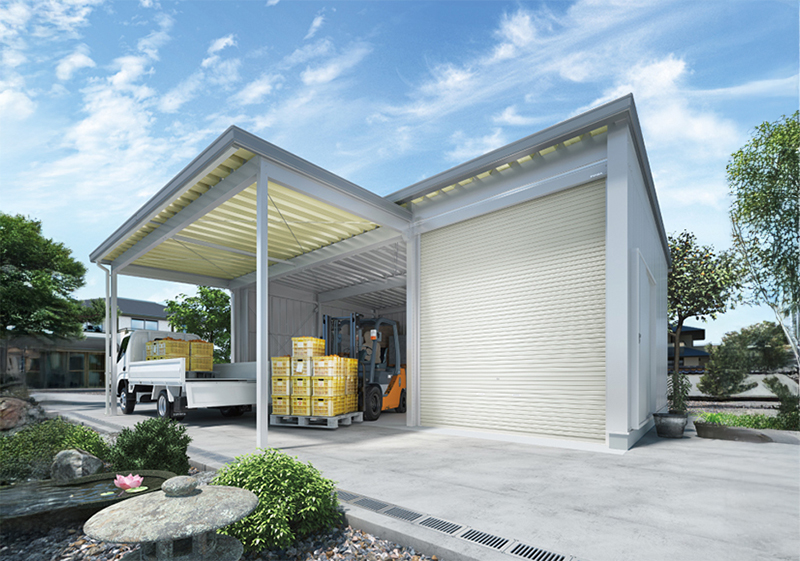
2026年7月期 決算短信〔日本基準〕(連結) 2026年9月11日 上場会社名 株式会社稲葉製作所 上場取引所東 コード番号 3421 URL https://www.inaba-ss.co.jp 代表者 (役職名) 代表取締役社長 (氏名)稲葉裕次郎 問合せ先責任者 (役職名) 執行役員経理部長…
2026年7月期
決算短信〔日本基準〕(連結)
2026年9月11日
上場会社名
株式会社稲葉製作所
上場取引所東
コード番号
3421
URL https://www.inaba-ss.co.jp
代表者
(役職名) 代表取締役社長
(氏名)稲葉裕次郎
問合せ先責任者 (役職名) 執行役員経理部長
(氏名)白川幹二
TEL 03-3759-5181
定時株主総会開催予定日
2026年10月29日
配当支払開始予定日 2026年10月30日
有価証券報告書提出予定日 2026年10月27日
決算補足説明資料作成の有無:有
決算説明会開催の有無
:無
(百万円未満切捨て)
1.2026年7月期の連結業績(2025年8月1日~2026年7月31日)
(1)連結経営成績
売上高
2026年7月期
2025年7月期
(注)包括利益
百万円
41,468
41,905
2026年7月期
(%表示は対前期増減率)
親会社株主に帰属する
営業利益
経常利益
当期純利益
%
百万円
%
百万円
%
百万円
%
△1.0
1,722
△7.7
2,168
△1.3
1,546
△0.0
△1.2
1,865
△39.1
2,197
△35.4
1,546
△36.7
1,692百万円 (7.6%)
2025年7月期
1,572百万円 (△37.1%)
1株当たり
潜在株式調整後1株
当期純利益
当たり当期純利益
円銭
円銭
2026年7月期
97.63
-
2025年7月期
95.97
-
(参考)持分法投資損益
2026年7月期
-百万円
自己資本
当期純利益率
総資産
経常利益率
%
3.5
3.5
2025年7月期
売上高
営業利益率
%
3.6
3.7
%
4.2
4.5
-百万円
(2)連結財政状態
総資産
2026年7月期
2025年7月期
(参考)自己資本
純資産
百万円
百万円
60,488
44,773
59,467
44,020
2026年7月期
44,773百万円
2025年7月期
(3)連結キャッシュ・フローの状況
営業活動による
キャッシュ・フロー
百万円
2026年7月期
3,635
2025年7月期
3,018
投資活動による
キャッシュ・フロー
百万円
△3,042
△1,887
自己資本比率
%
74.0
74.0
44,020百万円
財務活動による
キャッシュ・フロー
百万円
△984
△1,185
1株当たり純資産
円銭
2,844.63
2,772.17
現金及び現金同等物
期末残高
百万円
15,745
16,047
2.配当の状況
2025年7月期
2026年7月期
2027年7月期(予想)
第1四半期末
円銭
-
-
-
第2四半期末
円銭
21.00
22.00
22.00
年間配当金
第3四半期末
円銭
-
-
-
期末
円銭
21.00
22.00
22.00
合計
円銭
42.00
44.00
-
配当金総額
(合計)
百万円
678
700
配当性向
(連結)
純資産配当
率(連結)
%
43.8
45.1
50.2
%
1.5
1.6
3.2027年7月期の連結業績予想(2026年8月1日~2027年7月31日)
(%表示は、通期は対前期、四半期は対前年同四半期増減率)
親会社株主に帰属
1株当たり
売上高
営業利益
経常利益
する当期純利益
当期純利益
百万円
%
百万円
%
百万円
%
百万円
%
円銭
第2四半期(累計)
19,420
△1.6
320 △49.8
560 △32.6
400 △35.7
25.41
通期
41,470
0.0
1,500 △12.9
2,000
△7.8
1,380 △10.7
87.68
※
注記事項
(1)期中における連結範囲の重要な変更:無
新規 -社 (社名)、除外 -社 (社名)
(2)会計方針の変更・会計上の見積りの変更・修正再表示
① 会計基準等の改正に伴う会計方針の変更:無
② ①以外の会計方針の変更
:無
③ 会計上の見積りの変更
:無
④ 修正再表示
:無
(3)発行済株式数(普通株式)
① 期末発行済株式数(自己株式を含む)
② 期末自己株式数
③ 期中平均株式数
2026年7月期
2026年7月期
2026年7月期
17,022,429株
1,282,813株
15,834,944株
(参考)個別業績の概要
1.2026年7月期の個別業績(2025年8月1日~2026年7月31日)
(1)個別経営成績
売上高
営業利益
百万円
%
百万円
%
2026年7月期
32,255
△3.3
1,118
△17.5
2025年7月期
33,352
△2.2
1,355
△48.7
1株当たり
当期純利益
円銭
68.35
77.00
2026年7月期
2025年7月期
2025年7月期
2025年7月期
2025年7月期
経常利益
百万円
%
1,559
△7.6
1,688
△44.1
17,022,429株
1,143,113株
16,115,356株
(%表示は対前期増減率)
当期純利益
百万円
%
1,082
△12.8
1,240
△44.2
潜在株式調整後
1株当たり当期純利益
円銭
-
-
(2)個別財政状態
総資産
2026年7月期
2025年7月期
(参考)自己資本
純資産
百万円
百万円
54,509
41,785
53,614
41,584
2026年7月期
41,785百万円
2025年7月期
自己資本比率
%
76.7
77.6
41,584百万円
1株当たり純資産
円銭
2,654.81
2,618.76
※
決算短信は公認会計士又は監査法人の監査の対象外です。
※
業績予想の適切な利用に関する説明、その他特記事項
(将来に関する記述等についてのご注意)
本資料に記載されている業績見通し等の将来に関する記述は、当社が現在入手している情報及び合理的であると
判断する一定の前提に基づいており、その達成を当社として約束する趣旨のものではありません。また、実際の業
績等は様々な要因により大きく異なる可能性があります。業績予想の前提となる条件及び業績予想のご利用にあた
っての注意事項等については、添付資料4ページ「1.経営成績等の概況(4)今後の見通し」をご覧ください。
㈱稲葉製作所(3421)
2026年7月期
決算短信
○添付資料の目次
1.経営成績等の概況 ………………………………………………………………………………………………………
(1)当期の経営成績の概況 ……………………………………………………………………………………………
(2)当期の財政状態の概況 ……………………………………………………………………………………………
(3)当期のキャッシュ・フローの概況 ………………………………………………………………………………
(4)今後の見通し ………………………………………………………………………………………………………
(5)利益配分に関する基本方針及び当期・次期の配当 ……………………………………………………………
2.会計基準の選択に関する基本的な考え方 ……………………………………………………………………………
3.連結財務諸表及び主な注記 ……………………………………………………………………………………………
(1)連結貸借対照表 ……………………………………………………………………………………………………
(2)連結損益計算書及び連結包括利益計算書 ………………………………………………………………………
連結損益計算書 ……………………………………………………………………………………………………
連結包括利益計算書 ………………………………………………………………………………………………
(3)連結株主資本等変動計算書 ………………………………………………………………………………………
(4)連結キャッシュ・フロー計算書 …………………………………………………………………………………
(5)連結財務諸表に関する注記事項 …………………………………………………………………………………
(継続企業の前提に関する注記) …………………………………………………………………………………
(株主資本の金額に著しい変動があった場合の注記) …………………………………………………………
(セグメント情報等の注記) ………………………………………………………………………………………
(1株当たり情報の注記) …………………………………………………………………………………………
(企業結合等関係) …………………………………………………………………………………………………
(重要な後発事象の注記) …………………………………………………………………………………………
4.個別財務諸表及び主な注記 ……………………………………………………………………………………………
(1)貸借対照表 …………………………………………………………………………………………………………
(2)損益計算書 …………………………………………………………………………………………………………
(3)株主資本等変動計算書 ……………………………………………………………………………………………
(4)個別財務諸表に関する注記事項 …………………………………………………………………………………
(継続企業の前提に関する注記) …………………………………………………………………………………
(株主資本の金額に著しい変動があった場合の注記) …………………………………………………………
(表示方法の変更) …………………………………………………………………………………………………
(重要な後発事象の注記) …………………………………………………………………………………………
5.その他 ……………………………………………………………………………………………………………………
(1)役員の異動 …………………………………………………………………………………………………………
(2)その他 ………………………………………………………………………………………………………………
2
2
3
3
4
5
5
6
6
8
8
9
10
12
13
13
13
13
17
18
18
19
19
21
22
24
24
24
24
24
25
25
25
㈱稲葉製作所(3421)
2026年7月期
決算短信
1.経営成績等の概況
(1)当期の経営成績の概況
前連結会計年度
(百万円)
当連結会計年度
(百万円)
増減率
(%)
売上高
41,905
41,468
△1.0
営業利益
1,865
1,722
△7.7
経常利益
2,197
2,168
△1.3
親会社株主に帰属する当期純利益
1,546
1,546
△0.0
当連結会計年度の国内経済は、景気は緩やかな回復傾向にあるものの、中東・ウクライナ情勢を巡るリスクの継
続、中国経済の停滞、米国の通商政策などの影響を受け、先行き不透明な状況が続きました。
鋼製物置市場においては、新設住宅着工戸数の減少基調が続くなか、物価上昇に伴い個人消費が振るわなかった
影響などもあり、市況は弱含みで推移いたしました。オフィス家具市場においては、新しい働き方に対応したオフ
ィスの移転需要やリニューアル需要などが旺盛で、市況は堅調に推移いたしました。
このような環境のもと、当社グループは、新製品のリリースなどによる製品ラインナップの拡充、用途提案など
の販売活動の強化・継続とともに、価格改定や案件ごとの採算管理徹底などにより売上総利益率の改善に努めてま
いりました。
この結果、当連結会計年度の経営成績は、売上高41,468百万円(前期比1.0%減)、営業利益1,722百万円(前期
比7.7%減)、経常利益2,168百万円(前期比1.3%減)、親会社株主に帰属する当期純利益1,546百万円(前期比
0.0%減)となりました。
セグメントの経営成績は、次のとおりであります。
なお、セグメントの売上高については、外部顧客に対する売上高とセグメント間の内部売上高を記載しておりま
す。
売上高(百万円)
セグメント利益(百万円)
セグメントの名称
前連結会計年度当連結会計年度
増減
前連結会計年度当連結会計年度
鋼製物置
29,218
27,923
△1,294
オフィス家具
12,687
13,545
857
-
△0
△0
41,905
41,468
△437
1,865
調整額
合計
2,468
増減
1,939
△528
318
641
322
△921
△858
63
1,722
△143
(鋼製物置事業)
鋼製物置事業については、物価上昇の継続による個人消費の伸び悩みの影響を受け、需要は弱含みとなった一
方、自然災害リスクへの備えが重視されるなか、企業・自治体などの防災対策需要に適応した、指定建築材料を
使用した中型・倉庫製品等の販売が堅調に推移いたしました。また、約50年前より実施している物置勉強会等を
通じて構築した全国の販売ネットワークを活用して顧客提案活動を展開し、製品認知度向上、需要確保に取り組
みました。
この結果、売上高は27,923百万円(前期比4.4%減)、セグメント利益は1,939百万円(前期比21.4%減)とな
りました。
(オフィス家具事業)
オフィス家具事業については、コミュニケーションの活性化を図るオープンオフィス化や人材確保などにつな
がるオフィス移転・改装は増加しており、オフィス環境の見直し需要は好調に推移いたしました。このような状
況を踏まえ、当社グループは、積極的な提案営業により受注の積上げに取り組んでまいりました。
この結果、売上高は13,545百万円(前期比6.8%増)、セグメント利益は641百万円(前期比101.1%増)とな
りました。
㈱稲葉製作所(3421)
2026年7月期
決算短信
(2)当期の財政状態の概況
流動資産
前連結会計年度
(百万円)
31,290
当連結会計年度
(百万円)
29,822
増減
(百万円)
固定資産
28,176
30,666
2,489
資産合計
59,467
60,488
1,021
流動負債
12,932
13,252
320
△1,468
固定負債
2,515
2,462
△52
負債合計
15,447
15,715
268
純資産
44,020
44,773
753
当連結会計年度末における財政状態は、次のとおりであります。
(資産)
流動資産は、前連結会計年度末に比べ1,468百万円減少して29,822百万円となりました。主な変動要因は、現
金及び預金の減少302百万円、受取手形及び売掛金の減少359百万円、電子記録債権の減少214百万円、有価証券
の減少200百万円、商品及び製品の減少429百万円であります。固定資産は、前連結会計年度末に比べ2,489百万
円増加して30,666百万円となりました。主な変動要因は、生産移管等による建物及び構築物の増加1,229百万
円、機械装置及び運搬具の増加1,658百万円、建設仮勘定の減少648百万円、無形固定資産のその他に含まれるソ
フトウエアの減少115百万円、投資有価証券の増加168百万円、退職給付に係る資産の増加256百万円でありま
す。
この結果、資産合計は60,488百万円となり、前連結会計年度末に比べ1,021百万円増加いたしました。
(負債)
流動負債は、前連結会計年度末に比べ320百万円増加して13,252百万円となりました。主な変動要因は、支払
手形及び買掛金の減少248百万円、電子記録債務の減少569百万円、未払法人税等の増加329百万円、流動負債の
その他に含まれる未払金の増加936百万円、未払消費税の減少171百万円であります。固定負債は、前連結会計年
度末に比べ52百万円減少して2,462百万円となりました。主な変動要因は、役員株式給付引当金の減少31百万円
であります。
この結果、負債合計は15,715百万円となり、前連結会計年度末に比べ268百万円増加いたしました。
(純資産)
純資産は、前連結会計年度末に比べ753百万円増加して44,773百万円となりました。主な変動要因は、親会社
株主に帰属する当期純利益の計上による利益剰余金の増加1,546百万円、配当金の支払による利益剰余金の減少
688百万円、及び自己株式取得等による自己株式(控除項目)の増加250百万円であります。
この結果、自己資本比率は、前連結会計年度末に比べ0.0ポイント減少して74.0%となりました。
(3)当期のキャッシュ・フローの概況
科目
前連結会計年度(百万円)
当連結会計年度(百万円)
営業活動によるキャッシュ・フロー
3,018
3,635
投資活動によるキャッシュ・フロー
△1,887
△3,042
財務活動によるキャッシュ・フロー
△1,185
△984
現金及び現金同等物の期末残高
16,047
15,745
-
-
借入金・社債期末残高
当連結会計年度末における現金及び現金同等物は、前連結会計年度末に比べ302百万円減少して15,745百万円と
なりました。
当連結会計年度における各キャッシュ・フローの状況は、次のとおりであります。
㈱稲葉製作所(3421)
2026年7月期
決算短信
(営業活動によるキャッシュ・フロー)
営業活動によるキャッシュ・フローは、3,635百万円の収入(前連結会計年度は3,018百万円の収入)となりま
した。この主な要因は、税金等調整前当期純利益の計上2,243百万円及び減価償却費の発生1,789百万円による収
入と、仕入債務の減少額927百万円及び法人税等の支払額378百万円の支出によるものであります。
(投資活動によるキャッシュ・フロー)
投資活動によるキャッシュ・フローは、3,042百万円の支出(前連結会計年度は1,887百万円の支出)となりま
した。この主な要因は、定期預金の払戻2,000百万円及び投資有価証券の償還500百万円による収入と、有形固定
資産の取得3,094百万円、定期預金の預入2,000百万円及び投資有価証券の取得400百万円の支出によるものであ
ります。
(財務活動によるキャッシュ・フロー)
財務活動によるキャッシュ・フローは、984百万円の支出(前連結会計年度は1,185百万円の支出)となりまし
た。この主な要因は、配当金の支払額687百万円及び自己株式の取得295百万円の支出によるものであります。
なお、当社グループのキャッシュ・フロー指標のトレンドは、次のとおりであります。
2022年7月期
2023年7月期
2024年7月期
2025年7月期
2026年7月期
自己資本比率(%)
68.7
71.7
72.0
74.0
74.0
時価ベースの自己資本比
率(%)
36.6
42.7
45.8
47.7
44.3
債務償還年数(年)
0.3
0.3
0.3
0.3
0.3
1,196.6
1,066.3
1,392.8
1,212.7
743.4
インタレスト・カバレッ
ジ・レシオ(倍)
(注)自己資本比率:純資産/総資産
時価ベースの自己資本比率:株式時価総額/総資産
債務償還年数:有利子負債/営業キャッシュ・フロー
インタレスト・カバレッジ・レシオ:営業キャッシュ・フロー/利払い
*各指標は、いずれも連結ベースの財務数値により算出しております。
*株式時価総額は、期末株価終値×期末発行済株式総数(自己株式控除後)により算出しております。
*有利子負債は、連結貸借対照表に計上されている負債のうち、利子を支払っている全ての負債を対象として
おります。
*営業キャッシュ・フロー及び利払いは、連結キャッシュ・フロー計算書に記載の「営業活動によるキャッシ
ュ・フロー」及び「利息の支払額」等を使用しております。
(4)今後の見通し
当連結会計年度
(百万円)
翌連結会計年度
(百万円)
増減率
(%)
売上高
41,468
41,470
0.0
営業利益
1,722
1,500
△12.9
経常利益
2,168
2,000
△7.8
親会社株主に帰属する当期純利益
1,546
1,380
△10.7
当社グループを取り巻く事業環境において、鋼製物置事業では物価上昇の継続に伴い個人消費が振るわず、耐久
消費財である鋼製物置の需要は引き続き弱含みで推移すると見込んでおります。オフィス家具事業では、コミュニ
ケーションの活性化や人材を確保するため、オフィスの移転・改装需要は引き続き堅調に推移すると見込んでおり
ます。また、原材料の価格高騰やエネルギーコスト等の増加が見込まれ、引き続き生産・物流コスト削減に努める
とともに、顧客提案活動を通じた製品認知度向上・需要創出に取り組んでまいります。
㈱稲葉製作所(3421)
2026年7月期
決算短信
翌連結会計年度の業績につきましては、売上高41,470百万円(当連結会計年度比0.0%増)、営業利益1,500百万
円(当連結会計年度比12.9%減)、経常利益2,000百万円(当連結会計年度比7.8%減)、親会社株主に帰属する当
期純利益1,380百万円(当連結会計年度比10.7%減)を予想しております。
なお、業績予想につきましては、当社が現時点で入手可能な情報及び合理的であると判断する一定の前提等に基
づいて判断した見通しであり、実際の業績等は、今後の様々な要因によって異なる可能性があり得ることをご承知
おきください。
(5)利益配分に関する基本方針及び当期・次期の配当
当社は、株主の皆様への利益還元が企業として最重要課題の一つであることを認識し、財務体制と経営基盤の強
化を図るとともに、株主の皆様に対し安定的な利益還元を行うことを基本方針としております。
この基本方針に基づき、業績並びに今後の事業展開を勘案し、当期の配当金につきましては、1株当たり44円
(中間配当22円、期末配当22円)とさせていただく予定です。
この結果、当期の連結配当性向は45.1%となります。
なお、次期の1株当たり配当予想は44円(中間配当22円、期末配当22円)とすることを決定いたしました。
2.会計基準の選択に関する基本的な考え方
当社グループの業務は、現在のところ日本国内を中心に展開しております。したがって、連結財務諸表の期間比較
可能性及び企業間比較可能性を考慮し、当面は日本基準で連結財務諸表を作成する方針であります。
なお、IFRSの適用につきましては、国内外の諸情勢を考慮のうえ、適切に対応していく方針であります。
㈱稲葉製作所(3421)
2026年7月期
3.連結財務諸表及び主な注記
(1)連結貸借対照表
(単位:千円)
前連結会計年度
(2025年7月31日)
資産の部
流動資産
現金及び預金
受取手形及び売掛金
電子記録債権
有価証券
商品及び製品
仕掛品
原材料及び貯蔵品
その他
貸倒引当金
流動資産合計
固定資産
有形固定資産
建物及び構築物(純額)
機械装置及び運搬具(純額)
土地
建設仮勘定
その他(純額)
有形固定資産合計
無形固定資産
その他
無形固定資産合計
投資その他の資産
投資有価証券
退職給付に係る資産
繰延税金資産
その他
貸倒引当金
投資その他の資産合計
固定資産合計
資産合計
当連結会計年度
(2026年7月31日)
13,747,907
6,171,630
3,117,089
3,799,440
2,740,387
575,860
604,901
539,603
△6,040
31,290,780
13,445,607
5,812,109
2,902,718
3,598,830
2,310,793
539,293
625,150
593,566
△5,482
29,822,585
7,400,607
3,972,230
11,626,357
1,182,827
117,122
24,299,146
8,630,050
5,630,446
11,629,357
533,954
116,635
26,540,445
548,322
548,322
430,072
430,072
1,590,739
686,940
344,034
707,519
△35
3,329,198
28,176,667
59,467,447
1,759,338
943,466
276,799
716,110
△35
3,695,678
30,666,196
60,488,781
決算短信
㈱稲葉製作所(3421)
2026年7月期
(単位:千円)
前連結会計年度
(2025年7月31日)
負債の部
流動負債
支払手形及び買掛金
電子記録債務
未払法人税等
契約負債
賞与引当金
その他
流動負債合計
固定負債
役員退職慰労引当金
役員株式給付引当金
退職給付に係る負債
その他
固定負債合計
負債合計
純資産の部
株主資本
資本金
資本剰余金
利益剰余金
自己株式
株主資本合計
その他の包括利益累計額
その他有価証券評価差額金
退職給付に係る調整累計額
その他の包括利益累計額合計
純資産合計
負債純資産合計
当連結会計年度
(2026年7月31日)
2,364,833
6,529,653
160,171
270,643
373,674
3,233,100
12,932,076
2,115,900
5,959,781
489,795
178,858
390,220
4,117,994
13,252,551
19,449
138,284
1,114,394
1,243,116
2,515,244
15,447,320
27,340
107,211
1,086,986
1,241,312
2,462,849
15,715,401
1,132,048
763,500
43,502,863
△1,838,414
43,559,997
1,132,048
763,500
44,360,531
△2,088,995
44,167,084
204,268
255,861
460,129
44,020,126
59,467,447
264,307
341,988
606,296
44,773,380
60,488,781
決算短信
㈱稲葉製作所(3421)
2026年7月期
(2)連結損益計算書及び連結包括利益計算書
(連結損益計算書)
(単位:千円)
前連結会計年度
(自 2024年8月1日
至 2025年7月31日)
売上高
売上原価
売上総利益
販売費及び一般管理費
営業利益
営業外収益
受取利息
受取配当金
作業くず売却益
電力販売収益
雑収入
営業外収益合計
営業外費用
電力販売費用
雑損失
営業外費用合計
経常利益
特別利益
抱合せ株式消滅差益
固定資産売却益
保険解約返戻金
特別利益合計
特別損失
固定資産売却損
固定資産除却損
特別損失合計
税金等調整前当期純利益
法人税、住民税及び事業税
法人税等調整額
法人税等合計
当期純利益
親会社株主に帰属する当期純利益
当連結会計年度
(自 2025年8月1日
至 2026年7月31日)
41,905,707
31,868,693
10,037,014
8,171,610
1,865,403
41,468,624
31,415,164
10,053,459
8,331,196
1,722,263
33,423
12,485
164,551
81,011
75,664
367,136
64,642
13,087
191,561
94,269
117,696
481,257
28,255
6,862
35,118
2,197,421
27,916
6,850
34,766
2,168,753
-
6,580
48,465
55,045
68,886
4,115
17,800
90,801
4,688
25,295
29,983
2,222,483
476,252
199,623
675,876
1,546,607
1,546,607
305
15,737
16,043
2,243,512
687,596
9,903
697,499
1,546,012
1,546,012
決算短信
㈱稲葉製作所(3421)
2026年7月期
(連結包括利益計算書)
(単位:千円)
前連結会計年度
(自 2024年8月1日
至 2025年7月31日)
当期純利益
その他の包括利益
その他有価証券評価差額金
退職給付に係る調整額
その他の包括利益合計
包括利益
(内訳)
親会社株主に係る包括利益
当連結会計年度
(自 2025年8月1日
至 2026年7月31日)
1,546,607
1,546,012
△6,884
32,692
25,808
1,572,416
60,038
86,127
146,166
1,692,179
1,572,416
1,692,179
決算短信
㈱稲葉製作所(3421)
(3)連結株主資本等変動計算書
前連結会計年度(自 2024年8月1日
至
2026年7月期
決算短信
2025年7月31日)
(単位:千円)
株主資本
資本金
当期首残高
資本剰余金
1,132,048
利益剰余金
763,500
42,640,145
自己株式
△1,399,983
株主資本合計
43,135,710
当期変動額
剰余金の配当
△683,889
△683,889
親会社株主に帰属する当期
純利益
1,546,607
1,546,607
自己株式の取得
△500,137
△500,137
自己株式の処分
61,705
61,705
株主資本以外の項目の当期
変動額(純額)
当期変動額合計
当期末残高
-
-
862,717
△438,431
424,286
1,132,048
763,500
43,502,863
△1,838,414
43,559,997
その他の包括利益累計額
純資産合計
その他有価証券
評価差額金
当期首残高
211,152
退職給付に係る
調整累計額
223,168
その他の包括利益
累計額合計
434,321
43,570,032
当期変動額
剰余金の配当
△683,889
親会社株主に帰属する当期
純利益
1,546,607
自己株式の取得
△500,137
自己株式の処分
61,705
株主資本以外の項目の当期
変動額(純額)
△6,884
32,692
25,808
25,808
当期変動額合計
△6,884
32,692
25,808
450,094
当期末残高
204,268
255,861
460,129
44,020,126
㈱稲葉製作所(3421)
当連結会計年度(自
2025年8月1日
至
2026年7月期
決算短信
2026年7月31日)
(単位:千円)
株主資本
資本金
当期首残高
資本剰余金
1,132,048
利益剰余金
763,500
43,502,863
自己株式
△1,838,414
株主資本合計
43,559,997
当期変動額
剰余金の配当
△688,344
△688,344
親会社株主に帰属する当期
純利益
1,546,012
1,546,012
自己株式の取得
△295,400
△295,400
自己株式の処分
44,819
44,819
株主資本以外の項目の当期
変動額(純額)
当期変動額合計
当期末残高
-
-
857,667
△250,580
607,087
1,132,048
763,500
44,360,531
△2,088,995
44,167,084
その他の包括利益累計額
純資産合計
その他有価証券
評価差額金
当期首残高
204,268
退職給付に係る
調整累計額
255,861
その他の包括利益
累計額合計
460,129
44,020,126
当期変動額
剰余金の配当
△688,344
親会社株主に帰属する当期
純利益
1,546,012
自己株式の取得
△295,400
自己株式の処分
44,819
株主資本以外の項目の当期
変動額(純額)
60,038
86,127
146,166
146,166
当期変動額合計
60,038
86,127
146,166
753,254
当期末残高
264,307
341,988
606,296
44,773,380
㈱稲葉製作所(3421)
2026年7月期
(4)連結キャッシュ・フロー計算書
(単位:千円)
前連結会計年度
(自 2024年8月1日
至 2025年7月31日)
営業活動によるキャッシュ・フロー
税金等調整前当期純利益
減価償却費
貸倒引当金の増減額(△は減少)
賞与引当金の増減額(△は減少)
退職給付に係る資産負債の増減額(△は減少)
役員退職慰労引当金の増減額(△は減少)
役員株式給付引当金の増減額(△は減少)
受取利息及び受取配当金
抱合せ株式消滅差損益(△は益)
保険解約返戻金
有形固定資産売却損益(△は益)
固定資産除却損
売上債権の増減額(△は増加)
棚卸資産の増減額(△は増加)
仕入債務の増減額(△は減少)
その他
小計
利息及び配当金の受取額
法人税等の支払額
法人税等の還付額
営業活動によるキャッシュ・フロー
投資活動によるキャッシュ・フロー
定期預金の預入による支出
定期預金の払戻による収入
有形固定資産の取得による支出
無形固定資産の取得による支出
投資有価証券の取得による支出
投資有価証券の償還による収入
保険積立金の解約による収入
その他
投資活動によるキャッシュ・フロー
財務活動によるキャッシュ・フロー
配当金の支払額
自己株式の取得による支出
その他
財務活動によるキャッシュ・フロー
現金及び現金同等物に係る換算差額
現金及び現金同等物の増減額(△は減少)
現金及び現金同等物の期首残高
合併に伴う現金及び現金同等物の増加額
現金及び現金同等物の期末残高
当連結会計年度
(自 2025年8月1日
至 2026年7月31日)
2,222,483
2,001,278
6,009
4,987
△164,780
1,783
△26,024
△45,909
-
△48,465
△1,891
25,295
561,411
53,104
△427,267
△168,020
3,993,996
44,670
△1,020,453
-
3,018,213
2,243,512
1,789,359
△558
14,225
△175,201
7,891
△31,073
△77,730
△68,886
△17,800
△3,809
15,737
661,122
469,629
△927,921
△123,080
3,775,417
75,958
△378,944
163,099
3,635,531
△2,500,000
2,500,000
△2,325,265
△358,435
△100,989
400,000
529,496
△32,250
△1,887,444
△2,000,000
2,000,000
△3,094,096
△27,786
△400,978
500,000
33,315
△52,975
△3,042,521
△683,265
△500,137
△2,561
△1,185,964
-
△55,195
16,103,103
-
16,047,907
△687,358
△295,400
△1,991
△984,750
-
△391,740
16,047,907
89,440
15,745,607
決算短信
㈱稲葉製作所(3421)
2026年7月期
決算短信
(5)連結財務諸表に関する注記事項
(継続企業の前提に関する注記)
該当事項はありません。
(株主資本の金額に著しい変動があった場合の注記)
当社は、2026年3月13日開催の取締役会決議に基づき、取得株式総数200,000株、取得価額総額337,600千円を上
限として自己株式の取得を進め、当連結会計年度において自己株式を175,000株取得し、自己株式(控除項目)が
295,400千円増加いたしました。なお、当該決議に基づく自己株式の取得は終了しております。
この結果、当連結会計年度において、自己株式(控除項目)が2,088,995千円となっております。
(セグメント情報等の注記)
【セグメント情報】
1.報告セグメントの概要
当社グループの報告セグメントは、当社グループの構成単位のうち分離された財務情報が入手可能であり、
取締役会が、経営資源の配分の決定及び業績を評価するために、定期的に検討を行う対象となっているもので
あります。
当社グループは、本社に事業を統括する本部を置き、取り扱う製品・サービスについて国内及び海外の包括
的な戦略を立案し、事業活動を展開しております。
したがって、当社グループは製品の種類及び販売市場の類似性を考慮した製品・サービス別のセグメントか
ら構成されており、「鋼製物置」及び「オフィス家具」の2つを報告セグメントとしております。
「鋼製物置」は、物置、ガレージ・倉庫及び自転車置場等の製造・販売並びにレンタル収納を行っておりま
す。「オフィス家具」は、机、椅子及び壁面収納庫等の製造・販売を行っております。
2.報告セグメントごとの売上高、利益又は損失、その他の項目の金額の算定方法
報告されている事業セグメントの会計処理方法は、「連結財務諸表作成のための基本となる重要な事項」に
おける記載と概ね同一であります。
報告セグメントの利益は、営業利益ベースの数値であります。
セグメント間の内部売上高又は振替高は市場実勢価格に基づいております。
㈱稲葉製作所(3421)
2026年7月期
決算短信
3.報告セグメントごとの売上高、利益又は損失、その他の項目の金額に関する情報及び収益の分解情報
前連結会計年度(自 2024年8月1日至 2025年7月31日)
(単位:千円)
報告セグメント
鋼製物置
売上高
一時点で移転される財又はサ
ービス
一定期間にわたり移転される
財又はサービス
オフィス家具
連結財務諸表
計上額
(注)2
調整額
(注)1
計
29,082,033
12,687,402
41,769,436
-
41,769,436
136,271
-
136,271
-
136,271
外部顧客への売上高
セグメント間の内部売上高又
は振替高
29,218,305
12,687,402
41,905,707
-
41,905,707
-
-
-
-
-
計
29,218,305
12,687,402
41,905,707
-
41,905,707
セグメント利益
2,468,111
318,929
2,787,040
△921,636
1,865,403
その他の項目
減価償却費
1,641,133
306,776
1,947,909
53,369
2,001,278
(注)1.調整額の内容は、以下のとおりであります。
(1) セグメント利益の調整額△921,636千円は、セグメント間取引消去156千円、各報告セグメントに配分して
いない全社費用△921,793千円であります。全社費用は、主に報告セグメントに帰属していない一般管理
費であります。
(2) 減価償却費の調整額53,369千円は、各報告セグメントに配分していない全社の減価償却費です。
2.セグメント利益は、連結財務諸表の営業利益と調整を行っております。
3.セグメント資産については、経営資源の配分の決定及び業績を評価するための検討対象となっていないため記
載をしておりません。
㈱稲葉製作所(3421)
当連結会計年度(自
2025年8月1日
至
2026年7月期
決算短信
2026年7月31日)
(単位:千円)
報告セグメント
鋼製物置
売上高
一時点で移転される財又はサ
ービス
一定期間にわたり移転される
財又はサービス
オフィス家具
連結財務諸表
計上額
(注)2
調整額
(注)1
計
27,635,346
13,545,242
41,180,589
-
41,180,589
288,035
-
288,035
-
288,035
外部顧客への売上高
セグメント間の内部売上高又
は振替高
27,923,381
13,545,242
41,468,624
-
41,468,624
270
73
343
△343
-
計
27,923,652
13,545,316
41,468,968
△343
41,468,624
セグメント利益
1,939,332
641,483
2,580,815
△858,552
1,722,263
その他の項目
減価償却費
1,366,410
360,886
1,727,296
62,062
1,789,359
(注)1.調整額の内容は、以下のとおりであります。
(1) セグメント間の内部売上高又は振替高の調整額△343千円は、セグメント間取引消去であります。
(2) セグメント利益の調整額△858,552千円は、セグメント間取引消去154千円、各報告セグメントに配分して
いない全社費用△858,706千円であります。全社費用は、主に報告セグメントに帰属していない一般管理
費であります。
(3) 減価償却費の調整額62,062千円は、各報告セグメントに配分していない全社の減価償却費であります。
2.セグメント利益は、連結財務諸表の営業利益と調整を行っております。
3.セグメント資産については、経営資源の配分の決定及び業績を評価するための検討対象となっていないため記
載をしておりません。
【関連情報】
前連結会計年度(自 2024年8月1日至 2025年7月31日)
1.製品及びサービスごとの情報
セグメント情報として、同様の情報を記載しているため、記載を省略しております。
2.地域ごとの情報
(1) 売上高
本邦の外部顧客への売上高が連結損益計算書の売上高の90%を超えるため、記載を省略しております。
(2) 有形固定資産
本邦以外の国又は地域に所在している有形固定資産がないため、該当事項はありません。
3.主要な顧客ごとの情報
(単位:千円)
顧客の名称
売上高
ユアサ商事株式会社
関連するセグメント名
12,030,536
鋼製物置
㈱稲葉製作所(3421)
2026年7月期
決算短信
当連結会計年度(自 2025年8月1日至 2026年7月31日)
1.製品及びサービスごとの情報
セグメント情報として、同様の情報を記載しているため、記載を省略しております。
2.地域ごとの情報
(1) 売上高
本邦の外部顧客への売上高が連結損益計算書の売上高の90%を超えるため、記載を省略しております。
(2) 有形固定資産
本邦以外の国又は地域に所在している有形固定資産がないため、該当事項はありません。
3.主要な顧客ごとの情報
(単位:千円)
顧客の名称
売上高
株式会社YUASA
関連するセグメント名
11,957,599
【報告セグメントごとの固定資産の減損損失に関する情報】
前連結会計年度(自 2024年8月1日至 2025年7月31日)
該当事項はありません。
当連結会計年度(自 2025年8月1日
該当事項はありません。
至
2026年7月31日)
【報告セグメントごとののれんの償却額及び未償却残高に関する情報】
前連結会計年度(自 2024年8月1日至 2025年7月31日)
該当事項はありません。
当連結会計年度(自 2025年8月1日
該当事項はありません。
至
2026年7月31日)
【報告セグメントごとの負ののれん発生益に関する情報】
前連結会計年度(自 2024年8月1日至 2025年7月31日)
該当事項はありません。
当連結会計年度(自 2025年8月1日
該当事項はありません。
至
2026年7月31日)
鋼製物置
㈱稲葉製作所(3421)
2026年7月期
決算短信
(1株当たり情報の注記)
前連結会計年度
2024年8月1日
2025年7月31日)
(自
至
1株当たり純資産額
1株当たり当期純利益金額
当連結会計年度
2025年8月1日
2026年7月31日)
(自
至
2,772.17 円
2,844.63 円
95.97 円
97.63 円
(注)1.潜在株式調整後1株当たり当期純利益金額については、潜在株式が存在しないため記載しておりま
せん。
2.当社は、取締役(ただし、社外取締役を除く)を対象とする株式報酬制度に係る信託が保有する当
社株式を連結財務諸表において自己株式として計上しております。株主資本において自己株式とし
て計上されている当該信託が保有する当社株式は、1株当たり純資産額の算定上、期末発行済株式
総数から控除する自己株式に含めており、また、1株当たり当期純利益金額の算定上、期中平均株
式数の計算において控除する自己株式に含めております。
1株当たり純資産額の算定上、控除した当該自己株式の期末株式数は前連結会計年度128,700株、当
連結会計年度93,400株であり、1株当たり当期純利益金額の算定上、控除した当該自己株式の期中
平均株式数は、前連結会計年度147,355株、当連結会計年度106,908株であります。
3.1株当たり当期純利益金額の算定上の基礎は、以下のとおりです。
前連結会計年度
2024年8月1日
2025年7月31日)
(自
至
親会社株主に帰属する当期純利益金額
(千円)
当連結会計年度
2025年8月1日
2026年7月31日)
(自
至
1,546,607
1,546,012
-
-
普通株式に係る親会社株主に帰属する
当期純利益金額(千円)
1,546,607
1,546,012
普通株式の期中平均株式数(株)
16,115,356
15,834,944
普通株主に帰属しない金額(千円)
㈱稲葉製作所(3421)
2026年7月期
決算短信
(企業結合等関係)
(連結子会社による孫会社の吸収合併)
当社は、2025年4月14日開催の取締役会において、当社連結子会社である株式会社共進を存続会社、当社孫会社
である株式会社カトウ産業を消滅会社とした吸収合併をすることについて決議し、同日付で合併契約書を締結いた
しました。なお、2025年8月1日付で本合併を実施しております。
1.取引の概要
(1)結合当事企業の名称及びその事業の内容
結合企業の名称
株式会社共進
事業の内容
鋼製物置・オフィス家具販売
被結合企業の名称株式会社カトウ産業
事業の内容
鋼製物置・オフィス家具販売
(2)企業結合日
2025年8月1日
(3)企業結合の法的形式
株式会社共進を存続会社、株式会社カトウ産業を消滅会社とする吸収合併
(4)結合後企業の名称
株式会社共進
(5)その他取引の概要に関する事項
株式会社共進は、群馬県の物置代理店及び当社北関東配送センターを運営する子会社であります。ま
た、株式会社カトウ産業は、新潟県の物置代理店及び新潟配送センターを運営する孫会社であります。
両社を統合することにより、事業運営の合理化、営業力の強化、及び経営の更なる効率化を図ること
を目的としております。
2.実施した会計処理の概要
「企業結合に関する会計基準」(企業会計基準第21号 2019年1月16日)及び「企業結合会計基準及び事
業分離等会計基準に関する適用指針」(企業会計基準適用指針第10号 2019年1月16日)に基づき、共通支
配下の取引として会計処理を実施しております。
(重要な後発事象の注記)
該当事項はありません。
㈱稲葉製作所(3421)
2026年7月期
4.個別財務諸表及び主な注記
(1)貸借対照表
(単位:千円)
前事業年度
(2025年7月31日)
資産の部
流動資産
現金及び預金
受取手形
電子記録債権
売掛金
有価証券
商品及び製品
仕掛品
原材料及び貯蔵品
その他
流動資産合計
固定資産
有形固定資産
建物
構築物
機械及び装置
車両運搬具
工具、器具及び備品
土地
建設仮勘定
有形固定資産合計
無形固定資産
ソフトウエア
その他
無形固定資産合計
投資その他の資産
投資有価証券
関係会社株式
前払年金費用
繰延税金資産
保険積立金
その他
投資その他の資産合計
固定資産合計
資産合計
当事業年度
(2026年7月31日)
9,636,574
243,040
3,789,923
5,169,724
3,799,440
2,620,164
430,185
598,268
495,859
26,783,181
9,237,187
19,907
3,710,840
5,015,020
3,598,830
2,177,535
425,339
612,310
536,043
25,333,013
6,341,470
275,979
3,894,555
66,165
88,830
11,564,454
1,176,551
23,408,007
7,485,354
290,641
5,531,191
86,342
93,614
11,567,454
502,959
25,557,557
483,982
6,907
490,890
382,985
6,669
389,654
1,528,430
105,000
426,505
330,880
429,283
112,765
2,932,866
26,831,764
53,614,946
1,712,658
105,000
588,168
286,442
414,088
122,809
3,229,167
29,176,379
54,509,393
決算短信
㈱稲葉製作所(3421)
2026年7月期
(単位:千円)
前事業年度
(2025年7月31日)
負債の部
流動負債
支払手形
電子記録債務
買掛金
未払金
未払費用
未払法人税等
未払消費税等
契約負債
預り金
賞与引当金
その他
流動負債合計
固定負債
退職給付引当金
役員株式給付引当金
受入営業保証金
その他
固定負債合計
負債合計
純資産の部
株主資本
資本金
資本剰余金
資本準備金
資本剰余金合計
利益剰余金
利益準備金
その他利益剰余金
固定資産圧縮積立金
別途積立金
繰越利益剰余金
利益剰余金合計
自己株式
株主資本合計
評価・換算差額等
その他有価証券評価差額金
評価・換算差額等合計
純資産合計
負債純資産合計
当事業年度
(2026年7月31日)
60,940
5,245,680
1,546,481
1,587,523
479,098
37,679
204,348
47
209,429
298,042
101,771
9,771,041
9,061
4,857,668
1,580,792
2,533,333
553,702
359,408
-
1,848
212,804
302,601
111,497
10,522,719
1,150,097
138,284
938,787
32,573
2,259,742
12,030,784
1,125,842
107,211
933,133
34,830
2,201,017
12,723,737
1,132,048
1,132,048
763,500
763,500
763,500
763,500
283,012
283,012
241,332
29,397,500
11,399,600
41,321,445
△1,838,414
41,378,579
234,036
29,397,500
11,800,908
41,715,456
△2,088,995
41,522,010
205,582
205,582
41,584,162
53,614,946
263,645
263,645
41,785,655
54,509,393
決算短信
㈱稲葉製作所(3421)
2026年7月期
(2)損益計算書
(単位:千円)
(自
至
売上高
売上原価
売上総利益
販売費及び一般管理費
営業利益
営業外収益
受取利息
受取配当金
作業くず売却益
受取家賃
電力販売収益
雑収入
営業外収益合計
営業外費用
電力販売費用
雑損失
営業外費用合計
経常利益
特別利益
固定資産売却益
保険解約返戻金
特別利益合計
特別損失
固定資産売却損
固定資産除却損
特別損失合計
税引前当期純利益
法人税、住民税及び事業税
法人税等調整額
法人税等合計
当期純利益
前事業年度
2024年8月1日
2025年7月31日)
(自
至
当事業年度
2025年8月1日
2026年7月31日)
33,352,483
26,283,369
7,069,114
5,713,724
1,355,389
32,255,859
25,521,373
6,734,486
5,615,845
1,118,640
10,948
11,621
162,598
36,857
81,011
69,194
372,232
24,807
12,341
187,976
61,928
94,269
95,000
476,324
28,255
10,533
38,789
1,688,831
27,916
7,053
34,969
1,559,995
6,495
48,465
54,961
4,115
17,800
21,915
-
6,644
6,644
1,737,148
280,385
215,904
496,290
1,240,857
305
15,344
15,650
1,566,260
466,150
17,754
483,904
1,082,355
決算短信
㈱稲葉製作所(3421)
(3)株主資本等変動計算書
前事業年度(自 2024年8月1日
至
2026年7月期
2025年7月31日)
(単位:千円)
株主資本
資本剰余金
利益剰余金
資本金
その他利益剰余金
資本準備金
当期首残高
1,132,048
763,500
利益準備金
283,012
固定資産
圧縮積立金
別途積立金
繰越利益剰余金
248,806
29,397,500
10,835,159
当期変動額
固定資産圧縮積立金の取崩
△7,473
7,473
剰余金の配当
△683,889
当期純利益
1,240,857
自己株式の取得
自己株式の処分
株主資本以外の項目の当期
変動額(純額)
当期変動額合計
当期末残高
-
-
-
△7,473
-
564,441
1,132,048
763,500
283,012
241,332
29,397,500
11,399,600
評価・換算
差額等
株主資本
当期首残高
自己株式
株主資本合計
その他有価証
券評価差額金
△1,399,983
41,260,043
209,974
純資産合計
41,470,017
当期変動額
固定資産圧縮積立金の取崩
-
-
剰余金の配当
△683,889
△683,889
当期純利益
1,240,857
1,240,857
自己株式の取得
△500,137
△500,137
△500,137
自己株式の処分
61,705
61,705
61,705
株主資本以外の項目の当期
変動額(純額)
当期変動額合計
当期末残高
△4,392
△4,392
△438,431
118,536
△4,392
114,144
△1,838,414
41,378,579
205,582
41,584,162
決算短信
㈱稲葉製作所(3421)
当事業年度(自
2025年8月1日
至
2026年7月期
2026年7月31日)
(単位:千円)
株主資本
資本剰余金
利益剰余金
資本金
その他利益剰余金
資本準備金
当期首残高
1,132,048
763,500
利益準備金
283,012
固定資産
圧縮積立金
別途積立金
繰越利益剰余金
241,332
29,397,500
11,399,600
当期変動額
固定資産圧縮積立金の取崩
△7,296
7,296
剰余金の配当
△688,344
当期純利益
1,082,355
自己株式の取得
自己株式の処分
株主資本以外の項目の当期
変動額(純額)
当期変動額合計
当期末残高
-
-
-
△7,296
-
401,307
1,132,048
763,500
283,012
234,036
29,397,500
11,800,908
評価・換算
差額等
株主資本
当期首残高
自己株式
株主資本合計
その他有価証
券評価差額金
△1,838,414
41,378,579
205,582
純資産合計
41,584,162
当期変動額
固定資産圧縮積立金の取崩
剰余金の配当
当期純利益
-
-
△688,344
△688,344
1,082,355
1,082,355
自己株式の取得
△295,400
△295,400
△295,400
自己株式の処分
44,819
44,819
44,819
株主資本以外の項目の当期
変動額(純額)
当期変動額合計
当期末残高
58,062
58,062
△250,580
143,430
58,062
201,493
△2,088,995
41,522,010
263,645
41,785,655
決算短信
㈱稲葉製作所(3421)
2026年7月期
決算短信
(4)個別財務諸表に関する注記事項
(継続企業の前提に関する注記)
該当事項はありません。
(株主資本の金額に著しい変動があった場合の注記)
当社は、2026年3月13日開催の取締役会決議に基づき、取得株式総数200,000株、取得価額総額337,600千円を上
限として自己株式の取得を進め、当事業年度において自己株式を175,000株取得し、自己株式(控除項目)が
295,400千円増加いたしました。なお、当該決議に基づく自己株式の取得は終了しております。
この結果、当事業年度において、自己株式(控除項目)が2,088,995千円となっております。
(表示方法の変更)
(損益計算書)
前事業年度において、「営業外収益」の「雑収入」に含めて表示していた「受取家賃」は、営業外収益の100分
の10を超えたため、当事業年度より独立掲記しております。
この結果、前事業年度の損益計算書において、「営業外収益」の「雑収入」に表示していた106,051千円は、
「受取家賃」36,857千円、「雑収入」69,194千円として組み替えております。
(重要な後発事象の注記)
該当事項はありません。
㈱稲葉製作所(3421)
2026年7月期
5.その他
(1)役員の異動
① 新任取締役候補
・服部弘
取締役製造部長兼システム管理課課長
(現上席執行役員製造部長兼システム管理課課長)
・渡邉英士
取締役(非常勤)※1
(現 イナバインターナショナル株式会社代表取締役社長)
(現 イナバロジスティクス株式会社代表取締役社長)※2
・就任予定日:2026年10月29日
②
取締役の異動
・稲葉裕次郎代表取締役社長(現代表取締役社長兼営業本部長)
・田中茂樹
専務取締役製造本部長(現常務取締役製造本部長)
・武田浩
専務取締役管理本部長(現常務取締役管理本部長)
・齋藤健太郎常務取締役技術本部長(現取締役技術本部長)
・異動予定日:2026年10月29日
③退任予定取締役
・佐伯則和(現取締役(特命事項担当))
・辞任予定日:2026年10月29日
※1渡邉英士氏は、イナバインターナショナル株式会社代表取締役社長との兼職となります。
※2渡邉英士氏は、2026年10月29日付けでイナバロジスティクス株式会社代表取締役社長を退任する予定です。
(2)その他
該当事項はありません。
決算短信
 ガレージサイズの選び方をご紹介します。
 NEW!
大切なタイヤを長持ちさせる保管術!タイヤ専用物置とフォルタ専用オプションの違いや選び方を解説します。