株主優待制度の一部変更(拡充)に関するお知らせ
Bull 1
Bear 0
Routine
|
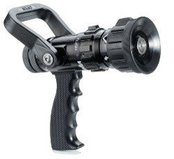
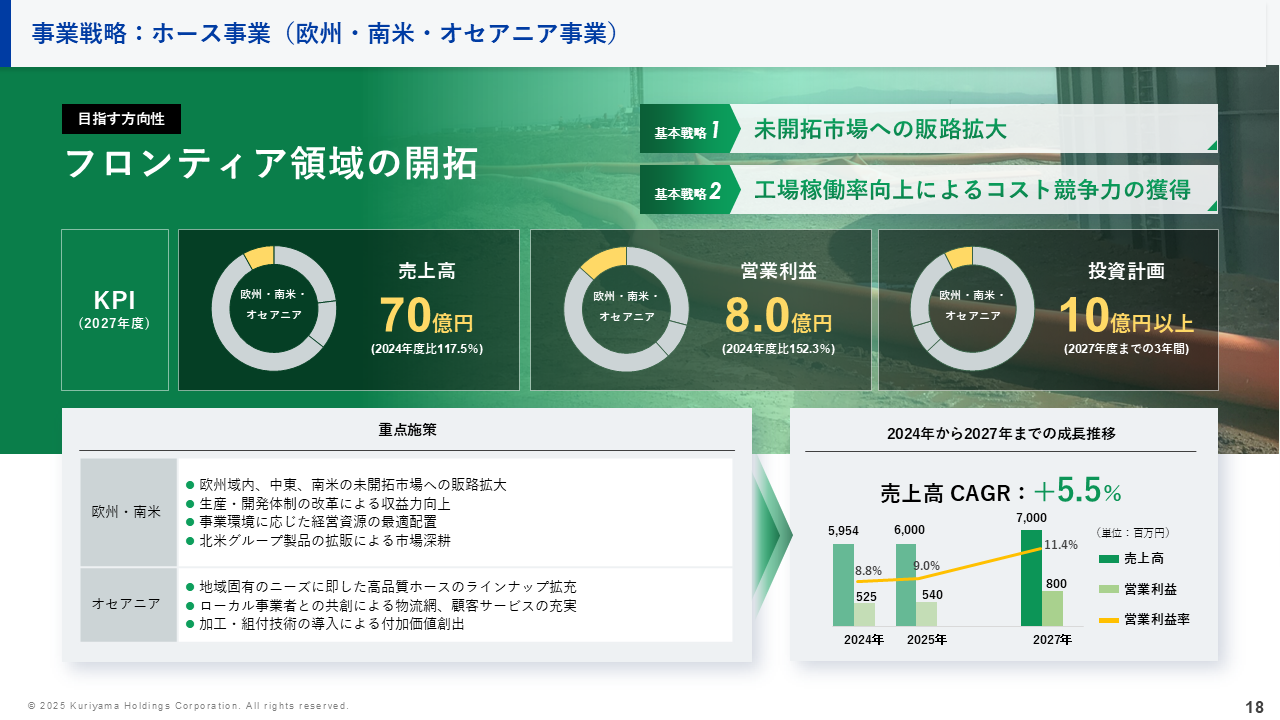
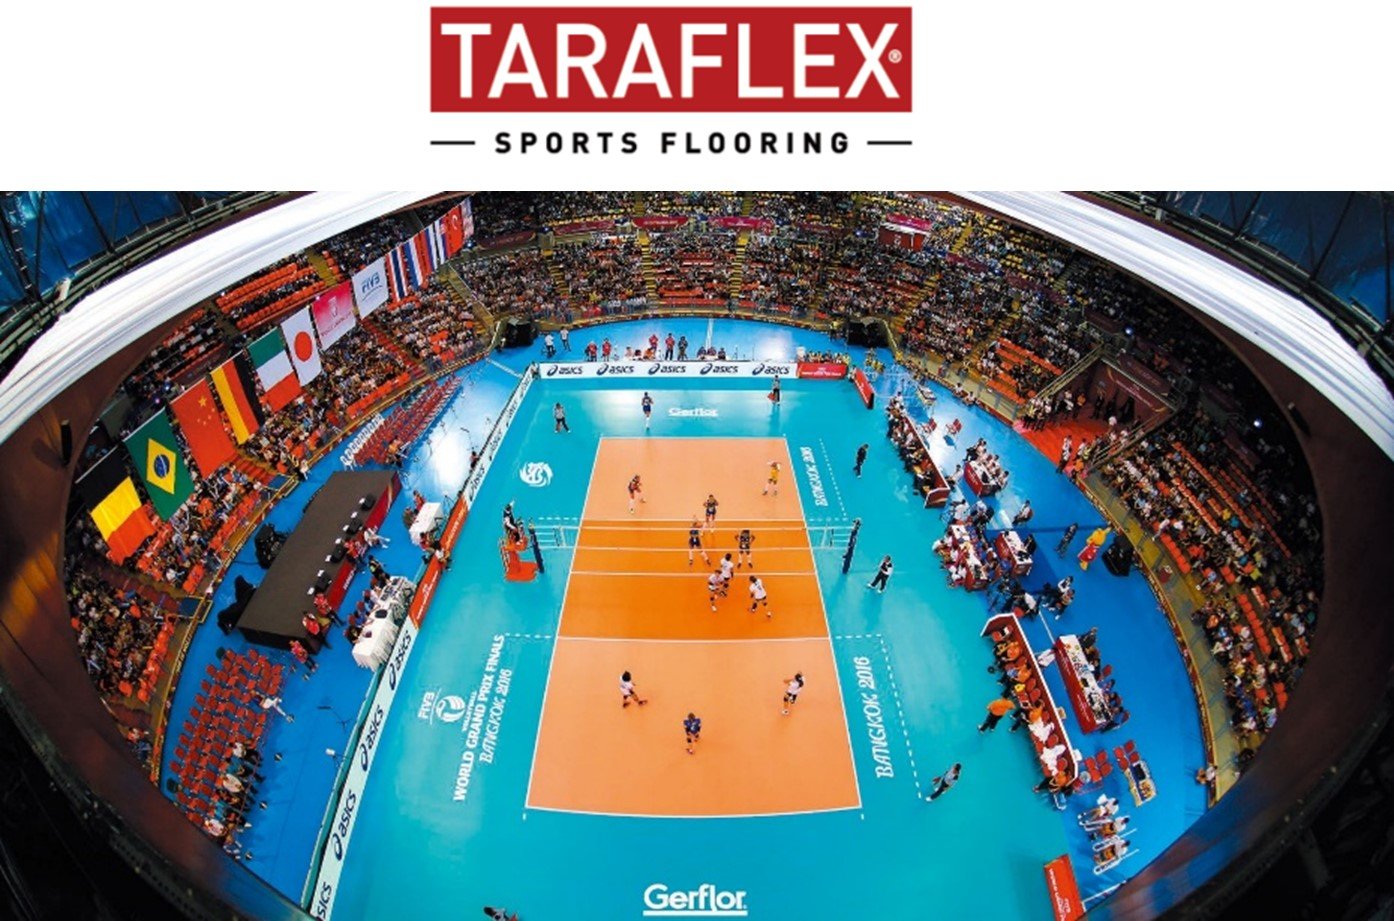
Kuriyama Holdings Corporation is a pure holding company that manages a group of subsidiaries engaged in the manufacturing and distribution of industrial materials and hoses. The group operates through four main segments: Asia, North America, Europe/South America/Oceania, and Other. In the Asia segment, the company produces industrial rubber and resin products for agricultural machinery, construction equipment, and automotive applications, including urea SCR sensors and modules. It also supplies sports and construction materials such as all-weather rubber tracks, elastic sports sheets, rubber bearings, and fenders for bridges, ports, and rail facilities. The North America segment focuses on the manufacturing and sale of industrial hoses and fittings, while the Europe, South America, and Oceania segment handles the production and distribution of layflat hoses, fire hoses, and nozzles. Key subsidiaries include Kuriyama Japan, Kuriyama of America, Inc., Accuflex Industrial Hose, Ltd., and Kuriyama Canada Inc. The company serves customers in the agricultural, construction, automotive, and industrial sectors across Asia, North America, Europe, South America, and Oceania. Summarised from the annual report, fiscal year ended Dec 2025 |
Industry Specialty Chemicals | Homepage kuriyama-holdings.com |
| Sector Basic Materials | IR page kuriyama-holdings.com | |
|
Tags
industrial rubber, industrial resin, industrial hoses, urea scr sensors, sports facilities, construction materials, fire hoses, automotive parts, agricultural machinery, construction machinery, Kuriyama Japan, San-E, Shanghai Kuriyama Trading Co. Ltd., Mitoyo, Shanghai Sanfeng Sane Trading Co. Ltd., Mitoyo Rubber (Thailand) Co. Ltd., Mitoyo Plastics (Thailand) Co. Ltd., Jiangwang Ohji Rubber Co. Ltd., Kuriyama Plezia, Kuriyama R&D, Kuriyama of America Inc., Kuri Tec Corporation, Accuflex Industrial Hose Ltd. (USA), Kuriyama de Mexico S.de R.L.de C.V., Kuriyama Services S.de R.L. de.C.V., Kuriyama Canada Inc., Accuflex Industrial Hose Ltd. (Canada), Kuri Tec Manufacturing Inc., Piranha Hose Products Inc., Tigerflex Corporation, Alfagomma America Inc., Técnicas e Ingeniería de Protección S.A.U., Industrias Quilmes S.A.U., Kuriyama Australia Pty Ltd., Kuriyama Europe Cooperatief U.A., Kuriyama (Thailand) Co. Ltd., Unika Rubber Products Sdn. Bhd., Kuriyama-Ohji (Thailand) Ltd., Norma Japan, Ohji Rubber Chemical Co. Ltd., Mond Track, Tara Flex, Aston, Super Materials
|
Press page kuriyama-holdings.com/press |
Metrics
| Valuation | |
|---|---|
| Market cap | ¥ 40.854B |
| Market cap (USD) | $ 255.34M |
| P/E | 9.12 |
| PEG | 3.33 |
| P/BV | 0.79 |
| P/S | 0.41 |
| P/OCF | 9.75 |
| P/FCF | 248.16 |
| Dividend yield | 3.3% |
| Turnover / mcap | — |
| Returns | |
|---|---|
| ROE | 8.4% |
| ROI | 6.6% |
| ROIC | 4.9% |
| Profit margin | 4.4% |
| Growth | |
|---|---|
| Revenue growing | Yes |
| Profits growing | Yes |
| Revenue up 3y | Yes |
| Revenue up 5y | Yes |
| Earnings growth 3y (net profit CAGR) | 2.7% |
| Quality | |
|---|---|
| Profitable | Yes |
| Margin expanding | No |
| Buying back stock | No |
| Diluting (TTM) | No |
| Debt/Equity | — |
| Podcast bulls (TTM) | Sign up |
| Podcast bears (TTM) | Sign up |
| Podcast sentiment (TTM) | Sign up |
| Podcast sentiment % (TTM) | Sign up |
| News sentiment (TTM) | 2 |
| Quality score | 27.8% |
| Insiders | |
|---|---|
| Buys, 1w | Sign up |
| Buys, 1m | Sign up |
| Buys, 1y | Sign up |
| Sells, 1w | Sign up |
| Sells, 1m | Sign up |
| Sells, 1y | Sign up |
Sign up to see this company's insider trades
| Figure | FY 2025 | FY 2024 | FY 2023 | FY 2022 | FY 2021 | FY 2020 | FY 2019 | FY 2018 | FY 2017 | FY 2016 | FY 2015 | FY 2014 | FY 2013 | FY 2012 |
|---|---|---|---|---|---|---|---|---|---|---|---|---|---|---|
| Revenue | 88.686B | 77.895B | 71.673B | 71.476B | 59.549B | 49.953B | 55.131B | 52.006B | 48.943B | 44.829B | 45.643B | 40.048B | 35.921B | 33.16B |
| Net profit | 3.944B | 3.545B | 3.793B | 3.637B | 3.81B | 1.445B | 2.03B | 1.739B | 2.543B | 1.567B | 2.45B | 1.754B | 1.563B | 1.288B |
| Free cash flow | 164.629M | 5.321B | 2.893B | -3.163B | 2.018B | 2.377B | 1.235B | -1.062B | -407.976M | 1.731B | 1.481B | — | — | — |
| Figure | FY 2025 | FY 2024 | FY 2023 | FY 2022 | FY 2021 | FY 2020 | FY 2019 | FY 2018 | FY 2017 | FY 2016 | FY 2015 | FY 2014 | FY 2013 | FY 2012 |
|---|---|---|---|---|---|---|---|---|---|---|---|---|---|---|
| Share price | 1.66K | 1.244K | 906.3 | 823.89 | 1.188K | 644.35 | 781.05 | 731.99 | 2.71K | 1.677K | 1.757K | 1.174K | 1.282K | 695.09 |
| Price performance 12m | 0.33 | 0.37 | 0.1 | -0.31 | 0.84 | -0.18 | 0.07 | -0.73 | 0.62 | -0.05 | 0.5 | -0.08 | 0.85 | — |
Filed figures
Lines the statements and their notes report beside the headline figures, read from the filings' XBRL as filed (no restatement applied), with figures computed from one filing's own lines. Cash-flow lines carry their cash direction: an outflow is negative. Each period links to its filing; a figure's period, report date and tag are in its tooltip.
| Figure | Dec 2016 | Dec 2017 | Dec 2018 | Dec 2019 | Dec 2020 | Dec 2021 | Dec 2022 | Dec 2023 | Dec 2024 | Dec 2025 |
|---|---|---|---|---|---|---|---|---|---|---|
| Balance sheet detail | ||||||||||
| Trade receivables (JPY) | 7.27B | 8.95B | 8.94B | 9.49B | 8.99B | 11B | 21.2B | 19.5B | 18.7B | 23.6B |
| ↳ YoY growth | -9.9% | +23.2% | -0.2% | +6.1% | -5.3% | +22.2% | +92.6% | -7.7% | -4.4% | +26.3% |
| ↳ 5y CAGR | +2.2% | +8.6% | +18.8% | +16.9% | +14.5% | +21.3% | ||||
| Borrowings, current (JPY) | 4.85B | 5.93B | 7.53B | 7.12B | 5.37B | 4.73B | 8.97B | 5.4B | 3.6B | 5.55B |
| Borrowings, non-current (JPY) | 5.34B | 4.92B | 5.21B | 5.04B | 6.19B | 4.29B | 3.51B | 2.9B | 2.34B | 7.52B |
| Lease liabilities (JPY) | — | — | 19.1M | 512M | 470M | 417M | 949M | 1.24B | 3.9B | 7B |
| Cash and deposits (JPY) | 6.4B | 6.13B | 5.98B | 5.95B | 7.31B | 7.22B | 7.45B | 7.44B | 9.41B | 11.5B |
| Intangible assets (JPY) | 2.51B | 2.24B | 1.85B | 1.45B | 619M | 617M | 598M | 585M | 544M | 479M |
| Net debt (borrowings + leases - cash) (JPY) | 3.79B | 4.72B | 6.76B | 6.72B | 4.72B | 2.22B | 5.98B | 2.1B | 436M | 8.6B |
| Cash flow detail | ||||||||||
| Operating cash flow (JPY) | 2.64B | 1.75B | 477M | 2.97B | 4.51B | 3.22B | -2.12B | 4.5B | 6.87B | 4.19B |
| Purchases of property, plant and equipment (JPY) | -909M | -2.06B | -1.5B | -1.66B | -2.1B | -1.09B | -957M | -1.49B | -1.47B | -3.97B |
| Purchases of intangible assets (JPY) | -138M | -101M | -38.4M | -77.1M | -30.8M | -110M | -86.7M | -114M | -78.4M | -52M |
| Change in receivables (cash effect) (JPY) | 769M | -1.57B | -214M | -570M | 444M | -1.43B | 184M | 1.42B | 929M | 1.07B |
| Change in inventories (cash effect) (JPY) | 98.2M | -1.25B | -2.26B | 443M | 953M | -1.74B | -6.94B | 513M | 1.51B | -1.38B |
| Change in payables (cash effect) (JPY) | -287M | 1.41B | 554M | -780M | 26.8M | 2.1B | -863M | -1.04B | -885M | 154M |
| Dividends paid (cash effect) (JPY) | -354M | -354M | -351M | -376M | -396M | -415M | -494M | -592M | -1.33B | -1.2B |
| Share buybacks (cash effect) (JPY) | -70,000 | -1.79B | -81,000 | -103,000 | -38,000 | -80,000 | — | — | -168,000 | -37,000 |
| Interest paid (cash effect) (JPY) | -112M | -108M | -162M | -172M | -118M | -99.5M | -142M | -319M | -146M | -175M |
| Income taxes paid (cash effect) (JPY) | -1.06B | -848M | -1.49B | -884M | -1.19B | -1.24B | -1.22B | -2.25B | -1.23B | -2.47B |
| Operating cash flow before change in receivables (JPY) | 1.87B | 3.32B | 691M | 3.54B | 4.06B | 4.65B | -2.3B | 3.08B | 5.95B | 3.12B |
| Free cash flow (OCF - PPE - intangibles) (JPY) | 1.59B | -408M | -1.06B | 1.24B | 2.38B | 2.02B | -3.16B | 2.89B | 5.32B | 165M |
| Income detail | ||||||||||
| Research and development expense (JPY) | 394M | 450M | 329M | 345M | 345M | 394M | 412M | 492M | 539M | 305M |
| ↳ 5y CAGR | +15.0% | 0.0% | -1.8% | +8.4% | +9.3% | -2.4% | ||||
| Total comprehensive income (JPY) | 742M | 2.74B | 820M | 2.09B | 590M | 5.82B | 6.26B | 6.27B | 6.14B | 5.43B |
| Comprehensive income to owners (JPY) | 738M | 2.74B | 818M | 2.08B | 589M | 5.82B | 6.26B | 6.27B | 6.14B | 5.43B |
| Provision for credit losses (JPY) | 2.49M | -263,000 | 10.6M | 35.9M | 29.3M | 8.53M | 14.2M | 19.8M | -16.5M | 1.11M |
| Credit cost ratio (credit losses / average receivables) (%) | 0.0% | 0.0% | 0.1% | 0.4% | 0.3% | 0.1% | 0.1% | 0.1% | 0.1% | 0.0% |
| Segments | ||||||||||
| Asia Business · Segment revenue (JPY) | — | — | — | — | — | — | — | 28.4B | 28.2B | 38.7B |
| ↳ YoY growth | -0.7% | +37.1% | ||||||||
| Asia Business · Segment operating income (JPY) | — | — | — | — | — | — | — | 2.35B | 2.68B | 3.21B |
| Europe And South America Business · Segment revenue (JPY) | — | — | — | — | — | — | — | 6.96B | — | — |
| Europe And South America Business · Segment operating income (JPY) | — | — | — | — | — | — | — | 340M | — | — |
| Europe South America And Oceania Business · Segment revenue (JPY) | — | — | — | — | — | — | — | — | 7.68B | 7.32B |
| ↳ YoY growth | -4.7% | |||||||||
| Europe South America And Oceania Business · Segment operating income (JPY) | — | — | — | — | — | — | — | — | 525M | 246M |
| Industrial Materials · Segment revenue (JPY) | — | — | — | — | — | — | — | 18.6B | 17.3B | 27.1B |
| ↳ YoY growth | -6.8% | +56.4% | ||||||||
| Industrial Materials · Segment operating income (JPY) | — | — | — | — | — | — | — | 2.41B | 2.1B | 2.28B |
| North America Business · Segment revenue (JPY) | — | — | — | — | — | — | — | 39.1B | 44.7B | 45.4B |
| ↳ YoY growth | +14.5% | +1.6% | ||||||||
| North America Business · Segment operating income (JPY) | — | — | — | — | — | — | — | 2.16B | 2.55B | 2.32B |
| Other Businesses Asia Business · Segment revenue (JPY) | — | — | — | — | — | — | — | 788M | 996M | 533M |
| ↳ YoY growth | +26.3% | -46.5% | ||||||||
| Other Businesses Asia Business · Segment operating income (JPY) | — | — | — | — | — | — | — | -311M | -281M | -38.4M |
| Sports And Construction Facility Materials Asia Business · Segment revenue (JPY) | — | — | — | — | — | — | — | 9.05B | 9.9B | 11.1B |
| ↳ YoY growth | +9.4% | +11.8% | ||||||||
| Sports And Construction Facility Materials Asia Business · Segment operating income (JPY) | — | — | — | — | — | — | — | 252M | 864M | 970M |
| Reported | Mar 28, 2017 | Mar 28, 2018 | Mar 26, 2020 | Mar 26, 2020 | Mar 25, 2021 | Mar 24, 2022 | Mar 28, 2023 | Mar 27, 2025 | Mar 27, 2025 | Mar 25, 2026 |
Sign up to see institutional holdings
Sign UpPodcast Mentions
Sign up to see podcast mentions and sentiment
Sign UpTimely disclosures published on TDnet, newest first, titles as filed in Japanese. The link opens the disclosure on TDnet. Filings with EDINET (periodic reports, extraordinary reports, offerings, holding and buy-back reports), newest first, titles as filed in Japanese. The link opens the filing on EDINET. Press releases from the company's own website, newest first.
2026年12月期 第3四半期決算短信〔日本基準〕(連結)
Bull 1
Bear 0
Results
システムメンテナンスのお知らせ
Bull 0
Bear 0
Routine
お客様各位
平素より弊社Webサイトをご利用いただき、誠にありがとうございます。
現在、システムメンテナンスのため、Webサイトをご利用いただけません。
■ システムメンテナンス実施期間 メンテナンス終了まで
ご利用中のお客様には大変ご迷惑をお掛けいたしますが、何卒ご理解とご協力のほど、よろしくお願い申し上げます。
2026年10月22日
クリヤマホールディングス株式会社
System Maintenance Notice
Dear Customers,
Thank you for visiting our website.
Our website is currently unavailable due to system maintenance.
■ System Maintenance Period
Until maintenance is completed
We apologize for any inconvenience this may cause and appreciate your understanding and cooperation.
October 22, 2026
KURIYAMA HOLDINGS CORPORATION
KURIYAMA HOLDINGS
社会の課題に向き合い、
未来へつなぐ。
クリヤマホールディングス株式会社
© Kuriyama Holdings Corporation. All rights reserved.


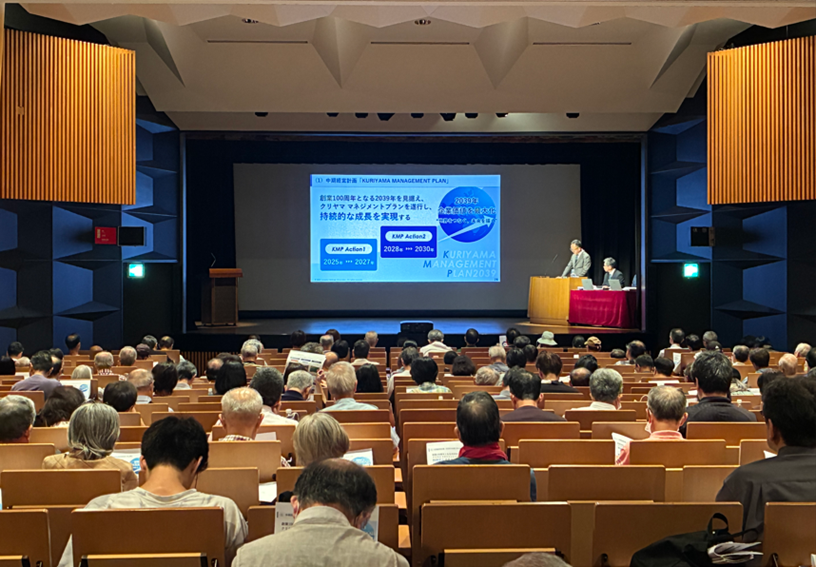
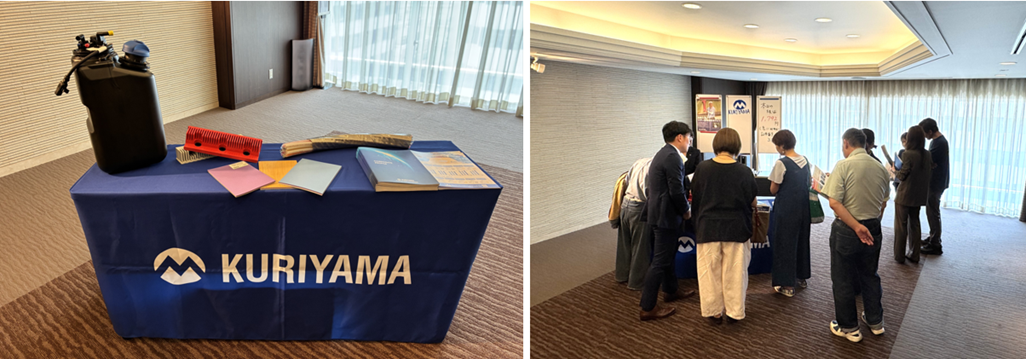
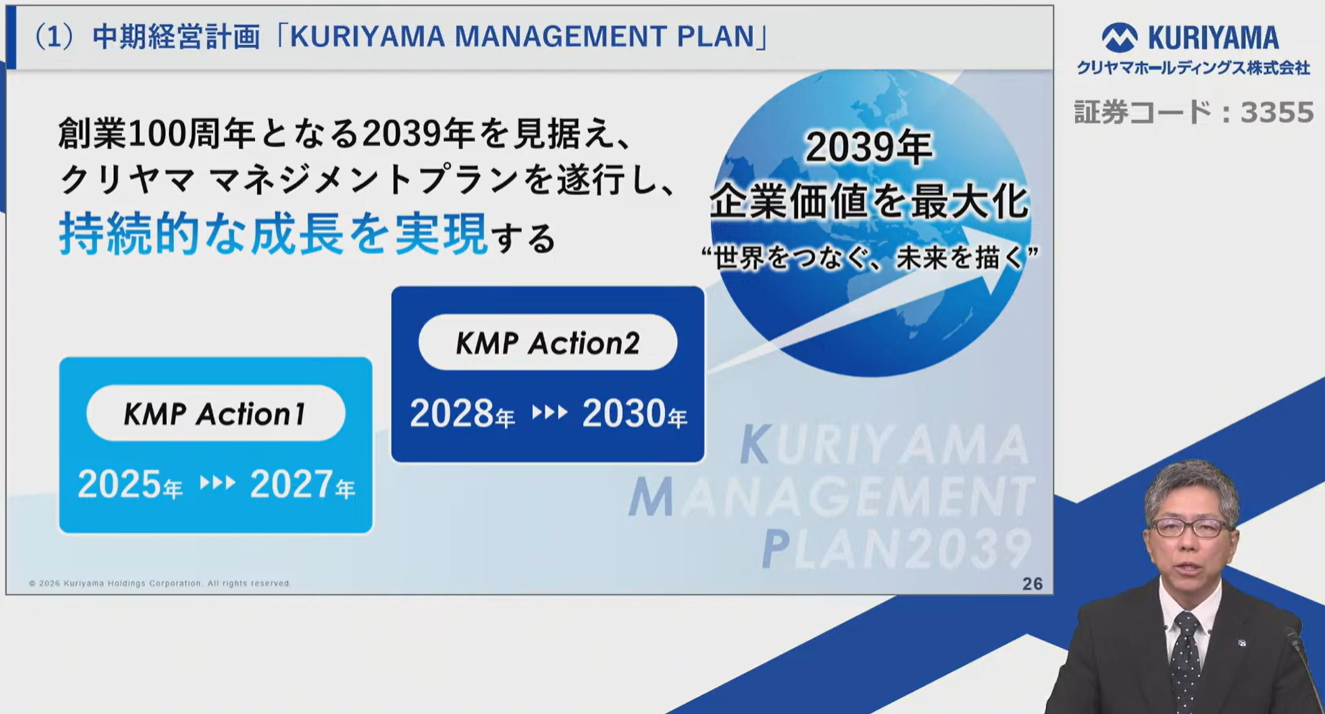
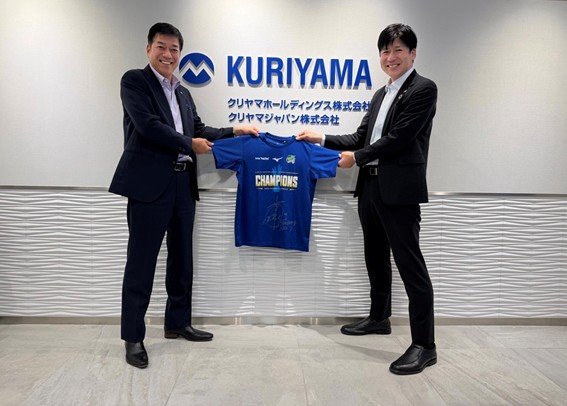
 「ビジネスSwitch ~時代を照らす企業の戦略~」は、時代の変化や社会課題に向き合いながら成長を続ける企業にスポットを当て、その経営戦略や取り組み、未来へのビジョンを紹介する番組です。
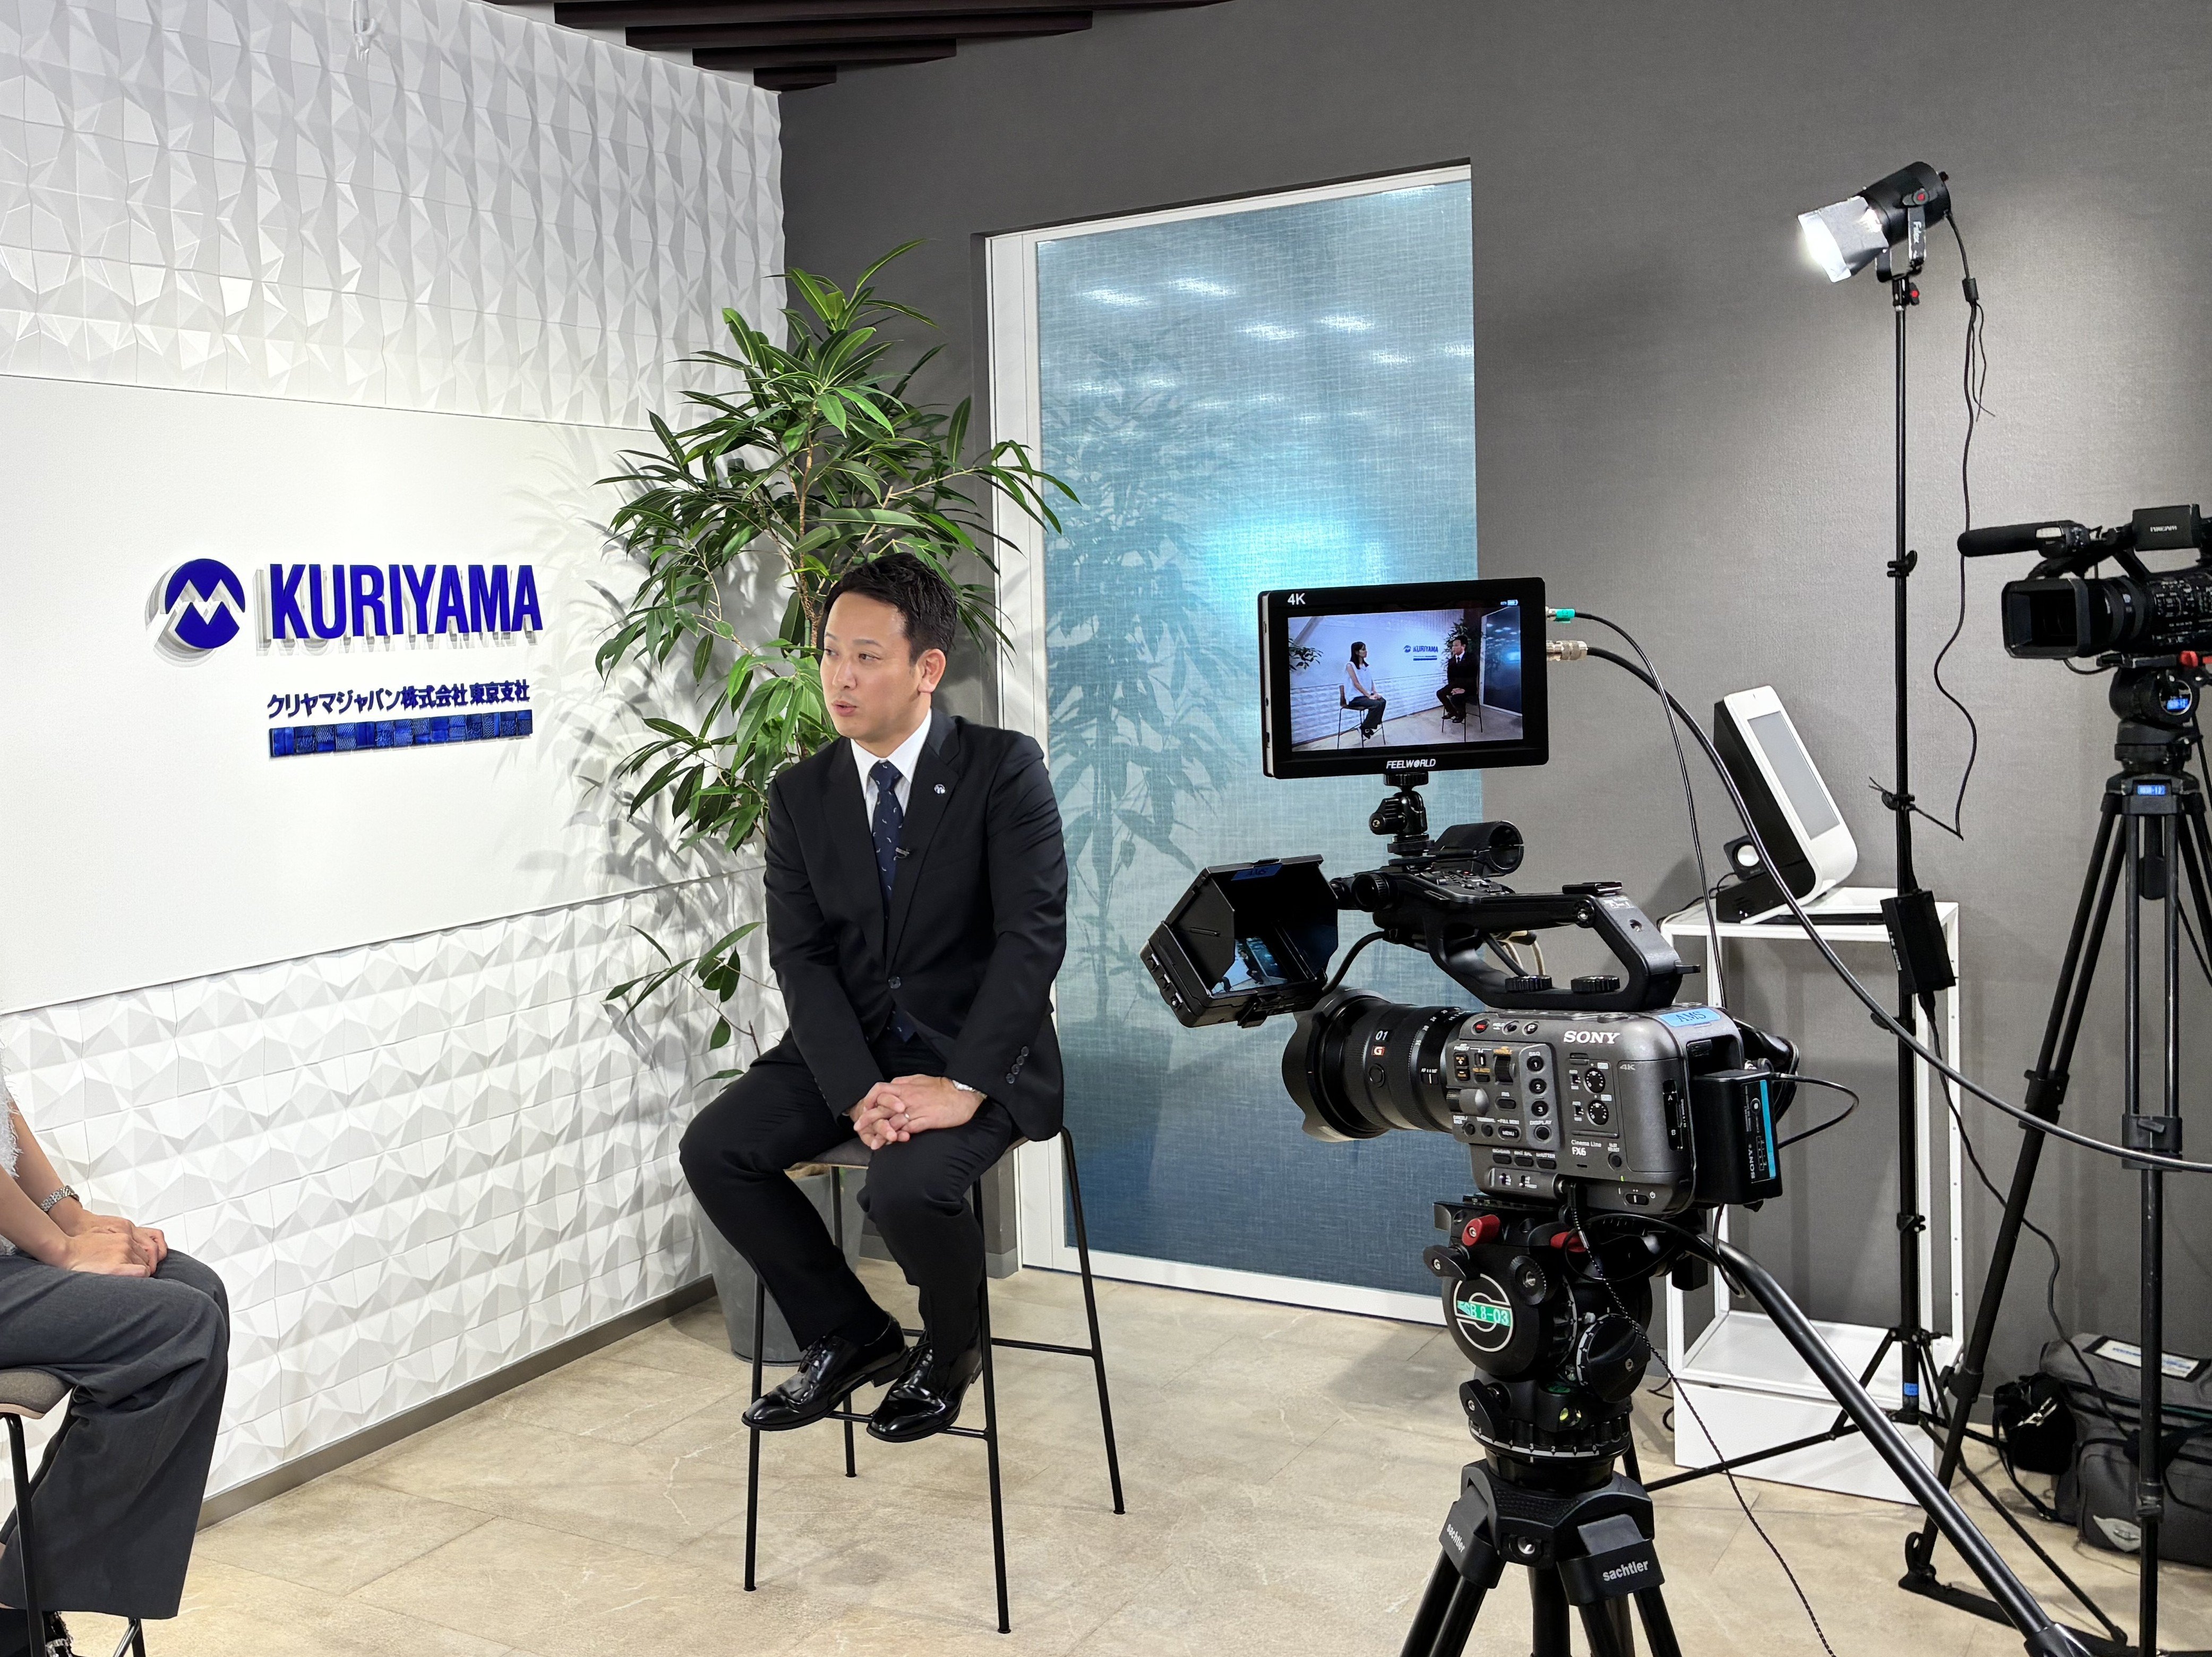
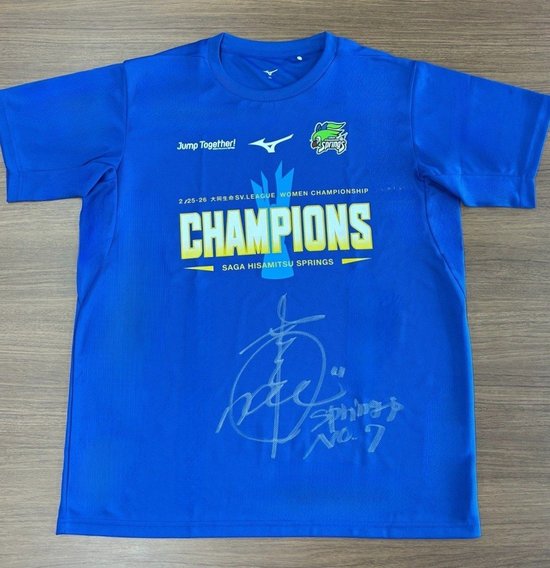
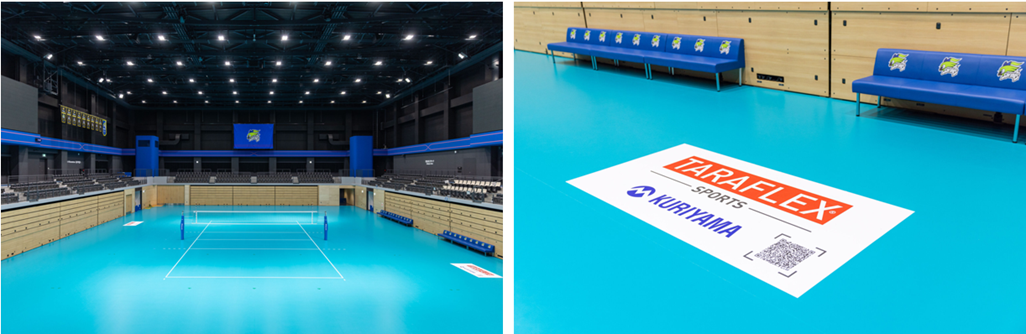


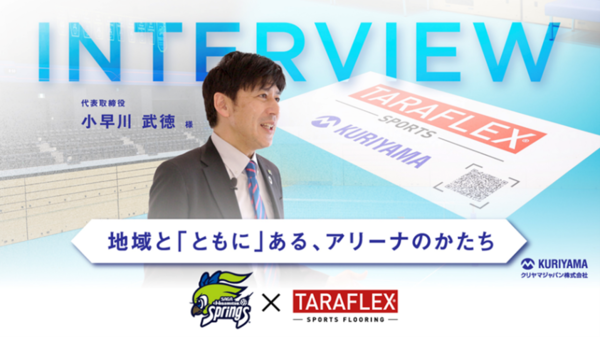 インタビュー動画はこちら



Prompts
Click prompts to add them under the company line, click again to take one out, then copy the result into your AI chat. Shared by Asian Century Stocks and Uncovered Thai Stocks. Thank you.
Kuriyama Holdings Corporation (ticker 3355), listed in Japan.
Copied
ETFs Holding Kuriyama Holdings Corporation
Exchange-traded funds whose newest published daily portfolio holds one of the company's listings, largest weight first.
| ETF | Weight in ETF | Shares | Market value | As of |
|---|---|---|---|---|
| DFIS | 0.00% | 7,200 | $ 77.268K | Nov 12, 2026 |
| DFAX | 0.00% | 9,700 | $ 104.098K | Nov 12, 2026 |
| DFIC | 0.00% | 10,930 | $ 117.298K | Nov 12, 2026 |
| DFAI | 0.00% | 2,300 | $ 24.683K | Nov 12, 2026 |
| DISV | 0.00% | 200 | $ 2,146.34 | Nov 12, 2026 |
| AVDE | 0.00% | 2,200 | $ 23.135K | Nov 16, 2026 |
| AVDS | 0.00% | 400 | $ 4,206.33 | Nov 16, 2026 |