2026年10月度 月次営業速報に関するお知らせ
Bull 0
Bear 0
Routine
3333
Fiscal year ends February
Quarters are offset from the calendar — Q1 is Mar–May
|
Asahi Co., Ltd. is a bicycle retail and distribution company operating a single business segment. The company sells bicycles, parts, and accessories, and provides maintenance and repair services through a network of directly operated stores and franchise locations across Japan. It also conducts e-commerce sales via its official online store and third-party marketplaces. The company develops and sells its own brand of bicycles, including electric-assist and folding models, which are manufactured by overseas partners in China and Taiwan. It also distributes third-party brands and co-developed products. Asahi holds exclusive Japanese sales agency rights for certain bicycle and accessory brands, supplying them to domestic retailers. The company generates revenue from product sales, franchise royalties, service fees, and membership fees for its Cycle Mate program. A former subsidiary, Aisanqi (Beijing) Bicycle Trading Co., Ltd., was liquidated in December 2025. Summarised from the annual report, fiscal year ended Feb 2026 |
Industry Specialty Retail | Homepage cb-asahi.co.jp |
| Sector Consumer Cyclical | IR page cb-asahi.co.jp | |
|
Tags
bicycle retail, bicycle repair, e-commerce, franchise operations, electric-assist bicycles, bicycle parts, wholesale distribution, Cycle Mate, Aisanqi (Beijing) Bicycle Trading Co. Ltd.
|
Press page cb-asahi.co.jp/news |
Metrics
| Valuation | |
|---|---|
| Market cap | ¥ 32.722B |
| Market cap (USD) | $ 204.517M |
| P/E | 17.73 |
| PEG | — |
| P/BV | 0.79 |
| P/S | 0.40 |
| P/OCF | 5.19 |
| P/FCF | 7.57 |
| Dividend yield | 4.0% |
| Turnover / mcap | — |
| Returns | |
|---|---|
| ROE | 5.7% |
| ROI | 5.6% |
| ROIC | 6.3% |
| Profit margin | 2.8% |
| Growth | |
|---|---|
| Revenue growing | No |
| Profits growing | No |
| Revenue up 3y | No |
| Revenue up 5y | No |
| Earnings growth 3y (net profit CAGR) | -12.3% |
| Quality | |
|---|---|
| Profitable | Yes |
| Margin expanding | No |
| Buying back stock | No |
| Diluting (TTM) | No |
| Debt/Equity | — |
| Podcast bulls (TTM) | Sign up |
| Podcast bears (TTM) | Sign up |
| Podcast sentiment (TTM) | Sign up |
| Podcast sentiment % (TTM) | Sign up |
| News sentiment (TTM) | 0 |
| Quality score | -11.1% |
| Insiders | |
|---|---|
| Buys, 1w | Sign up |
| Buys, 1m | Sign up |
| Buys, 1y | Sign up |
| Sells, 1w | Sign up |
| Sells, 1m | Sign up |
| Sells, 1y | Sign up |
Sign up to see this company's insider trades
| Figure | FY 2026 | FY 2025 | FY 2024 | FY 2023 | FY 2022 | FY 2021 | FY 2020 | FY 2019 | FY 2018 | FY 2017 | FY 2016 | FY 2015 | FY 2014 | FY 2013 |
|---|---|---|---|---|---|---|---|---|---|---|---|---|---|---|
| Revenue | 81.375B | 81.593B | 78.076B | 74.712B | 71.399B | 69.456B | 59.853B | 57.461B | 53.621B | 51.089B | 48.402B | 44.561B | 42.165B | 37.498B |
| Net profit | 2.269B | 3.556B | 3.113B | 3.366B | 3.542B | 4.718B | 2.559B | 2.361B | 2.051B | 2.165B | 1.968B | 1.371B | 2.189B | 2.172B |
| Free cash flow | 4.321B | 1.591B | 5.727B | 35.527M | -540.552M | 5.744B | 2.709B | 3.386B | 63.325M | 2.433B | 1.222B | — | — | — |
| Figure | FY 2026 | FY 2025 | FY 2024 | FY 2023 | FY 2022 | FY 2021 | FY 2020 | FY 2019 | FY 2018 | FY 2017 | FY 2016 | FY 2015 | FY 2014 | FY 2013 |
|---|---|---|---|---|---|---|---|---|---|---|---|---|---|---|
| Share price | 1.289K | 1.447K | 1.276K | 1.366K | 1.33K | 1.52K | 1.265K | 1.507K | 1.317K | 1.308K | 1.294K | 1.162K | 1.335K | 1.241K |
| Price performance 12m | -0.11 | 0.13 | -0.07 | 0.03 | -0.13 | 0.2 | -0.16 | 0.14 | 0.01 | 0.01 | 0.11 | -0.13 | 0.08 | — |
Filed figures
Lines the statements and their notes report beside the headline figures, read from the filings' XBRL as filed (no restatement applied), with figures computed from one filing's own lines. Cash-flow lines carry their cash direction: an outflow is negative. Each period links to its filing; a figure's period, report date and tag are in its tooltip.
| Figure | Feb 2017 | Feb 2018 | Feb 2019 | Feb 2020 | Feb 2021 | Feb 2022 | Feb 2023 | Feb 2024 | Feb 2025 | Feb 2026 |
|---|---|---|---|---|---|---|---|---|---|---|
| Balance sheet detail | ||||||||||
| Trade receivables (JPY) | 1.5B | 1.62B | 1.84B | 2.48B | 3.17B | 3.16B | 3.53B | 3.78B | 4B | 3.94B |
| ↳ YoY growth | +30.1% | +7.5% | +13.9% | +34.8% | +27.7% | -0.5% | +11.8% | +7.2% | +5.8% | -1.4% |
| ↳ 5y CAGR | +22.3% | +16.0% | +16.9% | +15.5% | +10.0% | +4.5% | ||||
| Other receivables (JPY) | 167M | 206M | 219M | 206M | 311M | 247M | 194M | 207M | 210M | 238M |
| Borrowings, current (JPY) | 750M | 3.75B | 1.75B | 188M | — | — | — | — | — | — |
| Borrowings, non-current (JPY) | 2.19B | 438M | 188M | — | — | — | — | — | — | — |
| Cash and deposits (JPY) | 1.97B | 2.47B | 2.89B | 2.95B | 7.59B | 5.96B | 5.31B | 9.52B | 9.46B | 12.3B |
| Intangible assets (JPY) | 339M | 358M | 408M | 413M | 471M | 515M | 836M | 1.1B | 1.06B | 833M |
| Net debt (borrowings + leases - cash) (JPY) | 971M | 1.72B | -953M | -2.76B | — | — | — | — | — | — |
| Cash flow detail | ||||||||||
| Operating cash flow (JPY) | 4.3B | 1.23B | 4.79B | 3.95B | 7.3B | 1.59B | 2.53B | 8.58B | 4.29B | 6.3B |
| Purchases of property, plant and equipment (JPY) | -1.74B | -1.03B | -1.19B | -1.13B | -1.35B | -1.93B | -2.06B | -2.37B | -2.51B | -1.87B |
| Purchases of intangible assets (JPY) | -128M | -134M | -216M | -117M | -203M | -193M | -436M | -487M | -191M | -108M |
| Change in receivables (cash effect) (JPY) | -272M | -152M | -237M | -628M | -774M | 63.6M | -314M | -266M | -228M | 35.9M |
| Change in inventories (cash effect) (JPY) | 326M | -1.97B | 291M | -375M | -1.24B | -1.98B | -3.5B | 2.99B | -1.22B | 766M |
| Change in payables (cash effect) (JPY) | -260M | 162M | -360M | 927M | 719M | 313M | 511M | -905M | 482M | 285M |
| Dividends paid (cash effect) (JPY) | -367M | -367M | -368M | -472M | -473M | -734M | -735M | -1.32B | -1.25B | -1.31B |
| Share buybacks (cash effect) (JPY) | — | — | — | -110M | -60,000 | — | — | — | -113M | — |
| Interest paid (cash effect) (JPY) | -5.84M | -4.06M | -3.82M | -483,000 | -227,000 | — | — | — | — | — |
| Income taxes paid (cash effect) (JPY) | -1.07B | -1.76B | -1.23B | -1.71B | -1.51B | -3.13B | -1.56B | -800M | -1.42B | -2.08B |
| Operating cash flow before change in receivables (JPY) | 4.57B | 1.38B | 5.03B | 4.58B | 8.07B | 1.52B | 2.85B | 8.85B | 4.52B | 6.26B |
| Free cash flow (OCF - PPE - intangibles) (JPY) | 2.43B | 63.3M | 3.39B | 2.71B | 5.74B | -541M | 35.5M | 5.73B | 1.59B | 4.32B |
| Income detail | ||||||||||
| Provision for credit losses (JPY) | -939,000 | -976,000 | -10.8M | — | — | — | — | — | — | — |
| Credit cost ratio (credit losses / average receivables) (%) | 0.1% | 0.1% | 0.6% | — | — | — | — | — | — | — |
| Reported | May 15, 2017 | May 14, 2018 | May 20, 2019 | May 18, 2020 | May 17, 2021 | May 16, 2022 | May 15, 2023 | May 13, 2024 | May 19, 2025 | May 13, 2026 |
Sign up to see institutional holdings
Sign UpPodcast Mentions
Sign up to see podcast mentions and sentiment
Sign UpTimely disclosures published on TDnet, newest first, titles as filed in Japanese. The link opens the disclosure on TDnet. Filings with EDINET (periodic reports, extraordinary reports, offerings, holding and buy-back reports), newest first, titles as filed in Japanese. The link opens the filing on EDINET. Press releases from the company's own website, newest first.

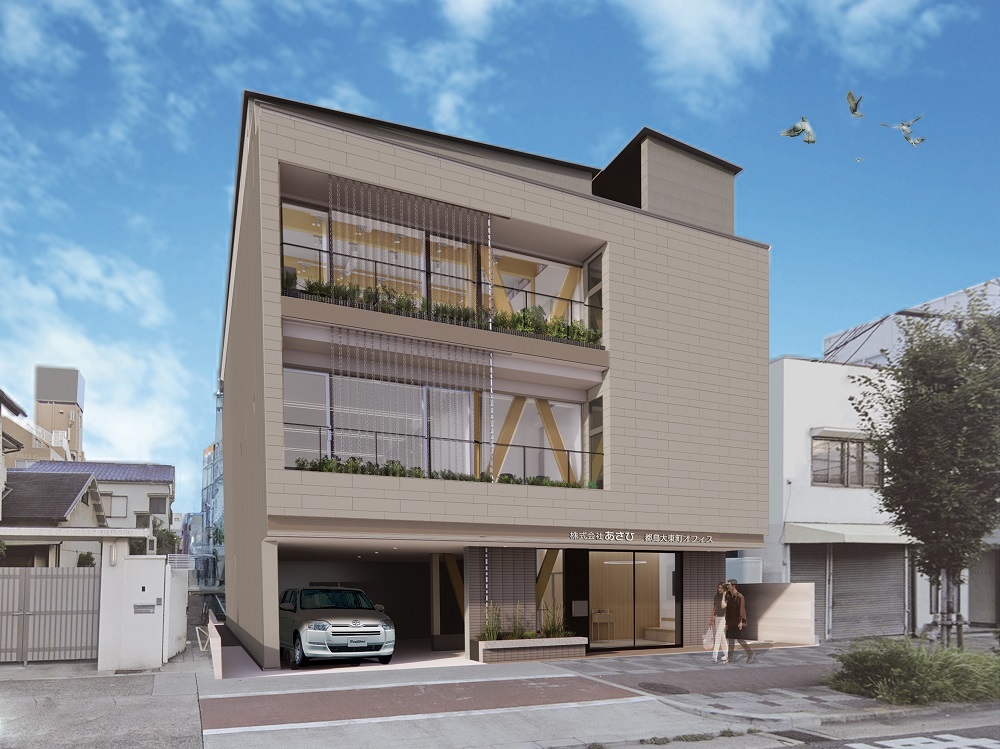 (都島大東町オフィス 完成予想図)

 ショップ・オブ・ザ・イヤーとは、お客様による投票数、2023年度の売上、売上の成長率、注文件数、お客様対応などから年間のベストショップが選ばれる楽天市場の表彰制度です。


Prompts
Click prompts to add them under the company line, click again to take one out, then copy the result into your AI chat. Shared by Asian Century Stocks and Uncovered Thai Stocks. Thank you.
Asahi Co., Ltd. (ticker 3333), listed in Japan.
Copied
ETFs Holding Asahi Co., Ltd.
Exchange-traded funds whose newest published daily portfolio holds one of the company's listings, largest weight first.
| ETF | Weight in ETF | Shares | Market value | As of |
|---|---|---|---|---|
| DISV | 0.02% | 143,500 | $ 1.142M | Nov 12, 2026 |
| AVDV | 0.01% | 201,200 | $ 1.646M | Nov 16, 2026 |
| DFIS | 0.01% | 42,900 | $ 341.537K | Nov 12, 2026 |
| DFIC | 0.00% | 24,800 | $ 197.438K | Nov 12, 2026 |
| DFSI | 0.00% | 1,700 | $ 13.534K | Nov 12, 2026 |
| DFAX | 0.00% | 12,500 | $ 99.515K | Nov 12, 2026 |
| DFAI | 0.00% | 11,956 | $ 95.184K | Nov 12, 2026 |
| AVDE | 0.00% | 200 | $ 1,636.23 | Nov 16, 2026 |
| AVSD | 0.00% | 1,300 | $ 10.636K | Nov 16, 2026 |
| AVDS | 0.00% | 2,100 | $ 17.18K | Nov 16, 2026 |