EDINET提出書類 日本コークス工業株式会社(E00030) 有価証券報告書 【表紙】 【提出書類】 有価証券報告書 【根拠条文】 金融商品取引法第24条第1項 【提出先】 関東財務局長 【提出日】 2026年6月25日 【事業年度】 第23期(自2025年4月1日 【会社名】…
EDINET提出書類
日本コークス工業株式会社(E00030)
有価証券報告書
【表紙】
【提出書類】
有価証券報告書
【根拠条文】
金融商品取引法第24条第1項
【提出先】
関東財務局長
【提出日】
2026年6月25日
【事業年度】
第23期(自2025年4月1日
【会社名】
日本コークス工業株式会社
【英訳名】
NIPPON COKE & ENGINEERING COMPANY,LIMITED
【代表者の役職氏名】
代表取締役社長
【本店の所在の場所】
東京都江東区豊洲三丁目3番3号
【電話番号】
東京 03(5560)1311
【事務連絡者氏名】
経営管理部長
【最寄りの連絡場所】
東京都江東区豊洲三丁目3番3号
【電話番号】
東京 03(5560)1311
【事務連絡者氏名】
経営管理部長
【縦覧に供する場所】
株式会社東京証券取引所
松岡
至2026年3月31日)
小野
弘明
小野
祐介
祐介
(東京都中央区日本橋兜町2番1号)
1/116
EDINET提出書類
日本コークス工業株式会社(E00030)
有価証券報告書
第一部【企業情報】
第1【企業の概況】
1【主要な経営指標等の推移】
(1) 連結経営指標等
回次
第19期
第20期
第21期
第22期
第23期
決算年月
2022年3月
2023年3月
2024年3月
2025年3月
2026年3月
124,711
174,062
135,152
99,045
91,386
11,454
△752
3,640
△10,269
△276
7,380
△1,075
1,898
△13,908
△7,678
売上高
(百万円)
経常利益又は経常損失
(百万円)
(△)
親会社株主に帰属する当
期純利益又は親会社株主
(百万円)
に帰属する当期純損失
(△)
包括利益
(百万円)
7,401
△1,029
2,078
△13,882
△6,802
純資産額
(百万円)
57,343
54,277
56,355
41,600
34,797
総資産額
(百万円)
128,767
140,202
140,713
130,630
126,544
1株当たり純資産額
(円)
197.04
186.50
193.65
142.94
119.57
1株当たり当期純利益金
額又は1株当たり当期純
損失金額(△)
(円)
25.36
△3.70
6.52
△47.79
△26.39
潜在株式調整後1株当た
り当期純利益金額
(円)
−
−
−
−
−
自己資本比率
(%)
44.5
38.7
40.0
31.8
27.5
自己資本利益率
(%)
13.6
△1.9
3.4
△28.4
△20.1
株価収益率
(倍)
5.68
−
20.54
−
−
営業活動によるキャッ
シュ・フロー
(百万円)
4,608
△12,402
10,827
△3,178
8,511
投資活動によるキャッ
シュ・フロー
(百万円)
△4,162
△8,094
△9,876
△16,685
△8,684
財務活動によるキャッ
シュ・フロー
(百万円)
△1,074
21,091
△414
18,813
1,450
現金及び現金同等物の期
(百万円)
末残高
5,019
5,616
6,160
5,105
6,388
従業員数
1,034
1,046
1,022
993
983
[−]
[−]
[−]
[−]
[−]
[外、平均臨時雇用者数]
(人)
(注)1.第20期、第22期および第23期の株価収益率については、親会社株主に帰属する当期純損失であるため記載し
ていない。
2.平均臨時雇用者数は、従業員数の100分の10未満であるため、記載していない。
2/116
EDINET提出書類
日本コークス工業株式会社(E00030)
有価証券報告書
(2) 提出会社の経営指標等
回次
第19期
第20期
第21期
第22期
第23期
決算年月
2022年3月
2023年3月
2024年3月
2025年3月
2026年3月
売上高
(百万円)
116,742
165,580
126,253
89,750
81,972
経常利益又は経常損失
(△)
(百万円)
10,826
△1,478
2,911
△11,325
△149
当期純利益又は当期純損
(百万円)
失(△)
7,011
△1,525
1,490
△14,522
△6,477
資本金
(百万円)
7,000
7,000
7,000
7,000
7,000
普通株式
(千株)
302,349
302,349
302,349
302,349
302,349
純資産額
(百万円)
53,857
50,334
51,996
36,659
30,516
総資産額
(百万円)
122,296
133,239
132,969
123,625
119,082
1株当たり純資産額
(円)
185.06
172.96
178.67
125.97
104.86
1株当たり配当額
(円)
普通株式
7.00
−
3.00
−
−
(うち1株当たり中間配
当額)
(−)
(−)
(−)
(−)
(−)
(円)
24.09
△5.24
5.12
△49.90
△22.26
潜在株式調整後1株当た
り当期純利益金額
(円)
−
−
−
−
−
自己資本比率
(%)
44.0
37.8
39.1
29.7
25.6
自己資本利益率
(%)
13.8
△2.9
2.9
△32.8
△19.3
株価収益率
(倍)
5.98
−
26.17
−
−
配当性向
(%)
29.1
−
58.6
−
−
従業員数
(人)
504
509
503
488
465
[−]
[−]
[−]
[−]
[−]
発行済株式総数
1株当たり当期純利益金
額又は1株当たり当期純
損失金額(△)
[外、平均臨時雇用者数]
株主総利回り
(%)
132.5
82.5
126.3
84.2
109.7
(比較指標:配当込み
TOPIX)
(%)
(102.0)
(107.9)
(152.5)
(150.2)
(113.5)
最高株価
(円)
197
150
162
150
153
最低株価
(円)
100
81
84
84
69
(注)1.平均臨時雇用者数は、従業員数の100分の10未満であるため記載していない。
2.第20期、第22期および第23期の株価収益率については、当期純損失であるため記載していない。
3.第20期、第22期および第23期の提出会社の配当性向については、当期純損失であるため記載していない。
4.株主総利回りは、次の算式により算出している。
当事業年度の4事業年度前から各事業年度までの
各事業年度末日の株価 +
1株当たり配当額の累計額
株主総利回り(%) =
当事業年度の5事業年度前の末日の株価
5.最高・最低株価は、2022年4月4日より東京証券取引所プライム市場におけるものであり、それ以前は東京
証券取引所市場第一部におけるものである。
3/116
EDINET提出書類
日本コークス工業株式会社(E00030)
有価証券報告書
2【沿革】
1889年1月
三井組が政府から三池炭鉱の払下げをうけ、三井組、三井物産、三井銀行が協力して三池炭鉱社
をおき、経営にあたる。
1892年6月
資本金200万円の三井鉱山合資会社設立、三池炭鉱、神岡鉱山その他の経営にあたる。
1893年7月
三井鉱山合資会社を三井鉱山合名会社に改組
1908年4月
三池港を開港
1911年12月
三井合名会社鉱山部が独立し、三井鉱山株式会社(現
1945年8月
終戦により樺太、朝鮮等における事業および財産を失う。
1950年5月
企業再建整備法により神岡鉱業所ほか金属部門を分離し、神岡鉱業株式会社(現
株式会社)設立
1959年10月
三池製作所を分離、株式会社三井三池製作所設立
1963年6月
三井セメント株式会社設立
1964年12月
株式会社三井三池製作所栃木工場を設置
1970年5月
三井鉱山コークス工業株式会社設立
1973年8月
石炭生産部門を分離、三井石炭鉱業株式会社設立
1976年5月
三井セメント株式会社を吸収合併、田川工場設置
1981年4月
三井鉱山コークス工業株式会社を吸収合併、北九州事業所設置
1982年10月
株式会社三井三池製作所から化工機事業部門を分離、三井三池化工機株式会社設立
1988年12月
コークス炉1基を休止
1993年10月
三井三池化工機株式会社を吸収合併、栃木事業所(現
1997年3月
三池炭鉱が閉山、国内石炭採掘事業から撤退
2004年3月
セメント事業から撤退
2006年6月
休止コークス炉再稼働
2008年10月
2009年4月
新日本製鐵株式会社(現日本製鉄株式会社)および住友商事株式会社の持分法適用関連会社と
なる
(その後、2018年4月に住友商事株式会社の持分法適用関連会社から外れる)
商号を日本コークス工業株式会社へ変更
2010年10月
三池事業所を分離、三池港物流株式会社を設立
2014年2月
化工機事業部西日本粉体技術センターを開設
2022年4月
東京証券取引所の市場区分の見直しにより、東京証券取引所の市場第一部からプライム市場に移
行
コークス炉1基を更新、再稼働
2024年9月
4/116
日本コークス工業株式会社)設立
三井金属鉱業
化工機事業部栃木工場)設置
EDINET提出書類
日本コークス工業株式会社(E00030)
有価証券報告書
3【事業の内容】
当社グループ(当社および当社の関係会社)は、当社(日本コークス工業株式会社)、子会社8社およびその他の
関係会社である日本製鉄株式会社および住友商事株式会社で構成されており、コークスの製造・販売、一般炭および
石油コークスの仕入・販売ならびにコールセンター事業、粉粒体機器・装置の製造・販売などを主たる業務としてい
る。
当社グループの主な事業の内容、当社グループ各社の当該事業における位置づけは次のとおりである。
なお、次の3部門は「第5 経理の状況 1 連結財務諸表等 (1)連結財務諸表注記事項」に掲げるセグメン
トの区分と同一である。
(1) コークス事業……………………当社北九州事業所で生産するコークスおよび副産物を国内外鉄鋼会社等に直接販
売するとともに、連結子会社の日本コークス工業東北㈱などの販売会社へ販売し
ている。
(会社総数2社)
(2) 燃料・資源リサイクル事業……海外から輸入した一般炭および石油コークスをセメント・製紙会社等に販売して
いるほか、産業廃棄物処理およびリサイクル事業、コールセンター事業を行って
いる。
(会社総数4社)
(3) 総合エンジニアリング事業……当社栃木工場で製造する粉粒体装置・機器等を販売している。また、連結子会社
の有明機電工業㈱およびサンテック㈱が当社の機械・電気工事等の一部を施工し
ているほか、産業機械等の製造および修理を行っており、その一部を当社で仕入
販売している。
(会社総数3社)
(4) その他……………………………連結子会社の三池港物流㈱は、大牟田地区を中心に港湾荷役および貨物輸送を
行っている。また、当社で、社有地の開発・賃貸事業および仲介・分譲事業を
行っている。
(会社総数3
社)
(注)各事業の会社数の算定において、当社は重複して数えている。
事業の系統図は次のとおりである。
5/116
EDINET提出書類
日本コークス工業株式会社(E00030)
有価証券報告書
4【関係会社の状況】
(2026年3月31日現在)
名称
住所
資本金
(百万円)
主要な事業の
内容
議決権の所有
割合又は被所有
割合(%)
関係内容
(連結子会社)
三池港物流㈱
福岡県
大牟田市
100
その他
100
・役員の兼任2名転籍1名出向1名
・当社が仕入れた石炭の荷役・運送等を行っている。
・当社の事業用地の一部を賃貸している。
有明機電工業㈱
福岡県
大牟田市
90
総合エンジニア
リング事業
100
・役員の兼任1名転籍2名
・当社の電気及び機械工事の一部を施工している。
・当社の事業用地の一部を賃貸している。
三美鉱業㈱
北海道
美唄市
15
燃料・資源リサ
イクル事業
100
・役員の兼任2名
サンテック㈱
栃木県
栃木市
20
総合エンジニア
リング事業
100
・役員の兼任6名転籍1名出向1名
・当社の機械工事の一部を施工している。
・当社の事業用地を賃貸している。
サン情報サービス㈱
東京都
中央区
40
その他
100
・役員の兼任1名転籍3名出向1名
・当社の社内システム管理を一部委託している。
日本コークス工業東北㈱
宮城県
塩竈市
10
コークス事業
100
・役員の兼任4名
・当社の製品を東北地方を中心に販売している。
転籍2名
(その他の関係会社)
日本製鉄㈱
(注)2
住友商事㈱
(注)2
東京都
千代田区
569,519
東京都
千代田区
221,651
製鉄事業
総合商社
(被所有)
22.6
(被所有)
19.4
・役員の兼任1名転籍1名
・当社の製品の購入等を行っている。
・業務提携を行っている。
・役員の兼任1名
・当社の製品の購入等を行っている。
・業務提携を行っている。
(注)1.連結子会社の主要な事業の内容欄には、セグメントの名称を記載している。
2.日本製鉄株式会社および住友商事株式会社は、有価証券報告書提出会社である。
6/116
EDINET提出書類
日本コークス工業株式会社(E00030)
有価証券報告書
第2【事業の状況】
1【経営方針、経営環境及び対処すべき課題等】
当社グループの経営方針、経営環境及び対処すべき課題等は、以下のとおりである。
なお、文中の将来に関する事項は、提出日現在において当社グループが判断したものである。
(1) 会社の企業理念
当社グループの企業理念は、以下の通りである。
・人類の活動に不可欠な資源や素材と高付加価値技術を社会に供給し続けることにより、存在価値のある企業と
して、よりよい社会環境の構築に貢献するとともに、人類社会の永続的発展に寄与する。
・独自の企画・提案力によるソリューションビジネスの展開
・社会的に信頼される新しい企業文化の創造
・企業活動を通じた、働く社員の自己実現と生活の安定・充実
(2) 会社の経営の基本方針
当社グループは、上記の企業理念に基づき、環境保全への配慮、地域社会との共生および企業倫理の徹底など、社
会を構成する一員として求められる責任を果たし、取引先、株主、地域社会からの一層の信頼を得られる企業を目指
していく。
ESG経営にも取り組み(安全・環境対策、働き方改革・ダイバーシティ、等)、2050年カーボンニュートラルに
向けて、具体的な方法を掲げて実施する。
また、主力であるコークス事業のより一層の競争力強化を図り、市況等に左右されない事業基盤を確立するととも
に、非コークス事業の事業基盤を強化・安定化させ、多面的な利益構造を確立することを目指している。
(3) 経営戦略等
上記の経営方針に基づく当社グループの経営戦略は、次のとおりである。
[コークス事業]
・安全・環境・防災体制の強化
・安全・安定操業の維持
・生産体制最適化(健全2炉団体制)に伴う効率化と安定した収益体質の確立
・既存顧客を中心とした盤石な国内販売基盤の維持
・販売先の多様化・拡大
・水素・アンモニア供給体制構築等、新たな収益源の開拓
[非コークス事業]
(燃料・資源リサイクル事業)
・自社石炭ヤード等のインフラの効果的活用
・需要家の燃料転換に対応した柔軟な営業体制の構築
・廃棄物の有効活用と適正処理による安定した収益の確保
(総合エンジニアリング事業(化工機事業))
・粉体処理ソリューションビジネスモデルへの更なる進化
・製品の付加価値向上(新製品の開発強化と既存製品のブラッシュアップ)
・新規顧客・新規地域への展開
・テスト体制、生産体制の強化
[ESG経営への取り組み]
・安全・環境・防災体制の確立を目指した生産・操業現場の構築
・カーボンニュートラルも含めた地球環境の保全や循環型社会構築のための環境課題への対処
・人権の尊重・ダイバーシティへの対応等
・ステークホルダーとのコミュニケーション・コンプライアンスの徹底によるガバナンスの向上
7/116
EDINET提出書類
日本コークス工業株式会社(E00030)
有価証券報告書
(4) 経営環境並びに優先的に対処すべき事業上及び財務上の課題
当社グループを取り巻く経営環境は、緊迫する中東情勢や米国の通商政策の先行き、為替、原料炭価格動向、物価
上昇による消費の弱含み等リスクも懸念される状況に置かれている。
このような状況のなかで、当社グループは、それぞれの事業において、次のような経営環境の認識のもとに、収益
力の改善などに向け、各事業で様々な施策を推進していく。
(コークス事業)
コークス事業については、安全・安定操業を第一に、生産体制最適化(健全2炉団体制)への移行を完了させ、下
記の各施策を着実に実行することで安定した収益確保に努める。
①環境対策工事の実施等による各種環境規制の遵守及び地域社会との共生
②固定費の効率化等による筋肉質な収益体質への転換
③生産性向上投資による増産及び変動費の削減
④販売先の多様化・拡大(他高炉メーカー、製鉄外用途、他)
⑤更なるコスト削減への取り組み(エネルギー使用量の削減・原料配合の改善など)
(燃料・資源リサイクル事業)
脱炭素の対応強化により加速する需要家の燃料転換へ向けた動きに対して、当社グループは、バイオマス燃料など
カーボンニュートラルに向けた商品の取扱いの拡大を進めていく。
また、競争優位性の高い自社インフラを最大限活用するとともに、燃料の調達・販売から廃棄物処理までを一貫し
て取り扱う体制の下、安定した収益の確保を目指す。
(総合エンジニアリング事業)
化工機事業については、産業全般に亘る基礎技術である粉体処理技術において、長年培ったノウハウをもとに、自
社の独自性や優位性を生かし事業を行っている。
技術開発面では、当社が保有する粉体処理技術や、粉体技術センターで実施する各種テストから得られる知見を生
かし、顧客ニーズに対応する処理プロセスの提案や新製品の開発、また変化する顧客ニーズに応えるための既存製品
のブラッシュアップを推進する。
営業面では、ニッチ分野における競争優位性の更なる進化により顧客対応力の向上を図るとともに、新規顧客・新
規地域への拡販強化を図る。
また、カーボンニュートラルでニーズが高まる電池・電子・樹脂分野等への展開強化を図る。
産業機械事業を担う有明機電工業株式会社については、機械工事・電気工事のノウハウを併せ持つ特徴を生かし、
受注拡大および利益率改善により収益拡大を図ると共に、コスト削減や生産性向上、製品およびメンテナンスの高付
加価値化などにも注力する。
併せて、グループ内の連携強化を図るため、当社グループ案件の受注拡大にも取り組んでいく。
(その他)
港湾運送事業を営む三池港物流株式会社については、自社で保有する港湾設備や倉庫を活用し、三池港(福岡県大
牟田市)における貨物取扱数量増加ならびにコスト削減を図る。
不動産事業については、非事業用不動産の売却に加え、賃貸事業についても積極的に推進していく。
8/116
EDINET提出書類
日本コークス工業株式会社(E00030)
有価証券報告書
(ESG経営への取り組み)
当社グループは、サステナビリティ推進委員会を中心に、当社グループにとっての重要度および社会にとっての影
響度の基準から設定した重要課題(マテリアリティ)に基づき、サステナビリティ経営を推進する。
具体的には、「2 『サステナビリティに関する考え方及び取組』」に記載のとおりである。
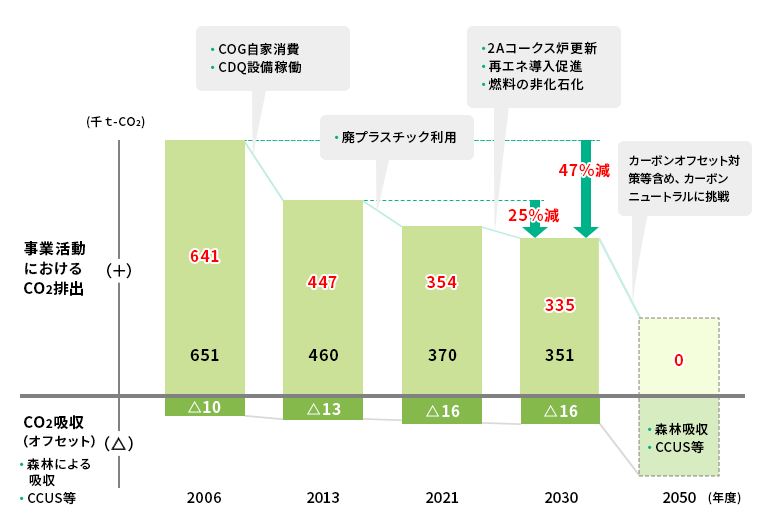
また、脱炭素に対する取り組みとしては、
①コークス炉から発生するガスの自家消費や回収した熱の電力・蒸気への変換などのエコプロセスによるCO2の
削減
②グループ会社所有森林(北海道に約4千2百ヘクタールの森林を所有)によるCO2吸収やCCUS(CO2
の 回収・利用・貯留)技術の利用によるカーボンオフセット
③水素製造・販売やアンモニア製造・中継設備活用、太陽光発電等のカーボンフリーエネルギー事業の検討などに
より、2050年カーボンニュートラルに向けて挑戦していく。
(5) 目標とする経営指標
当社グループは、健全な財務体質を維持しつつ、企業価値を高めるための各種施策や安定的な配当の実施のため、
中期的には、連結経常利益を40億円以上確保することを、経営指標としている。
9/116
EDINET提出書類
日本コークス工業株式会社(E00030)
有価証券報告書
2【サステナビリティに関する考え方及び取組】
当社グループは、企業理念に基づき、社会の持続的な成長への貢献と企業価値の向上を目指し、積極的に社会的責
任を果たすこととしている。
なお、文中の将来に関する事項は、提出日現在において当社グループが判断したものである。
(1)ガバナンス
当社取締役会にて決議した4項目からなるグループのサステナビリティ取組み方針に基づき活動を展開してい
る。また、社長を委員長とする「サステナビリティ推進委員会」にて活動状況をモニタリングしている。
1.安全・環境・防災への取組み
安全で災害の無い生産・操業現場を構築し、資源や素材を安定的に供給します。同時に地球環境の保全、温室
効果ガス削減をはじめとするカーボンニュートラルの推進、廃棄物の削減・活用をはじめとする循環型社会の
構築に取組み、環境負荷の最小化を目指します。
2.社会・地域への貢献
人類の活動に不可欠な資源や素材と高付加価値技術を社会に供給することを通じて、よりよい社会環境の構築
に貢献するとともに、地域社会への貢献活動を通じて、「良き企業市民」として地域社会との共生を図り、社
会の持続可能な成長に向けて積極的な役割を果たします。
3.人権尊重・人財育成
あらゆる人権と人種・個性などの多様性を尊重するとともに、社員が安全で働きやすい環境を確保し、意欲を
持って自己実現を図れる職場作りに努めます。
4.ステークホルダーとの良好な関係維持
株主・投資家・取引先・社会などのあらゆるステークホルダーとの公正な関係を尊重し、ガバナンスの強化を
通じて、透明性ある経営を行いながら企業としての信頼・評価を高めます。
(2)リスク管理
サステナビリティに関するリスクについては、「サステナビリティ推進委員会」で議論し、会社全体での管理が
必要と認識されたリスクについては、更にリスクマネジメントプロセスによって、管理・モニタリングしている。
具体的には、半期ごとに全社レベルでリスクの洗い出しを実施し、全社レベルでのリスクの重要度が高いと判断
された項目は、リスクマネジメント委員会で対策進捗をモニタリングし、その内容を取締役会に報告し、必要な指
摘・助言を受ける体制となっている。
(3)戦略並びに指標及び目標
当社グループにとっての重要度および社会にとっての影響度の基準から設定した重要課題(マテリアリティ)に
基づき、環境・社会・ガバナンスの各専門部会での議論の深化させることでサステナビリティ活動を推進する。
マテリアリティ
戦略
指標及び目標
・カーボンニュートラルの推進
・CO2排出量を2030年度までに25%以上
削減(2013年度比)
・2050年までにカーボンニュートラル達成
・環境に負荷をかけない燃料の販売
・水素製造販売事業への参入
・ダイバーシティを意識した人財育成
・新卒総合職採用の女性比率30%以上
・女性、中途採用、外国人等の管理職比率
を2020年度(13%)より上昇
・安全で災害のない生産・操業現場の構築
・休業災害件数ゼロ
・ボランティア活動・福祉団体への支援等
による社会貢献
・地域清掃活動等の参加
・募金・地域イベント協賛等
・非財務情報を含めた積極的な情報開示
・ホームページコンテンツの充実化
・コンプライアンス教育等の徹底
・社内コンプライアンス研修・社員意識調
査の継続実施
環境課題への対処
社会・人権課題への対処
ガバナンスの向上
(注)提出会社における人的資本に関する当事業年度の実績は、新卒総合職採用の女性比率37.5%、女性、中途採用、
外国人等の管理職比率18.1%である。
10/116
EDINET提出書類
日本コークス工業株式会社(E00030)
有価証券報告書
3【事業等のリスク】
有価証券報告書に記載した事業の状況、経理の状況等に関する事項のうち、経営者が連結会社の財政状態、経営成
績及びキャッシュ・フローの状況に重要な影響を与えると認識している主要なリスクは、以下のとおりである。
また、必ずしもそのようなリスク要因に該当しない事項についても、投資判断、あるいは当社グループの事業活動
を理解する上で重要と考えられる事項については、投資家に対する積極的な情報開示の観点から記載している。
なお、文中の将来に関する事項は、提出日現在において当社グループが判断したものである。
(1)需給および市況の変動
当社グループは、石炭・コークスというエネルギー関連素材の仕入・製造・販売事業を行っているが、これら
は、国内外の経済状況や需給状況の変動により、その仕入・販売の価格および数量が大きく変動する可能性があ
り、当社グループの経営成績、財務状況に影響を及ぼす可能性がある。
そのため、当社グループは、コークス事業のより一層の競争力強化を図り、市況等に左右されない事業基盤を
確立する事を、経営の基本方針としている。
(2)海外情勢の変動
当社グループは、石炭(一般炭およびコークス用原料炭)、石油コークス、バイオマス燃料等を海外から輸入
しているが、各輸入先において、自然災害、政治または経済環境の変化、税制、規制、法律の変更、人権問題等
により、仕入価格の高騰や石炭等の供給遅延または停止が起こった場合には、当社グループの経営成績、財務状
況に影響を及ぼす可能性がある。
(3)為替レートの変動
当社グループは、石炭等の仕入ならびに石炭・コークスの販売等の外貨建て取引(主に米ドル建て)を行って
いるため、為替レートの変動による影響を受ける。為替リスクは、主に、外貨建てのコークスの販売と原料とな
る石炭の輸入取引により相殺されるが、相殺されない部分は当社グループの経営成績、財務状況に影響を及ぼす
可能性がある。
(4)金利の変動
当社グループは、有利子負債を有しているため、金利変動による影響を受ける。著しい金利変動は、借入金の
金利負担として当社グループの経営成績、財務状況に影響を及ぼす可能性がある。なお、長期借入金の大部分に
ついては、金利上昇リスクを可能な限り回避するため、金利スワップ等のヘッジ取引を行っている。
(5)借入債務に係る財務制限条項
当社グループの借入金にかかる契約には財務制限条項が付されているものがある。当社または当社グループの
経営成績や財務状況が悪化し、当該条項を満たすことができないことが判明した場合は、直ちに借入金の一括返
済を求められるものではないが、貸付人等との間で今後の対応について協議を行うことになっており、その結果
如何では、期限の利益を喪失するなど今後の安定・継続的な資金の調達に影響を及ぼす可能性がある。
なお、財務制限条項の内容は、2026年4月24日付及び2026年4月30日付で変更されており、「第5 経理の状
況 1.連結財務諸表等 (1)連結財務諸表注記事項(連結貸借対照表関係) 3.財務制限条項」に記載
している。
(6)固定資産の価値の下落
当社グループが保有している固定資産のうち、有形固定資産、無形固定資産等については、時価や収益性をも
とに資産価値を検討しているが、今後さらに時価の下落、収益性の低下等に伴い資産価値が下落した場合は、減
損を余儀なくされ、当社グループの経営成績、財務状況に影響を及ぼす可能性がある。
(7)法的規制
当社グループは、国内外で各種の法的規制(租税法規、環境法規、労働法規、貿易・為替法規等の事業関連法
規)に服しており、万が一、法令に違反した場合には、当局から課徴金・営業停止の行政処分を受けるほか、そ
の利害関係者から損害賠償請求等を提訴される可能性がある。
なお、上記のような様々な法令、規則等の適用を受けており、これらの法的規制が変更または強化された場合
には、規制遵守のための費用が増加する可能性があり、その場合には、当社グループの経営成績、財務状況に影
響を及ぼす可能性がある。
11/116
EDINET提出書類
日本コークス工業株式会社(E00030)
有価証券報告書
(8)コークス事業への依存
当社グループの主力事業は、コークス事業であり、当該事業への依存度が高いため、当該事業の業績が市場環
境等により変動する状況が続く場合には、当社グループ全体の経営成績、財務状況に影響を及ぼす可能性があ
る。
そのため、当社グループは、非コークス事業の事業基盤の強化・安定化による、多面的な利益構造の確立を経
営の基本方針としている。
(9)重大な災害、事故、訴訟等
当社北九州事業所では2025年12月に石炭搬送用ベルトコンベアの火災事故が発生し、減産を余儀なくされた
が、このように主力の北九州事業所をはじめとする当社グループの各事業所が、大規模な台風、地震などの自然
災害に見舞われた場合等には事業活動が制約を受けることなどにより、業績に影響が生じる可能性がある。ま
た、重大な労働災害、設備事故、環境事故、品質問題等が発生した場合、又は重要な訴訟において当社に不利な
判断がなされた場合には、事業活動の停止・制約、補償等により業績に影響が生じる可能性がある。
なお、当社が過去に経営していた炭鉱に関連して、第二次世界大戦中の旧朝鮮半島出身労働者の就労について
は、行政当局等と連携して適切に対応していく方針である。
(10)繰延税金資産について
当社グループは、将来の課税所得に関する予測に基づき繰延税金資産の回収可能性の判断を行っているが、将
来の課税所得の予測が変更となり、繰延税金資産の一部ないしは全部が回収できないと判断した場合、繰延税金
資産の回収可能性を減額する事で、当社の経営成績、財務状況に影響を及ぼす可能性がある。
12/116
EDINET提出書類
日本コークス工業株式会社(E00030)
有価証券報告書
4【経営者による財政状態、経営成績及びキャッシュ・フローの状況の分析】
(1) 経営成績等の状況の概要
当連結会計年度における当社の財政状態、経営成績及びキャッシュ・フロー(以下「経営成績等」という。)の状
況の概要は次のとおりである。
①財政状態及び経営成績の状況
当期におけるわが国経済は、雇用・所得環境の改善等による緩やかな回復基調がみられる一方で、中東情勢や米国
の通商政策による影響など、わが国の景気を下押しするリスクがある中で推移した。
このような状況のもと、当社グループのコークス事業は、安全最優先のもと業績回復に総力を挙げて取り組む方針
で今年度をスタートした。
業績回復に向けた取り組みとしては、2025年11月11日に公表したとおり、老朽化2炉団を休止するコークス生産体
制最適化を決定した。その後、12月末に石炭搬送用ベルトコンベアの火災事故発生もあったが、老朽化炉に対する修
繕費の大幅な削減を含む製造原価の削減効果も確認できたことから、健全2炉団化による操業と業績回復の道筋がつ
いてきた。
上述の火災により減産が避けられない状況下においても、焼損したベルトコンベアの代替手段としてクレーンを使
用した装炭方法を取り入れる等の工夫により、生産量の落込みをカバーしてきた。
また、2炉団化に伴う不稼働資産の減損損失等の認識や火災による業績下振れ、更にはそれらを起因とした純資産
の減少に対して、主要な販売先および調達先に加えて、取引先金融機関の理解を得て、財務面においても特段の支障
なく計画を進める事ができている。
次年度においては、安全操業と2炉団体制下の安定生産を軸として計画を進め、ステークホルダーの皆様の期待に
応えるべく業績回復に向けて注力してゆく所存である。
コークス事業以外の各事業については環境変化に応じつつ、安定的な収益の拡大を目指してきた。燃料・資源リサ
イクル事業においては、燃料の販売に加え、私有港湾設備とコールセンターを有する優位性を活かした事業におい
て、気象異変により近隣地区で発生した燃料流通の混乱を補完するなど、揚陸、備蓄、配送についてインフラも含め
た対応力を発揮するビジネス展開も行ってきた。また、総合エンジニアリング事業の主要事業である化工機事業にお
いては、日本食に対する需要の高まりを背景として、抹茶製造工程で使われる機材の受注が好調であることから、
ティーマイスターミルと称した新商品を投入、ニッチ分野の強みを活かした展開も進み、当社グループ全体の事業
ポートフォリオを下支えしてきた。
これらの結果、当期の連結売上高は、前期比76億5千9百万円減少の913億8千6百万円、連結営業損益は、6億
7百万円の営業利益(前期は85億6千2百万円の営業損失)となったほか、連結経常損益は、2億7千6百万円の経
常損失(前期は102億6千9百万円の経常損失)となった。
特別損益については、コークス生産体制最適化等に係る減損損失44億3千6百万円や固定資産除却損10億9千4百
万円などにより、特別損失70億5千7百万円を計上した。親会社株主に帰属する当期純損益は76億7千8百万円の純
損失(前期は139億8百万円の純損失)となった。
セグメントの業績は次のとおりである。
a.コークス事業
コークス事業については、上述の通り、炉団体制の2炉団化(従来比2炉団減)を進めているが、前年度は老朽
化炉対策と火災による操業停止期間が相対的に長期に亘っていた事、加えて2025年度は新鋭2A炉本格操業期間の
増加もあり、生産量は前期比7万3千トン増加の99万トンとなった。お客様からの引合いは相応に有り、販売数量
も前期比10万トン増加の97万2千トンとなった。
損益については、年末の火災影響を受けながらも、前年度に比べ修繕費等の固定費削減や増産によるトン当り固
定費負担の軽減効果により、当年度も営業赤字ではあるものの、その損失額は大きく改善した。
この結果、コークス事業の連結売上高は、前期比25億8千万円減少の561億3千4百万円となり、連結営業損益
は、23億2千8百万円の営業損失(前期は123億5千7百万円の営業損失)となった。
b.燃料・資源リサイクル事業
燃料・資源リサイクル事業については、お客様の燃料転換トレンドが継続した事を主因に、当社グループの販売
数量は、82万トンと前期比4万5千トン減少となり、売上高は減収となった。
この結果、燃料・資源リサイクル事業の連結売上高は、前期比38億9千7百万円減少の233億4千3百万円とな
り、連結営業利益は、前期比1億4千5百万円減少の26億3千万円となった。
13/116
EDINET提出書類
日本コークス工業株式会社(E00030)
有価証券報告書
c.総合エンジニアリング事業
総合エンジニアリング事業については、化工機事業において、前年度に有った大口機器納入案件が剥落したこと
から減収減益となった。
この結果、総合エンジニアリング事業の連結売上高は、前期比13億7千9百万円減少の79億1千7百万円とな
り、連結営業利益は、前期比5億9千5百万円減少の14億7千7百万円となった。
d.その他
その他の事業については、増収減益となり、その他の事業の連結売上高は、前期比1億9千7百万円増加の39億
9千1百万円となり、連結営業利益は、前期比1千3百万円減少の5億7千9百万円となった。
②キャッシュ・フローの状況
当連結会計年度末の現金及び現金同等物(以下「資金」という。)の残高は、前連結会計年度末に比べ、12億8千
2百万円増加の63億8千8百万円となった。
当連結会計年度末におけるキャッシュ・フローの状況とそれらの要因は次のとおりである。
(営業活動によるキャッシュ・フロー)
営業活動の結果得られた資金は、85億1千1百万円(前年同期比116億8千9百万円増加)となった。
これは主に、減価償却費60億9百万円、減損損失44億3千6百万円、売上債権及び契約資産の減少額30億2千3百
万円などによる資金の増加に対し、棚卸資産の増加額14億8千6百万円などによる資金の減少があったことによるも
のである。
(投資活動によるキャッシュ・フロー)
投資活動の結果使用した資金は、86億8千4百万円(前年同期比80億円増加)となった。
これは主に、固定資産の取得による支出79億6千5百万円などによるものである。
(財務活動によるキャッシュ・フロー)
財務活動の結果得られた資金は、14億5千万円(前年同期比173億6千2百万円減少)となった。
これは主に、短期借入れによる収入3,175億5千7百万円などに対し、短期借入金の返済による支出3,097億1千3
百万円などによるものである。
14/116
EDINET提出書類
日本コークス工業株式会社(E00030)
有価証券報告書
③生産、受注及び販売の実績
a.生産実績
当連結会計年度における生産実績をセグメントごとに示すと、次のとおりである。
セグメントの名称
生産高(百万円)
前年同期比(%)
コークス事業
コークス
56,179
83.1
燃料・資源リサイクル事業
石炭
1,074
142.9
57,254
83.8
合計
(注)金額は生産原価によっており、セグメント間の内部振替前の数値によっている。
b.受注実績
当連結会計年度における受注実績をセグメントごとに示すと、次のとおりである。
セグメントの名称
総合エンジニアリング事業
受注高(百万円)
前年同期比(%)
7,735
100.8
受注残高(百万円)
前年同期比(%)
4,732
96.2
(注)セグメント間の取引については、相殺消去している。
c.販売実績
当連結会計年度における販売実績をセグメントごとに示すと、次のとおりである。
セグメントの名称
販売高(百万円)
前年同期比(%)
コークス事業
56,134
95.6
燃料・資源リサイクル事業
23,343
85.7
総合エンジニアリング事業
7,917
85.2
その他
3,991
105.2
91,386
92.3
合計
(注)1.金額は販売価格に基づき、セグメント間の取引については相殺消去している。
2.主な相手先別の販売実績および当該販売実績の総販売実績に対する割合は次のとおりである。
相手先
前連結会計年度
(自 2024年4月1日
至 2025年3月31日)
金額 (百万円)
日本製鉄株式会社
割合(%)
29,961
30.3
15/116
当連結会計年度
(自 2025年4月1日
至 2026年3月31日)
金額 (百万円)
34,776
割合(%)
38.1
EDINET提出書類
日本コークス工業株式会社(E00030)
有価証券報告書
(2) 経営者の視点による経営成績等の状況に関する分析・検討内容
経営者の視点による当社グループの経営成績等の状況に関する認識及び分析・検討内容は次のとおりである。
なお、文中の将来に関する事項については、提出日現在において判断したものである。
①財政状態及び経営成績の状況に関する分析・検討内容
経営成績
当社グループの業績は、主力のコークス事業において、2025年11月11日に公表したとおり、老朽化2炉団を休
止するコークス生産体制最適化を決定した。その後、12月末に石炭搬送用ベルトコンベアの火災事故発生もあっ
たが、老朽化炉に対する修繕費の大幅な削減を含む製造原価の削減効果も確認できたことから、健全2炉団化に
よる操業と業績回復の道筋がついてきた。
上述の火災により減産が避けられない状況下においても、焼損したベルトコンベアの代替手段としてクレーン
を使用した装炭方法を取り入れる等の工夫により、生産量の落込みをカバーしてきた。
また、2炉団化に伴う不稼働資産の減損損失等の認識や火災による業績下振れ、更にはそれらを起因とした純
資産の減少に対して、主要な販売先および調達先に加えて、取引先金融機関の理解を得て、財務面においても特
段の支障なく計画を進める事ができている。
これらの結果、当期の連結売上高は、前期比76億5千9百万円減少の913億8千6百万円、連結営業損益は、
6億7百万円の営業利益(前期は85億6千2百万円の営業損失)となったほか、連結経常損益は、2億7千6百
万円の経常損失(前期は102億6千9百万円の経常損失)となった。
特別損益については、コークス生産体制最適化等に係る減損損失44億3千6百万円や固定資産除却損10億9千
4百万円などにより、特別損失70億5千7百万円を計上した。親会社株主に帰属する当期純損益は76億7千8百
万円の純損失(前期は139億8百万円の純損失)となった。
財政状態
当連結会計年度末の総資産は、1,265億4千4百万円となり、前連結会計年度末に比べ40億8千6百万円減少
となった。増減の主なものは、原材料及び貯蔵品の増加32億8千6百万円、機械装置及び運搬具の減少25億4千
8百万円、売掛金の減少17億4千7百万円、商品及び製品の減少16億6百万円、建設仮勘定の減少8億9千2百
万円等である。
当連結会計年度末の負債は、917億4千6百万円となり、前連結会計年度末に比べ27億1千5百万円増加と
なった。増減の主なものは、短期借入金の増加49億5千7百万円、支払手形及び買掛金の増加20億4千万円、長
期借入金の減少34億9千6百万円、退職給付に係る負債の減少4億3千8百万円等である。
当連結会計年度末の純資産は、前連結会計年度末に比べ、68億2百万円減少の347億9千7百万円となった。
また、当連結会計年度末の自己資本比率は、27.5%になった。
②キャッシュ・フローの状況の分析・検討内容並びに資本の財源及び資金の流動性に関する情報
キャッシュ・フロー
当連結会計年度末の現金及び現金同等物(以下「資金」という。)の残高は、前連結会計年度末に比べ12億8
千2百万円増加の63億8千8百万円となった。
(営業活動によるキャッシュ・フロー)
営業活動の結果得られた資金は、85億1千1百万円(前年同期比116億8千9百万円増加)となった。
(投資活動によるキャッシュ・フロー)
投資活動の結果使用した資金は、86億8千4百万円(前年同期比80億円増加)となった。
(財務活動によるキャッシュ・フロー)
財務活動の結果得られた資金は、14億5千万円(前年同期比173億6千2百万円減少)となった。
資金需要
当社グループの主な資金需要は、設備投資、原材料・商品等の仕入代金の支払、販売費および一般管理費の支
払、借入金の返済および法人税等の支払等である。
当社グループは、事業活動に必要な資金を、営業活動によるキャッシュ・フローおよび借入金によって継続的
に調達することが可能であると考えている。
16/116
EDINET提出書類
日本コークス工業株式会社(E00030)
有価証券報告書
財務政策
当社グループは、運転資金および設備投資資金については、営業活動によるキャッシュ・フローから生み出さ
れる自己資金および借入金により賄っている。
当連結会計年度末現在、短期借入金の残高は378億8千6百万円(うち、1年以内に返済予定の長期借入金41
億5千2百万円)、長期借入金の残高は293億9千1百万円である。
また、当社および一部の連結子会社は、取引銀行17行と当座貸越契約および貸出コミットメント契約を締結し
ており、効率的な資金調達を行っている。当連結会計年度末における当座貸越契約の極度額および貸出コミット
メントの総額は507億5千万円である。
当社グループは、資金効率を高めるため、売上債権および棚卸資産の圧縮に努めており、有利子負債の残高を
減少させ借入金依存度を引き下げ、財務基盤の強化に取り組んでいる。
③重要な会計上の見積り及び当該見積りに用いた仮定
連結財務諸表の作成に当たって用いた会計上の見積り及び当該見積りに用いた仮定のうち、重要なものについ
ては、「第5 経理の状況 1.連結財務諸表等 (1)連結財務諸表注記事項(重要な会計上の見積り)」
に記載のとおりである。
17/116
EDINET提出書類
日本コークス工業株式会社(E00030)
有価証券報告書
5【重要な契約等】
(財務上の特約が付された金銭消費貸借契約)
当社は、金融機関との間でシンジケート方式によるコミットメントライン契約及びシンジケートローン契約を締結
しており、その内容は以下のとおりである。
(1)コミットメントライン契約
契約日
2018年12月10日
契約期間
自
至
2018年12月21日
2026年4月30日
(注)1
期末残高
(百万円)
24,304
相手方の属性
財務制限条項
担保
都市銀行、地方銀行等
有(注)2
無
(注)1.1年毎に双方合意の下、延長している。
2.財務制限条項の内容については、「第5 経理の状況 1.連結財務諸表等
(連結貸借対照表関係) 3.財務制限条項」に記載している。
(1)連結財務諸表
注記事項
(2)シンジケートローン契約
契約日
弁済期限
2022年5月31日
2030年3月29日
2024年9月25日
期末残高
(百万円)
相手方の属性
財務制限条項
担保
10,032
都市銀行、地方銀行等
有(注)
無
2031年9月30日
7,858
都市銀行、地方銀行等
有(注)
無
2024年9月25日
2028年9月29日
10,000
都市銀行、地方銀行等
有(注)
無
2024年9月25日
2029年9月28日
4,900
都市銀行、地方銀行等
有(注)
無
(注)財務制限条項の内容については、「第5 経理の状況 1.連結財務諸表等
結貸借対照表関係) 3.財務制限条項」に記載している。
(1)連結財務諸表
注記事項(連
6【研究開発活動】
当社グループ(当社および連結子会社)は、総合エンジニアリング事業における化工機事業分野をはじめ、新規事
業分野等において、製品の高度化と新製品・新技術の開発に取り組んでいる。
当連結会計年度における各セグメント別の研究の目的等は次のとおりである。なお、当連結会計年度の研究開発費
の総額は201百万円である。
(コークス事業)
コークス事業分野においては、カーボンニュートラルの実現に向けたCO2削減に取り組んでおり、現在、北九州
事業所において、コークス製造時に排出されるCO2を回収・使用し、炭素材を製造するCCVD※技術を開発中で
ある。当該技術は、コークス炉ガスを使用する独自の方法であり、従来の製法に比べ、炭素材を安価に製造すること
が可能となる。
また、北九州事業所において、コークス製造時に排出されるCO2を、アンモニア水を微細ミスト化することで効
率よく回収し、回収したCO2を含むアンモニア水にリン酸を反応させることにより、高純度でCO₂を分離すること
が可能になるプロセスを開発中である。当該プロセスは、コークス製造の副産物であるアンモニア活用し、およびC
O2分離の際に熱エネルギーを要しないことが特徴である。
コークス事業に係る研究開発費は114百万円である。
※Catalytic Chemical Vapor Deposition:触媒気相蒸着(触媒を用いて気体中の化学物質を基板上に沈着させるプ
ロセス)
(総合エンジニアリング事業)
化工機事業分野においては、顧客ニーズに対応すべく処理技術の高度化及びコストダウン等を目指した技術開発及
び改良改善を行っており、特に新素材及び二次電池、電子部品関連分野に対応する新技術・新製品の開発に取り組ん
でいる。
また、シミュレーション技術にも力を入れており、開発のスピードアップを図ると共に、IoT技術等を用いた自
動化設備の開発にも取り組んでいる。
総合エンジニアリング事業に係る研究開発費は87百万円である。
18/116
EDINET提出書類
日本コークス工業株式会社(E00030)
有価証券報告書
第3【設備の状況】
1【設備投資等の概要】
当社グループ(当社および連結子会社)は、品質、サービスおよび生産性の向上を図るため設備の増強、維持補修
等を行い、当連結会計年度において71億円の設備投資(長期前払費用を含む)を実施し、そのうちコークス事業に属
する当社北九州事業所において、コークス製造設備、港湾荷役設備の増強等59億円を実施した。
また、総合エンジニアリング事業およびその他の事業の当連結会計年度における設備投資は、経常的な維持補修で
あり、特記すべき事項はない。
2【主要な設備の状況】
当社グループ(当社および連結子会社)における主要な設備は、以下のとおりである。
(1)提出会社
2026年3月31日現在
帳簿価額(百万円)
事業所名
(所在地)
セグメントの
名称
設備の内容
コークス製造・
北九州事業所
(北九州市若松区)
副産物加工設備
建物及び構
築物
機械装置
及び運搬具
4,263
27,758
591
3,007
260
607
土地
(面積千㎡)
13,827
(948千㎡)
その他
合計
従業員数
(人)
434
46,284
256
64
6,679
53
60
1,857
64
コークス事業
港湾荷役設備
栃木工場
総合エンジニ
化学機器製造
(栃木県栃木市)
アリング事業
設備
3,015
(180千㎡)
927
(116千㎡)
(注)1.帳簿価額のその他は工具、器具及び備品およびリース資産であり、建設仮勘定を含めていない。
2.当社北九州事業所のコークス生産体制最適化による2炉団体制への移行に伴い、コークス事業の建物及び構築
物、機械装置及び運搬具等の帳簿価額が減少している。
(2)国内子会社
2026年3月31日現在
帳簿価額(百万円)
会社名
(所在地)
三池港物流㈱
(福岡県大牟田市)
セグメントの
名称
設備の内容
その他
港湾荷役・陸上
運送設備
建物及び構
築物
機械装置
及び運搬具
1,076
401
土地
(面積千㎡)
1,673
(210千㎡)
その他
22
合計
3,173
従業員数
(人)
130
(注)帳簿価額のその他は工具、器具及び備品およびリース資産であり、建設仮勘定を含めていない。
(3)在外子会社
特記する事項はない。
3【設備の新設、除却等の計画】
当社グループ(当社および連結子会社)における設備投資については、投資効率、設備改修計画等を総合的に勘案
して策定している。設備投資計画は原則的に連結子会社が個々に策定しているが、重要な設備投資については当社を
中心に調整を図っている。
なお、当連結会計年度末現在における重要な設備の新設等は、次のとおりである。
(1)設備の新設
経常的な設備の更新のための新設等を除き、重要な設備の新設等の計画はない。
(2)除却等
経常的な設備の更新のための除却等を除き、重要な設備の除却等の計画はない。
19/116
EDINET提出書類
日本コークス工業株式会社(E00030)
有価証券報告書
第4【提出会社の状況】
1【株式等の状況】
(1)【株式の総数等】
①【株式の総数】
種類
発行可能株式総数(株)
普通株式
1,080,000,000
計
1,080,000,000
②【発行済株式】
種類
事業年度末現在発行数(株)
(2026年3月31日)
普通株式
302,349,449
計
302,349,449
上場金融商品取引所名
又は登録認可金融商品
取引業協会名
内容
302,349,449
東京証券取引所
プライム市場
単元株式数
100株
302,349,449
−
−
提出日現在発行数(株)
(2026年6月25日)
(2)【新株予約権等の状況】
①【ストックオプション制度の内容】
該当事項はない。
②【ライツプランの内容】
該当事項はない。
③【その他の新株予約権等の状況】
該当事項はない。
(3)【行使価額修正条項付新株予約権付社債券等の行使状況等】
該当事項はない。
(4)【発行済株式総数、資本金等の推移】
年月日
種類
発行済株式総
数増減数
(株)
発行済株式
総数残高
(株)
資本金
増減額
(百万円)
資本金
残高
(百万円)
資本準備金
増減額
(百万円)
資本準備金
残高
(百万円)
2012年3月23日
※
C種優先株式
△14,000,000
302,349,449
−
7,000
−
1,750
(注)※会社法第178条の規定に基づき、C種優先株式を消却したものである。
20/116
EDINET提出書類
日本コークス工業株式会社(E00030)
有価証券報告書
(5)【所有者別状況】
2026年3月31日現在
株式の状況(1単元の株式数100株)
区分
政府及び地
方公共団体
金融機関
−
株主数(人)
所有株式数
(単元)
所有株式数の
割合(%)
外国法人等
単元未満
株式の状況
(株)
金融商品取
引業者
その他の
法人
12
48
165
84
160
31,758
32,227
−
−
240,700
56,453
1,416,609
270,235
3,133
1,034,505
3,021,635
185,949
−
7.97
1.87
46.88
8.94
0.10
34.24
100.00
−
個人その他
個人以外
計
個人
(注)1.自己名義株式11,326,610株は「個人その他」の中に113,266単元、「単元未満株式の状況」の中に10株含まれ
ている。
2.証券保管振替機構名義の株式は、「その他の法人」の中に55単元含まれている。
(6)【大株主の状況】
2026年3月31日現在
氏名又は名称
住所
所有株式数
(株)
発行済株式(自己
株式を除く)の総
数に対する所有株
式数の割合(%)
日本製鉄株式会社
東京都千代田区丸の内2-6-1
65,628,595
22.55
住友商事株式会社
東京都千代田区大手町2-3-2
56,558,095
19.43
日本マスタートラスト信託銀行株式
会社(信託口)
東京都港区赤坂1-8-1
16,179,000
5.55
STATE STREET BANK
COMPANY 505001
ONE CONGRESS STREET, SUITE 1,
4,883,750
1.67
3,772,181
1.29
3,621,772
1.24
(常任代理人
行)
AND
TRUST
株式会社みずほ銀
(常任代理人
行)
(東京都港区港南2-15-1)
東京都千代田区丸の内1-1-2
株式会社三井住友銀行
STATE STREET BANK
COMPANY 505223
BOSTON, MASSACHUSETTS
AND
TRUST
株式会社みずほ銀
P.O. BOX 351 BOSTON MASSACHUSETTS
02101 U.S.A
(東京都港区港南2-15-1)
日鉄鉱業株式会社
東京都千代田区丸の内2-3-2
3,000,000
1.03
株式会社商船三井
東京都港区虎ノ門2-1-1
2,513,000
0.86
三井金属株式会社
東京都品川区大崎1-11-1
2,307,000
0.79
住友金属鉱山株式会社
東京都港区新橋5-11-3
2,307,000
0.79
160,770,393
55.24
計
−
(注)上記所有株式のうち、信託業務に係る株式は、日本マスタートラスト信託銀行株式会社(信託口)16,179,000株で
ある。
21/116
EDINET提出書類
日本コークス工業株式会社(E00030)
有価証券報告書
(7)【議決権の状況】
①【発行済株式】
2026年3月31日現在
区分
株式数(株)
議決権の数(個)
内容
無議決権株式
−
−
−
議決権制限株式(自己株式等)
−
−
−
議決権制限株式(その他)
−
−
−
完全議決権株式(自己株式等)
普通株式
11,326,600
−
−
完全議決権株式(その他)
普通株式
290,836,900
2,908,369
−
単元未満株式
普通株式
185,949
−
1単元(100株)未満の株式
発行済株式総数
302,349,449
−
−
総株主の議決権
−
2,908,369
−
(注)上記「完全議決権株式(その他)」の中には、証券保管振替機構名義の株式5,500株が含まれている。また、
「議決権の数」欄には、同機構名義の完全議決権株式に係る議決権の数55個が含まれている。
②【自己株式等】
2026年3月31日現在
自己名義所有
株式数(株)
他人名義所有
株式数(株)
所有株式数の
合計(株)
発行済株式総数に
対する所有株式数
の割合(%)
東京都江東区豊洲
3−3−3
11,326,600
−
11,326,600
3.75
−
11,326,600
−
11,326,600
3.75
所有者の氏名又は名称
所有者の住所
日本コークス工業株式会社
計
22/116
EDINET提出書類
日本コークス工業株式会社(E00030)
有価証券報告書
2【自己株式の取得等の状況】
【株式の種類等】会社法第155条第7号に該当する普通株式の取得
(1)【株主総会決議による取得の状況】
該当事項はない。
(2)【取締役会決議による取得の状況】
該当事項はない。
(3)【株主総会決議又は取締役会決議に基づかないものの内容】
区分
株式数(株)
価額の総額(円)
当事業年度における取得自己株式
929
88,173
当期間における取得自己株式(注)
55
5,598
(注)当期間における取得自己株式には、2026年6月1日からこの有価証券報告書提出日までの単元未満株式の
買取りによる株式は含まれていない。
(4)【取得自己株式の処理状況及び保有状況】
当事業年度
区分
当期間
株式数(株)
処分価額の総額
(円)
株式数(株)
処分価額の総額
(円)
引き受ける者の募集を行った取得自己株式
−
−
−
−
消却の処分を行った取得自己株式
−
−
−
−
合併、株式交換、株式交付、会社分割に係る
移転を行った取得自己株式
−
−
−
−
その他
(単元未満株式の買増請求による売渡し)
−
−
−
−
11,326,610
−
11,326,665
−
保有自己株式数
(注)1.当期間における処理自己株式には、2026年6月1日からこの有価証券報告書提出日までの単元未満株式の
買増請求による売渡しによる株式は含まれていない。
2.当期間における保有自己株式には、2026年6月1日からこの有価証券報告書提出日までの単元未満株式の
買取りおよび単元未満株式の買増請求による売渡しによる株式は含まれていない。
23/116
EDINET提出書類
日本コークス工業株式会社(E00030)
有価証券報告書
3【配当政策】
(1) 配当方針
当社の利益配分に関する基本方針については、株主の皆様への還元ならびに将来の安定的な収益基盤確立のた
めに必要な投資や財務体質強化のための内部留保について、業績および財務の状況を総合的に勘案したうえで適
切に配分することとしている。
株主の皆様への利益還元については、上記の方針を踏まえつつ、継続的且つ長期安定的な配当を実施すること
が重要な課題であると認識している。
(2) 配当制度
当社は、定款により、毎事業年度2回(期末配当および中間配当)の配当制度を定めている。
①期末配当
期末配当は、毎年3月31日を基準日として、株主総会で決議する。
②中間配当
中間配当は、毎年9月30日を基準日として、取締役会で決議する。
(3) 当事業年度に係る剰余金の配当
該当事項はない。
24/116
EDINET提出書類
日本コークス工業株式会社(E00030)
有価証券報告書
4【コーポレート・ガバナンスの状況等】
(1)【コーポレート・ガバナンスの概要】
①コーポレート・ガバナンスに関する基本的な考え方
当社は、当社グループの持続的な成長と中長期的な企業価値の向上に資することを目的とし、以下に掲げる企
業理念を実現するための企業活動を通じて、社会からの信頼を確立するために、コーポレート・ガバナンスの構
築に取り組んでいる。
(企業理念)
人類の活動に不可欠な資源や素材と高付加価値技術を社会に供給し続けることにより、存在価値のある企業
として、よりよい社会環境の構築に貢献するとともに、人類社会の永続的発展に寄与します。
独自の企画・提案力をもってソリューションビジネスを展開します。
社会的に信頼される新しい企業文化を創造します。
企業活動を通じて働く社員の自己実現と生活の安定・充実を図ります。
②企業統治の体制の概要および当該体制を採用する理由
(1) 企業統治の体制の概要
当社は、監査役会設置会社であり、取締役6名中3名が社外取締役、監査役3名中2名が社外監査役で
ある。
当社は、月1回の頻度で定例取締役会を開催するほか、必要に応じ随時臨時取締役会を開催している。
このほか、業務執行に関する重要事項および経営方針を審議・協議するため経営会議を設置し、月2回
の頻度で開催している。
なお、取締役会での意思決定を要する事業計画、予算、設備投資、投融資等の重要な個別執行事案につい
ては、事前に経営会議、予算委員会、投融資委員会、関係各部門長等による会議等において審議・協議を
行っている。
また、全般的な業務の遂行状況をモニタリングすることを目的としたモニタリング会議を、月1回の頻度
で開催し、各部門の抱える課題に焦点を当て、課題解決の道筋をつけることを目的とした役員業務報告会
を、月1回の頻度で開催している。
監査役は取締役会のほか経営会議などの重要な会議に出席している。監査役の監査を補助するためスタッ
フを1名(兼任)配置している。
内部監査部門は、当社グループ全体の業務執行を対象とした監査を行う。
(2) 企業統治の体制を採用する理由
当社のガバナンスの効率性と実効性を確保し、企業価値の向上に資するため、複数の社外取締役、社外監
査役を選任している。
取締役の業務が効率的に行われるために、経営会議、予算委員会、投融資委員会、関係各部門長等による
会議等において審議・協議を行っている。
③企業統治に関するその他の事項
(1) 内部統制システムの整備の状況
・内部統制整備の組織体制
取締役会で決議した内部統制の基本方針に沿って、規則や体制の整備を行うため、リスクマネジメン
ト室を設置している。
・コンプライアンス体制の整備状況
当社は、社長を委員長とするリスクマネジメント委員会を設置し、当社グループのリスク管理、コン
プライアンスに関する基本方針の策定、体制の整備および諸施策に関する審議を行っている。このほ
か、「コンプライアンスガイドブック」の配布、研修等の実施、内部通報制度の運用などの施策を行
い、コンプライアンス意識の向上等を図っている。
(2) リスク管理体制の整備状況
当社は、重大事故発生時に損害・損失等を抑制するための具体策を迅速に決定・実行する組織として、
社長を本部長とする危機対策本部を設置し、適切に対応するとともに、実効性のある再発防止策を構築す
る社内体制を整備している。
25/116
EDINET提出書類
日本コークス工業株式会社(E00030)
有価証券報告書
(3) 子会社の業務の適正性を確保するための整備状況
当社は、子会社の効率的な管理、運営を行うため、関係会社管理規則を定め、子会社における一定の行
為または事案について当社の承認または当社への報告を求めることで、子会社の経営・リスクに関する適
切な管理、運営を行う体制を整備している。
また、子会社の業務執行取締役の職務の執行を管理・指導するため、当社より取締役および監査役を派
遣し、子会社の株主総会、取締役会その他重要な会議等への出席等を通じて、子会社に対する管理・指導
を行うとともに、当社より派遣した取締役および監査役を通じ、または子会社の各種報告制度を通じ、子
会社の必要な情報が当社に適時・適切に報告される体制を構築している。
(4) 責任限定契約の内容の概要
当社と各社外取締役および各社外監査役は、会社法第427条第1項の規定により、当該社外取締役およ
び社外監査役が職務を行うにつき善意でかつ重大な過失がないときは、同法第423条第1項の賠償責任
を、法令が規定する金額に限定する契約を締結している。
(5) 補償契約の内容の概要
当社は、取締役松岡弘明、森俊一郎、井伊誠一郎、德永直之、宮内直孝、森尻善雄の各氏および監査役
益田明、渡邊崇、櫻田修一の各氏との間で会社法第430条の2第1項に規定する補償契約を締結してお
り、同項第1号の費用および第2号の損失を法令に定める範囲において当社が補償することとしている。
当社は、2026年6月26日開催予定の定時株主総会の議案(決議事項)として「取締役6名選任の件」を
提案しており、当該議案が承認可決されると、小野祐介氏および坂田竜治氏との間で同補償契約を締結す
る予定である。
(6) 役員等賠償責任保険契約の内容の概要
当社は、保険会社との間で、取締役、監査役および執行役員を被保険者として、会社法第430条の3第
1項に規定する役員等賠償責任保険契約を締結している。
当該契約においては、株主代表訴訟、第三者訴訟および会社訴訟に対する取締役、監査役および執行役
員の損害賠償責任のうち被保険者が負担することとなる損害賠償金・訴訟費用に関する損害が填補される
こととなる。ただし、被保険者の職務の執行の適切性が損なわれないようにするため、故意または重過失
に起因する場合は填補の対象としないこととする。
(7) 取締役の定数
当社の取締役は25名以内とする旨定款に定めている。
(8) 取締役の選任および解任の決議要件
当社は、取締役の選任決議について、議決権を行使することができる株主の議決権の3分の1以上を有
する株主が出席し、その議決権の過半数をもって行う旨定款に定めている。
また、取締役の選任決議は、累積投票によらないものとする旨定款に定めている。
(9) 取締役会で決議できる株主総会決議事項
・自己の株式の取得
当社は、会社法第165条第2項の規定により、取締役会の決議をもって、自己の株式を取得することが
できる旨を定款に定めている。これは、経営環境の変化に対応した機動的な資本政策の遂行を可能とする
ため、市場取引等により自己の株式を取得することを目的とするものである。
・取締役および監査役の責任免除
当社は、会社法第426条第1項の規定により、取締役会の決議をもって同法第423条第1項の行為に関す
る取締役(取締役であった者を含む。)および監査役(監査役であった者を含む。)の責任を法令の限度
において免除することができる旨定款に定めている。これは、取締役および監査役が職務を遂行するにあ
たり、その能力を十分に発揮して、期待される役割を果たしうる環境を整備することを目的とするもので
ある。
・中間配当
当社は、取締役会の決議によって毎年9月30日を基準日として、中間配当を行うことができる旨定款に
定めている。これは、株主への機動的な利益還元を可能にするためである。
(10) 株主総会の特別決議要件
当社は、会社法第309条第2項に定める株主総会の特別決議要件について、議決権を行使することがで
きる株主の議決権の3分の1以上を有する株主が出席し、その議決権の3分の2以上をもって行う旨定款
に定めている。これは、株主総会における特別決議の定足数を緩和することにより、株主総会の円滑な運
営を行うことを目的とするものである。
26/116
EDINET提出書類
日本コークス工業株式会社(E00030)
有価証券報告書
④取締役会の活動状況
当事業年度において当社取締役会を月1回の頻度で開催しており、個々の取締役の出席状況については次のと
おりである。
氏
名
開催回数
出席回数
松岡
弘明
13回
13回
俊一郎
13回
13回
森
波多野
康彦(注)1
2回
2回
誠一郎(注)2
11回
11回
德永
直之
13回
13回
宮内
直孝
13回
13回
森尻
善雄
13回
13回
井伊
(注)1.波多野康彦は2025年6月27日開催の定時株主総会終結の時をもって退任するまでの出席回数を記載してい
る。
(注)2.井伊誠一郎は2025年6月27日開催の定時株主総会において選任された後の取締役会の出席回数を記載して
いる。
取締役会における具体的な検討内容は次のとおりである。
決議件数
経営戦略
5
主な内容等
・事業計画・予算
・配当
・コークス生産体制最適化
・株主総会関係
・内部統制の有効性評価
・リスクマネジメント委員会報告
・組織・規則の変更
・人事
ガバナンス
23
決算・財務
18
・決算
・業績予想
・損益等の進捗報告
個別案件
7
・カーボンニュートラル関連
取締役会での意思決定の他、経営戦略等に係る各種情報共有・意見交換を図るための会議を別途開催している。
27/116
EDINET提出書類
日本コークス工業株式会社(E00030)
有価証券報告書
(会社の機関の内容および内部統制関係図)
28/116
EDINET提出書類
日本コークス工業株式会社(E00030)
有価証券報告書
(2)【役員の状況】
① 役員一覧
a.2026年6月25日(有価証券報告書提出日)現在の当社の役員の状況は、以下のとおりである。
男性9名女性−名 (役員のうち女性の比率−%)
役職名
代表取締役
社長
常務取締役
常務取締役
氏名
松岡
森
弘明
井伊
俊一郎
誠一郎
生年月日
略歴
任期
所有
株式数
(株)
1960年8月31日
1985年4月新日本製鐵株式会社入社
2000年4月同社名古屋製鐵所総務部総務グループ
リーダー
2009年4月同社人事・労政部人事グループリーダー
2011年4月同社棒線事業部室蘭製鐵所総務部長
2014年4月同社棒線事業部棒線営業部長
2016年4月同社執行役員棒線事業部長
2019年4月同社常務執行役員大阪支社長
2021年4月同社執行役員社長付
当社顧問
2021年6月当社取締役副社長
2022年4月当社代表取締役社長(現)
(注)3
172,975
1960年9月20日
1983年4月三井鉱山株式会社入社
1997年1月 MITSUI MINING USA INC出向
2004年8月当社 コールチェーン事業本部本店 コー
クス部長
2008年6月当社経営企画部担当部長
2010年4月当社燃料部長
2013年4月当社執行役員 コークス部長
2016年6月当社取締役 コークス部長
2020年6月当社常務執行役員(役員制度改正によ
る) コークス部長
2021年6月当社常務執行役員
2023年6月当社常務取締役(現)
(注)3
117,665
1961年3月23日
1983年4月三井鉱山株式会社入社
2008年6月当社石炭部長
2009年5月当社三池事業所業務部船舶代理店課担当
課長
2013年2月当社燃料販売部長
2016年6月当社執行役員燃料販売部長
2019年6月当社取締役燃料販売部長
2020年6月当社執行役員(役員制度改正による) 燃
料販売部長
2021年6月当社執行役員燃料・資源リサイクル事業
部長
2022年4月当社常務執行役員燃料・資源リサイクル
事業部長
2025年6月当社常務取締役燃料・資源リサイクル事
業部長(現)
(注)5
15,509
(注)3
−
1995年4月住友商事株式会社入社
2008年9月同社
当社
炭素部
参事
コークス部
リーダー
2010年6月米国住友商事
コークス営業グループ
炭素・鉄鋼原料ユニット長
2015年4月住友商事株式会社
取締役
德永
直之
1972年12月11日
ブリーダー
2016年4月同社炭素部
炭素部炭素製品チームサ
参事
住商CRM株式会社
取締役
2018年10月同社
炭素部
業務・開発チームリーダー
2020年6月当社
社外取締役(現)
2022年4月住友商事株式会社
炭素部長
2024年4月住友商事株式会社
炭素ユニット長(現)
29/116
EDINET提出書類
日本コークス工業株式会社(E00030)
有価証券報告書
役職名
氏名
生年月日
略歴
任期
所有
株式数
(株)
(注)3
−
(注)3
−
(注)6
31,704
(注)4
−
1981年4月株式会社日本製鋼所入社
取締役
宮内
直孝
1958年1月30日
2013年4月同社
執行役員
2015年4月同社
常務執行役員
2016年6月同社
取締役常務執行役員
2017年4月同社
代表取締役社長
2022年4月同社
取締役
2022年6月同社
相談役
2024年6月当社
社外取締役(現)
1983年4月株式会社三井銀行入行
2013年4月同行
執行役員
2015年5月株式会社ヒューマン・インベントリー
問
ア
顧
兼株式会社フィナンシャル・キャリ
顧問
2015年6月株式会社ヒューマン・インベントリー
取締役
森尻
善雄
代表
取締役社長兼株式会社フィナンシャ
ル・キャリア 代表取締役社長
1960年11月6日
2019年5月室町ビルサービス株式会社
2019年6月同社
代表取締役社長
2023年6月同社
代表取締役会長
マック
2024年6月当社
顧問
兼
株式会社ヒュー
代表取締役社長
社外取締役(現)
2024年12月 ホウライ株式会社
常勤監査役(現)
1986年4月三井鉱山株式会社入社
2012年1月当社
北九州事業所
管理部部長
2014年1月有明機電工業株式会社
2015年10月当社
常勤監査役
益田
明
1963年7月11日
総務担当部長
人事・総務部
リスクマネジメントグ
ループリーダー
2018年5月当社人事・総務部
総務グループリーダー
2021年6月当社
九州事務所長
2023年6月当社
リスクマネジメント室長
2025年6月当社
常勤監査役(現)
1993年4月新日本製鐵株式会社入社
2007年11月同社
広畑製鐵所総務部
労政・人事グルー
プリーダー
2010年11月同社
監査役
渡邊
崇
1968年12月2日
鋼管事業部東京製造所
リーダー
2012年10月新日鐵住金株式会社
総務グループ
鋼管事業部東京製造
総務室長
2014年7月同社鋼管事業部鋼管企画部
2018年4月同社
関係会社部
鋼管企画室長
上席主幹
2021年4月日本製鉄株式会社関係会社部
2022年4月同社
関係会社部
2022年6月当社
監査役(現)
30/116
部長代理
部長(現)
EDINET提出書類
日本コークス工業株式会社(E00030)
有価証券報告書
役職名
氏名
生年月日
略歴
任期
所有
株式数
(株)
(注)4
−
1985年4月英和監査法人入社
1989年3月公認会計士登録
2000年6月朝日アーサーアンダーセン株式会社
アン
ダーセン・ナショナルパートナー
2003年1月 ベリングポイント株式会社 マネージング
監査役
櫻田
修一
1962年11月15日
ディレクター
2008年1月株式会社ヒューロンコンサルティンググルー
プ マネージングディレクター
2010年6月株式会社アカウンティング・アドバイザ
リー
代表取締役
マネージングディレク
ター(現)
2020年6月当社
監査役(現)
計
337,854
(注)1.取締役德永直之、宮内直孝、森尻善雄は、社外取締役である。
2.監査役渡邊崇、櫻田修一は、社外監査役である。
3.2024年6月27日開催の定時株主総会の終結の時から2年間
4.2024年6月27日開催の定時株主総会の終結の時から4年間
5. 2025年6月27日開催の定時株主総会の終結の時から1年間
6. 2025年6月27日開催の定時株主総会の終結の時から3年間
7.当社は、意思決定の迅速化および業務執行の円滑化を図るため、執行役員制度を導入している。執行役員は下
記のとおりである。
執行役員
コークス事業部長
坂田竜治
執行役員
化工機事業部長
辻田
雅文
執行役員
経営管理部長
小野
祐介
執行役員
社長特命担当、経営管理に関する事項に
つき、小野執行役員に協力
コークス事業部北九州事業所長
伊藤
親治
山下
伸一
執行役員
31/116
EDINET提出書類
日本コークス工業株式会社(E00030)
有価証券報告書
b.2026年6月26日開催予定の定時株主総会の議案(決議事項)として「取締役6名選任の件」を提案しており、
当該議案が承認可決されると、当社の役員の状況は、以下のとおりとなる予定である。なお、当該定時株主総
会の直後に開催が予定される取締役会の決議事項の内容(役職等)を含めて記載している。
男性9名女性−名 (役員のうち女性の比率−%)
役職名
氏名
生年月日
略歴
任期
所有株式数
(株)
(注)5
172,975
(注)5
10,000
(注)5
11,371
(注)5
−
1985年4月新日本製鐵株式会社入社
2000年4月同社
名古屋製鐵所
総務部総務グ
ループリーダー
2009年4月同社人事・労政部
人事グループ
リーダー
2011年4月同社棒線事業部
代表取締役
社長
松岡
弘明
1960年8月31日生
室蘭製鐵所
総務
部長
2014年4月同社
棒線事業部
2016年4月同社
執行役員
2019年4月同社
常務執行役員
2021年4月同社
執行役員
当社
棒線営業部長
棒線事業部長
大阪支社長
社長付
顧問
2021年6月当社
取締役副社長
2022年4月当社
代表取締役社長(現)
1988年4月株式会社三井銀行(現株式会社三井住
友銀行)入行
2006年5月 カナダ三井住友銀行
2012年4月同行
副社長
社長
2014年4月株式会社三井住友銀行
取締役
執行役員
小野
祐介
1966年1月29日生
香港支店長
2018年4月同行
理事
本店営業第三部長
2020年4月同行
理事
アジア・大洋州本部
副
本部長
2022年4月同行
理事
グローバル・アドバイザ
リー部部長
2023年5月当社理事経営管理部
2024年6月当社
執行役員
2026年6月当社
取締役執行役員
副部長
経営管理部長(現)
経営管理部長
(就任予定)
1992年4月三井鉱山株式会社(現当社)入社
取締役
執行役員
坂田
竜治
1964年12月21日生
2008年11月当社
北九州事業所
副所長
2013年7月当社
化工機事業部
栃木工場長
2015年12月当社
北九州事業所
設備部長
2019年4月当社
北九州事業所
副所長兼設備部
長
2020年7月当社
理事
北九州事業所
副所長兼
設備部長
2021年6月当社執行役員
コークス事業部北九
州事業所長
2025年6月当社執行役員
コークス事業部長
(現)
2026年6月当社取締役執行役員
コークス事業
部長(就任予定)
1995年4月住友商事株式会社入社
2008年9月同社
炭素部
当社
参事
コークス部
コークス営業グ
ループリーダー
2010年6月米国住友商事炭素・鉄鋼原料ユニッ
ト長
2015年4月住友商事株式会社
取締役
德永
直之
1972年12月11日生
炭素部炭素製品
チームサブリーダー
2016年4月同社
炭素部
参事
住商CRM株式会社
2018年10月同社
炭素部
取締役
業務・開発チームリー
ダー
2020年6月当社
社外取締役(現)
2022年4月住友商事株式会社
炭素部長
2024年4月住友商事株式会社
炭素ユニット長
(現)
32/116
EDINET提出書類
日本コークス工業株式会社(E00030)
有価証券報告書
役職名
氏名
生年月日
略歴
任期
所有株式数
(株)
(注)5
−
(注)5
−
(注)4
31,704
(注)3
−
1981年4月株式会社日本製鋼所入社
取締役
宮内
直孝
1958年1月30日生
2013年4月同社
執行役員
2015年4月同社
常務執行役員
2016年6月同社
取締役常務執行役員
2017年4月同社
代表取締役社長
2022年4月同社
取締役
2022年6月同社
相談役
2024年6月当社
社外取締役(現)
1983年4月株式会社三井銀行入行
2013年4月同行
執行役員
2015年5月株式会社ヒューマン・インベント
リー 顧問兼株式会社フィナン
シャル・キャリア 顧問
2015年6月株式会社ヒューマン・インベント
取締役
森尻
善雄
1960年11月6日生
リー 代表取締役社長兼株式会
社フィナンシャル・キャリア 代表
取締役社長
2019年5月室町ビルサービス株式会社顧問
2019年6月同社
代表取締役社長
2023年6月同社
代表取締役会長
ヒューマック
2024年6月当社
兼
株式会社
代表取締役社長
社外取締役(現)
2024年12月 ホウライ株式会社
常勤監査役(現)
1986年4月三井鉱山株式会社入社
2012年1月当社
北九州事業所
管理部部長
2014年1月有明機電工業株式会社
2015年10月当社
常勤監査役
益田
明
1963年7月11日生
人事・総務部
総務担当部長
リスクマネジメ
ントグループリーダー
2018年5月当社
人事・総務部
総務グループ
リーダー
2021年6月当社九州事務所長
2023年6月当社
リスクマネジメント室長
2025年6月当社
常勤監査役(現)
1993年4月新日本製鐵株式会社入社
2007年11月同社
広畑製鐵所総務部
労政・人事
グループリーダー
2010年11月同社鋼管事業部東京製造所
ループリーダー
2012年10月新日鐵住金株式会社
監査役
渡邊
崇
総務グ
鋼管事業部東京
製造総務室長
1968年12月2日生
2014年7月同社鋼管事業部鋼管企画部
画室長
2018年4月同社関係会社部
鋼管企
上席主幹
2021年4月日本製鉄株式会社関係会社部
部長代
理
2022年4月同社
関係会社部
2022年6月当社
監査役(現)
33/116
部長(現)
EDINET提出書類
日本コークス工業株式会社(E00030)
有価証券報告書
役職名
氏名
生年月日
略歴
任期
所有株式数
(株)
(注)3
−
1985年4月英和監査法人入社
1989年3月公認会計士登録
2000年6月朝日アーサーアンダーセン株式会社
アンダーセン・ナショナルパート
ナー
2003年1月 ベリングポイント株式会社 マネージ
監査役
櫻田
修一
1962年11月15日生
ングディレクター
2008年1月株式会社ヒューロンコンサルティング
グループ マネージングディレク
ター
2010年6月株式会社アカウンティング・アドバイ
ザリー
代表取締役
マネージング
ディレクター(現)
2020年6月当社
監査役(現)
計
226,051
(注)1.取締役德永直之、宮内直孝、森尻善雄は、社外取締役である。
2.監査役渡邊崇、櫻田修一は、社外監査役である。
3.2024年6月27日開催の定時株主総会の終結の時から4年間
4.2025年6月27日開催の定時株主総会の終結の時から3年間
5.2026年6月26日開催の定時株主総会の終結の時から2年間
6.当社は、意思決定の迅速化および業務執行の円滑化を図るため、執行役員制度を導入している。執行役員は下
記のとおりである。
常務執行役員化工機事業部長
辻田雅文
②
執行役員
社長特命担当、経営管理部に関し、小野取締役に協力
伊藤
親治
執行役員
リスクマネジメント室、人事・総務部、九州事務所担当
山下
伸一
執行役員
燃料・資源リサイクル事業部長、コークス事業に関し坂田取締役に協力
今澤
昭彦
社外役員の状況
イ.社外取締役と当社の関係等
社外取締役と当社の関係等は、以下のとおりである。
德永直之氏:同氏は、住友商事株式会社の社員である。なお、住友商事株式会社は、当社の「その他の関係
会社」であるほか、当社のコークス部門での主要な取引先である。
なお、いずれの社外取締役も当社と人的関係、資本関係、取引関係その他の利害関係等はない。
ロ.社外監査役と当社の関係等
社外監査役と当社の関係等は、以下のとおりである。
渡邊崇氏:同氏は、日本製鉄株式会社の社員である。なお、日本製鉄株式会社は、当社の「その他の関係
会社」であるほか、当社のコークス部門での主要な取引先である。
櫻田修一氏:同氏は、株式会社アカウンティング・アドバイザリー代表取締役マネージングディレクターで
ある。
なお、いずれの社外監査役も当社と人的関係、資本関係、取引関係その他の利害関係等はない。
③
ハ.社外取締役および社外監査役と当社との人的関係、資本関係、取引関係その他の利害関係等
当社は、当社の「その他の関係会社」であり、かつ、主要な取引先である日本製鉄株式会社、住友商事株式
会社との間で業務提携協定書を締結し、相互にシナジー効果を最大限に発揮すべく緊密な協力関係を構築して
いる。当社の社外取締役3名のうち1名と社外監査役1名は、各社の業務執行者であり、当社の事業にも知見
があることから、当社のガバナンスの効率性と実効性が期待され、企業価値の向上に資するものと考えてい
る。なお、社外取締役のうち2名は、一般株主と利益相反が生じるおそれのない独立役員であることから、一
般株主の利益保護の視点が期待され、これらの相乗効果で一層企業価値の向上に資するものと考えている。
また、社外取締役および社外監査役を継続して選任することにより、取締役および監査役の職務執行の監督
機能の維持・向上が図られると考えている。
当社の社外役員の独立性については、金融商品取引所が定める独立役員の独立性判断基準をもとに当社が独
自に定めた基準に従い、当社との人的関係、資本関係、取引関係その他の利害関係を勘案し、その有無を判断
している。
社外取締役又は社外監査役による監督又は監査と内部監査、監査役監査および会計監査との相互連携並びに内
部統制部門との関係
34/116
EDINET提出書類
日本コークス工業株式会社(E00030)
有価証券報告書
社外取締役および社外監査役は、取締役および監査役会等において、それぞれの専門分野に関する知見から
意見を述べるなど、適宜必要な発言を行っている。
また、社外監査役は、常勤監査役と常に連携し、内部監査および会計監査との相互連携並びに内部統制部門
との関係等を通じて、多角的な視点からの監査を実施している。
(3)【監査の状況】
①監査役監査の状況
a.監査役監査の組織、人員及び手続
監査役監査の組織、人員及び手続については、「(1)コーポレート・ガバナンスの概要 ②企業統治の
体制の概要及び当該体制を採用する理由」に記載している。
なお、常勤監査役である益田明は、当社の総務・法務および内部監査部門に長年在籍し、業務監査並びに
内部統制等に従事し、また、社外監査役渡邊崇は、財務及び会計に関する相当程度の知見を有しており、社
外監査役櫻田修一は、公認会計士の資格を有し、財務及び会計に関する相当程度の知見を有している。
b.監査役及び監査役会の活動状況
当事業年度において当社は監査役会を計13回開催しており、個々の監査役の出席状況については次のとお
りである。
氏
名
開催回数
出席回数
伊藤
親治(注)1
3回
3回
益田
明(注)2
10回
10回
渡邊
崇
13回
13回
櫻田
修一
13回
13回
(注)1.伊藤親治は2025年6月27日開催の定時株主総会終結の時をもって退任するまでの出席回数を記載して
いる。
(注)2.益田明は2025年6月27日開催の定時株主総会において選任された後の監査役会の出席回数を記載して
いる。
監査役会における主な検討事項は、監査の方針および監査実施計画、内部統制システムの整備・運用状況、会計
監査人の監査の方法および結果の相当性等である。
常勤監査役は、取締役等との意思疎通、取締役会その他重要な会議への出席、重要な決裁書類等の閲覧、本社お
よび事業所における業務および財産状況の調査、子会社の取締役等および監査役との意思疎通・情報交換や子会社
からの事業報告の確認、会計監査人からの監査の実施状況・結果の報告の確認を行っており、監査役会において、
社外監査役に定期的に報告し情報を共有するとともに意見交換している。
社外監査役は、取締役会に出席し、それぞれの専門的知見やバックグラウンドを活かし、必要に応じて説明を求
め意見表明を行い、また、常勤監査役とともに事業所や主要子会社に往査等を行い、状況の確認に努め、会計監査
人からの監査の実施状況・結果の報告の確認を協力して行っている。
監査役会における具体的な検討内容は以下のとおりである。
件数
主な内容等
決議
7
常勤監査役の選定、監査実施計画、会計監査人報酬額に関する同意、監査
役の選任議案への同意、監査報告書提出、会計監査人の再任等
報告
24
経営会議等の重要案件の概要、操業状況、業務監査実施概要報告、重要会
議等の報告、会計監査人の評価等
審議・協議
11
年間監査計画、会計監査人の再任・不再任評価プロセス、監査役報酬、監
査報告書案
35/116
EDINET提出書類
日本コークス工業株式会社(E00030)
有価証券報告書
②内部監査の状況
当社の内部監査の状況は以下の通りである。
a.組織・人員
当社は、当社グループのコンプライアンスの遵守状況および業務の適正性を中心としたリスクマネジメン
トを行うため、リスクマネジメント室を設置し、専任者5名、兼任者2名を置いている。
b.活動内容等
当社の内部監査は、当社及び当社グループを対象として、監査計画に従い、業務の適正性等を監査してお
り、リスクマネジメント室長は、監査対象組織の担当役員に内部監査報告書を提出し、監査対象組織に対し
て、指摘事項への回答その他問題点の是正を求め、その実施状況を確認している。
更に、半期に1回、「リスクマネジメント委員会」を実施し、代表取締役等に対して、監査結果および問
題点等について報告している。
また、金融商品取引法に基づく財務報告に係る内部統制の評価および報告をリスクマネジメント室で実施
している。
c.内部監査、監査役監査および会計監査の相互連携
リスクマネジメント室長は、監査役会による効率的な監査の遂行に資するよう、内部監査報告書の写しを
常勤監査役に送付する他、監査役会の監査計画等を共有し、連携を行っている。
また、リスクマネジメント室長は、会計監査人との四半期ごとの定期的な打ち合わせ、意見交換に加え、
必要に応じて随時に打ち合わせ、意見交換を実施している。
③会計監査の状況
a.監査法人の名称
EY新日本有限責任監査法人
b.継続監査期間
59年間
c.業務を執行した公認会計士
指定有限責任社員業務執行社員
指定有限責任社員業務執行社員
山村
青木
竜平
一
d.監査業務に係る補助者の構成
当社の会計監査業務に係る補助者は、公認会計士4名、その他18名である。
e.監査法人の選定方針と理由
当社の監査役会は、会計監査人の選定について、当社の広範な業務内容に対応して効率的な監査業務を実施
できる一定の規模を持つこと、審査体制が整備されていること、監査日数、監査期間および具体的な監査実施
要領並びに監査費用が合理的且つ妥当であること、等により総合的に判断する事としている。
その結果、当社の監査役会は、EY新日本有限責任監査法人が適任と判断している。
f.監査役及び監査役会による監査法人の評価
当社の監査役および監査役会は、日本監査役協会が公表している「会計監査人の評価及び選定基準策定に関
する監査役等の実務指針」を踏まえた上で監査法人に対して評価を行っており、会計監査人が独立の立場を保
持し、且つ、適正な監査を実施しているかを監視および検証するとともに、会計監査人からその職務の執行状
況についての報告、また、「職務の遂行が適正に行われることを確保するための体制」(会社計算規則第131
条各号に掲げる事項)を「監査に関する品質管理基準」(2024年3月12日企業会計審議会)等に従って整備し
ている旨の通知を受け、必要に応じて説明を求めた。
その結果、会計監査人の職務執行に問題はないと評価し、再任を決議している。
36/116
EDINET提出書類
日本コークス工業株式会社(E00030)
有価証券報告書
④監査報酬の内容等
a.監査公認会計士等に対する報酬の内容
前連結会計年度
区分
当連結会計年度
監査証明業務に基づく
報酬(百万円)
非監査業務に基づく報
酬(百万円)
監査証明業務に基づく
報酬(百万円)
非監査業務に基づく報
酬(百万円)
提出会社
64
−
65
−
連結子会社
−
−
−
−
64
−
65
−
計
b.監査公認会計士等と同一のネットワークに対する報酬(a.を除く)
前連結会計年度
区分
当連結会計年度
監査証明業務に基づく
報酬(百万円)
非監査業務に基づく報
酬(百万円)
監査証明業務に基づく
報酬(百万円)
非監査業務に基づく報
酬(百万円)
提出会社
−
1
−
1
連結子会社
−
−
−
−
計
−
1
−
1
(注)提出会社及び連結子会社における非監査業務の内容は、移転価格文書作成支援業務等である。
なお、非連結子会社における非監査業務に基づく報酬は0百万円である。
c.その他の重要な監査証明業務に基づく報酬の内容
該当事項はない。
d.監査役会が会計監査人の報酬等に同意した理由
監査役会は、会計監査人の監査計画の内容、会計監査の職務遂行状況および報酬見積り等が当社の事業規模
や事業内容に照らして適切かどうかの必要な検証を行ったうえで、会計監査人の報酬等の額について同意の判
断を行っている。
37/116
EDINET提出書類
日本コークス工業株式会社(E00030)
有価証券報告書
(4)【役員の報酬等】
①役員報酬等の額又はその算定方法の決定に関する方針に係る事項
a.方針の内容等
当社の「取締役及び監査役の報酬等の額の決定に関する方針」は、以下の通りである。
・取締役
求められる能力および責任に見合った水準を勘案して役位別に基準額を定め、これを当社の連結の業績
に応じて一定の範囲で変動させ、株主総会で承認を得た限度額の範囲内で各取締役に係る月額報酬の額を
決定する。
・監査役
役位および常勤・非常勤の別に応じた職務の内容を勘案し、株主総会で承認を得た限度額の範囲内で各
監査役に係る月額報酬の額を決定する。
上記の方針により、当社の役員の報酬等の額は、業績を反映した報酬体系を適用しており、2004年3月1日
開催の臨時株主総会で承認を得た取締役報酬枠(月額30百万円以下)の範囲内で、毎年7月に、前期の連結経
常利益を勘案して、取締役の定額報酬を改定する運用を行っている。
なお、取締役および監査役の退職慰労金制度は廃止している。
b.方針の決定方法
報酬決定の手続きは、取締役の報酬にあっては、株主総会で承認を得た取締役の報酬の範囲内で、役員人
事・報酬会議の検討を経て取締役会で決定し、監査役の報酬については、監査役の協議により決定するもの
としている。
なお、役員人事・報酬会議は、当社の役員の人事・報酬の決定に先立ち、議論、検討する機関であり、社
長、人事担当役員、社外取締役で構成する。
当社は2021年2月26日開催の取締役会の委任決議に基づき、当期の各取締役の個人別の報酬額の具体的内容
については、代表取締役社長松岡弘明がそれぞれ決定している。
その権限の内容は、各取締役の個人別の基準報酬額の決定および各取締役の個人別の報酬額の決定である。
これらの権限を委任した理由は、当社全体の業績を俯瞰し報酬額の決定を行うには代表取締役社長が最も適
しているからである。
代表取締役社長は役員人事・報酬会議において議論、検討された内容を尊重のうえ、報酬額を決定し、決定
した各取締役の報酬額を取締役会にて報告するという措置を講じており、当該手続きを経て取締役の個人別の
報酬額が決定されていることから、取締役会はその内容が決定方針に沿うものであると判断している。
②役員区分ごとの報酬等の総額、報酬等の種類別の総額及び対象となる役員の員数
報酬等の種類別の総額(百万円)
役員区分
報酬等の総額
(百万円)
固定報酬
業績連動報酬
退職慰労金引当額
対象となる
役員の員数
(人)
取締役
(社外取締役を除く)
82
−
82
−
4
監査役
(社外監査役を除く)
14
14
−
−
2
社外役員
19
19
−
−
3
116
33
82
−
9
計
(注)1.取締役の役員報酬額には、使用人兼務取締役の使用人分給与は含まれていない。
2.株主総会決議による取締役の報酬限度額は、月額30百万円(使用人兼務取締役の使用人分給与相当額は
含まない。)、監査役の報酬限度額は、月額5百万円である。
3.当連結会計年度末現在の取締役は6名(うち社外取締役は3名)、監査役は3名(うち社外監査役は2
名)である。表中の支給人員との差は、退任者が2名、期末在任者のうち社外取締役1名および社外監
査役1名が無報酬のためである。
38/116
EDINET提出書類
日本コークス工業株式会社(E00030)
有価証券報告書
(5)【株式の保有状況】
① 投資株式の区分の基準及び考え方
a.純投資目的以外の目的である投資株式
業務提携、取引の維持上の必要性を勘案し、保有する株式数を含め合理性があると認められる場合に、政
策的に保有する株式
b.純投資目的である投資株式
上記a以外の株式
②
保有目的が純投資目的以外の目的である投資株式
a.保有方針及び保有の合理性を検証する方法並びに個別銘柄の保有の適否に関する取締役会等における検証
の内容
(保有方針)
当社は、株式の保有が当社と保有先企業において、取引関係や提携関係および人的交流などの事業基盤の維
持・強化、当社の収益力向上、ひいては当社および当社グループの企業価値向上に資すると判断できる場合に
限り、純投資目的以外の目的である投資株式を政策的に保有継続することとしており、検証の結果その効果が
認められなくなった場合には売却する方針である。
(保有の合理性を検証する方法並びに個別銘柄の保有の適否に関する取締役会等における検証の内容)
保有の合理性の検証方法については、全ての株式を対象に取引関係や提携関係および人的交流などの維持・
強化といった保有目的が適切かどうかに加え、保有に伴うリターン・リスク、資本コストに見合っているかど
うかを個別・具体的に精査し、取締役会において検証している(2025年6月27日取締役会)。
b.銘柄数及び貸借対照表計上額
銘柄数
(銘柄)
貸借対照表計上額の
合計額(百万円)
非上場株式
7
188
非上場株式以外の株式
2
1,379
(当事業年度において株式数が増加した銘柄)
銘柄数
(銘柄)
株式数の増加に係る取得
価額の合計額(百万円)
非上場株式
−
−
−
非上場株式以外の株式
−
−
−
(当事業年度において株式数が減少した銘柄)
銘柄数
(銘柄)
株式数の減少に係る売却
価額の合計額(百万円)
非上場株式
−
−
非上場株式以外の株式
1
117
39/116
株式数の増加の理由
EDINET提出書類
日本コークス工業株式会社(E00030)
有価証券報告書
c.特定投資株式及びみなし保有株式の銘柄ごとの株式数、貸借対照表計上額等に関する情報
特定投資株式
当事業年度
前事業年度
保有目的、業務提携等の概要、
当社の株式の
株式数(株)
株式数(株)
銘柄
定量的な保有効果
保有の有無
貸借対照表計上額貸借対照表計上額
及び株式数が増加した理由
(百万円)
(百万円)
281,500
471,500
グリーンランド
リゾート㈱
171
487,000
290
97,400
日鉄鉱業㈱
1,208
640
当該社は当社の元子会社であ
り、当社の主要事業基盤である福
岡県大牟田市において資源リサイ
クル事業で協業するなど、事業活
動の円滑な推進を目的として同社
株式を保有している。
当該社との個別取引に関する定
量的な保有効果の記載は困難であ
るものの、保有目的が適切か、保
有に伴う便益やリスクが資本コス
トに見合っているか等を具体的に
精査し、株式保有の合理性を検証
している。
無
当該社は燃料販売事業等におい
て重要な顧客であり、事業上の関
係の維持・強化を目的として同社
株式を保有している。
当該社との個別取引に関する定
量的な保有効果の記載は困難であ
るものの、保有目的が適切か、保
有に伴う便益やリスクが資本コス
トに見合っているか等を具体的に
精査し、株式保有の合理性を検証
している。
有
みなし保有株式
該当事項はない。
③
保有目的が純投資目的である投資株式
当該銘柄は保有していない。
④
当事業年度に投資株式の保有目的を純投資目的から純投資目的以外の目的に変更したもの
該当事項はない。
⑤
当事業年度の前4事業年度及び当事業年度に投資株式の保有目的を純投資目的以外の目的から純投資目的に変
更したもの
該当事項はない。
40/116
EDINET提出書類
日本コークス工業株式会社(E00030)
有価証券報告書
5【従業員の状況等】
(1)【人材戦略に関する基本方針等】
① 人材育成方針
当社グループは経営理念「人類の活動に不可欠な資源や素材と高付加価値技術を社会に供給し続けることにより
存在価値のある企業体としてより良い社会環境の構築に貢献するとともに、人類社会の永続的発展に寄与する。」
を掲げている。国内労働人口の減少・人材流動化等の環境変化のなか理念を具現化していくため、自律的にスキル
を磨き、専門性を発揮し、当社グループの持続的成長を支える人材について、OJT、OFF-JTを中心として人材育成
に努めている。
また、これらの施策の土台となる風通しのよい職場風土の醸成に向けて社員の対話・コミュニケーション促進の
取組みを実施している。
これらを通じて、社員が持つ力を最大限に引き出すことで生産性の向上や付加価値の創出を通じた企業価値の向
上を目指している。
・当社では、OJTが人材育成における基本であるとの認識に立ち、上司と社員の対話を前提とした育成を図って
いる。製造現場では、社員が業務経験に応じて習得すべき技術スキルを標準化、見える化している。また、社
員の適性や習得スキルを踏まえた適正配置(ローテーション含む)を通じた多様なキャリア形成を促してい
る。
QC活動(自主管理活動)を通じた人材育成の活性化も図っている。
・階層別教育等OFF‐JT
新入社員の「導入研修」にはじまり「フォローアップ研修」で実務上の課題解決力を養成する。これらに加
え、職場での「指導員・メンター制度・コーチャー制度」等によるきめ細かな支援を組み合わせることで、新
入社員の孤立を防ぎ、エンゲージメント向上と早期の戦力化に向けた多層的サポートを行っている。
その後については、入社2〜3年目の社員を対象とした若手社員研修、入社5年目以降の社員を対象とした職責
の拡大や後輩育成への対応を目的とした中堅社員教育、管理職昇格前の社員を対象とした次世代リーダー研
修、管理職社員を対象としたマネジメントに関するスキル獲得を目的とした管理職研修等を実施し、社員のス
テージや役割に応じた多段階の階層別教育を実施し育成を図っている。
この中で、コンプライアンス意識の向上、製造業の根幹である安全意識、技能の伝承等を図っている。
② 社内環境整備
当社グループのサステナビリティ推進方針に掲げる人権と人材育成に関する方針「人権と人種・個性などの多様
性を尊重するとともに、社員が安全で働きやすい環境を確保し、意欲を持って自己実現を図れる職場作りに努め
る」に沿って社内の労働環境整備に努めている。
・多様性について
階層別教育の中に人権教育を取り入れ、多様性を受け入れる風土の醸成を図っている。
採用においても、新卒定期採用に加え、中途、性別等にかかわらない幅広い柔軟な選考を行っている。
・柔軟な働き方の提供
フレックスタイム制、在宅勤務制、積立年次有給休暇の育児・介護目的での利用、時間単位の有給休暇制度等
を導入し、より柔軟なワークライフバランスを実現できる施策を講じている。
・快適で安全な労働環境の提供
製造業の根幹である作業現場における安全な労働環境の整備を最重要課題として取り組む。
この他、福利厚生設備等のインフラ整備や共有スペースの快適化なども実施している。
また、社員のメンタルヘルス対策として匿名で利用できる外部カウンセリングサービスを導入している。
③ 指標及び目標
当社では、法に基づく各種指標や自主目標について、その推移を常にモニタリングし充足するよう努めている。
・女性総合職採用比率(新卒採用における女性比率)
・障害者雇用率(法定雇用率)
・育児休業取得率(男女育児休業取得率)
・有給休暇消化率等
④ 給与その他の給付の額及び内容の決定に関する方針
当社は、企業の持続的成長の源泉は人材であるとの認識のもと、社員の適正・公平な評価・処遇に加え、エン
ゲージメントを高めるための給与制度、その他給付制度を実施している。
給与については、社員の能力と役割に応じた体系とし、製造系には役職手当を支給。スタッフ系は役職に応じた
役割給の比率を拡大した制度改定を行った。これらを通じ、意欲と能力のある社員には、役職に早期抜擢などによ
り社内の活性化を図る。
41/116
EDINET提出書類
日本コークス工業株式会社(E00030)
有価証券報告書
また、賞与の基礎額を当社の業績に連動させることで、社員が会社全体の収益に対してもインセンティブを持て
る施策を講じている。
社員の給与・手当等の処遇の見直しにあたっては、人材確保・定着及び活躍推進の観点から、労使で真摯な協議
を行ったうえで実施している。
42/116
EDINET提出書類
日本コークス工業株式会社(E00030)
有価証券報告書
(2)【従業員の状況】
①連結会社の状況
2026年3月31日現在
セグメントの名称
従業員数(人)
コークス事業
335
燃料・資源リサイクル事業
23
総合エンジニアリング事業
345
703
報告セグメント計
その他
247
全社(共通)
33
983
合計
(注)1.従業員数は就業人員(当社グループ外からの出向受入社員を含め、当社グループ外への出向社員、組合専従者
および休職者を含めない)である。なお、臨時雇用者数(アルバイト、パート等直接給与等を支払っている
者)の当連結会計年度平均人員は従業員数の100分の10未満であるため、記載していない。
2.全社(共通)として記載されている従業員数は、管理部門に所属しているものである。
②提出会社の状況
2026年3月31日現在
従業員数(人)
平均年齢(歳)
465
40.4
平均勤続年数(年)
18.2
セグメントの名称
平均年間給与の
対前事業年度増減率
(%)
平均年間給与(円)
6,066,971
2.1
従業員数(人)
コークス事業
327
燃料・資源リサイクル事業
18
総合エンジニアリング事業
83
428
報告セグメント計
その他
4
全社(共通)
33
465
合計
(注)1.従業員数は就業人員(社外からの出向受入社員を含め、社外への出向社員、組合専従者および休職者を含めな
い)である。なお、臨時雇用者数(アルバイト、パート等直接給与等を支払っている者)の当事業年度平均人
員は、従業員数の100分の10未満であるため記載していない。
2.平均年間給与は税込基準内外給与(賞与を含む)である。
3.全社(共通)として記載されている従業員数は、管理部門に所属しているものである。
③労働組合の状況
当社グループには、日本コークス工業都市労働組合、日本コークス工業社員労働組合、日本コークス工業化工
機ユニオンおよび三池港物流社員労働組合が組織されている。
日本コークス工業社員労働組合および三池港物流社員労働組合は基幹労連に所属しており、日本コークス工業
化工機ユニオンはJAMに所属している(2026年3月31日現在当社グループ組合員総数489人)。
なお、労使関係は安定している。
43/116
EDINET提出書類
日本コークス工業株式会社(E00030)
有価証券報告書
④管理的地位にある労働者に占める女性労働者の割合、男性労働者の育児休業取得率及び労働者の男女の賃金の額
の差異
ア 提出会社
当事業年度
管理的地位に
ある労働者に
占める女性労
働者の割合
(%)
(注)2.
男性労働者の
育児休業取得
率(%)
(注)3.
−
62.5
労働者の男女の賃金の額の差異(%)
(注)1.
全労働者
73.7
補足説明
正規雇用労働
者
パート・有期
労働者
73.3
−
−
(注)1.「女性の職業生活における活躍の推進に関する法律」(平成27年法律第64号)の規定に基づき算出したもの
である。
2.提出会社は、「女性の職業生活における活躍の推進に関する法律」(平成27年法律第64号)の規定による公
表義務の対象ではないため、記載を省略している。
3.「育児休業、介護休業等育児又は家族介護を行う労働者の福祉に関する法律」(平成3年法律第76号)の規
定に基づき、「育児休業、介護休業等育児又は家族介護を行う労働者の福祉に関する法律施行規則」(平成
3年労働省令第25号)第71条の6第1号における育児休業等の取得割合を算出したものである。
4.賃金:基本給、超過労働に対する報酬、賞与等を含み、退職手当、通勤手当等を除く。
正社員:出向者については、当社から社外への出向者を除き、他社から当社への出向者を含む。
パート・有期社員:嘱託を含み、派遣社員を除く。
イ
連結子会社
連結子会社は「女性の職業生活における活躍の推進に関する法律」(平成27年法律第64号)及び「育児休業、介
護休業等育児又は家族介護を行う労働者の福祉に関する法律」(平成3年法律第76号)の規定による公表義務の対
象ではないため、記載を省略している。
44/116
EDINET提出書類
日本コークス工業株式会社(E00030)
有価証券報告書
第5【経理の状況】
1.連結財務諸表及び財務諸表の作成方法について
(1)当社の連結財務諸表は、「連結財務諸表の用語、様式及び作成方法に関する規則」(1976年大蔵省令第28号)に
基づいて作成している。
(2)当社の財務諸表は、「財務諸表等の用語、様式及び作成方法に関する規則」(1963年大蔵省令第59号。以下「財
務諸表等規則」という。)に基づいて作成している。
また、当社は、特例財務諸表提出会社に該当し、財務諸表等規則第127条の規定により財務諸表を作成してい
る。
2.監査証明について
当社は、金融商品取引法第193条の2第1項の規定に基づき、連結会計年度(2025年4月1日から2026年3月31日
まで)の連結財務諸表および事業年度(2025年4月1日から2026年3月31日まで)の財務諸表について、EY新日本有
限責任監査法人により監査を受けている。
3.連結財務諸表等の適正性を確保するための特段の取組について
当社は、連結財務諸表等の適正性を確保するための特段の取組を行っている。具体的には、会計基準等の内容を適
切に把握し、又は会計基準等の変更等について的確に対応することができる体制を整備するため、公益財団法人財務
会計基準機構に加入し、研修等に参加している。
45/116
EDINET提出書類
日本コークス工業株式会社(E00030)
有価証券報告書
1【連結財務諸表等】
(1)【連結財務諸表】
①【連結貸借対照表】
(単位:百万円)
前連結会計年度
(2025年3月31日)
資産の部
流動資産
現金及び預金
受取手形
売掛金
契約資産
商品及び製品
仕掛品
原材料及び貯蔵品
その他
貸倒引当金
流動資産合計
固定資産
有形固定資産
建物及び構築物
減価償却累計額
建物及び構築物(純額)
機械装置及び運搬具
減価償却累計額
機械装置及び運搬具(純額)
土地
建設仮勘定
その他
減価償却累計額
その他(純額)
有形固定資産合計
無形固定資産
その他
無形固定資産合計
投資その他の資産
投資有価証券
繰延税金資産
その他
貸倒引当金
投資その他の資産合計
固定資産合計
資産合計
46/116
当連結会計年度
(2026年3月31日)
5,109
949
10,865
1,064
12,102
1,583
13,450
829
−
45,955
6,392
163
9,118
573
10,495
1,136
16,736
800
△22
45,395
25,358
△17,220
8,138
120,441
△85,406
35,034
33,567
2,573
2,772
△1,816
956
80,270
25,551
△17,517
8,034
108,586
△76,100
32,486
33,417
1,681
3,032
△2,010
1,021
76,640
707
707
681
681
※1 1,292
※1 1,757
1,599
846
△41
3,697
84,675
130,630
1,308
802
△41
3,827
81,149
126,544
EDINET提出書類
日本コークス工業株式会社(E00030)
有価証券報告書
(単位:百万円)
前連結会計年度
(2025年3月31日)
負債の部
流動負債
支払手形及び買掛金
短期借入金
未払法人税等
契約負債
賞与引当金
関係会社整理損失引当金
受注損失引当金
その他
流動負債合計
固定負債
長期借入金
退職給付に係る負債
役員退職慰労引当金
環境対策引当金
その他
固定負債合計
負債合計
純資産の部
株主資本
資本金
資本剰余金
利益剰余金
自己株式
株主資本合計
その他の包括利益累計額
その他有価証券評価差額金
繰延ヘッジ損益
退職給付に係る調整累計額
その他の包括利益累計額合計
純資産合計
負債純資産合計
47/116
当連結会計年度
(2026年3月31日)
7,564
32,929
286
108
703
344
406
5,830
48,173
9,604
37,886
397
355
660
11
194
5,438
54,549
32,887
3,102
48
3,989
829
40,857
89,030
29,391
2,664
43
4,045
1,051
37,196
91,746
7,000
1,750
33,769
△1,209
41,309
7,000
1,750
26,090
△1,209
33,630
460
0
△170
290
41,600
130,630
801
△0
366
1,166
34,797
126,544
EDINET提出書類
日本コークス工業株式会社(E00030)
有価証券報告書
②【連結損益計算書及び連結包括利益計算書】
【連結損益計算書】
(単位:百万円)
前連結会計年度
(自 2024年4月1日
至 2025年3月31日)
売上高
売上原価
売上総利益又は売上総損失(△)
販売費及び一般管理費
積揚地諸掛
給料及び賃金
海上運賃
陸上運賃
賞与引当金繰入額
退職給付費用
役員退職慰労引当金繰入額
減価償却費
その他
販売費及び一般管理費合計
営業利益又は営業損失(△)
営業外収益
受取利息
受取配当金
関係会社整理損失引当金戻入額
助成金収入
その他
営業外収益合計
営業外費用
支払利息
環境対策引当金繰入額
その他
営業外費用合計
経常損失(△)
特別利益
固定資産売却益
投資有価証券売却益
その他
特別利益合計
特別損失
固定資産除却損
減損損失
棚卸資産廃棄損
災害による損失
その他
特別損失合計
税金等調整前当期純損失(△)
法人税、住民税及び事業税
法人税等調整額
法人税等合計
当期純損失(△)
親会社株主に帰属する当期純損失(△)
48/116
当連結会計年度
(自 2025年4月1日
至 2026年3月31日)
※1 99,045
※1 91,386
※7,※8 101,160
※7,※8 84,169
△2,115
7,216
1,585
945
734
610
159
91
6
153
※6 2,159
1,574
995
727
690
148
70
9
183
※6 2,208
6,446
△8,562
6,608
607
16
30
−
5
46
99
31
38
326
163
70
630
560
711
534
1,806
△10,269
869
332
312
1,514
△276
※2 32
※2 128
−
5
38
75
7
211
※3 719
※3 1,094
※4 10
※4 4,436
−
※9 829
17
1,577
△11,808
445
1,654
2,100
△13,908
△13,908
※5 253
※9 580
691
7,057
△7,122
402
153
556
△7,678
△7,678
EDINET提出書類
日本コークス工業株式会社(E00030)
有価証券報告書
【連結包括利益計算書】
(単位:百万円)
前連結会計年度
(自 2024年4月1日
至 2025年3月31日)
当期純損失(△)
その他の包括利益
その他有価証券評価差額金
繰延ヘッジ損益
退職給付に係る調整額
その他の包括利益合計
包括利益
(内訳)
親会社株主に係る包括利益
非支配株主に係る包括利益
49/116
当連結会計年度
(自 2025年4月1日
至 2026年3月31日)
△13,908
△7,678
56
1
△32
※1,※2 26
340
△1
536
※1,※2 876
△13,882
△6,802
△13,882
−
△6,802
−
EDINET提出書類
日本コークス工業株式会社(E00030)
有価証券報告書
③【連結株主資本等変動計算書】
前連結会計年度(自 2024年4月1日
至
2025年3月31日)
(単位:百万円)
株主資本
資本金
当期首残高
資本剰余金
7,000
利益剰余金
1,750
自己株式
48,551
株主資本合計
△1,209
56,091
当期変動額
剰余金の配当
親会社株主に帰属する当
期純損失(△)
△873
△873
△13,908
△13,908
自己株式の取得
△0
△0
株主資本以外の項目の当
期変動額(純額)
−
当期変動額合計
当期末残高
−
−
△14,781
△0
△14,781
7,000
1,750
33,769
△1,209
41,309
その他の包括利益累計額
その他有価証
券評価差額金
当期首残高
404
その他の包括
繰延ヘッジ損退職給付に係る
利益累計額合
益
調整累計額
計
△1
△138
純資産合計
264
56,355
剰余金の配当
−
△873
親会社株主に帰属する当
期純損失(△)
−
△13,908
自己株式の取得
−
△0
当期変動額
株主資本以外の項目の当
期変動額(純額)
56
1
△32
26
26
当期変動額合計
56
1
△32
26
△14,755
当期末残高
460
0
△170
290
41,600
50/116
EDINET提出書類
日本コークス工業株式会社(E00030)
有価証券報告書
当連結会計年度(自
2025年4月1日
至
2026年3月31日)
(単位:百万円)
株主資本
資本金
当期首残高
資本剰余金
7,000
利益剰余金
1,750
自己株式
33,769
株主資本合計
△1,209
41,309
当期変動額
剰余金の配当
親会社株主に帰属する当
期純損失(△)
−
−
△7,678
△7,678
自己株式の取得
△0
△0
株主資本以外の項目の当
期変動額(純額)
−
当期変動額合計
当期末残高
−
−
△7,678
△0
△7,678
7,000
1,750
26,090
△1,209
33,630
その他の包括利益累計額
その他有価証
券評価差額金
当期首残高
460
その他の包括
繰延ヘッジ損退職給付に係る
利益累計額合
益
調整累計額
計
0
△170
純資産合計
290
41,600
剰余金の配当
−
−
親会社株主に帰属する当
期純損失(△)
−
△7,678
自己株式の取得
−
△0
当期変動額
株主資本以外の項目の当
期変動額(純額)
340
△1
536
876
876
当期変動額合計
340
△1
536
876
△6,802
当期末残高
801
△0
366
1,166
34,797
51/116
EDINET提出書類
日本コークス工業株式会社(E00030)
有価証券報告書
④【連結キャッシュ・フロー計算書】
(単位:百万円)
前連結会計年度
(自 2024年4月1日
至 2025年3月31日)
営業活動によるキャッシュ・フロー
税金等調整前当期純損失(△)
減価償却費
減損損失
棚卸資産廃棄損
災害による損失
貸倒引当金の増減額(△は減少)
賞与引当金の増減額(△は減少)
関係会社整理損失引当金の増減額(△は減少)
退職給付に係る負債の増減額(△は減少)
役員退職慰労引当金の増減額(△は減少)
環境対策引当金の増減額(△は減少)
受注損失引当金の増減額(△は減少)
受取利息及び受取配当金
保険差益
支払利息
為替差損益(△は益)
固定資産除却損
固定資産売却損益(△は益)
投資有価証券売却損益(△は益)
売上債権及び契約資産の増減額(△は増加)
棚卸資産の増減額(△は増加)
その他営業資産の増減額(△は増加)
仕入債務の増減額(△は減少)
未払消費税等の増減額(△は減少)
その他営業負債の増減額(△は減少)
その他の固定負債の増減額(△は減少)
その他
小計
保険金の受取額
利息及び配当金の受取額
利息の支払額
法人税等の支払額又は還付額(△は支払)
災害損失の支払額
営業活動によるキャッシュ・フロー
投資活動によるキャッシュ・フロー
固定資産の取得による支出
固定資産の除却による支出
固定資産の売却による収入
投資有価証券の取得による支出
投資有価証券の売却による収入
その他の投資に係る支出
その他の投資の回収による収入
その他
投資活動によるキャッシュ・フロー
52/116
当連結会計年度
(自 2025年4月1日
至 2026年3月31日)
△11,808
5,240
10
−
829
△9
△25
△3
96
△8
474
391
△47
△8
560
4
719
△32
−
1,889
15,601
24
△13,140
42
△2,023
△113
147
△1,185
13
47
△560
△662
△829
△3,178
△7,122
6,009
4,436
253
580
22
△42
△333
98
△4
56
△211
△70
△33
869
△6
1,094
△124
△75
3,023
△1,486
△39
1,980
156
575
215
△18
9,805
33
70
△873
△376
△148
8,511
△16,026
△675
48
△10
−
△19
6
△8
△16,685
△7,965
△987
211
△10
117
△2
1
△50
△8,684
EDINET提出書類
日本コークス工業株式会社(E00030)
有価証券報告書
(単位:百万円)
前連結会計年度
(自 2024年4月1日
至 2025年3月31日)
財務活動によるキャッシュ・フロー
短期借入れによる収入
短期借入金の返済による支出
長期借入れによる収入
長期借入金の返済による支出
自己株式の取得による支出
配当金の支払額
その他
財務活動によるキャッシュ・フロー
現金及び現金同等物に係る換算差額
現金及び現金同等物の増減額(△は減少)
現金及び現金同等物の期首残高
294,871
△302,031
32,145
△5,101
△0
△873
△197
18,813
△4
△1,055
6,160
※1 5,105
現金及び現金同等物の期末残高
53/116
当連結会計年度
(自 2025年4月1日
至 2026年3月31日)
317,557
△309,713
700
△7,082
△0
−
△9
1,450
6
1,282
5,105
※1 6,388
EDINET提出書類
日本コークス工業株式会社(E00030)
有価証券報告書
【注記事項】
(連結財務諸表作成のための基本となる重要な事項)
1.連結の範囲に関する事項
(1)連結子会社
連結子会社の数 6社
主要な連結子会社の名称
主要な連結子会社は、「第1 企業の概況
る。
4.関係会社の状況」に記載しているため、省略してい
(2)主要な非連結子会社の名称
NCE USA INC.、MM RESOURCES PTY.
(連結の範囲から除いた理由)
NCE USA INC.、MM RESOURCES PTY.については、その総資産、売上高、当期純損益(持分に見合う額)
および利益剰余金(持分に見合う額)等は、いずれも僅少であり、いずれも連結財務諸表に重要な影響を
及ぼしておらず、将来においても連結企業集団に与える影響が増すとも考えられないため、連結の範囲に
含めないこととしている。
2.会計方針に関する事項
(1)重要な資産の評価基準及び評価方法
(イ)有価証券
その他有価証券
市場価格のない株式等以外のもの
連結決算日の市場価格等に基づく時価法
(評価差額は、全部純資産直入法により処理し、売却原価は移動平均法により算定)
市場価格のない株式等
移動平均法に基づく原価法
(ロ)デリバティブ
時価法
(ハ)棚卸資産
主として総平均法による原価法(貸借対照表価額は収益性の低下に基づく簿価切下げの方法により算
定)を採用している。
54/116
EDINET提出書類
日本コークス工業株式会社(E00030)
有価証券報告書
(2)重要な減価償却資産の減価償却の方法
(イ)有形固定資産(リース資産を除く)
当社および国内連結子会社は定額法を採用している。
また、取得価額が10万円以上20万円未満の減価償却資産については、3年均等償却としている。
なお主な耐用年数は次のとおり。
建物及び構築物
10〜50年
機械装置及び運搬具 5〜16年
(ロ)無形固定資産(リース資産を除く)
鉱業権は生産高比例法、それ以外の無形固定資産については定額法によっている。
なお、自社利用のソフトウエアについては、社内における見込利用可能期間(5年)に基づく定額法
によっている。
(ハ)リース資産
リース期間を耐用年数とし、残存価額を零とする定額法を採用している。
なお、所有権移転外ファイナンス・リース取引のうち、個々のリース資産に重要性が乏しいと認めら
れるリース取引については、通常の賃貸借取引に係る方法に準じた会計処理によっている。
(3)重要な引当金の計上基準
(イ)貸倒引当金
当社および国内連結子会社は、売上債権等の貸倒損失に備えるため、一般債権については貸倒実績率
により、貸倒懸念債権等特定の債権については個別に回収可能性を検討して回収不能見込額を計上して
いる。
(ロ)賞与引当金
従業員の賞与支給に充てるため、支給見込額を計上している。
(ハ)役員退職慰労引当金
国内連結子会社は、役員等の退職慰労金の支出に備えるため、役員退職慰労金規程に基づく連結会計
年度末要支給額を計上している。
(ニ)関係会社整理損失引当金
関係会社の整理により、当社が将来負担することとなり、かつ、合理的に見積もることが可能なもの
については、当該損失見込額を計上している。
(ホ)環境対策引当金
当社が関係会社より承継した閉山坑の環境整備費用の支出に備えるため、当該費用の見込額を計上し
ている。
(ヘ)受注損失引当金
受注契約に係る将来の損失に備えるため、当連結会計年度末時点で将来の損失が確実に見込まれ、か
つ、当該損失額を合理的に見積もることが可能なものについては、将来の損失見込額を計上している。
(4)退職給付に係る会計処理の方法
(イ)退職給付見込額の期間帰属方法
退職給付の算定にあたり、退職給付見込額を当連結会計年度末までの期間に帰属させる方法について
は、給付算定式基準によっている。
(ロ)数理計算上の差異の費用処理方法
数理計算上の差異は、各連結会計年度の発生時における従業員の平均残存勤務期間(主として13年)
による定額法により按分した額をそれぞれ発生の翌連結会計年度から費用処理している。
55/116
EDINET提出書類
日本コークス工業株式会社(E00030)
有価証券報告書
(5)重要な収益及び費用の計上基準
当社及び連結子会社の顧客との契約から生じる収益に関する主要な事業における主な履行義務の内容及
び当該履行義務を充足する通常の時点は以下の通りである。
コークス事業
当社北九州事業所で生産するコークスおよび副産物を国内外鉄鋼会社等に販売しており、コークス製品
の納入時点等で履行義務が充足されたと判断し、その時点において収益を認識している。
燃料・資源リサイクル事業
海外から輸入した一般炭および石油コークスを販売している他、コールセンター事業や石炭灰・汚泥等
の産業廃棄物の処理を行っている。
石炭製品の納入時点等で履行義務が充足されたと判断し、その時点において収益を認識している。
なお、石炭灰等の処理に関する仲介取引については、収益認識基準における「代理人取引」に該当する
ものとして、売上と売上原価および販売直接費を相殺して表示することとしている。
総合エンジニアリング事業
当社栃木工場で設計・製造する粉粒体装置・機器等を販売している他、産業機械等の製造・修理等を
行っている。
なお、工事契約に関して、少額且つごく短期な工事については、完全に履行義務を充足した時点で収益
を認識し、その他の工事については、履行義務を充足するにつれて、一定の期間にわたり収益を認識して
いる。
その他
福岡県大牟田地区を中心に港湾荷役および貨物輸送などを行っている。
なお、運輸荷役事業における代理人取引による収益について、収益認識基準における「代理人取引」に
該当するものとして、売上と売上原価を相殺して表示することとしている。
(6)重要な外貨建の資産又は負債の本邦通貨への換算基準
外貨建金銭債権債務は、連結決算日の直物為替相場により円貨に換算し、換算差額は損益として処理し
ている。
(7)重要なヘッジ会計の方法
(イ)ヘッジ会計の方法
為替予約取引および金利スワップ取引については、繰延ヘッジ処理によっている。ただし、為替予約
等が付されている外貨建金銭債権債務等は振当処理を、特例処理の要件を満たす金利スワップ取引につ
いては、特例処理を採用している。
(ロ)ヘッジ手段とヘッジ対象
ヘッジ手段…為替予約取引、金利スワップ取引
ヘッジ対象…外貨建金銭債権債務、外貨建予定取引、借入金の支払金利
(ハ)ヘッジ方針
外貨建取引に係る将来の為替変動によるリスク回避および金利変動による金融負債の損失可能性を減
殺する目的で行っている。
(ニ)ヘッジ有効性評価の方法
ヘッジ対象の変動額の累計とヘッジ手段の変動額の累計を比較することにより有効性を判定してい
る。
ただし、為替予約取引等においては、外貨建による同一金額で同一期日の為替予約等を振り当ててお
り、その後の為替変動による相関関係が確保されているため、その判定をもって有効性の判定としてい
る。
特例処理の要件を満たす金利スワップ取引については、その判定をもって有効性の判定としている。
(8)連結キャッシュ・フロー計算書における資金の範囲
手許現金、随時引き出し可能な預金および容易に換金可能であり、かつ、価値の変動について僅少なリ
スクしか負わない取得日から3ヶ月以内に償還期限の到来する短期投資からなっている。
56/116
EDINET提出書類
日本コークス工業株式会社(E00030)
有価証券報告書
(重要な会計上の見積り)
固定資産の減損
(1) 当連結会計年度の連結財務諸表に計上した金額
(百万円)
前連結会計年度
親会社コークス事業に係る
資産グループの固定資産
57,209
当連結会計年度
53,262
(2) 識別した項目に係る重要な会計上の見積りの内容に関する情報
当社グループは、キャッシュ・フローを生み出す最小単位として、管理会計上の区分を基準とした資産のグ
ルーピングを行っている。コークス事業に係る資産グループの固定資産53,262百万円について、全社費用配賦
後コークス事業営業利益が2期連続営業赤字であるため減損の兆候があると判断したが、減損損失の認識の判
定において、当該資産グループから得られる割引前将来キャッシュ・フローの総額がその帳簿価額を上回って
いたことから、減損損失を認識していない。資産グループの継続的使用によって生じる将来キャッシュ・フ
ローの見積りは、取締役会によって承認された計画と、計画が策定されている期間を超えている期間について
は過去の趨勢に基づき算定している。なお、2025年11月取締役会で2炉団体制への移行に伴い廃止を決定した
固定資産については、コークス事業と異なる独立した資産グループに区分し、減損損失4,334百万円を計上し
ている。
割引前将来キャッシュ・フロー総額の算定に用いた主要な仮定は、コークス事業における販売数量及び販売
価格である。
翌連結会計年度において、コークスや原料炭の市況動向・需給状況により、見積りの基礎の実績値が仮定と
大幅に異なる場合、将来の損益に影響を与える可能性がある。
(会計方針の変更)
該当事項はない。
57/116
EDINET提出書類
日本コークス工業株式会社(E00030)
有価証券報告書
(未適用の会計基準等)
リースに関する会計基準等
・「リースに関する会計基準」(企業会計基準第34号
2024年9月13日企業会計基準委員会)
・「リースに関する会計基準の適用指針」(企業会計基準適用指針第33号
2024年9月13日企業会計基準委
員会)等
(1)概要
企業会計基準委員会において、日本基準を国際的に整合性のあるものとする取組みの一環として、借手の
全てのリースについて資産及び負債を認識するリースに関する会計基準の開発に向けて、国際的な会計基準
を踏まえた検討が行われ、基本的な方針として、IFRS第16号の単一の会計処理モデルを基礎とするものの、
IFRS第16号の全ての定めを採り入れるのではなく、主要な定めのみを採り入れることにより、簡素で利便性
が高く、かつ、IFRS第16号の定めを個別財務諸表に用いても、基本的に修正が不要となることを目指した
リース会計基準等が公表された。
借手の会計処理として、借手のリースの費用配分の方法については、IFRS第16号と同様に、リースがファ
イナンス・リースであるかオペレーティング・リースであるかにかかわらず、全てのリースについて使用権
資産に係る減価償却費及びリース負債に係る利息相当額を計上する単一の会計処理モデルが適用される。
(2)適用予定日
2028年3月期の期首から適用する。
(3)当該会計基準等の適用による影響
「リースに関する会計基準」等の適用による連結財務諸表に与える影響額については、現時点で評価中で
ある。
後発事象に関する会計基準等
・「後発事象に関する会計基準」(企業会計基準第41号
2026年1月9日企業会計基準委員会)
・「後発事象に関する会計基準の適用指針」(企業会計基準適用指針第35号
2026年1月9日企業会計基準
委員会)
(1)概要
「後発事象に関する会計基準」等は、後発事象の定義、会計処理及び開示等を取り扱う包括的な会計基準
を設定することを優先的な課題とし、日本公認会計士協会監査・保証基準委員会監査基準報告書560実
務指針第1号「後発事象に関する監査上の取扱い」で示されている会計に関する内容を原則として踏襲して
企業会計基準委員会に移管することを基本的な方針として、表現の見直し及び後発事象の評価期間の整理を
行うとともに、財務諸表の公表の承認に関する注記を新たに求める等、後発事象に関する会計処理及び開示
について定めたものである。
(2)適用予定日
2028年3月期の期首から適用する。
58/116
EDINET提出書類
日本コークス工業株式会社(E00030)
有価証券報告書
(表示方法の変更)
(連結損益計算書)
1.陸上運賃
前連結会計年度において、「販売費及び一般管理費」の「その他」に含めていた「陸上運賃」は、「販売
費及び一般管理費」の総額の100分の10を超えたため、当連結会計年度より独立掲記することとした。この
表示方法の変更を反映させるため、前連結会計年度の連結財務諸表の組替えを行っている。
この結果、前連結会計年度の連結損益計算書において、「販売費及び一般管理費」の「その他」に表示し
ていた2,770百万円は、「陸上運賃」610百万円、「その他」2,159百万円として組み替えている。
2.固定資産賃貸料
固定資産賃貸料(前連結会計年度18百万円)は、前連結会計年度において、連結損益計算書上、営業外収
益に区分掲記して表示していたが、重要性が乏しくなったため、当連結会計年度より、営業外収益の「その
他」に含めて表示している。この表示方法の変更を反映させるため、前連結会計年度の連結損益計算書の組
替えを行っている。
3.助成金収入
前連結会計年度において、「営業外収益」の「その他」に含めていた「助成金収入」は、「営業外収益」
の総額の100分の10を超えたため、当連結会計年度より独立掲記することとした。この表示方法の変更を反
映させるため、前連結会計年度の連結財務諸表の組替えを行っている。
この結果、前連結会計年度の連結損益計算書において、「営業外収益」の「その他」に表示していた33百
万円は、「助成金収入」5百万円、「その他」27百万円として組み替えている。
4.為替差損
為替差損(前連結会計年度211百万円)は、前連結会計年度において、連結損益計算書上、営業外費用に
区分掲記して表示していたが、重要性が乏しくなったため、当連結会計年度より、営業外費用の「その他」
に含めて表示している。この表示方法の変更を反映させるため、前連結会計年度の連結損益計算書の組替え
を行っている。
5.借入関係費用
借入関係費用(前連結会計年度181百万円)は、前連結会計年度において、連結損益計算書上、営業外費
用に区分掲記して表示していたが、重要性が乏しくなったため、当連結会計年度より、営業外費用の「その
他」に含めて表示している。この表示方法の変更を反映させるため、前連結会計年度の連結損益計算書の組
替えを行っている。
(連結キャッシュ・フロー計算書)
借入関係費用(前連結会計年度181百万円)は、前連結会計年度において、連結キャッシュ・フロー計算書
上、営業活動によるキャッシュ・フローに区分掲記して表示していたが、重要性が乏しくなったため、当連結
会計年度より、営業活動によるキャッシュ・フローの「その他」に含めて表示している。この表示方法の変更
を反映させるため、前連結会計年度の連結キャッシュ・フロー計算書の組替えを行っている。
(追加情報)
該当事項はない。
59/116
EDINET提出書類
日本コークス工業株式会社(E00030)
有価証券報告書
(連結貸借対照表関係)
※1.非連結子会社及び関連会社に対するものは、次のとおりである。
前連結会計年度
(2025年3月31日)
投資有価証券(株式)
154百万円
当連結会計年度
(2026年3月31日)
164百万円
2.当座貸越契約及び貸出コミットメント
当社および連結子会社3社は運転資金および設備資金の効率的な調達を行うため取引銀行17行と当座貸越契約
および貸出コミットメント契約を締結している。
上記契約に基づく当連結会計年度末における借入未実行残高は次のとおりである。
前連結会計年度
(2025年3月31日)
当座貸越極度額及び貸出コミットメントの
総額
借入実行残高
差引額
当連結会計年度
(2026年3月31日)
50,800百万円
50,750百万円
25,890
33,734
24,909
17,016
3.財務制限条項
前連結会計年度(2025年3月31日)
短期借入金のうち22,890百万円(貸出コミットメント契約に基づく借入実行残高)および長期借入金のうち
39,730百万円(一年内返済の長期借入金を含む)には、以下の財務制限条項が付されている。
(1)純資産維持
①短期借入金
連結決算および個別決算において、本決算期の純資産の金額を2018年3月期または直前期のいずれか高い
方の70%以上とすること。
②長期借入金(2019年3月契約分3,000百万円)
連結決算および個別決算において、本決算期の純資産の金額を2018年3月期または直前期のいずれか高い
方の70%以上とすること。
③長期借入金(2022年5月契約分12,544百万円)
連結決算および個別決算において、本決算期の純資産の金額を2021年3月期または直前期のいずれか高い
方の70%以上とすること。
④長期借入金(2024年9月契約分24,186百万円)
連結決算および個別決算において、本決算期の純資産の金額を2024年3月期または直前期のいずれか高い
方の70%以上とすること。
(2)利益維持
連結決算および個別決算において、本決算の営業損益を二期連続マイナスとしないこと。
60/116
EDINET提出書類
日本コークス工業株式会社(E00030)
有価証券報告書
当連結会計年度(2026年3月31日)
短期借入金のうち24,304百万円(貸出コミットメント契約に基づく借入実行残高)および長期借入金のうち
32,790百万円(一年内返済の長期借入金を含む)には、以下の財務制限条項が付されている。
(1)純資産維持
①短期借入金
連結決算および個別決算において、本決算期の純資産の金額を2018年3月期または直前期のいずれか高い
方の70%以上とすること。
②長期借入金(2022年5月契約分10,032百万円)
連結決算および個別決算において、本決算期の純資産の金額を2021年3月期または直前期のいずれか高い
方の70%以上とすること。
③長期借入金(2024年9月契約分22,758百万円)
連結決算および個別決算において、本決算期の純資産の金額を2024年3月期または直前期のいずれか高い
方の70%以上とすること。
(2)利益維持
連結決算および個別決算において、本決算の営業損益を二期連続マイナスとしないこと。
財務制限条項について、2026年4月24日付および2026年4月30日付で財務上の特約の内容を変更している。
(1)純資産維持
連結決算および個別決算において、本決算期の純資産の金額を2026年3月期の80%以上とする。
(2)利益維持
連結決算および個別決算において、本決算の営業損益を二期連続マイナスとしないこと。
61/116
EDINET提出書類
日本コークス工業株式会社(E00030)
有価証券報告書
(連結損益計算書関係)
※1.顧客との契約から生じる収益
売上高については、顧客との契約から生じる収益及びそれ以外の収益を区分して記載していない。
顧客との契約から生じる収益の金額は、連結財務諸表「注記事項(収益認識関係)1.顧客との契約から生じる収
益を分解した情報」に記載している。
※2.固定資産売却益の内訳は、次のとおりである。
前連結会計年度
2024年4月1日
2025年3月31日)
当連結会計年度
2025年4月1日
2026年3月31日)
(自
至
(自
至
土地売却益
23百万円
土地売却益
その他売却益
9
その他売却益
計
32
122百万円
5
計
128
※3.固定資産除却損の内訳は、次のとおりである。
前連結会計年度
2024年4月1日
2025年3月31日)
当連結会計年度
2025年4月1日
2026年3月31日)
(自
至
建物及び構築物除却損
機械装置及び運搬具除却損
その他除却損
(自
至
32百万円
668
18
計
建物及び構築物除却損
機械装置及び運搬具除却損
その他除却損
719
計
35百万円
1,051
7
1,094
※4.減損損失
前連結会計年度(自 2024年4月1日至 2025年3月31日)
重要性が乏しいため、記載を省略している。
当連結会計年度(自
用途
コークス事業用資産
2025年4月1日
至
2026年3月31日)
場所
福岡県北九州市
燃料販売事業用資産
北海道美唄市
その他の資産
福岡県大牟田市
種類
減損損失(百万円)
建物及び構築物
機械装置及び運搬具
建設仮勘定
その他
55
4,095
174
9
合計
4,334
機械装置及び運搬具
その他
3
24
合計
28
土地
74
合計
4,436
当社グループは、セグメントを基礎に、主として継続的に収支の把握を行っている管理会計上の区分を単位として資産
をグルーピングしている。また、非事業用資産については、個々の資産単位で区分している。
コークス事業用資産については、コークス生産体制最適化による2炉団体制への移行に伴い廃止を決議した固定資産の
帳簿価額を備忘価額まで減額し、当該減少額を減損損失として特別損失に計上している。
燃料販売事業用資産については、当社連結子会社である三美鉱業株式会社が石炭採掘事業から撤退することによる炭鉱
閉山に伴い、使用する見込みのなくなった固定資産及び時価が著しく下落した資産の帳簿価額を備忘価額又は回収可能価
額まで減額し、当該減少額を減損損失として特別損失に計上している。回収可能価額は、正味売却価額により測定してお
り、不動産鑑定評価額又は固定資産税評価額を合理的に調整した価格により算定している。
その他の資産については、時価が著しく下落した資産の帳簿価額を回収可能価額まで減額し、当該減少額を減損損失と
して特別損失に計上している。回収可能価額は、正味売却価額により測定しており、不動産鑑定評価額又は固定資産税評
価額を合理的に調整した価格により算定している。
62/116
EDINET提出書類
日本コークス工業株式会社(E00030)
有価証券報告書
※5.棚卸資産廃棄損
前連結会計年度(自
該当事項はない。
当連結会計年度(自
用途
コークス事業用資産
2024年4月1日
至
2025年3月31日)
2025年4月1日
至 2026年3月31日)
場所
福岡県北九州市
種類
棚卸資産廃棄損の額
貯蔵品他
253百万円
合計
253百万円
コークス事業用資産については、コークス生産体制最適化による2炉団体制への移行に伴い使用する見込みのなくなっ
た棚卸資産を備忘価額まで減額し、当該減少額を棚卸資産廃棄損として特別損失に計上している。
※6.一般管理費に含まれる研究開発費の総額
前連結会計年度
(自 2024年4月1日
至 2025年3月31日)
当連結会計年度
(自 2025年4月1日
至 2026年3月31日)
99百万円
201百万円
※7.期末棚卸高は収益性の低下に伴う簿価切下後の金額であり、次の棚卸資産評価損が売上原価に含まれている。
前連結会計年度
2024年4月1日
2025年3月31日)
当連結会計年度
2025年4月1日
2026年3月31日)
(自
至
(自
至
2,690百万円
4百万円
※8.売上原価に含まれている受注損失引当金繰入額
前連結会計年度
2024年4月1日
2025年3月31日)
当連結会計年度
2025年4月1日
2026年3月31日)
(自
至
(自
至
391百万円
△211百万円
※9.災害による損失
前連結会計年度(自 2024年4月1日至 2025年3月31日)
2024年12月に親会社日本コークス工業株式会社北九州事業所で発生した火災による損失を特別損失に計上している。
当連結会計年度(自 2025年4月1日至 2026年3月31日)
2025年12月に親会社日本コークス工業株式会社北九州事業所で発生した火災による損失等を特別損失に計上してい
る。
63/116
EDINET提出書類
日本コークス工業株式会社(E00030)
有価証券報告書
(連結包括利益計算書関係)
※1.その他の包括利益に係る組替調整額
前連結会計年度
(自 2024年4月1日
至 2025年3月31日)
当連結会計年度
2025年4月1日
2026年3月31日)
(自
至
その他有価証券評価差額金:
当期発生額
組替調整額
86百万円
−
572百万円
△75
計
86
496
10
△8
△17
15
2
△1
△13
41
493
43
28
536
118
△92
1,031
△155
26
876
繰延ヘッジ損益:
当期発生額
組替調整額
計
退職給付に係る調整額:
当期発生額
組替調整額
計
法人税等及び税効果調整前合計
法人税等及び税効果額
その他の包括利益合計
※2.その他の包括利益に関する法人税等及び税効果額
前連結会計年度
(自 2024年4月1日
至 2025年3月31日)
当連結会計年度
2025年4月1日
2026年3月31日)
(自
至
その他有価証券評価差額金:
法人税等及び税効果調整前
法人税等及び税効果額
86百万円
△30
法人税等及び税効果調整後
496百万円
△155
56
340
法人税等及び税効果調整前
法人税等及び税効果額
2
△0
△1
0
法人税等及び税効果調整後
1
△1
法人税等及び税効果調整前
法人税等及び税効果額
28
△60
536
−
法人税等及び税効果調整後
△32
536
法人税等及び税効果調整前
法人税等及び税効果額
118
△92
1,031
△155
法人税等及び税効果調整後
26
876
繰延ヘッジ損益:
退職給付に係る調整額:
その他の包括利益合計
64/116
EDINET提出書類
日本コークス工業株式会社(E00030)
有価証券報告書
(連結株主資本等変動計算書関係)
前連結会計年度(自2024年4月1日至2025年3月31日)
1.発行済株式の種類及び総数ならびに自己株式の種類及び株式数に関する事項
当連結会計年度期
首株式数(千株)
当連結会計年度増
加株式数(千株)
当連結会計年度減
少株式数(千株)
当連結会計年度末
株式数(千株)
302,349
−
−
302,349
11,324
1
−
11,325
基準日
効力発生日
2024年3月31日
2024年6月28日
発行済株式
普通株式
自己株式
普通株式(注)
(注)普通株式の増加は、単元未満株式の買取りによる増加1千株によるものである。
2.配当に関する事項
(1)配当金支払額
株式の種類
配当金の総額
(百万円)
配当の原資
1株当たり
配当額
(円)
普通株式
873
利益剰余金
3.00
(決議)
2024年6月27日
定時株主総会
(2)基準日が当連結会計年度に属する配当のうち、配当の効力発生日が翌連結会計年度となるもの
該当事項はない。
当連結会計年度(自2025年4月1日至2026年3月31日)
1.発行済株式の種類及び総数ならびに自己株式の種類及び株式数に関する事項
当連結会計年度期
首株式数(千株)
当連結会計年度増
加株式数(千株)
当連結会計年度減
少株式数(千株)
当連結会計年度末
株式数(千株)
302,349
−
−
302,349
11,325
0
−
11,326
発行済株式
普通株式
自己株式
普通株式(注)
(注)普通株式の増加は、単元未満株式の買取りによる増加0千株によるものである。
2.配当に関する事項
(1)配当金支払額
該当事項はない。
(2)基準日が当連結会計年度に属する配当のうち、配当の効力発生日が翌連結会計年度となるもの
該当事項はない。
65/116
EDINET提出書類
日本コークス工業株式会社(E00030)
有価証券報告書
(連結キャッシュ・フロー計算書関係)
※1.現金及び現金同等物の期末残高と連結貸借対照表に掲記されている科目の金額との関係
前連結会計年度
2024年4月1日
2025年3月31日)
(自
至
現金及び預金勘定
5,109百万円
預入期間が3か月を超える定期預金
現金及び現金同等物
66/116
当連結会計年度
2025年4月1日
2026年3月31日)
(自
至
6,392百万円
△4
△4
5,105
6,388
EDINET提出書類
日本コークス工業株式会社(E00030)
有価証券報告書
(金融商品関係)
1.金融商品の状況に関する事項
(1)金融商品に対する取組方針
当社グループは、設備投資計画等に照らして、必要な資金(主に銀行借入)を調達している。一時的
な余資は主に流動性の高い金融資産で運用し、また、短期的な運転資金を銀行借入により調達してい
る。デリバティブは、後述するリスクを回避するために利用しており、投機的な取引は行わない方針で
ある。
(2)金融商品の内容及びリスク
営業債権である受取手形及び売掛金は、顧客の信用リスクおよび為替リスクに晒されている。
投資有価証券は、純投資目的で保有する株式であり、市場価格の変動リスクに晒されている。
営業債務である支払手形及び買掛金は、そのほとんどが3ヶ月以内の支払期日である。一部外貨建て
のものについては、為替の変動リスクに晒されているが、為替予約を利用してヘッジしている。
借入金は、主に設備投資に係る資金調達を目的としたものであり、償還日は最長で決算日後7年以内
である。このうち一部は、金利の変動リスクに晒されているが、デリバティブ取引(金利スワップ取
引)を利用してヘッジしている。
デリバティブ取引は、外貨建ての営業債権債務に係る為替の変動リスクに対するヘッジを目的とした
為替予約取引、借入金に係る支払金利の変動リスクに対するヘッジを目的とした金利スワップ取引であ
る。なお、ヘッジ会計に関するヘッジ手段とヘッジ対象、ヘッジ方針、ヘッジの有効性の評価方法等に
ついては、前述の連結財務諸表作成のための基本となる重要な事項「2.会計方針に関する事項(7)重
要なヘッジ会計の方法」に記載している。
(3)金融商品に係るリスク管理体制
①信用リスク(取引先の契約不履行等に係るリスク)の管理
当社は、与信管理規程に従い、営業債権および長期貸付金について、各事業部門が主要な取引先の状
況を定期的にモニタリングし、取引先ごとに期日および残高を管理するとともに、財務状況等の悪化等
による回収懸念の早期把握や軽減を図っている。連結子会社についても、当社の与信管理規程に準じ
て、同様の管理を行っている。
デリバティブ取引については、取引先を信用度の高い金融機関に限定しているため、信用リスクはほ
とんどないと認識している。
②市場リスク(為替や金利変動等の変動リスク)の管理
当社の外貨建ての営業債権債務の大部分は、資金決済期間が1ヶ月以内の外貨建てのコークスの販売
とコークス原料用石炭の輸入取引によるものであり、ほぼバランスしているが、一部に資金決済までに
数ヶ月を要する外貨建て営業債権債務があり、その為替変動リスクに対しては、原則として為替予約を
利用してヘッジしている。また、当社は、借入金に係る支払金利の変動リスクを抑制するために、金利
スワップ取引を利用している。
投資有価証券については、定期的に時価や発行体(取引先企業)の財務状況等を把握し、また、市況
や取引先企業との関係を勘案して保有状況を継続的に見直している。
デリバティブ取引の執行・管理については、担当部所が決裁担当者の承認を得て行っている。
③資金調達に係る流動性リスク(支払期日に支払いを実行できなくなるリスク)の管理
当社および連結子会社は、各部所からの報告に基づき担当部所が適時に資金繰計画を作成・更新する
とともに、手許流動性の維持などにより流動性リスクを管理している。
(4)金融商品の時価等に関する事項についての補足説明
金融商品の時価の算定においては変動要因を織り込んでいるため、異なる前提条件等を採用すること
により、当該価額が変動することがある。また、注記事項「デリバティブ取引関係」におけるデリバ
ティブ取引に関する契約額等については、その金額自体がデリバティブ取引に係る市場リスクを示すも
のではない。
67/116
EDINET提出書類
日本コークス工業株式会社(E00030)
有価証券報告書
2.金融商品の時価等に関する事項
連結貸借対照表計上額、時価及びこれらの差額については、次のとおりである。
前連結会計年度(2025年3月31日)
連結貸借対照表計上額
(百万円)
投資有価証券(*2)
負債計
差額(百万円)
948
948
−
948
948
−
39,926
39,684
△241
39,926
39,684
△241
0
0
−
資産計
長期借入金(*3)
時価(百万円)
デリバティブ取引(*4)
(*1)現金及び預金、受取手形、売掛金、支払手形及び買掛金並びに短期借入金については、現金であること、
および短期間で決済されるため時価が帳簿価額に近似するものであることから、記載を省略している。
(*2)市場価格のない株式等は、「投資有価証券」には含まれていない。
当該金融商品は非上場株式であり、連結貸借対照表価額は343百万円である。
(*3)1年以内に返済予定の長期借入金は、長期借入金に含めて記載している。
(*4)デリバティブ取引によって生じた正味の債権・債務は純額で表示している。
当連結会計年度(2026年3月31日)
連結貸借対照表計上額
(百万円)
投資有価証券(*2)
資産計
長期借入金(*3)
負債計
デリバティブ取引(*4)
時価(百万円)
差額(百万円)
1,404
1,404
−
1,404
1,404
−
33,543
32,940
△602
33,543
32,940
△602
△0
△0
−
(*1)現金及び預金、受取手形、売掛金、支払手形及び買掛金並びに短期借入金については、現金であること、
および短期間で決済されるため時価が帳簿価額に近似するものであることから、記載を省略している。
(*2)市場価格のない株式等は、「投資有価証券」には含まれていない。
当該金融商品は非上場株式であり、連結貸借対照表価額は353百万円である。
(*3)1年以内に返済予定の長期借入金は、長期借入金に含めて記載している。
(*4)デリバティブ取引によって生じた正味の債権・債務は純額で表示している。
68/116
EDINET提出書類
日本コークス工業株式会社(E00030)
有価証券報告書
(注)1.金銭債権の連結決算日後の償還予定額
前連結会計年度(2025年3月31日)
1年超
5年以内
(百万円)
1年以内
(百万円)
現金及び預金
10年超
(百万円)
5,109
−
−
−
949
−
−
−
10,865
−
−
−
受取手形
売掛金
5年超
10年以内
(百万円)
当連結会計年度(2026年3月31日)
1年超
5年以内
(百万円)
1年以内
(百万円)
現金及び預金
5年超
10年以内
(百万円)
10年超
(百万円)
6,392
−
−
−
受取手形
163
−
−
−
売掛金
9,118
−
−
−
2.長期借入金の連結決算日後の返済予定額
前連結会計年度(2025年3月31日)
1年以内
(百万円)
1年超
2年以内
(百万円)
2年超
3年以内
(百万円)
3年超
4年以内
(百万円)
4年超
5年以内
(百万円)
5年超
(百万円)
短期借入金
25,890
−
−
−
−
−
長期借入金
7,038
4,020
3,955
13,939
8,825
2,146
32,929
4,020
3,955
13,939
8,825
2,146
1年以内
(百万円)
1年超
2年以内
(百万円)
2年超
3年以内
(百万円)
3年超
4年以内
(百万円)
4年超
5年以内
(百万円)
5年超
(百万円)
33,734
4,152
−
4,087
−
14,063
−
8,957
−
1,528
−
753
37,886
4,087
14,063
8,957
1,528
753
合計
当連結会計年度(2026年3月31日)
短期借入金
長期借入金
合計
69/116
EDINET提出書類
日本コークス工業株式会社(E00030)
有価証券報告書
3.金融商品の時価のレベルごとの内訳等に関する事項
金融商品の時価を、時価の算定に係るインプットの観察可能性及び重要性に応じて、以下の3つのレベル
に分類している。
レベル1の時価:観察可能な時価の算定に係るインプットのうち、活発な市場において形成される当該時
価の算定の対象となる資産又は負債に関する相場価格により算定した時価
レベル2の時価:観察可能な時価の算定に係るインプットのうち、レベル1のインプット以外の時価の算
定に係るインプットを用いて算定した時価
レベル3の時価:観察できない時価の算定に係るインプットを使用して算定した時価
時価の算定に重要な影響を与えるインプットを複数使用している場合には、それらのインプットがそれぞ
れ属するレベルのうち、時価の算定における優先順位が最も低いレベルに時価を分類している。
(1)時価で連結貸借対照表に計上している金融商品
前連結会計年度(2025年3月31日)
時価(百万円)
区分
レベル1
レベル2
合計
レベル3
投資有価証券
その他有価証券
株式
948
−
−
948
金利関連
−
−
−
−
通貨関連
−
0
−
0
948
0
−
949
デリバティブ関連
資産計
当連結会計年度(2026年3月31日)
時価(百万円)
区分
レベル1
レベル2
合計
レベル3
投資有価証券
その他有価証券
株式
資産計
1,404
−
−
1,404
1,404
−
−
1,404
−
−
−
−
−
0
−
0
−
0
−
0
デリバティブ関連
金利関連
通貨関連
負債計
70/116
EDINET提出書類
日本コークス工業株式会社(E00030)
有価証券報告書
(2)時価で連結貸借対照表に計上している金融商品以外の金融商品
前連結会計年度(2025年3月31日)
時価(百万円)
区分
レベル1
レベル2
合計
レベル3
デリバティブ関連
通貨関連
−
−
−
−
−
−
−
−
通貨関連
−
−
−
−
長期借入金
−
39,684
−
39,684
−
39,684
−
39,684
資産計
デリバティブ関連
負債計
当連結会計年度(2026年3月31日)
時価(百万円)
区分
レベル1
レベル2
合計
レベル3
デリバティブ関連
通貨関連
−
−
−
−
−
−
−
−
通貨関連
−
−
−
−
長期借入金
−
32,940
−
32,940
−
32,940
−
32,940
資産計
デリバティブ関連
負債計
(注)時価の算定に用いた評価技法及び時価の算定に係るインプットの説明
投資有価証券
上場株式は相場価格を用いて評価している。上場株式は活発な市場で取引されているため、その時
価をレベル1の時価に分類している。
デリバティブ取引
金利スワップの特例処理によるものは、ヘッジ対象とされている長期借入金と一体として処理され
ているため、その時価は、当該長期借入金の時価に含めて記載している。
為替予約の時価については、取引先金融機関から提示された価格に基づいて算定しており、レベル
2の時価に分類している。
長期借入金
長期借入金の時価については、元利金の合計額を市場金利に当社のスプレッドを加味した利率で割
り引いて算定する方法によっており、その時価をレベル2の時価に分類している。なお、変動金利に
よる長期借入金は金利スワップの特例処理の対象とされており、当該金利スワップと一体として処理
された元利金の合計額を、市場金利に当社のスプレッドを加味した利率で割り引いて算定する方法に
よっている。
71/116
EDINET提出書類
日本コークス工業株式会社(E00030)
有価証券報告書
(有価証券関係)
1.その他有価証券
前連結会計年度(2025年3月31日)
連結貸借対照表
計上額(百万円)
取得原価(百万円)
差額(百万円)
株式
944
321
622
債券
−
−
−
その他
−
−
−
944
321
622
株式
4
5
△1
債券
−
−
−
その他
−
−
−
4
5
△1
948
327
621
種類
連結貸借対照表計上
額が取得原価を超え
るもの
小計
連結貸借対照表計上
額が取得原価を超え
ないもの
小計
合計
(注)1.市場価格のない株式等は、上表の「その他有価証券」には含めていない。
当該金融商品は非上場株式であり、連結貸借対照表価額は343百万円である。
2.減損処理の基準………連結会計年度末における時価が取得原価に比べ50%以上下落している株式について
はすべて、また、連結会計年度末における時価が30%〜50%下落している株式につ
いては、個々の銘柄の回復可能性を判定して減損処理を行っている。
当連結会計年度(2026年3月31日)
連結貸借対照表
計上額(百万円)
取得原価(百万円)
差額(百万円)
株式
1,399
279
1,119
債券
−
−
−
その他
−
−
−
1,399
279
1,119
株式
4
6
△1
債券
−
−
−
その他
−
−
−
4
6
△1
1,404
285
1,118
種類
連結貸借対照表計上
額が取得原価を超え
るもの
小計
連結貸借対照表計上
額が取得原価を超え
ないもの
小計
合計
(注)1.市場価格のない株式等は、上表の「その他有価証券」には含めていない。
当該金融商品は非上場株式であり、連結貸借対照表価額は353百万円である。
2.減損処理の基準………連結会計年度末における時価が取得原価に比べ50%以上下落している株式について
はすべて、また、連結会計年度末における時価が30%〜50%下落している株式につ
いては、個々の銘柄の回復可能性を判定して減損処理を行っている。
72/116
EDINET提出書類
日本コークス工業株式会社(E00030)
有価証券報告書
2.売却したその他有価証券
前連結会計年度(自2024年4月1日
該当事項はない。
至2025年3月31日)
当連結会計年度(自2025年4月1日
至2026年3月31日)
種類
売却益の合計額
(百万円)
売却額(百万円)
(1)株式
(2)債権
(3)その他
合計
3.保有目的を変更した有価証券
前連結会計年度(自2024年4月1日
該当事項はない。
当連結会計年度(自2025年4月1日
該当事項はない。
4.減損処理を行った有価証券
前連結会計年度(自2024年4月1日
該当事項はない。
当連結会計年度(自2025年4月1日
該当事項はない。
売却損の合計額
(百万円)
117
−
−
75
−
−
−
−
−
117
75
−
至2025年3月31日)
至2026年3月31日)
至2025年3月31日)
至2026年3月31日)
(デリバティブ取引関係)
1.ヘッジ会計が適用されていないデリバティブ取引
前連結会計年度(2025年3月31日)
該当事項はない。
当連結会計年度(2026年3月31日)
該当事項はない。
73/116
EDINET提出書類
日本コークス工業株式会社(E00030)
有価証券報告書
2.ヘッジ会計が適用されているデリバティブ取引
(1)通貨関連
前連結会計年度(2025年3月31日)
ヘッジ会計
の方法
原則的処理方
法
取引の種類
主なヘッジ対象
契約額等
(百万円)
契約額等のうち
1年超(百万円)
時価
(百万円)
為替予約取引
売建
米ドル
売掛金
合計
58
−
0
58
−
0
当連結会計年度(2026年3月31日)
ヘッジ会計
の方法
原則的処理方
法
取引の種類
主なヘッジ対象
契約額等
(百万円)
契約額等のうち
1年超(百万円)
時価
(百万円)
為替予約取引
売建
米ドル
売掛金
合計
32
−
△0
32
−
△0
(2)金利関連
前連結会計年度(2025年3月31日)
ヘッジ会計
の方法
取引の種類
金利スワップ
金利スワップ取引
の特例処理
変動受取・固定
長期借入金の
支払
支払金利
主なヘッジ対象
合計
契約額等
(百万円)
契約額等のうち
1年超(百万円)
時価
(百万円)
24,830
21,830
(注)
24,830
21,830
(注)金利スワップの特例処理によるものは、ヘッジ対象に対応した長期借入金と一体として処理されているた
め、その時価は、当該長期借入金の時価に含めて記載している。
当連結会計年度(2026年3月31日)
ヘッジ会計
の方法
取引の種類
金利スワップ
金利スワップ取引
の特例処理
変動受取・固定
長期借入金の
支払
支払金利
合計
主なヘッジ対象
契約額等
(百万円)
契約額等のうち
1年超(百万円)
時価
(百万円)
17,890
17,890
(注)
17,890
17,890
(注)金利スワップの特例処理によるものは、ヘッジ対象に対応した長期借入金と一体として処理されているた
め、その時価は、当該長期借入金の時価に含めて記載している。
74/116
EDINET提出書類
日本コークス工業株式会社(E00030)
有価証券報告書
(退職給付関係)
1.採用している退職給付制度の概要
当社および連結子会社は、確定給付型の制度として、退職一時金制度を有している。一部の連結子会社は中小企
業退職金共済制度に加入している。
なお、従業員の退職等に際しては、退職給付会計に準拠した数理計算により退職給付債務の対象とされない割増
退職金を支払うことがある。
当連結会計年度末現在、当社および連結子会社全体で退職一時金については、7社が有しており、また、中小企
業退職金共済制度に1社加入している。
当社および連結子会社が有する退職一時金制度の一部は、簡便法により退職給付に係る負債および退職給付費用
を計算している。
2.確定給付制度(簡便法を適用した制度を含む)
(1) 退職給付債務の期首残高と期末残高の調整表
(自
至
前連結会計年度
2024年4月1日
2025年3月31日)
退職給付債務の期首残高
(自
至
3,034百万円
当連結会計年度
2025年4月1日
2026年3月31日)
3,102百万円
202
勤務費用
208
利息費用
17
15
13
△468
△171
△161
数理計算上の差異の発生額
退職給付の支払額
過去勤務費用の発生額
−
△26
退職給付債務の期末残高
3,102
2,664
(2) 退職給付債務の期末残高と連結貸借対照表に計上された退職給付に係る負債及び退職給付に係る資産の調整表
前連結会計年度
(2025年3月31日)
当連結会計年度
(2026年3月31日)
非積立型制度の退職給付債務
3,102百万円
2,664百万円
連結貸借対照表に計上された負債と資産の純額
3,102
2,664
退職給付に係る負債
3,102
2,664
連結貸借対照表に計上された負債と資産の純額
3,102
2,664
(3) 退職給付費用及びその内訳項目の金額
前連結会計年度
(自 2024年4月1日
至 2025年3月31日)
(自
至
当連結会計年度
2025年4月1日
2026年3月31日)
勤務費用
208百万円
202百万円
15
利息費用
17
数理計算上の差異の費用処理額
41
43
過去勤務費用の費用処理額
−
△1
確定給付制度に係る退職給付費用
267
259
(4) 退職給付に係る調整額
退職給付に係る調整額に計上した項目(法人税等及び税効果控除前)の内訳は次のとおりである。
前連結会計年度
当連結会計年度
(自 2024年4月1日
(自 2025年4月1日
至 2025年3月31日)
至 2026年3月31日)
過去勤務費用
−百万円
24百万円
512
数理計算上の差異
28
536
合計
28
75/116
EDINET提出書類
日本コークス工業株式会社(E00030)
有価証券報告書
(5) 退職給付に係る調整累計額
退職給付に係る調整累計額に計上した項目(法人税等及び税効果控除前)の内訳は次のとおりである。
前連結会計年度
当連結会計年度
(2025年3月31日)
(2026年3月31日)
未認識過去勤務費用
−百万円
△24百万円
△341
未認識数理計算上の差異
170
△366
合計
170
(6) 数理計算上の計算基礎に関する事項
主要な数理計算上の計算基礎
前連結会計年度
(2025年3月31日)
割引率
0.8%
予想昇給率
1.0〜1.7
当連結会計年度
(2026年3月31日)
3.5%
1.0〜1.6
3.確定拠出制度
一部の連結子会社確定拠出制度への要拠出額は、前連結会計年度10百万円、当連結会計年度10百万円である。
(ストック・オプション等関係)
前連結会計年度(自2024年4月1日
該当事項はない。
当連結会計年度(自2025年4月1日
該当事項はない。
至2025年3月31日)
至2026年3月31日)
76/116
EDINET提出書類
日本コークス工業株式会社(E00030)
有価証券報告書
(税効果会計関係)
1.繰延税金資産及び繰延税金負債の発生の主な原因別の内訳
前連結会計年度
(2025年3月31日)
繰延税金資産
棚卸資産評価損
販売用不動産評価損
退職給付に係る負債
貸倒引当金
固定資産評価損
減損損失
受注損失引当金
連結会社間内部利益消去
繰越欠損金(注)
環境対策引当金
その他
繰延税金資産小計
税務上の繰越欠損金に係る評価性引当額(注)
将来減算一時差異の合計に係る評価性引当額
評価性引当額小計
繰延税金資産合計
繰延税金負債
その他
繰延税金負債合計
繰延税金資産の純額
当連結会計年度
(2026年3月31日)
703百万円
165
922
2
384
944
124
1,132
3,903
1,248
651
10,185
△3,899
△4,525
△8,424
1,761
27百万円
165
958
10
384
1,883
65
1,136
6,079
1,268
880
12,860
△6,079
△5,154
△11,234
1,625
△161
△161
1,599
△317
△317
1,308
(注)税務上の繰越欠損金及びその繰延税金資産の繰越期限別の金額
前連結会計年度(2025年3月31日)
1年超
2年超
3年超
4年超
1年以内
5年超
2年以内
3年以内
4年以内
5年以内
(百万円)
(百万円)
(百万円) (百万円) (百万円) (百万円)
税務上の繰越欠
−
−
−
−
−
3,903
損金(※1)
合計
(百万円)
3,903
評価性引当額
−
−
−
−
−
△3,899
△3,899
繰延税金資産
−
−
−
−
−
4
4
(※) 税務上の繰越欠損金は、法定実効税率を乗じた額である。
当連結会計年度(2026年3月31日)
1年超
2年超
3年超
4年超
1年以内
5年超
2年以内
3年以内
4年以内
5年以内
(百万円)
(百万円)
(百万円) (百万円) (百万円) (百万円)
税務上の繰越欠
−
−
−
−
−
6,079
損金(※1)
合計
(百万円)
6,079
評価性引当額
−
−
−
−
−
△6,079
△6,079
繰延税金資産
−
−
−
−
−
−
−
(※) 税務上の繰越欠損金は、法定実効税率を乗じた額である。
2.法定実効税率と税効果会計適用後の法人税等の負担率との差異の原因となった主な項目別の内訳
前連結会計年度及び当連結会計年度は、税金等調整前当期純損失を計上しているため、記載を省略している。
77/116
EDINET提出書類
日本コークス工業株式会社(E00030)
有価証券報告書
(資産除去債務関係)
前連結会計年度(自2024年4月1日至2025年3月31日)
重要性が乏しいため、記載を省略している。
当連結会計年度(自2025年4月1日至2026年3月31日)
重要性が乏しいため、記載を省略している。
(賃貸等不動産関係)
当社および一部の子会社では、福岡県その他の地域において、非事業用資産(主として土地)を有している。
前連結会計年度における当該賃貸等不動産に関する売上高は494百万円、租税公課は134百万円(主として売上原価に
計上)、売却損益は23百万円(売却益は特別利益、売却損は特別損失に計上)、減損損失は10百万円(特別損失に計
上)である。
当連結会計年度における当該賃貸等不動産に関する売上高は503百万円、租税公課は133百万円(主として売上原価に
計上)、売却損益は118百万円(売却益は特別利益、売却損は特別損失に計上)、減損損失は74百万円(特別損失に計
上)である。
また、当該賃貸等不動産の連結貸借対照表計上額、当連結会計年度増減額および時価は、次のとおりである。
(単位:百万円)
前連結会計年度
2024年4月1日
2025年3月31日)
(自
至
当連結会計年度
2025年4月1日
2026年3月31日)
(自
至
連結貸借対照表計上額
期首残高
10,518
10,495
期中増減額
△23
△131
期末残高
10,495
10,364
16,941
16,757
期末時価
(注) 1.期中増減額は、売却および減損損失による減少である。
2.期末の時価は、主として「不動産鑑定評価基準」に基づいて自社で算定した金額(指標等を用いて調整を行っ
たものを含む。)である。
78/116
EDINET提出書類
日本コークス工業株式会社(E00030)
有価証券報告書
(収益認識関係)
1.顧客との契約から生じる収益を分解した情報
前連結会計年度(自 2024年4月1日至 2025年3月31日)
(単位:百万円)
報告セグメント
その他
合計
燃料・資
源リサイ
クル事業
総合エンジ
ニアリング
事業
58,714
27,240
9,296
95,251
3,299
98,550
(2)その他の収益
−
−
−
−
494
494
外部顧客への売上高
58,714
27,240
9,296
95,251
3,793
99,045
コークス
事業
計
売上高
(1)顧客との契約から
生じる収益
(注)「その他」の区分は、報告セグメントに含まれない事業セグメントであり、運輸荷役事業、不動産販
売・賃貸事業等を含んでいる。
当連結会計年度(自
2025年4月1日
至
2026年3月31日)
(単位:百万円)
報告セグメント
その他
合計
燃料・資
源リサイ
クル事業
総合エンジ
ニアリング
事業
56,134
23,343
7,917
87,394
3,487
90,882
(2)その他の収益
−
−
−
−
503
503
外部顧客への売上高
56,134
23,343
7,917
87,394
3,991
91,386
コークス
事業
計
売上高
(1)顧客との契約から
生じる収益
(注)「その他」の区分は、報告セグメントに含まれない事業セグメントであり、運輸荷役事業、不動産販
売・賃貸事業等を含んでいる。
2.顧客との契約から生じる収益を理解するための基礎となる情報
「(連結財務諸表作成のための基本となる重要な事項)2.会計方針に関する事項(5)重要な収益及び費用
の計上基準」に記載のとおりである。
3.顧客との契約に基づく履行義務の充足と当該契約から生じるキャッシュ・フローとの関係並びに当連結会計
年度末において存在する顧客との契約から翌連結会計年度以降に認識すると見込まれる収益の金額及び時期に
関する情報
(1) 契約資産及び契約負債の残高等
当社及び連結子会社の契約資産及び契約負債については、残高に重要性が乏しく、重大な変動も発生してい
ないため、記載を省略している。また、過去の期間に充足(又は部分的に充足)した履行義務から、当連結会
計年度に認識した収益に重要性はない。
(2) 残存履行義務に配分した取引価格
当社及び連結子会社では、残存履行義務に配分した取引価格の注記にあたって実務上の便法を適用し、当初
に予想される契約期間が1年以内の契約については注記の対象に含めていない。
総合エンジニアリング事業において、粉粒体装置・機器の販売契約や電気設備工事の契約などがあるが、当
初に予想される契約期間が1年を超える重要な契約がないため、注記を省略している。
79/116
EDINET提出書類
日本コークス工業株式会社(E00030)
有価証券報告書
(セグメント情報等)
【セグメント情報】
1.報告セグメントの概要
当社の報告セグメントは、当社の構成単位のうち分離された財務情報が入手可能であり、取締役会が、経
営資源の配分の決定および業績を評価するために、定期的に検討を行う対象となっているものである。
当社グループは、取扱製商品・サービスの類似性等に基づいて事業を区分しており、各事業部門は主体的
に、取り扱う製商品・サービスについて包括的な戦略を立案し、事業活動を展開している。
したがって、当社グループは、製商品・サービス別のセグメントから構成されており、「コークス事業」
「燃料・資源リサイクル事業」「総合エンジニアリング事業」の3つを報告セグメントとしている。
「コークス事業」は、コークスの製造・販売を行っている。「燃料・資源リサイクル事業」は、一般炭お
よび石油コークスの仕入・販売やコールセンター事業等を行っている。「総合エンジニアリング事業」は、
化学装置・機器等の製造・販売およびメンテナンス等を行っている。
2.報告セグメントごとの売上高、利益又は損失、資産その他の項目の金額の算定方法
報告セグメントの会計処理の方法は、「連結財務諸表作成のための基本となる重要な事項」における記載
と同一である。
報告セグメントの利益は、営業利益ベースの数値である。
セグメント間の内部売上高又は振替高は市場実勢価格に基づいている。
80/116
EDINET提出書類
日本コークス工業株式会社(E00030)
有価証券報告書
3.報告セグメントごとの売上高、利益又は損失、資産その他の項目の金額に関する情報
Ⅰ 前連結会計年度(自2024年4月1日至2025年3月31日)
(単位:百万円)
報告セグメント
その他
(注1)
合計額
調整額
(注2)
連結財務
諸表計上
額
(注3)
コークス事業
燃料・資源リ
サイクル事業
総合エンジニ
アリング事業
58,714
27,240
9,296
95,251
3,793
99,045
−
99,045
−
9
2,411
2,421
527
2,948
△2,948
−
58,714
27,249
11,708
97,672
4,321
101,994
△2,948
99,045
△12,357
2,775
2,072
△7,509
593
△6,916
△1,645
△8,562
84,670
10,037
10,004
104,712
15,628
120,341
10,289
130,630
4,563
34
274
4,871
308
5,180
59
5,240
−
−
−
−
10
10
−
10
14,472
50
549
15,072
199
15,271
555
15,827
計
売上高
(1)外部顧客への売上
高
(2)セグメント間の内
部売上高又は振替
高
計
セグメント利益又は損
失(△)
セグメント資産
その他の項目
減価償却費
減損損失
有形固定資産及び無
形固定資産の増加額
(注)1.「その他」の区分は、報告セグメントに含まれない事業セグメントであり、運輸荷役事業、不動産販売・
賃貸事業等を含んでいる。
2.調整額は以下のとおりである。
(1) セグメント利益又は損失の調整額△1,645百万円は、セグメント間取引消去△3百万円、各報告セグメン
トに配分していない全社費用△1,641百万円である。全社費用は、主に報告セグメントに帰属しない一
般管理費である。
(2) セグメント資産の調整額10,289百万円は、セグメント間取引消去△1,930百万円、各報告セグメントに
配分していない全社資産12,220百万円である。全社資産は、主に報告セグメントに帰属しない資産であ
る。
3.セグメント利益又は損失およびセグメント資産は、連結財務諸表の営業損失および資産合計と調整を行っ
ている。
4.減価償却費には、長期前払費用の償却費が含まれている。
5.有形固定資産及び無形固定資産の増加額には、長期前払費用が含まれている。
81/116
EDINET提出書類
日本コークス工業株式会社(E00030)
有価証券報告書
Ⅱ
当連結会計年度(自2025年4月1日
至2026年3月31日)
(単位:百万円)
報告セグメント
その他
(注1)
合計額
調整額
(注2)
連結財務
諸表計上
額
(注3)
コークス事業
燃料・資源リ
サイクル事業
総合エンジニ
アリング事業
56,134
23,343
7,917
87,394
3,991
91,386
−
91,386
−
8
2,622
2,630
391
3,022
△3,022
−
56,134
23,351
10,539
90,025
4,382
94,408
△3,022
91,386
△2,328
2,630
1,477
1,779
579
2,358
△1,751
607
83,094
8,228
9,522
100,844
15,016
115,861
10,682
126,544
減価償却費
5,299
33
292
5,624
279
5,904
104
6,009
減損損失
4,334
28
−
4,362
74
4,436
−
4,436
有形固定資産及び無
形固定資産の増加額
5,918
14
1,011
6,944
188
7,133
205
7,339
計
売上高
(1)外部顧客への売上
高
(2)セグメント間の内
部売上高又は振替
高
計
セグメント利益又は損
失(△)
セグメント資産
その他の項目
(注)1.「その他」の区分は、報告セグメントに含まれない事業セグメントであり、運輸荷役事業、不動産販売・
賃貸事業等を含んでいる。
2.調整額は以下のとおりである。
(1) セグメント利益又は損失の調整額△1,751百万円は、セグメント間取引消去△55百万円、各報告セグメ
ントに配分していない全社費用△1,696百万円である。全社費用は、主に報告セグメントに帰属しない
一般管理費である。
(2) セグメント資産の調整額10,682百万円は、セグメント間取引消去△793百万円、各報告セグメントに配
分していない全社資産11,476百万円である。全社資産は、主に報告セグメントに帰属しない資産であ
る。
3.セグメント利益又は損失およびセグメント資産は、連結財務諸表の営業利益および資産合計と調整を行っ
ている。
4.減価償却費には、長期前払費用の償却費が含まれている。
5.有形固定資産及び無形固定資産の増加額には、長期前払費用が含まれている。
82/116
EDINET提出書類
日本コークス工業株式会社(E00030)
有価証券報告書
【関連情報】
前連結会計年度(自2024年4月1日
至2025年3月31日)
1.製品及びサービスごとの情報
「報告セグメントごとの売上高、利益又は損失、資産その他の項目の金額に関する情報」に記載して
いる。
2.地域ごとの情報
(1)売上高
(単位:百万円)
日本
北米
アジア
欧州
その他
合計
94,873
4
4,164
4
−
99,045
(注)売上高は顧客の所在地を基礎とし、国又は地域に分類している。
(2)有形固定資産
本邦に所在している有形固定資産の金額が連結貸借対照表の有形固定資産の金額の90%を超えるた
め、記載を省略している。
3.主要な顧客ごとの情報
(単位:百万円)
顧客の名称
売上高
日本製鉄株式会社
関連するセグメント名
29,961
当連結会計年度(自2025年4月1日
コークス事業
至2026年3月31日)
1.製品及びサービスごとの情報
「報告セグメントごとの売上高、利益又は損失、資産その他の項目の金額に関する情報」に記載して
いる。
2.地域ごとの情報
(1)売上高
(単位:百万円)
日本
北米
アジア
欧州
その他
合計
90,844
178
363
1
−
91,386
(注)売上高は顧客の所在地を基礎とし、国又は地域に分類している。
(2)有形固定資産
本邦に所在している有形固定資産の金額が連結貸借対照表の有形固定資産の金額の90%を超えるた
め、記載を省略している。
3.主要な顧客ごとの情報
(単位:百万円)
顧客の名称
日本製鉄株式会社
売上高
関連するセグメント名
34,776
83/116
コークス事業
EDINET提出書類
日本コークス工業株式会社(E00030)
有価証券報告書
【報告セグメントごとの固定資産の減損損失に関する情報】
前連結会計年度(自2024年4月1日至2025年3月31日)
(単位:百万円)
コークス事業
減損損失
燃料・資源リ 総合エンジニア
サイクル事業
リング事業
−
−
その他
全社・消去
10
−
合計
10
−
(注)「全社・消去」の金額は、セグメントに帰属しない全社資産に係る減損損失である。
当連結会計年度(自2025年4月1日
至2026年3月31日)
(単位:百万円)
コークス事業
減損損失
燃料・資源リ 総合エンジニア
サイクル事業
リング事業
4,334
28
その他
−
全社・消去
74
−
(注)「全社・消去」の金額は、セグメントに帰属しない全社資産に係る減損損失である。
【報告セグメントごとののれんの償却額及び未償却残高に関する情報】
前連結会計年度(自2024年4月1日至2025年3月31日)
該当事項はない。
当連結会計年度(自2025年4月1日
至2026年3月31日)
該当事項はない。
【報告セグメントごとの負ののれん発生益に関する情報】
前連結会計年度(自2024年4月1日
至2025年3月31日)
該当事項はない。
当連結会計年度(自2025年4月1日
至2026年3月31日)
該当事項はない。
84/116
合計
4,436
EDINET提出書類
日本コークス工業株式会社(E00030)
有価証券報告書
【関連当事者情報】
関連当事者との取引
連結財務諸表提出会社と関連当事者との取引
(1)連結財務諸表提出会社の親会社及び主要株主(会社等の場合に限る。)等
前連結会計年度(自2024年4月1日至2025年3月31日)
所在地
資本金又
議決権等の
事業の内容
は出資金
所有(被所
又は職業
有)割合
(百万円)
その他の
日本製鉄東京都
(被所有)
関係会社
㈱
会社等
の名称
種類
千代田区
569,519
製鉄事業
関係内容
役員の
兼任等
事業上
の関係
兼任
1名
製品等の
直接22.6% 転籍
2名
販売
取引の
内容
取引金額
(百万円)
科目
期末残高
(百万円)
当社製品等
の販売
29,961 売掛金
2,492
原材料の仕
入等
20,222 買掛金
1,118
(注)1.議決権等の所有(被所有)割合は、自己株式を含んでいる。
2.取引条件ないし取引条件の決定方針等
当社製品等の販売および原材料の仕入については、市場価格等を勘案し、交渉のうえ価格を決定している。
当連結会計年度(自2025年4月1日
会社等
の名称
種類
所在地
至2026年3月31日)
資本金又
議決権等の
事業の内容
は出資金
所有(被所
又は職業
有)割合
(百万円)
関係内容
役員の
兼任等
事業上
の関係
兼任
その他の
関係会社
日本製鉄東京都
千代田区
㈱
1名
直接22.6% 転籍
1名
(被所有)
569,519
製鉄事業
製品等の
販売
取引の
内容
取引金額
(百万円)
科目
期末残高
(百万円)
当社製品等
34,776 売掛金
3,074
の販売
原材料の仕
21,188 買掛金
2,527
入等
(注)1.議決権等の所有(被所有)割合は、自己株式を含んでいる。
2.取引条件ないし取引条件の決定方針等
当社製品等の販売および原材料の仕入については、市場価格等を勘案し、交渉のうえ価格を決定している。
(2)連結財務諸表提出会社の役員及び主要株主(個人の場合に限る。)等
前連結会計年度(自2024年4月1日至2025年3月31日)
該当事項はない。
当連結会計年度(自2025年4月1日
該当事項はない。
至2026年3月31日)
(3)連結財務諸表提出会社の非連結子会社及び関連会社等
前連結会計年度(自2024年4月1日至2025年3月31日)
該当事項はない。
当連結会計年度(自2025年4月1日
該当事項はない。
至2026年3月31日)
(4)連結財務諸表提出会社と同一の親会社をもつ会社等及び連結財務諸表提出会社のその他の関係会社の子会社等
前連結会計年度(自2024年4月1日至2025年3月31日)
該当事項はない。
当連結会計年度(自2025年4月1日
該当事項はない。
至2026年3月31日)
85/116
EDINET提出書類
日本コークス工業株式会社(E00030)
有価証券報告書
(1株当たり情報)
前連結会計年度
(自 2024年4月1日
至 2025年3月31日)
当連結会計年度
2025年4月1日
2026年3月31日)
(自
至
1株当たり純資産額
142.94円
119.57円
1株当たり当期純損失金額(△)
△47.79円
△26.39円
(注)1.潜在株式調整後1株当たり当期純利益金額については、1株当たり当期純損失であり、また、潜在株式が存在
しないため記載していない。
2.1株当たり純資産額の算定上の基礎は、以下のとおりである。
前連結会計年度
(2025年3月31日)
純資産の部の合計額
当連結会計年度
(2026年3月31日)
(百万円)
41,600
34,797
純資産の部の合計額から控除する金額(百万円)
−
−
(うち非支配株主持分(百万円))
(−)
(−)
41,600
34,797
291,023,768
291,022,839
普通株式に係る期末の純資産額
(百万円)
1株当たり純資産額の算定に用いられ
た期末の普通株式の数
(株)
3.1株当たり当期純損失金額の算定上の基礎は、以下のとおりである。
前連結会計年度
2024年4月1日
2025年3月31日)
(自
至
当連結会計年度
2025年4月1日
2026年3月31日)
(自
至
1株当たり当期純損失金額(△)
親会社株主に帰属する当期純損失(△)
(百万円)
普通株主に帰属しない金額
(百万円)
普通株式に係る親会社株主に帰属する当期純損失
(△)(百万円)
期中平均株式数
(株)
86/116
△13,908
△7,678
−
−
△13,908
△7,678
291,024,351
291,023,216
EDINET提出書類
日本コークス工業株式会社(E00030)
有価証券報告書
(重要な後発事象)
(財務上の特約が付されたコミットメントライン契約の期限変更ならびに財務上の特約の内容の変更について)
当社が締結していた財務上の特約が付されたコミットメントライン契約について、2026年4月24日付でコミッ
ト期間及び財務上の特約の内容を変更している。
本契約の内容
(1)コミットメントライン契約を締結した年月日
2018年12月10日
(2)コミットメントライン契約の相手方の属性
株式会社三井住友銀行をアレンジャーとする金融機関
全14社
(3)コミットメントライン契約に係る総コミット金額及びコミット期間並びに当該債務に付された担保の内容
① 総コミット金額 24,800百万円(2026年3月末借入実行残高24,304百万円)
②
コミット期間(下線部は変更箇所)
(変更前)開始日2018年12月21日
満了日2026年4月30日
(変更後)開始日2018年12月21日
満了日2027年4月30日
③ 担保の内容
無担保
(4)財務上の特約の内容
(変更前) 下線部は変更箇所
①
連結決算および個別決算において、本決算期の純資産の金額を2018年3月期または直前期のいずれか
高い方の70%以上とする。
② 連結決算および個別決算において、本決算期の営業損益を二期連続マイナスとしない。
(変更後)
下線部は変更箇所
①
連結決算および個別決算において、本決算期の純資産の金額を2026年3月期の80%以上とする。
②
連結決算および個別決算において、本決算期の営業損益を二期連続マイナスとしない。
87/116
EDINET提出書類
日本コークス工業株式会社(E00030)
有価証券報告書
(財務上の特約が付された金銭消費貸借契約における財務上の特約の内容の変更について)
当社が締結していた財務上の特約が付された金銭消費貸借契約について、2026年4月30日付で当該財務上の特
約の内容を変更している。
各契約の内容
①2022年5月契約シンジケートローン契約
契約締結日
2022年5月31日
契約の相手方
株式会社三井住友銀行をアレンジャーとする金融機関
元本金額
13,800百万円(2026年3月末残高10,032百万円)
弁済期限
2030年3月29日
担保の内容
無担保
変更前の財務上の特約の内容
(下線部は変更箇所)
①連結決算および個別決算において、本決算期の純資産の金額を
2021年3月期または直前期のいずれか高い方の70%以上とする。
②連結決算および個別決算において、本決算の営業損益を二期連続
マイナスとしない。
変更後の財務上の特約の内容
(下線部は変更箇所)
①連結決算および個別決算において、本決算期の純資産の金額を
2026年3月期の80%以上とする。
②連結決算および個別決算において、本決算の営業損益を二期連続
マイナスとしない。
変更契約締結日
2026年4月30日
全15社
②2024年9月契約シンジケートローン契約(トランシェA,B,C)
トランシェA
トランシェB
株式会社三井住友銀行
をアレンジャーとする
金融機関
全14社
株式会社三井住友銀行
をアレンジャーとする
金融機関
全13社
三井住友信託銀行株式
会社をアレンジャーと
する金融機関
全4社
10,000百万円
(7,858百万円)
10,000百万円
(10,000百万円)
4,900百万円
(4,900百万円)
契約締結日
契約の相手方
元本金額
(2026年3月末残高)
弁済期限
トランシェC
2024年9月25日
2031年9月30日
担保の内容
2028年9月29日
2029年9月28日
無担保
変更前の財務上の特約の内容
(下線部は変更箇所)
①連結決算および個別決算において、本決算期の純資産の金額を2024年3
月期または直前期のいずれか高い方の70%以上とする。
②連結決算および個別決算において、本決算期の営業損益を二期連続マイ
ナスとしない。
変更後の財務上の特約の内容
(下線部は変更箇所)
①連結決算および個別決算において、本決算期の純資産の金額を2026年3
月期の80%以上とする。
②連結決算および個別決算において、本決算期の営業損益を二期連続マイ
ナスとしない。
変更契約締結日
2026年4月30日
88/116
EDINET提出書類
日本コークス工業株式会社(E00030)
有価証券報告書
⑤【連結附属明細表】
【社債明細表】
該当事項はない。
【借入金等明細表】
当期首残高
(百万円)
当期末残高
(百万円)
平均利率
(%)
短期借入金
25,890
33,734
1.51
−
1年以内に返済予定の長期借入金
7,038
4,152
1.73
−
1年以内に返済予定のリース債務
7
10
−
−
長期借入金(1年以内に返済予定のものを除く。)
32,887
29,391
1.75
2027〜2032年
リース債務(1年以内に返済予定のものを除く。)
19
25
−
2027〜2032年
65,843
67,313
−
−
区分
合計
返済期限
(注)1.平均利率については、期末残高に対する加重平均利率を記載している。
2.リース債務の平均利率については、リース料総額に含まれる利息相当額を控除する前の金額でリース債務を連
結貸借対照表に計上しているため、記載していない。
3.長期借入金およびリース債務(1年以内に返済予定のものを除く)の連結決算日後5年間の返済予定額は以下
のとおりである。
1年超2年以内
(百万円)
2年超3年以内
(百万円)
3年超4年以内
(百万円)
4年超5年以内
(百万円)
長期借入金
4,087
14,063
8,957
1,528
リース債務
7
5
5
4
【資産除去債務明細表】
当連結会計年度期首および当連結会計年度末における資産除去債務の金額が、当連結会計年度期首および当連
結会計年度末における負債及び純資産の合計額の100分の1以下であるため、連結財務諸表規則第92条の2の規
定により記載を省略している。
89/116
EDINET提出書類
日本コークス工業株式会社(E00030)
有価証券報告書
(2)【その他】
当連結会計年度における半期情報等
中間連結会計期間
当連結会計年度
49,680
91,386
税金等調整前中間純利益又は税金等
調整前当期純損失(△)(百万円)
9
△7,122
親会社株主に帰属する中間(当期)
純損失(△)(百万円)
△487
△7,678
1株当たり中間(当期)純損失金額
(△)(円)
△1.68
△26.39
売上高(百万円)
90/116
EDINET提出書類
日本コークス工業株式会社(E00030)
有価証券報告書
2【財務諸表等】
(1)【財務諸表】
①【貸借対照表】
(単位:百万円)
前事業年度
(2025年3月31日)
資産の部
流動資産
現金及び預金
受取手形
売掛金
契約資産
商品及び製品
仕掛品
原材料及び貯蔵品
前払費用
未収入金
その他
貸倒引当金
流動資産合計
固定資産
有形固定資産
建物
構築物
機械及び装置
土地
建設仮勘定
その他
有形固定資産合計
無形固定資産
ソフトウエア
その他
無形固定資産合計
投資その他の資産
関係会社株式
投資有価証券
繰延税金資産
長期前払費用
その他
貸倒引当金
投資その他の資産合計
固定資産合計
資産合計
91/116
当事業年度
(2026年3月31日)
2,143
660
※1 9,250
1,064
※2 11,772
584
13,290
126
※1 471
※1 39
−
39,404
2,211
52
※1 7,816
573
※2 10,284
499
16,564
72
※1 324
※1 92
△22
38,468
2,679
3,836
34,203
33,573
2,356
815
77,465
2,592
3,515
31,551
33,420
1,608
858
73,545
380
213
594
518
55
574
4,265
1,120
101
365
317
△9
6,161
84,220
123,625
4,274
1,568
−
341
318
△9
6,493
80,613
119,082
EDINET提出書類
日本コークス工業株式会社(E00030)
有価証券報告書
(単位:百万円)
前事業年度
(2025年3月31日)
負債の部
流動負債
買掛金
短期借入金
未払金
未払法人税等
契約負債
未払費用
前受金
預り金
賞与引当金
関係会社整理損失引当金
受注損失引当金
その他
流動負債合計
固定負債
長期借入金
繰延税金負債
退職給付引当金
環境対策引当金
その他
固定負債合計
負債合計
純資産の部
株主資本
資本金
資本剰余金
資本準備金
資本剰余金合計
利益剰余金
利益準備金
その他利益剰余金
繰越利益剰余金
利益剰余金合計
自己株式
株主資本合計
評価・換算差額等
その他有価証券評価差額金
繰延ヘッジ損益
評価・換算差額等合計
純資産合計
負債純資産合計
92/116
当事業年度
(2026年3月31日)
※1 6,362
※1 9,085
※1 33,130
※1 37,343
※1 3,707
※1 2,565
−
100
※1 2,112
228
339
345
344
405
42
47,118
150
292
※1 1,972
228
284
288
11
134
50
52,406
32,790
−
2,313
3,989
※1 753
28,851
215
2,362
4,045
※1 684
39,847
86,966
36,159
88,565
7,000
7,000
1,750
1,750
1,750
1,750
3
3
28,660
28,663
△1,209
36,203
22,182
22,186
△1,209
29,726
454
0
455
36,659
123,625
791
△0
790
30,516
119,082
EDINET提出書類
日本コークス工業株式会社(E00030)
有価証券報告書
②【損益計算書】
(単位:百万円)
(自
至
前事業年度
2024年4月1日
2025年3月31日)
(自
至
当事業年度
2025年4月1日
2026年3月31日)
売上高
※1 89,750
※1 81,972
売上原価
売上総利益又は売上総損失(△)
※1 94,066
※1 76,941
△4,316
※1,※2 5,436
※1,※2 5,571
△9,752
△539
※1 217
※1 1,393
−
26
244
326
218
1,937
※1 549
※1 861
販売費及び一般管理費
営業損失(△)
営業外収益
受取利息及び配当金
関係会社整理損失引当金戻入額
その他
営業外収益合計
営業外費用
支払利息
環境対策引当金繰入額
その他
営業外費用合計
経常損失(△)
特別利益
固定資産売却益
投資有価証券売却益
その他
特別利益合計
特別損失
固定資産除却損
減損損失
棚卸資産廃棄損
災害による損失
その他
特別損失合計
税引前当期純損失(△)
法人税、住民税及び事業税
法人税等調整額
法人税等合計
当期純損失(△)
93/116
5,031
711
332
※1 556
※1 353
1,817
△11,325
1,547
△149
23
−
2
26
129
75
7
213
※1 697
※1 1,079
10
−
※1 828
12
1,549
△12,848
16
1,656
1,673
△14,522
4,408
253
※1 580
38
6,361
△6,298
15
164
179
△6,477
EDINET提出書類
日本コークス工業株式会社(E00030)
有価証券報告書
③【株主資本等変動計算書】
前事業年度(自 2024年4月1日
至
2025年3月31日)
(単位:百万円)
株主資本
資本剰余金
資本金
資本準備金
当期首残高
7,000
利益剰余金
資本剰余金
利益準備金
合計
1,750
1,750
3
その他利益
剰余金
繰越利益剰
余金
利益剰余金
合計
自己株式
株主資本合
計
△1,209
51,598
44,055
44,058
△873
△873
△873
△14,522
△14,522
△14,522
当期変動額
剰余金の配当
当期純損失(△)
自己株式の取得
△0
株主資本以外の項目の当期変動
額(純額)
当期変動額合計
当期末残高
−
−
−
−
−
△15,395
△15,395
△0
△15,395
7,000
1,750
1,750
3
28,660
28,663
△1,209
36,203
評価・換算差額等
その他有価
証券評価差
額金
当期首残高
399
繰延ヘッジ 評価・換算
損益
差額等合計
△1
純資産合計
397
51,996
当期変動額
剰余金の配当
△873
当期純損失(△)
△14,522
自己株式の取得
株主資本以外の項目の当期変動
額(純額)
△0
△0
55
1
57
57
当期変動額合計
55
1
57
△15,337
当期末残高
454
0
455
36,659
94/116
EDINET提出書類
日本コークス工業株式会社(E00030)
有価証券報告書
当事業年度(自
2025年4月1日
至
2026年3月31日)
(単位:百万円)
株主資本
資本剰余金
資本金
資本準備金
当期首残高
7,000
利益剰余金
資本剰余金
利益準備金
合計
1,750
1,750
3
その他利益
剰余金
繰越利益剰
余金
利益剰余金
合計
自己株式
株主資本合
計
△1,209
36,203
28,660
28,663
−
−
−
△6,477
△6,477
△6,477
当期変動額
剰余金の配当
当期純損失(△)
自己株式の取得
△0
株主資本以外の項目の当期変動
額(純額)
当期変動額合計
当期末残高
−
−
−
−
−
△6,477
△6,477
△0
△6,477
7,000
1,750
1,750
3
22,182
22,186
△1,209
29,726
評価・換算差額等
その他有価
証券評価差
額金
当期首残高
454
繰延ヘッジ 評価・換算
損益
差額等合計
0
純資産合計
455
36,659
当期変動額
剰余金の配当
−
当期純損失(△)
△6,477
自己株式の取得
株主資本以外の項目の当期変動
額(純額)
△0
△0
336
△1
335
335
当期変動額合計
336
△1
335
△6,142
当期末残高
791
△0
790
30,516
95/116
EDINET提出書類
日本コークス工業株式会社(E00030)
有価証券報告書
【注記事項】
(重要な会計方針)
1.資産の評価基準及び評価方法
(1) 有価証券の評価基準及び評価方法
子会社株式及び関連会社株式………移動平均法に基づく原価法
その他有価証券
市場価格のない株式等以外のもの…決算日の市場価格等に基づく時価法(評価差額は全部純資産直入法
により処理し、売却原価は移動平均法により算定)
市場価格のない株式等………………移動平均法に基づく原価法
(2) デリバティブ等の評価基準および評価方法
デリバティブ…………………………時価法
(3) 棚卸資産の評価基準および評価方法
商品・製品……………………………総平均法(ただし、販売用不動産は個別法)に基づく原価法(貸借対
照表価額は収益性の低下に基づく簿価切下げの方法により算定)
半製品・原材料・貯蔵品……………総平均法に基づく原価法(貸借対照表価額は収益性の低下に基づく簿
価切下げの方法により算定)
仕掛品…………………………………移動平均法(ただし、化工機部門は個別法)に基づく原価法(貸借対
照表価額は収益性の低下に基づく簿価切下げの方法により算定)
2.固定資産の減価償却の方法
(1)有形固定資産(リース資産を除く)
定額法
ただし、取得価額が10万円以上20万円未満の減価償却資産については、3年均等償却としている。
(2)無形固定資産(リース資産を除く)
定額法
なお、自社利用のソフトウエアについては、社内における見込利用可能期間(5年)に基づく定額法に
よっている。
(3)リース資産
リース期間を耐用年数とし、残存価額を零とする定額法
なお、所有権移転外ファイナンス・リース取引のうち、個々のリース資産に重要性が乏しいと認められ
るリース取引については、通常の賃貸借取引に係る方法に準じた会計処理によっている。
3.引当金の計上基準
(1) 貸倒引当金
売上債権等の貸倒損失に備えるため、一般債権については貸倒実績率により、貸倒懸念債権等特定の債
権については個別に回収可能性を検討して回収不能見込額を計上している。
(2) 賞与引当金
従業員の賞与支給に充てるため、支給見込額を計上している。
(3) 退職給付引当金
従業員の退職給付に備えるため、当事業年度末における退職給付債務の見込額に基づき計上している。
また、数理計算上の差異は、各事業年度の発生時における従業員の平均残存勤務期間(主として13年)
による定額法により按分した額をそれぞれ発生の翌事業年度から費用処理している。
(4) 関係会社整理損失引当金
関係会社の整理により、当社が将来負担することとなり、かつ、合理的に見積もることが可能なものに
ついては、当該損失見込額を計上している。
(5) 環境対策引当金
当社が関係会社より承継した閉山坑の環境整備費用の支出に備えるため、当該費用の見込額を計上して
いる。
(6) 受注損失引当金
受注契約に係る将来の損失に備えるため、当事業年度末時点で将来の損失が確実に見込まれ、かつ、当
該損失額を合理的に見積もることが可能なものについては、将来の損失見込額を計上している。
96/116
EDINET提出書類
日本コークス工業株式会社(E00030)
有価証券報告書
4.収益及び費用の計上基準
当社の顧客との契約から生じる収益に関する主要な事業における主な履行義務の内容及び当該履行義務
を充足する通常の時点(収益を認識する通常の時点)は以下の通りである。
コークス事業
当社北九州事業所で生産するコークスおよび副産物を国内外鉄鋼会社等に販売しており、コークス製品
の納入時点等で履行義務が充足されたと判断し、その時点において収益を認識している。
燃料・資源リサイクル事業
海外から輸入した一般炭および石油コークスを販売している他、コールセンター事業や石炭灰・汚泥等
の産業廃棄物の処理を行っている。
石炭製品の納入時点等で履行義務が充足されたと判断し、その時点において収益を認識している。
なお、石炭灰等の処理に関する仲介取引については、収益認識基準における「代理人取引」に該当する
ものとして、売上と売上原価および販売直接費を相殺して表示することとしている。
総合エンジニアリング事業
当社栃木工場で設計・製造する粉粒体装置・機器等を販売している他、産業機械等の製造・修理等を
行っている。
なお、工事契約に関して、少額且つごく短期な工事については、完全に履行義務を充足した時点で収益
を認識し、その他の工事については、履行義務を充足するにつれて、一定の期間にわたり収益を認識して
いる。
5.外貨建の資産および負債の本邦通貨への換算基準
外貨建金銭債権債務は、決算日の直物為替相場により円貨に換算し、換算差額は損益として処理してい
る。
6.ヘッジ会計の方法
(1) ヘッジ会計の方法
為替予約取引および金利スワップ取引については、繰延ヘッジ処理によっている。ただし、為替予約等
が付されている外貨建金銭債権債務等は振当処理を、特例処理の要件を満たす金利スワップ取引について
は、特例処理を採用している。
(2) ヘッジ手段とヘッジ対象
ヘッジ手段
為替予約取引、金利スワップ取引
ヘッジ対象
外貨建金銭債権債務、外貨建予定取引、借入金の支払金利
(3) ヘッジ方針
外貨建取引に係る将来の為替変動によるリスク回避および金利変動による金融負債の損失可能性を減殺
する目的で行っている。
(4) ヘッジ有効性の評価
ヘッジ対象の変動額の累計とヘッジ手段の変動額の累計を比較することにより有効性を判定している。
ただし、為替予約取引等においては、外貨建による同一金額で同一期日の為替予約等を振り当ててお
り、その後の為替変動による相関関係が確保されているため、その判定をもって有効性の判定としてい
る。特例処理の要件を満たす金利スワップ取引については、その判定をもって有効性の判定としている。
97/116
EDINET提出書類
日本コークス工業株式会社(E00030)
有価証券報告書
(重要な会計上の見積り)
固定資産の減損
(1) 当事業年度の財務諸表に計上した金額
(百万円)
前事業年度
コークス事業に係る
資産グループの固定資産
当事業年度
57,209
53,262
(2) 識別した項目に係る重要な会計上の見積りの内容に関する情報
(1)の金額の算出方法は、連結財務諸表「注記事項(重要な会計上の見積り)固定資産の減損」の内容と同
一である。
(会計方針の変更)
該当事項はない。
(表示方法の変更)
(損益計算書)
1.為替差損
前事業年度において、独立掲記していた「営業外費用」の「為替差損」は、金額的重要性が乏しくなった
ため、当事業年度においては「その他」に含めて表示している。この表示方法の変更を反映させるため、前
事業年度の財務諸表の組替えを行っている。
この結果、前事業年度の損益計算書において、「営業外費用」の「為替差損」に表示していた211百万円
は、「その他」として組替えている。
2.減損損失
前事業年度において、「特別損失」の「その他」に含めていた「減損損失」は、「特別損失」の総額の
100分の10を超えたため、当事業年度より独立掲記することとした。この表示方法の変更を反映させるた
め、前事業年度の財務諸表の組替えを行っている。
この結果、前事業年度の損益計算書において、「特別損失」の「その他」に表示していた23百万円は、
「減損損失」10百万円、「その他」12百万円として組み替えている。
(追加情報)
該当事項はない。
98/116
EDINET提出書類
日本コークス工業株式会社(E00030)
有価証券報告書
(貸借対照表関係)
※1.関係会社に対する金銭債権及び金銭債務(区分表示したものを除く)
前事業年度
(2025年3月31日)
短期金銭債権
短期金銭債務
長期金銭債務
当事業年度
(2026年3月31日)
3,023百万円
3,146
0
3,695百万円
3,387
0
※2.販売用不動産
商品及び製品の中には、販売用不動産が以下の通り含まれている。
前事業年度
(2025年3月31日)
当事業年度
(2026年3月31日)
1,760百万円
1,759百万円
3.当座貸越契約及び貸出コミットメント
当社は運転資金および設備資金の効率的な調達を行うため取引銀行14行と当座貸越契約および貸出コミットメ
ント契約を締結している。
上記契約に基づく当事業年度末における借入未実行残高は次のとおりである。
前事業年度
(2025年3月31日)
当座貸越極度額及び貸出コミットメントの総額
借入実行残高
差引額
99/116
当事業年度
(2026年3月31日)
49,450百万円
25,390
49,300百万円
33,404
24,059
15,896
EDINET提出書類
日本コークス工業株式会社(E00030)
有価証券報告書
4.財務制限条項
前事業年度(2025年3月31日)
短期借入金のうち22,890百万円(貸出コミットメント契約に基づく借入実行残高)および長期借入金のうち
39,730百万円(一年内返済の長期借入金を含む)には、以下の財務制限条項が付されている。
(1)純資産維持
①短期借入金
連結決算および個別決算において、本決算期の純資産の金額を2018年3月期または直前期のいずれか高
い方の70%以上とすること。
②長期借入金(2019年3月契約分3,000百万円)
連結決算および個別決算において、本決算期の純資産の金額を2018年3月期または直前期のいずれか高
い方の70%以上とすること。
③長期借入金(2022年5月契約分12,544百万円)
連結決算および個別決算において、本決算期の純資産の金額を2021年3月期または直前期のいずれか高
い方の70%以上とすること。
④長期借入金(2024年9月契約分24,186百万円)
連結決算および個別決算において、本決算期の純資産の金額を2024年3月期または直前期のいずれか高
い方の70%以上とすること。
(2)利益維持
連結決算および個別決算において、本決算の営業損益を二期連続マイナスとしないこと。
当事業年度(2026年3月31日)
短期借入金のうち24,304百万円(貸出コミットメント契約に基づく借入実行残高)および長期借入金のうち
32,790百万円(一年内返済の長期借入金を含む)には、以下の財務制限条項が付されている。
(1)純資産維持
①短期借入金
連結決算および個別決算において、本決算期の純資産の金額を2018年3月期または直前期のいずれか高
い方の70%以上とすること。
②長期借入金(2022年5月契約分10,032百万円)
連結決算および個別決算において、本決算期の純資産の金額を2021年3月期または直前期のいずれか高
い方の70%以上とすること。
③長期借入金(2024年9月契約分22,758百万円)
連結決算および個別決算において、本決算期の純資産の金額を2024年3月期または直前期のいずれか高
い方の70%以上とすること。
(2)利益維持
連結決算および個別決算において、本決算の営業損益を二期連続マイナスとしないこと。
財務制限条項について、2026年4月24日付および2026年4月30日付で財務上の特約の内容を変更している。
(1)純資産維持
連結決算および個別決算において、本決算期の純資産の金額を2026年3月期の80%以上とする。
(2)利益維持
連結決算および個別決算において、本決算の営業損益を二期連続マイナスとしないこと。
100/116
EDINET提出書類
日本コークス工業株式会社(E00030)
有価証券報告書
(損益計算書関係)
※1.関係会社との取引高
(自
至
前事業年度
2024年4月1日
2025年3月31日)
(自
至
当事業年度
2025年4月1日
2026年3月31日)
営業取引による取引高
売上高
仕入高
32,381百万円
21,184
37,016百万円
22,115
営業取引以外の取引による取引高
1,000
2,133
※2.販売費に属する費用のおおよその割合は前事業年度68.6%、当事業年度68.0%、一般管理費に属する費用のおお
よその割合は前事業年度31.4%、当事業年度32.0%である。
販売費及び一般管理費のうち主要な費目及び金額は次のとおりである。
(自
至
前事業年度
2024年4月1日
2025年3月31日)
陸上運賃
(自
至
当事業年度
2025年4月1日
2026年3月31日)
552百万円
734
海上運賃
629百万円
727
1,585
1,574
その他販売諸掛
133
102
給料及び賃金
722
758
賞与引当金繰入額
78
66
退職給付費用
64
48
租税公課
296
296
賃借料
162
163
減価償却費
79
116
積揚地諸掛
(有価証券関係)
子会社株式及び関連会社株式(当事業年度の貸借対照表計上額は子会社株式4,274百万円、前事業年度の貸借対照
表計上額は子会社株式4,265百万円)は、市場価格がないことから、時価を記載していない。
101/116
EDINET提出書類
日本コークス工業株式会社(E00030)
有価証券報告書
(税効果会計関係)
1.繰延税金資産及び繰延税金負債の発生の主な原因別の内訳
繰延税金資産
販売用不動産評価損
賞与引当金
退職給付引当金
減価償却超過額
固定資産評価損
減損損失
関係会社株式評価損
環境対策引当金
繰越欠損金
その他
繰延税金資産小計
税務上の繰越欠損金に係る評価性引当額
将来減算一時差異の合計に係る評価性引当額
評価性引当額
繰延税金資産合計
繰延税金負債
その他有価証券評価差額金
繰延ヘッジ損益
繰延税金負債合計
繰延税金資産の純額
前事業年度
(2025年3月31日)
当事業年度
(2026年3月31日)
165百万円
108
725
80
384
708
251
1,248
3,899
1,319
8,893
△3,899
△4,733
△8,632
260
165百万円
93
740
81
384
1,637
251
1,268
6,079
610
11,314
△6,079
△5,137
△11,216
97
△158
△0
△159
101
△312
−
△312
△215
2.法定実効税率と税効果会計適用後の法人税等の負担率との差異の原因となった主な項目別の内訳
前事業年度及び当事業年度は、税引前当期純損失を計上しているため、記載を省略している。
(収益認識関係)
顧客との契約から生じる収益を理解するための基礎となる情報は、連結財務諸表「注記事項(収益認識関
係)」に同一の内容を記載しているため、注記を省略している。
102/116
EDINET提出書類
日本コークス工業株式会社(E00030)
有価証券報告書
(重要な後発事象)
(財務上の特約が付されたコミットメントライン契約の期限変更ならびに財務上の特約の内容の変更について)
当社が締結していた財務上の特約が付されたコミットメントライン契約について、2026年4月24日付でコミッ
ト期間及び財務上の特約の内容を変更している。
本契約の内容
(1)コミットメントライン契約を締結した年月日
2018年12月10日
(2)コミットメントライン契約の相手方の属性
株式会社三井住友銀行をアレンジャーとする金融機関
全14社
(3)コミットメントライン契約に係る総コミット金額及びコミット期間並びに当該債務に付された担保の内容
① 総コミット金額 24,800百万円(2026年3月末借入実行残高24,304百万円)
②
コミット期間(下線部は変更箇所)
(変更前)開始日2018年12月21日
満了日2026年4月30日
(変更後)開始日2018年12月21日
満了日2027年4月30日
③ 担保の内容
無担保
(4)財務上の特約の内容
(変更前) 下線部は変更箇所
①
連結決算および個別決算において、本決算期の純資産の金額を2018年3月期または直前期のいずれか
高い方の70%以上とする。
② 連結決算および個別決算において、本決算期の営業損益を二期連続マイナスとしない。
(変更後)
下線部は変更箇所
①
連結決算および個別決算において、本決算期の純資産の金額を2026年3月期の80%以上とする。
②
連結決算および個別決算において、本決算期の営業損益を二期連続マイナスとしない。
103/116
EDINET提出書類
日本コークス工業株式会社(E00030)
有価証券報告書
(財務上の特約が付された金銭消費貸借契約における財務上の特約の内容の変更について)
当社が締結していた財務上の特約が付された金銭消費貸借契約について、2026年4月30日付で当該財務上の特
約の内容を変更している。
各契約の内容
①2022年5月契約シンジケートローン契約
契約締結日
2022年5月31日
契約の相手方
株式会社三井住友銀行をアレンジャーとする金融機関
元本金額
13,800百万円(2026年3月末残高10,032百万円)
弁済期限
2030年3月29日
担保の内容
無担保
変更前の財務上の特約の内容
(下線部は変更箇所)
①連結決算および個別決算において、本決算期の純資産の金額を
2021年3月期または直前期のいずれか高い方の70%以上とする。
②連結決算および個別決算において、本決算の営業損益を二期連続
マイナスとしない。
変更後の財務上の特約の内容
(下線部は変更箇所)
①連結決算および個別決算において、本決算期の純資産の金額を
2026年3月期の80%以上とする。
②連結決算および個別決算において、本決算の営業損益を二期連続
マイナスとしない。
変更契約締結日
2026年4月30日
全15社
②2024年9月契約シンジケートローン契約(トランシェA,B,C)
トランシェA
トランシェB
株式会社三井住友銀行
をアレンジャーとする
金融機関
全14社
株式会社三井住友銀行
をアレンジャーとする
金融機関
全13社
三井住友信託銀行株式
会社をアレンジャーと
する金融機関
全4社
10,000百万円
(7,858百万円)
10,000百万円
(10,000百万円)
4,900百万円
(4,900百万円)
契約締結日
契約の相手方
元本金額
(2026年3月末残高)
弁済期限
トランシェC
2024年9月25日
2031年9月30日
担保の内容
2028年9月29日
2029年9月28日
無担保
変更前の財務上の特約の内容
(下線部は変更箇所)
①連結決算および個別決算において、本決算期の純資産の金額を2024年3
月期または直前期のいずれか高い方の70%以上とする。
②連結決算および個別決算において、本決算期の営業損益を二期連続マイ
ナスとしない。
変更後の財務上の特約の内容
(下線部は変更箇所)
①連結決算および個別決算において、本決算期の純資産の金額を2026年3
月期の80%以上とする。
②連結決算および個別決算において、本決算期の営業損益を二期連続マイ
ナスとしない。
変更契約締結日
2026年4月30日
104/116
EDINET提出書類
日本コークス工業株式会社(E00030)
有価証券報告書
④【附属明細表】
【有形固定資産等明細表】
当期首残高
(百万円)
当期増加額
(百万円)
当期償却額
(百万円)
当期末残高
(百万円)
減価償却累計額
(百万円)
建物
2,679
147
53
(52)
180
2,592
4,532
構築物
3,836
80
2
(2)
399
3,515
9,928
機械及び装置
34,203
6,098
4,187
(4,095)
4,563
31,551
73,377
土地
33,573
−
153
(74)
−
33,420
−
建設仮勘定
2,356
6,080
6,828
(174)
−
1,608
−
815
327
10
(9)
274
858
1,801
77,465
12,734
11,236
(4,408)
5,417
73,545
89,639
ソフトウエア
380
301
−
(−)
163
518
954
その他
213
144
302
(−)
−
55
7
資産の種類
当期減少額
(百万円)
有形固定資産
その他
有形固定資産計
無形固定資産
302
163
574
962
(−)
(注)1.「当期減少額」欄の( )内は内書きで、減損損失の計上額である。
2.「機械及び装置」及び「建設仮勘定」の「当期増加額」のうち主なものは、配管2系列化に向けた工事によ
るものであり、「当期減少額」のうち主なものは、コークス生産体制最適化によるものである。
無形固定資産計
594
446
【引当金明細表】
科目
当期首残高
(百万円)
当期増加額
(百万円)
当期減少額
(百万円)
当期末残高
(百万円)
貸倒引当金
9
22
0
32
賞与引当金
345
288
345
288
関係会社整理損失引当金
344
−
333
11
環境対策引当金
3,989
332
275
4,045
受注損失引当金
405
134
405
134
105/116
EDINET提出書類
日本コークス工業株式会社(E00030)
有価証券報告書
(2)【主な資産及び負債の内容】
連結財務諸表を作成しているため、記載を省略している。
(3)【その他】
該当事項はない。
106/116
EDINET提出書類
日本コークス工業株式会社(E00030)
有価証券報告書
第6【提出会社の株式事務の概要】
事業年度
4月1日から3月31日まで
定時株主総会
6月中
基準日
3月31日
剰余金の配当の基準日
9月30日
3月31日
単元株式数
100株
単元未満株式の買取り・買増し
取扱場所
株主名簿管理人
(特別口座)
東京都千代田区丸の内一丁目4番1号
三井住友信託銀行株式会社証券代行部
(特別口座)
東京都千代田区丸の内一丁目4番1号
三井住友信託銀行株式会社証券代行部
取次所
買取・買増手数料
――――――
無料
公告掲載方法
電子公告により行う。ただし電子公告によることができない事故その他やむ
を得ない事由が生じたときは、日本経済新聞に掲載して行う。
公告掲載URL https://www.n-coke.com
株主に対する特典
なし
(注)当社定款の定めにより、単元未満株主は、会社法第189条第2項各号に掲げる権利、会社法第166条第1項
の規定による請求をする権利、株主の有する株式数に応じて募集株式の割当ておよび募集新株予約権の割
当てを受ける権利ならびに単元未満株式の買増請求をする権利以外の権利を有さない。
107/116
EDINET提出書類
日本コークス工業株式会社(E00030)
有価証券報告書
第7【提出会社の参考情報】
1【提出会社の親会社等の情報】
当社は、金融商品取引法第24条の7第1項に規定する親会社等はない。
2【その他の参考情報】
当事業年度の開始日から有価証券報告書提出日までの間に次の書類を提出している。
(1) 有価証券報告書およびその添付書類ならびに確認書
事業年度(第22期)(自2024年4月1日
至2025年3月31日)
2025年6月27日関東財務局長に提出
(2) 内部統制報告書およびその添付書類
2025年6月27日関東財務局長に提出
(3) 半期報告書および確認書
(第23期中)(自2025年4月1日
至2025年9月30日)
2025年11月14日関東財務局長に提出
(4) 臨時報告書
2025年6月30日関東財務局長に提出
企業内容等の開示に関する内閣府令第19条第2項第12号(財政状態、経営成績及びキャッシュ・フローの状況に著
しい影響を与える事象の発生)に基づく臨時報告書である。
2025年7月1日関東財務局長に提出
企業内容等の開示に関する内閣府令第19条第2項第9号の2(株主総会における議決権行使の結果)に基づく臨時
報告書である。
2025年11月11日関東財務局長に提出
企業内容等の開示に関する内閣府令第19条第2項第12号及び第19号(財政状態、経営成績及びキャッシュ・フロー
の状況に著しい影響を与える事象の発生)に基づく臨時報告書である。
2026年4月27日関東財務局長に提出
企業内容等の開示に関する内閣府令第19条第2項第12号の5(財務上の特約が付されたコミットメントライン契約
の期限変更ならびに財務上の特約の内容の変更)に基づく臨時報告書である。
2026年4月30日関東財務局長に提出
企業内容等の開示に関する内閣府令第19条第2項第12号の5(財務上の特約が付された金銭消費貸借契約における
財務上の特約の内容の変更)に基づく臨時報告書である。
108/116
EDINET提出書類
日本コークス工業株式会社(E00030)
有価証券報告書
第二部【提出会社の保証会社等の情報】
該当事項はない。
109/116
EDINET提出書類
日本コークス工業株式会社(E00030)
有価証券報告書
独立監査人の監査報告書及び内部統制監査報告書
2026年6月25日
日本コークス工業株式会社
取締役会御中
EY新日本有限責任監査法人
東京事務所
指定有限責任社員
業務執行社員
公認会計士
山村
竜平
指定有限責任社員
業務執行社員
公認会計士
青木
一
<連結財務諸表監査>
監査意見
当監査法人は、金融商品取引法第193条の2第1項の規定に基づく監査証明を行うため、「経理の状況」に掲げられ
ている日本コークス工業株式会社の2025年4月1日から2026年3月31日までの連結会計年度の連結財務諸表、
すなわち、連結貸借対照表、連結損益計算書、連結包括利益計算書、連結株主資本等変動計算書、連結キャッシュ・フ
ロー計算書、連結財務諸表作成のための基本となる重要な事項、その他の注記及び連結附属明細表について監査を行っ
た。
当監査法人は、上記の連結財務諸表が、我が国において一般に公正妥当と認められる企業会計の基準に準拠して、日本
コークス工業株式会社及び連結子会社の2026年3月31日現在の財政状態並びに同日をもって終了する連結会計年度
の経営成績及びキャッシュ・フローの状況を、全ての重要な点において適正に表示しているものと認める。
監査意見の根拠
当監査法人は、我が国において一般に公正妥当と認められる監査の基準に準拠して監査を行った。監査の基準における
当監査法人の責任は、「連結財務諸表監査における監査人の責任」に記載されている。当監査法人は、我が国における職
業倫理に関する規定(社会的影響度の高い事業体の財務諸表監査に適用される規定を含む。)に従って、会社及び連結子
会社から独立しており、また、監査人としてのその他の倫理上の責任を果たしている。当監査法人は、意見表明の基礎と
なる十分かつ適切な監査証拠を入手したと判断している。
110/116
EDINET提出書類
日本コークス工業株式会社(E00030)
有価証券報告書
監査上の主要な検討事項
監査上の主要な検討事項とは、当連結会計年度の連結財務諸表の監査において、監査人が職業的専門家として特に重要
であると判断した事項である。監査上の主要な検討事項は、連結財務諸表全体に対する監査の実施過程及び監査意見の形
成において対応した事項であり、当監査法人は、当該事項に対して個別に意見を表明するものではない。
親会社コークス事業に係る固定資産の減損
監査上の主要な検討事項の内容及び決定理由
監査上の対応
会社は、2026年3月31日現在、連結貸借対照表上、有形
固定資産73,545百万円、無形固定資産574百万円を計上し
ており、総資産の62%を占めている。
注記事項(重要な会計上の見積り)に記載されていると
おり、会社は、当連結会計年度において、親会社である日
本コークス工業株式会社のコークス事業に係る資産グルー
プの固定資産53,262百万円について、全社費用配賦後の
コークス事業営業損益が2期連続赤字であるため減損の兆
候があると判断したが、減損損失の認識の判定において、
当該資産グループから得られる割引前将来キャッシュ・フ
ローの総額がその帳簿価額を上回っていたことから、減損
損失を認識していない。資産グループの継続的使用によっ
て生じる将来キャッシュ・フローの見積りは、取締役会に
よって承認された将来の計画に基づき、計画が策定されて
いる期間を超える期間については過去の趨勢に基づき算定
している。なお、2025年11月取締役会で休止決議を行った
1B、2B炉団については、コークス事業とは異なる独立し
た資産グループに区分し、減損損失4,334百万円を計上し
ている。
割引前将来キャッシュ・フローの見積りにおける主要な
仮定は、注記事項(重要な会計上の見積り)に記載されて
いるとおり、コークス事業における販売数量及び販売価格
である。親会社コークス事業に係る固定資産の減損の認識
の判定は、主に経営者による割引前将来キャッシュ・フ
ローの見積りに基づいており、その基礎となる将来の計画
は、コークスや原料炭の市況動向・需給状況の変動の影響
などの不確実性を伴うものであり、経営者の判断を必要と
することから、当監査法人は当該事項を監査上の主要な検
討事項に該当するものと判断した。
当監査法人は、親会社である日本コークス工業株式会社
のコークス事業に係る資産グループの固定資産の減損損失
の認識の判定における割引前将来キャッシュ・フローの総
額の見積りについて、主として以下の監査手続を実施し
た。
・割引前将来キャッシュ・フローの見積期間について、主
要な資産の経済的残存使用年数と比較した。
・割引前将来キャッシュ・フローの見積りの基礎となる将
来の計画について、取締役会によって承認された直近の予
算との整合性を検討した。
・経営者の計画策定の見積りプロセスの有効性を評価する
ため、過年度の計画と実績を比較した。
・将来の計画に含まれる主要な仮定である親会社コークス
事業における販売数量及び販売価格について、コークスや
原料炭の市況動向・需給状況の変動の影響を含め経営者と
協議するとともに、顧客別販売計画表と照合した。
・将来の計画に含まれる主要な仮定である親会社コークス
事業の販売数量について、過去の生産数量及び生産計画と
比較し、経営者の仮定を評価した。
・将来の計画に含まれる主要な仮定である親会社コークス
事業の既決契約分の販売数量については契約書と照合し、
販売価格について契約書記載の算定方法に基づき作成され
た根拠資料と照合した。
・将来の計画に一定のリスクを反映させた経営者による不
確実性への評価について検討した。
・計画が策定されている期間を超える期間のキャッシュ・
フローについて、経営者と協議を行うとともに、計画との
整合性を検討した。
その他の記載内容
その他の記載内容は、有価証券報告書に含まれる情報のうち、連結財務諸表及び財務諸表並びにこれらの監査報告書以
外の情報である。経営者の責任は、その他の記載内容を作成し開示することにある。また、監査役及び監査役会の責任
は、その他の記載内容の報告プロセスの整備及び運用における取締役の職務の執行を監視することにある。
当監査法人の連結財務諸表に対する監査意見の対象にはその他の記載内容は含まれておらず、当監査法人はその他の記
載内容に対して意見を表明するものではない。
連結財務諸表監査における当監査法人の責任は、その他の記載内容を通読し、通読の過程において、その他の記載内容
と連結財務諸表又は当監査法人が監査の過程で得た知識との間に重要な相違があるかどうか検討すること、また、そのよ
うな重要な相違以外にその他の記載内容に重要な誤りの兆候があるかどうか注意を払うことにある。
当監査法人は、実施した作業に基づき、その他の記載内容に重要な誤りがあると判断した場合には、その事実を報告す
ることが求められている。
その他の記載内容に関して、当監査法人が報告すべき事項はない。
111/116
EDINET提出書類
日本コークス工業株式会社(E00030)
有価証券報告書
連結財務諸表に対する経営者並びに監査役及び監査役会の責任
経営者の責任は、我が国において一般に公正妥当と認められる企業会計の基準に準拠して連結財務諸表を作成し適正に
表示することにある。これには、不正又は誤謬による重要な虚偽表示のない連結財務諸表を作成し適正に表示するために
経営者が必要と判断した内部統制を整備及び運用することが含まれる。
連結財務諸表を作成するに当たり、経営者は、継続企業の前提に基づき連結財務諸表を作成することが適切であるかど
うかを評価し、我が国において一般に公正妥当と認められる企業会計の基準に基づいて継続企業に関する事項を開示する
必要がある場合には当該事項を開示する責任がある。
監査役及び監査役会の責任は、財務報告プロセスの整備及び運用における取締役の職務の執行を監視することにある。
連結財務諸表監査における監査人の責任
監査人の責任は、監査人が実施した監査に基づいて、全体としての連結財務諸表に不正又は誤謬による重要な虚偽表示
がないかどうかについて合理的な保証を得て、監査報告書において独立の立場から連結財務諸表に対する意見を表明する
ことにある。虚偽表示は、不正又は誤謬により発生する可能性があり、個別に又は集計すると、連結財務諸表の利用者の
意思決定に影響を与えると合理的に見込まれる場合に、重要性があると判断される。
監査人は、我が国において一般に公正妥当と認められる監査の基準に従って、監査の過程を通じて、職業的専門家とし
ての判断を行い、職業的懐疑心を保持して以下を実施する。
・不正又は誤謬による重要な虚偽表示リスクを識別し、評価する。また、重要な虚偽表示リスクに対応した監査手続を
立案し、実施する。監査手続の選択及び適用は監査人の判断による。さらに、意見表明の基礎となる十分かつ適切な
監査証拠を入手する。
・連結財務諸表監査の目的は、内部統制の有効性について意見表明するためのものではないが、監査人は、リスク評価
の実施に際して、状況に応じた適切な監査手続を立案するために、監査に関連する内部統制を検討する。
・経営者が採用した会計方針及びその適用方法の適切性、並びに経営者によって行われた会計上の見積りの合理性及び
関連する注記事項の妥当性を評価する。
・経営者が継続企業を前提として連結財務諸表を作成することが適切であるかどうか、また、入手した監査証拠に基づ
き、継続企業の前提に重要な疑義を生じさせるような事象又は状況に関して重要な不確実性が認められるかどうか結
論付ける。継続企業の前提に関する重要な不確実性が認められる場合は、監査報告書において連結財務諸表の注記事
項に注意を喚起すること、又は重要な不確実性に関する連結財務諸表の注記事項が適切でない場合は、連結財務諸表
に対して除外事項付意見を表明することが求められている。監査人の結論は、監査報告書日までに入手した監査証拠
に基づいているが、将来の事象や状況により、企業は継続企業として存続できなくなる可能性がある。
・連結財務諸表の表示及び注記事項が、我が国において一般に公正妥当と認められる企業会計の基準に準拠しているか
どうかとともに、関連する注記事項を含めた連結財務諸表の表示、構成及び内容、並びに連結財務諸表が基礎となる
取引や会計事象を適正に表示しているかどうかを評価する。
・連結財務諸表に対する意見表明の基礎となる、会社及び連結子会社の財務情報に関する十分かつ適切な監査証拠を入
手するために、連結財務諸表の監査を計画し実施する。監査人は、連結財務諸表の監査に関する指揮、監督及び査閲
に関して責任がある。監査人は、単独で監査意見に対して責任を負う。
監査人は、監査役及び監査役会に対して、計画した監査の範囲とその実施時期、監査の実施過程で識別した内部統制の
重要な不備を含む監査上の重要な発見事項、及び監査の基準で求められているその他の事項について報告を行う。
監査人は、監査役及び監査役会に対して、独立性についての我が国における職業倫理に関する規定を遵守したこと、並
びに監査人の独立性に影響を与えると合理的に考えられる事項、及び阻害要因を除去するための対応策を講じている場合
又は阻害要因を許容可能な水準にまで軽減するためのセーフガードを適用している場合はその内容について報告を行う。
監査人は、監査役及び監査役会と協議した事項のうち、当連結会計年度の連結財務諸表の監査で特に重要であると判断
した事項を監査上の主要な検討事項と決定し、監査報告書において記載する。ただし、法令等により当該事項の公表が禁
止されている場合や、極めて限定的ではあるが、監査報告書において報告することにより生じる不利益が公共の利益を上
回ると合理的に見込まれるため、監査人が報告すべきでないと判断した場合は、当該事項を記載しない。
112/116
EDINET提出書類
日本コークス工業株式会社(E00030)
有価証券報告書
<内部統制監査>
監査意見
当監査法人は、金融商品取引法第193条の2第2項の規定に基づく監査証明を行うため、日本コークス工業株式会社
の2026年3月31日現在の内部統制報告書について監査を行った。
当監査法人は、日本コークス工業株式会社が2026年3月31日現在の財務報告に係る内部統制は有効であると表示
した上記の内部統制報告書が、我が国において一般に公正妥当と認められる財務報告に係る内部統制の評価の基準に準拠
して、財務報告に係る内部統制の評価結果について、全ての重要な点において適正に表示しているものと認める。
監査意見の根拠
当監査法人は、我が国において一般に公正妥当と認められる財務報告に係る内部統制の監査の基準に準拠して内部統制
監査を行った。財務報告に係る内部統制の監査の基準における当監査法人の責任は、「内部統制監査における監査人の責
任」に記載されている。当監査法人は、我が国における職業倫理に関する規定(社会的影響度の高い事業体の財務諸表監
査に適用される規定を含む。)に従って、会社及び連結子会社から独立しており、また、監査人としてのその他の倫理上
の責任を果たしている。当監査法人は、意見表明の基礎となる十分かつ適切な監査証拠を入手したと判断している。
内部統制報告書に対する経営者並びに監査役及び監査役会の責任
経営者の責任は、財務報告に係る内部統制を整備及び運用し、我が国において一般に公正妥当と認められる財務報告に
係る内部統制の評価の基準に準拠して内部統制報告書を作成し適正に表示することにある。
監査役及び監査役会の責任は、財務報告に係る内部統制の整備及び運用状況を監視、検証することにある。
なお、財務報告に係る内部統制により財務報告の虚偽の記載を完全には防止又は発見することができない可能性があ
る。
内部統制監査における監査人の責任
監査人の責任は、監査人が実施した内部統制監査に基づいて、内部統制報告書に重要な虚偽表示がないかどうかについ
て合理的な保証を得て、内部統制監査報告書において独立の立場から内部統制報告書に対する意見を表明することにあ
る。
監査人は、我が国において一般に公正妥当と認められる財務報告に係る内部統制の監査の基準に従って、監査の過程を
通じて、職業的専門家としての判断を行い、職業的懐疑心を保持して以下を実施する。
・内部統制報告書における財務報告に係る内部統制の評価結果について監査証拠を入手するための監査手続を実施す
る。内部統制監査の監査手続は、監査人の判断により、財務報告の信頼性に及ぼす影響の重要性に基づいて選択及び
適用される。
・財務報告に係る内部統制の評価範囲、評価手続及び評価結果について経営者が行った記載を含め、全体としての内部
統制報告書の表示を検討する。
・内部統制報告書における財務報告に係る内部統制の評価結果に関する十分かつ適切な監査証拠を入手するために、内
部統制の監査を計画し実施する。監査人は、内部統制報告書の監査に関する指揮、監督及び査閲に関して責任があ
る。監査人は、単独で監査意見に対して責任を負う。
監査人は、監査役及び監査役会に対して、計画した内部統制監査の範囲とその実施時期、内部統制監査の実施結果、識
別した内部統制の開示すべき重要な不備、その是正結果、及び内部統制の監査の基準で求められているその他の事項につ
いて報告を行う。
監査人は、監査役及び監査役会に対して、独立性についての我が国における職業倫理に関する規定を遵守したこと、並
びに監査人の独立性に影響を与えると合理的に考えられる事項、及び阻害要因を除去するための対応策を講じている場合
又は阻害要因を許容可能な水準にまで軽減するためのセーフガードを適用している場合はその内容について報告を行う。
113/116
EDINET提出書類
日本コークス工業株式会社(E00030)
有価証券報告書
<報酬関連情報>
当監査法人及び当監査法人と同一のネットワークに属する者に対する、会社及び子会社の監査証明業務に基づく報酬及
び非監査業務に基づく報酬の額は、「提出会社の状況」に含まれるコーポレート・ガバナンスの状況等(3)【監査の状
況】に記載されている。
利害関係
会社及び連結子会社と当監査法人又は業務執行社員との間には、公認会計士法の規定により記載すべき利害関係はな
い。
以
(注)1.上記の監査報告書の原本は当社(有価証券報告書提出会社)が別途保管している。
2.XBRLデータは監査の対象には含まれていない。
114/116
上
EDINET提出書類
日本コークス工業株式会社(E00030)
有価証券報告書
独立監査人の監査報告書
2026年6月25日
日本コークス工業株式会社
取締役会
御中
EY新日本有限責任監査法人
東京事務所
指定有限責任社員
業務執行社員
公認会計士
山村
竜平
指定有限責任社員
業務執行社員
公認会計士
青木
一
<財務諸表監査>
監査意見
当監査法人は、金融商品取引法第193条の2第1項の規定に基づく監査証明を行うため、「経理の状況」に掲げられ
ている日本コークス工業株式会社の2025年4月1日から2026年3月31日までの第23期事業年度の財務諸表、
すなわち、貸借対照表、損益計算書、株主資本等変動計算書、重要な会計方針、その他の注記及び附属明細表について監
査を行った。
当監査法人は、上記の財務諸表が、我が国において一般に公正妥当と認められる企業会計の基準に準拠して、日本コー
クス工業株式会社の2026年3月31日現在の財政状態及び同日をもって終了する事業年度の経営成績を、全ての重要
な点において適正に表示しているものと認める。
監査意見の根拠
当監査法人は、我が国において一般に公正妥当と認められる監査の基準に準拠して監査を行った。監査の基準における
当監査法人の責任は、「財務諸表監査における監査人の責任」に記載されている。当監査法人は、我が国における職業倫
理に関する規定(社会的影響度の高い事業体の財務諸表監査に適用される規定を含む。)に従って、会社から独立してお
り、また、監査人としてのその他の倫理上の責任を果たしている。当監査法人は、意見表明の基礎となる十分かつ適切な
監査証拠を入手したと判断している。
監査上の主要な検討事項
監査上の主要な検討事項とは、当事業年度の財務諸表の監査において、監査人が職業的専門家として特に重要であると
判断した事項である。監査上の主要な検討事項は、財務諸表全体に対する監査の実施過程及び監査意見の形成において対
応した事項であり、当監査法人は、当該事項に対して個別に意見を表明するものではない。
コークス事業に係る固定資産の減損
連結財務諸表の監査報告書に記載されている監査上の主要な検討事項(親会社コークス事業に係る固定資産の減損)と
同一の内容であるため、記載を省略している。
その他の記載内容
その他の記載内容は、有価証券報告書に含まれる情報のうち、連結財務諸表及び財務諸表並びにこれらの監査報告書以
外の情報である。経営者の責任は、その他の記載内容を作成し開示することにある。また、監査役及び監査役会の責任
は、その他の記載内容の報告プロセスの整備及び運用における取締役の職務の執行を監視することにある。
当監査法人の財務諸表に対する監査意見の対象にはその他の記載内容は含まれておらず、当監査法人はその他の記載内
容に対して意見を表明するものではない。
財務諸表監査における当監査法人の責任は、その他の記載内容を通読し、通読の過程において、その他の記載内容と財
務諸表又は当監査法人が監査の過程で得た知識との間に重要な相違があるかどうか検討すること、また、そのような重要
な相違以外にその他の記載内容に重要な誤りの兆候があるかどうか注意を払うことにある。
115/116
EDINET提出書類
日本コークス工業株式会社(E00030)
有価証券報告書
当監査法人は、実施した作業に基づき、その他の記載内容に重要な誤りがあると判断した場合には、その事実を報告す
ることが求められている。
その他の記載内容に関して、当監査法人が報告すべき事項はない。
財務諸表に対する経営者並びに監査役及び監査役会の責任
経営者の責任は、我が国において一般に公正妥当と認められる企業会計の基準に準拠して財務諸表を作成し適正に表示
することにある。これには、不正又は誤謬による重要な虚偽表示のない財務諸表を作成し適正に表示するために経営者が
必要と判断した内部統制を整備及び運用することが含まれる。
財務諸表を作成するに当たり、経営者は、継続企業の前提に基づき財務諸表を作成することが適切であるかどうかを評
価し、我が国において一般に公正妥当と認められる企業会計の基準に基づいて継続企業に関する事項を開示する必要があ
る場合には当該事項を開示する責任がある。
監査役及び監査役会の責任は、財務報告プロセスの整備及び運用における取締役の職務の執行を監視することにある。
財務諸表監査における監査人の責任
監査人の責任は、監査人が実施した監査に基づいて、全体としての財務諸表に不正又は誤謬による重要な虚偽表示がな
いかどうかについて合理的な保証を得て、監査報告書において独立の立場から財務諸表に対する意見を表明することにあ
る。虚偽表示は、不正又は誤謬により発生する可能性があり、個別に又は集計すると、財務諸表の利用者の意思決定に影
響を与えると合理的に見込まれる場合に、重要性があると判断される。
監査人は、我が国において一般に公正妥当と認められる監査の基準に従って、監査の過程を通じて、職業的専門家とし
ての判断を行い、職業的懐疑心を保持して以下を実施する。
・不正又は誤謬による重要な虚偽表示リスクを識別し、評価する。また、重要な虚偽表示リスクに対応した監査手続を
立案し、実施する。監査手続の選択及び適用は監査人の判断による。さらに、意見表明の基礎となる十分かつ適切な
監査証拠を入手する。
・財務諸表監査の目的は、内部統制の有効性について意見表明するためのものではないが、監査人は、リスク評価の実
施に際して、状況に応じた適切な監査手続を立案するために、監査に関連する内部統制を検討する。
・経営者が採用した会計方針及びその適用方法の適切性、並びに経営者によって行われた会計上の見積りの合理性及び
関連する注記事項の妥当性を評価する。
・経営者が継続企業を前提として財務諸表を作成することが適切であるかどうか、また、入手した監査証拠に基づき、
継続企業の前提に重要な疑義を生じさせるような事象又は状況に関して重要な不確実性が認められるかどうか結論付
ける。継続企業の前提に関する重要な不確実性が認められる場合は、監査報告書において財務諸表の注記事項に注意
を喚起すること、又は重要な不確実性に関する財務諸表の注記事項が適切でない場合は、財務諸表に対して除外事項
付意見を表明することが求められている。監査人の結論は、監査報告書日までに入手した監査証拠に基づいている
が、将来の事象や状況により、企業は継続企業として存続できなくなる可能性がある。
・財務諸表の表示及び注記事項が、我が国において一般に公正妥当と認められる企業会計の基準に準拠しているかどう
かとともに、関連する注記事項を含めた財務諸表の表示、構成及び内容、並びに財務諸表が基礎となる取引や会計事
象を適正に表示しているかどうかを評価する。
監査人は、監査役及び監査役会に対して、計画した監査の範囲とその実施時期、監査の実施過程で識別した内部統制の
重要な不備を含む監査上の重要な発見事項、及び監査の基準で求められているその他の事項について報告を行う。
監査人は、監査役及び監査役会に対して、独立性についての我が国における職業倫理に関する規定を遵守したこと、並
びに監査人の独立性に影響を与えると合理的に考えられる事項、及び阻害要因を除去するための対応策を講じている場合
又は阻害要因を許容可能な水準にまで軽減するためのセーフガードを適用している場合はその内容について報告を行う。
監査人は、監査役及び監査役会と協議した事項のうち、当事業年度の財務諸表の監査で特に重要であると判断した事項
を監査上の主要な検討事項と決定し、監査報告書において記載する。ただし、法令等により当該事項の公表が禁止されて
いる場合や、極めて限定的ではあるが、監査報告書において報告することにより生じる不利益が公共の利益を上回ると合
理的に見込まれるため、監査人が報告すべきでないと判断した場合は、当該事項を記載しない。
<報酬関連情報>
報酬関連情報は、連結財務諸表の監査報告書に記載されている。
利害関係
会社と当監査法人又は業務執行社員との間には、公認会計士法の規定により記載すべき利害関係はない。
以
(注)1.上記の監査報告書の原本は当社(有価証券報告書提出会社)が別途保管している。
2.XBRLデータは監査の対象には含まれていない。
116/116
上