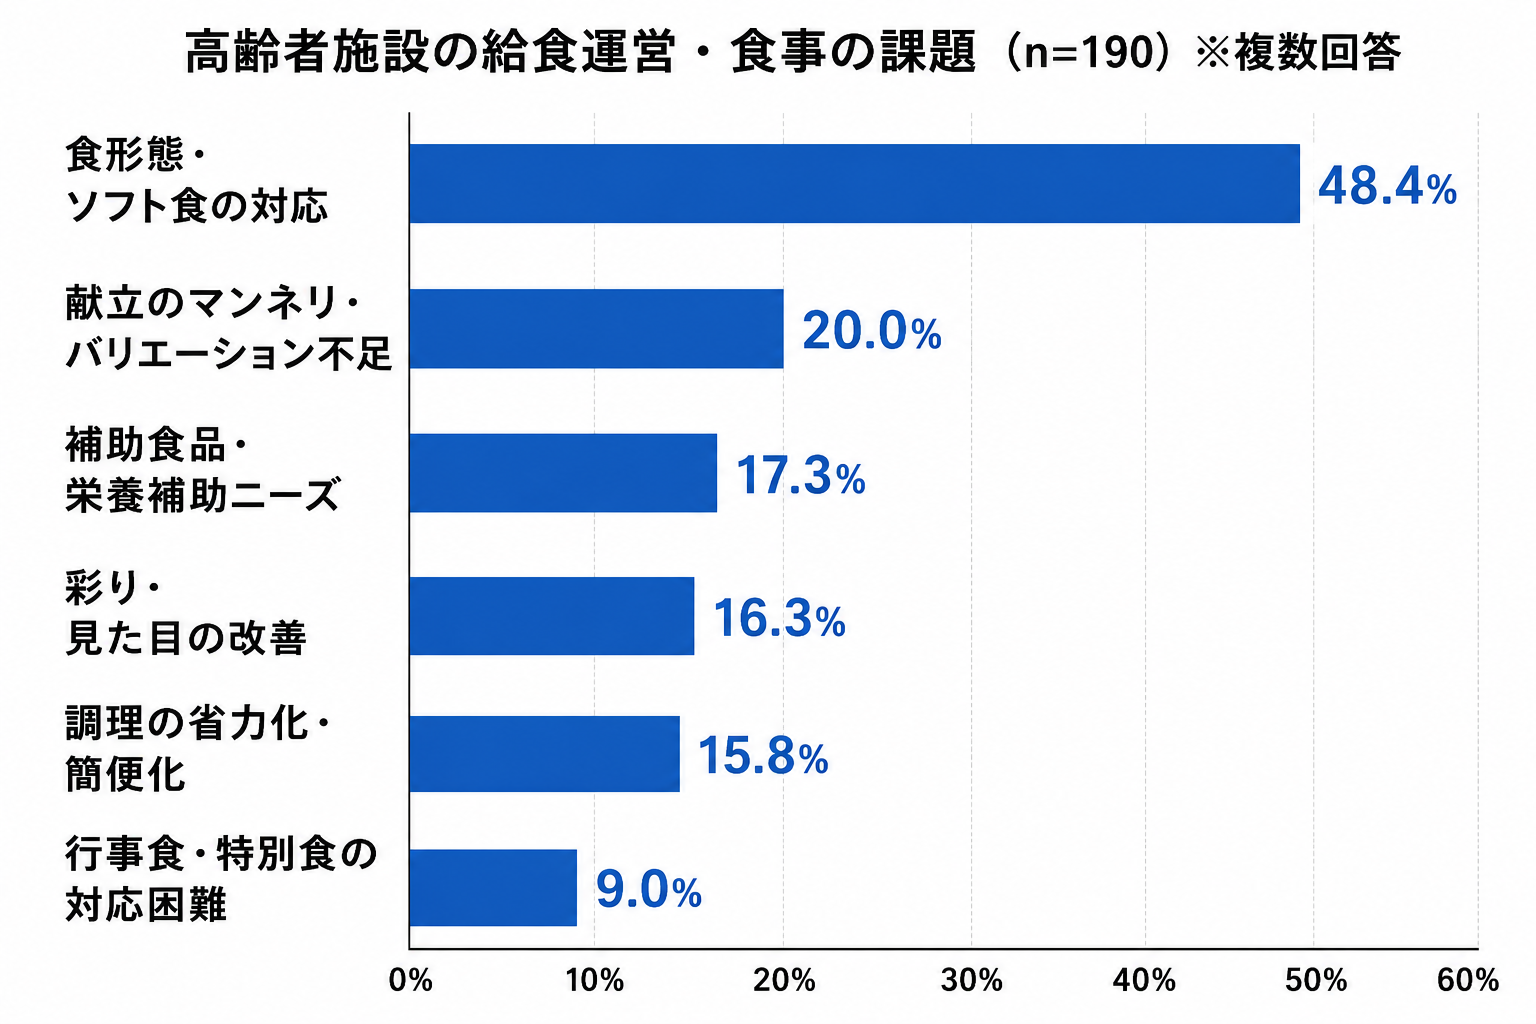
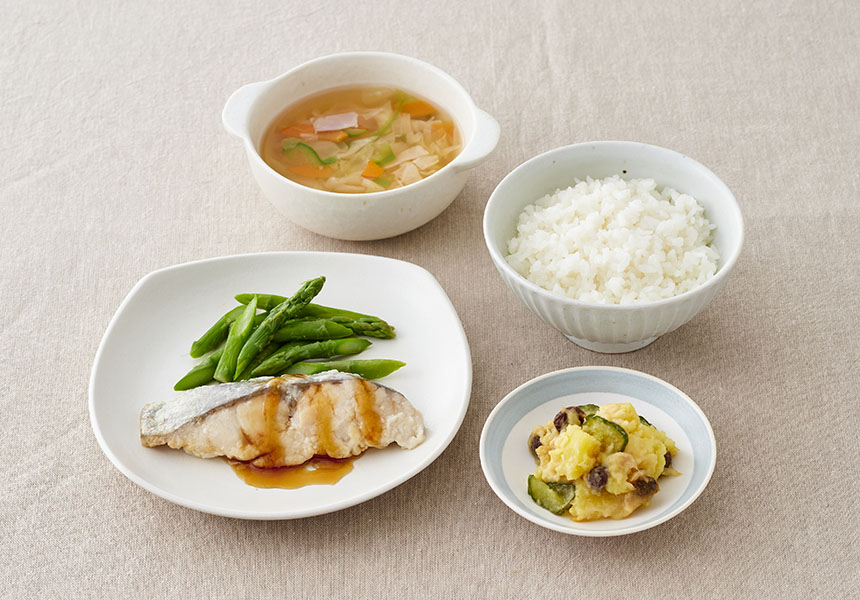
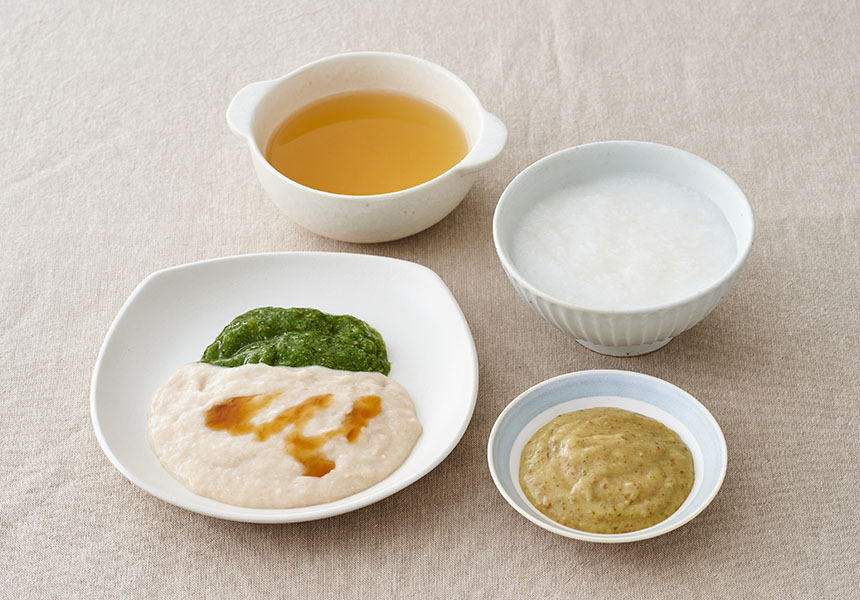
EDINET提出書類 オイシックス・ラ・大地株式会社(E27260) 有価証券報告書 【表紙】 【提出書類】 有価証券報告書 【根拠条文】 金融商品取引法第24条第1項 【提出先】 関東財務局長 【提出日】 2026年6月24日 【事業年度】 第29期(自 【会社名】…
EDINET提出書類
オイシックス・ラ・大地株式会社(E27260)
有価証券報告書
【表紙】
【提出書類】
有価証券報告書
【根拠条文】
金融商品取引法第24条第1項
【提出先】
関東財務局長
【提出日】
2026年6月24日
【事業年度】
第29期(自
【会社名】
オイシックス・ラ・大地株式会社
【英訳名】
Oisix ra daichi Inc.
【代表者の役職氏名】
代表取締役社長
【本店の所在の場所】
東京都品川区大崎一丁目11番2号
【電話番号】
03-6867-1149(代表)
【事務連絡者氏名】
執行役員CFO
【最寄りの連絡場所】
東京都品川区大崎一丁目11番2号
【電話番号】
03-6867-1149(代表)
【事務連絡者氏名】
執行役員CFO
【縦覧に供する場所】
株式会社東京証券取引所
2025年4月1日
髙島
中川
中川
至
2026年3月31日)
宏平
徹哉
徹哉
(東京都中央区日本橋兜町2番1号)
1/131
EDINET提出書類
オイシックス・ラ・大地株式会社(E27260)
有価証券報告書
第一部【企業情報】
第1 【企業の概況】
1 【主要な経営指標等の推移】
(1) 連結経営指標等
回次
第25期
第26期
第27期
第28期
第29期
決算年月
2022年3月
2023年3月
2024年3月
2025年3月
2026年3月
売上高
(百万円)
113,476
115,176
148,408
256,009
251,419
経常利益
(百万円)
4,153
2,810
4,420
6,561
6,840
親会社株主に帰属する
当期純利益
(百万円)
2,727
1,807
4,108
3,638
4,527
包括利益
(百万円)
2,968
2,319
3,378
3,680
4,414
純資産額
(百万円)
23,872
26,140
37,401
39,487
29,069
総資産額
(百万円)
52,634
64,502
143,709
134,564
108,137
1株当たり純資産額
(円)
605.63
672.84
794.83
874.72
786.67
1株当たり当期純利益
(円)
74.64
49.45
112.38
103.13
130.34
潜在株式調整後
1株当たり当期純利益
(円)
74.60
−
−
−
−
自己資本比率
(%)
42.0
38.1
20.2
22.6
25.3
自己資本利益率
(%)
13.2
7.7
15.3
12.2
15.7
株価収益率
(倍)
40.4
46.5
11.6
13.0
10.9
(百万円)
924
5,306
7,722
3,496
9,284
(百万円)
△4,110
△12,135
△10,815
△12,451
2,037
(百万円)
636
8,265
17,735
△1,551
△9,186
(百万円)
13,033
14,720
29,440
18,955
21,091
986
1,032
11,456
11,818
8,196
(799)
(859)
(29,061)
(31,533)
(32,315)
営業活動による
キャッシュ・フロー
投資活動による
キャッシュ・フロー
財務活動による
キャッシュ・フロー
現金及び現金同等物の
期末残高
従業員数
(外、平均臨時雇用者数)
(人)
(注) 1.第26期、第27期、第28期、第29期の潜在株式調整後1株当たり当期純利益については、希薄化効果を有して
いる潜在株式が存在しないため記載しておりません。
2/131
EDINET提出書類
オイシックス・ラ・大地株式会社(E27260)
有価証券報告書
(2) 提出会社の経営指標等
回次
第25期
第26期
第27期
第28期
第29期
決算年月
2022年3月
2023年3月
2024年3月
2025年3月
2026年3月
売上高
(百万円)
101,541
102,821
104,580
100,297
103,193
経常利益
(百万円)
4,036
4,230
5,802
5,745
4,799
当期純利益
(百万円)
2,544
2,605
5,737
3,578
802
資本金
(百万円)
3,994
3,995
3,995
3,995
3,995
38,014,892
38,028,092
38,028,092
38,028,092
36,940,000
発行済株式総数
(株)
純資産額
(百万円)
21,821
24,558
30,367
31,607
32,081
総資産額
(百万円)
48,623
61,722
80,739
72,815
87,502
1株当たり純資産額
(円)
597.12
671.75
830.67
910.01
923.68
1株当たり配当額
(1株当たり中間配当額)
(円)
−
(−)
−
(−)
−
(−)
−
(−)
20.00
(8.00)
1株当たり当期純利益
(円)
69.64
71.27
156.93
101.43
23.10
潜在株式調整後
1株当たり当期純利益
(円)
69.60
−
−
−
−
自己資本比率
(%)
44.9
39.8
37.6
43.4
36.7
自己資本利益率
(%)
12.4
11.2
20.9
11.5
2.5
株価収益率
(倍)
43.3
32.2
8.3
13.2
61.5
配当性向
(%)
−
−
−
−
86.6
785
787
794
800
916
(759)
(829)
(872)
(912)
(955)
従業員数
(外、平均臨時雇用者数)
(人)
株主総利回り
(比較指標:配当込み
TOPIX指数)
(%)
103.4
78.8
44.7
46.0
49.4
(%)
(102.0)
(107.9)
(152.5)
(150.2)
(202.8)
最高株価
(円)
5,220
3,370
3,035
1,710
1,997
最低株価
(円)
2,224
1,411
1,093
1,052
1,014
(注) 1.第26期、第27期、第28期、第29期の潜在株式調整後1株当たり当期純利益については、潜在株式が存在しな
いため記載しておりません。
2.第25期以降の最高・最低株価は、2022年4月3日以前は東京証券取引所市場第一部におけるものであり、
2022年4月4日以降は東京証券取引所プライム市場におけるものであります。
3.株主総利回りの比較指標は、第28期まではTOPIXを使用しておりましたが、比較指標を配当込みTOPIXに変更
しております。
3/131
EDINET提出書類
オイシックス・ラ・大地株式会社(E27260)
有価証券報告書
2 【沿革】
年月
事項
2000年6月
オイシックス株式会社設立
2000年9月
食材の安全性を学識経験者と主婦が監査する第三者機関「食質監査委員会」を設置
2000年10月
食品販売サイト「Oisix(おいしっくす)」を通じた食品宅配事業(EC事業)を開始
2001年7月
乳販店等を通じた食品宅配事業を開始
2002年6月
EC事業において定期購入サービス「おいしっくすくらぶ」を開始
2009年12月
「Oisix香港」をグランドオープンし、海外事業を開始
2010年6月
株式会社リクルート(現株式会社リクルートホールディングス)と資本提携・合弁契約を締結
2010年11月
東京都渋谷区の恵比寿三越店内において実店舗第1号店の営業開始
2011年1月
株式会社リクルート(現株式会社リクルートホールディングス)との合弁会社、株式会社ごちまるが
営業開始
2011年11月
株式会社ウェルネスを株式取得により完全子会社化
2012年4月
株式会社ウェルネスを吸収合併
2013年3月
東京証券取引所「マザーズ市場」に株式を上場
2013年8月
株式会社ディーンアンドデルーカジャパン(現株式会社ウェルカム)と業務資本提携契約を締結
2015年10月
香港への越境EC事業の一部機能を果たす目的で現地子会社 Oisix Hong Kong Co.,Ltd.を設立
2016年5月
シニア向け移動スーパーの仕組みをフランチャイズ方式で提供する株式会社とくし丸を子会社化
2017年3月
農・畜・水産物や無添加の加工食品等を提供する株式会社大地を守る会を株式交換により子会社化
2017年4月
農産物の輸出事業を展開する株式会社日本農業を関連会社化
2017年7月
オイシックスドット大地株式会社に商号変更
2017年9月
中国現地で調達した商品をECにて販売する上海愛宜食食品貿易有限公司を設立
2017年10月
株式会社大地を守る会を吸収合併
2018年2月
農・畜・水産物や無添加の加工食品等を提供するらでぃっしゅぼーや株式会社を子会社化
2018年6月
システム開発及び保守事業を展開するカラビナテクノロジー株式会社を子会社化
2018年6月
運営支援をする株式会社三越伊勢丹ホールディングスの定期宅配EC事業「ISETAN DOOR」開設
2018年7月
オイシックス・ラ・大地株式会社に商号変更
2018年8月
オーダーメイドケータリング事業を行う株式会社CRAZY KITCHENを子会社化
2018年10月
らでぃっしゅぼーや株式会社を吸収合併
2018年12月
米国市場への進出を見据え現地子会社Oisix Inc.を設立
2019年2月
DEAN & DELUCAを運営する株式会社ウェルカムの第三者割当増資を引き受け関連会社化
2019年5月
米国でヴィーガン食の定期宅配事業を展開するThree Limes,Inc.(Purple Carrot)を子会社化
2019年8月
食分野のスタートアップエコシステムの構築活動開始のため、Future Food Fund株式会社を設立
2019年10月
食のスタートアップ投資活性化のため、Future Food Fund1号投資事業有限責任組合を設立
2020年4月
東京証券取引所「市場第一部」へ市場変更
2021年3月
水産品の仕入れ・卸を行う株式会社セブンワーク(現株式会社豊洲漁商産直市場)を子会社化
2022年1月
食に関する研究・開発を行う株式会社Future Food Labを設立
2022年4月
東京証券取引所「プライム市場」へ市場移行
2022年10月
保育園や病院などの施設での食事提供事業等を手がけるシダックス株式会社を関連会社化
2023年1月
Future Food Fund2号投資事業有限責任組合を設立
4/131
EDINET提出書類
オイシックス・ラ・大地株式会社(E27260)
有価証券報告書
年月
事項
2023年3月
旬八青果店を運営する株式会社アグリゲートの第三者割当増資を引き受け関連会社化
2023年11月
株式会社新潟アルビレックス・ベースボール・クラブ(現株式会社新潟プロ野球団)を関連会社
化、スポンサーシップ契約を締結「オイシックス新潟アルビレックス・ベースボール・クラブ」誕生
2024年1月
シダックス株式会社を子会社化
キッチンレス社食を企画・運営する株式会社ノンピ(現 ボンディッシュ株式会社)を子会社化
2024年3月
株式会社アグリゲートを子会社化
2024年5月
株式会社KURKKU FIELDSとの合弁会社である株式会社オイシクルを設立、子会社化
2024年7月
サステナブルなスイーツ開発・ブランド展開を行う株式会社HiOLIを子会社化
2025年9月
シダックスグループ子会社再編により、給食事業および社会サービス事業を担う子会社(ORDフード
サービスホールディングス株式会社、シダックスヒューマン&フードサービス株式会社ほか7社)を
完全子会社化
2025年10月
車両運行サービス事業及びその他事業に分類していたシダックスホールディングス株式会社およびシ
ダックス株式会社、大新東株式会社ほか5社の全株式を譲渡
2026年4月
株式会社CRAZY KITCHENの全株式を子会社であるボンディッシュ株式会社へ譲渡、同社をボンディッ
シュ株式会社の完全子会社化
5/131
EDINET提出書類
オイシックス・ラ・大地株式会社(E27260)
有価証券報告書
3 【事業の内容】
当社グループ(当社及び当社の関係会社)は、当社、連結子会社29社(Three Limes,Inc.(Purple Carrot)、Future
Food Fund株式会社、株式会社とくし丸、シダックスヒューマン&フードサービス株式会社、シダックスコントラクト
フードサービス株式会社、シダックスフードサービス株式会社、エス・ロジックス株式会社、シダックス大新東
ヒューマンサービス株式会社、株式会社HiOLI、株式会社アグリゲート、ボンディッシュ株式会社、株式会社豊洲漁商
産直市場及びその他子会社)及び関連会社3社(株式会社日本農業、株式会社ウェルカム、株式会社新潟プロ野球団)に
より構成されております。
当社、連結子会社及び関連会社は、B2Cサブスク事業、B2Bサブスク事業、社会サービス事業、その他の4つの事業
セグメントに分類されます。なお、当連結会計年度より、報告セグメントの区分を変更しております。詳細は、「第
5
経理の状況
1
連結財務諸表等
(1)連結財務諸表
注記事項(セグメント情報等)」をご参照ください。
1.B2Cサブスク事業
ウェブサイトやカタログを通じてお客様より注文を受け、独自の栽培、生産基準に基づいた環境負荷の少ない高付
加価値の食品(青果物・加工食品・ミールキット)や、日用品や雑貨等を宅配する事業を行っております。
2.B2Bサブスク事業
保育園への食材卸事業と、企業・官公庁・学校・保育園等の食堂における給食や管理業務、病院の入院患者を対象
とした給食や老人保健施設等の給食などの受託運営、学校給食業務の受託運営、外食産業向けに食材販売などを行っ
ております。
3.社会サービス事業
地方自治体からの放課後児童クラブ(学童保育)、図書館、児童館等の施設管理及び運営、並びに民間企業からの
各種アウトソーシングを受託しております。
4.その他
他社EC支援事業や移動スーパー事業、投資事業などが含まれます。
当連結会計年度より、当社グループは、中核事業であるB2Cサブスク事業及びB2Bサブスク事業への経営資源の集中
と最適化を目的として、戦略的な事業運営に即した業績管理区分への見直しを実施し、報告セグメントの区分を変更
しております。
従来、「社会サービス事業」として区分していた学校給食事業は、当社のB2Bサブスクの主要事業である高齢者施
設、保育園、社食等向けの給食事業と事業特性が非常に近似していることから、「B2Bサブスク事業」に区分を変更す
ることといたしました。
6/131
EDINET提出書類
オイシックス・ラ・大地株式会社(E27260)
有価証券報告書
以上の事項を事業系統図によって示しますと、次のとおりであります。
[事業系統図]
7/131
EDINET提出書類
オイシックス・ラ・大地株式会社(E27260)
有価証券報告書
4 【関係会社の状況】
名称
資本金又は
出資金(百万円)
住所
(連結子会社)
Three Limes,Inc.
(The Purple Carrot)
(注)1、2
米国マサチューセッツ
州
16百万
米ドル
主要な事業の
内容
議決権等の
所有割合(%)
米国におけるヴィーガン食
材宅配事業
関係内容
100
(100)
役員の兼任あり
Future Food Fund株式会社
東京都品川区
15
投資事業管理
100
役員の兼任あり
業務委託関係
株式会社とくし丸
徳島県徳島市
10
移動スーパー事業
90
役員の兼任あり
業務委託関係
東京都調布市
100
事業子会社の経営指導及び
間接業務の受託
100
(100)
役員の兼任あり
業務委託関係
東京都調布市
100
企業・学校等の食堂の給食
及び管理業務の受託
100
(100)
役員の兼任あり
事業取引関係
東京都調布市
100
病院や高齢者施設、保育園
等の給食の受託
100
(100)
役員の兼任あり
事業取引関係
エス・ロジックス株式会社
(注)2
東京都調布市
90
外食産業に利用する食材、
消耗品の販売業
100
(100)
役員の兼任あり
事業取引関係
シダックス大新東ヒューマン
サービス株式会社
(注)2
東京都調布市
100
100
(100)
―
株式会社HiOLI(注)2
東京都世田谷区
10
58
(0.2)
役員の兼任あり
株式会社アグリゲート
東京都品川区
10
ボンディッシュ株式会社
東京都千代田区
69
飲食店の経営、キッチンレ
ス社食の運営等
51
株式会社豊洲漁商産直市場
東京都大田区
40
水産品の仕入れ・卸売業
51
シダックスヒューマン&フード
サービス株式会社
(注)2
シダックスコントラクトフー
ドサービス株式会社
(注)2
シダックスフードサービス株
式会社
(注)2
他17社
―
民間企業や地方自治体への
施設管理・運営のアウト
ソーシング受託
アイスクリーム製品、洋菓
子等の製造及び販売事業
農産物、食料品製造販売事
業
―
―
54
―
役員の兼任あり
事業取引関係
役員の兼任あり
事業取引関係
役員の兼任あり
事業取引関係
―
(持分法適用関連会社)
株式会社日本農業
東京都品川区
100
農産物輸出事業
34
役員の兼任あり
株式会社ウェルカム
東京都目黒区
50
小売及び飲食業を通したラ
イフスタイル事業
26
役員の兼任あり
株式会社新潟プロ野球団
新潟県新潟市
100
プロ野球チーム運営
34
役員の兼任あり
事業取引関係
(注) 1.特定子会社に該当しております。なお、その他に含まれる会社のうち特定子会社に該当する会社は次のと
おりです。
Oisix Hong Kong Co.,Ltd.、Oisix Inc.、Future Food Fund1号投資事業有限責任組合、Future Food
Fund2号投資事業有限責任組合、上海愛宜食食品貿易有限公司
2.議決権の所有割合の( )内は、間接所有割合で内数であります。
3.売上高(連結会社相互間の内部売上高を除く)が連結売上高の10%を超える連結子会社の「主要な損益情報
等」は次のとおりであります。
(単位:百万円)
会社名
売上高
経常利益又は
経常損失(△)
当期純利益又は
当期純損失(△)
純資産額
総資産額
シダックスフードサービス株式会社
33,961
△149
△215
△53
7,636
シダックス大新東ヒューマンサービス㈱
58,611
2,036
1,744
1,887
10,984
8/131
EDINET提出書類
オイシックス・ラ・大地株式会社(E27260)
有価証券報告書
第2 【事業の状況】
1 【経営方針、経営環境及び対処すべき課題等】
文中の将来に関する事項は、当連結会計年度末現在において当社グループが判断したものであります。
(1) 経営方針
当社は、企業理念を「これからの食卓、これからの畑」と定め、食に関する社会課題をビジネスの手法で解決す
ることをミッションとしています。お客様に、美味しく楽しく健康的な食生活を送っていただくためにはどうすれ
ば良いかを考え、活動しています。
現在のように不安定な環境におきましては、生活インフラを担うサービスとしての自覚を一層強く持ち、皆様の
お役に立てるよう尽力してまいります。
(2) 経営環境
2025年10月のグループ再編に伴うB2Bサブスク事業(給食事業)の完全子会社化を機に、共通のサブスクリプショ
ンモデルを有するB2Cサブスク事業(食品宅配事業)とB2Bサブスク事業(給食事業)の両事業のシナジー創出を加
速させています。すでに実施した製造、物流、システム、及びコーポレート各部門の統合により、製造ラインの稼
働率向上やDX推進による生産性向上といった効果が着実に現れており、今後は商品開発から調達、製造、物流、そ
して食の提供に至る全工程を一体運営することで、持続的な成長サイクルを確立いたします。
2030年目標に向けては、B2Bサブスク事業(給食事業)における売上高の持続的な成長及び収益性改善による増収
増益を主軸としつつ、B2Cサブスク事業(食品宅配事業)の収益性改善も並行して進めることで、トップラインの拡
大と収益性改善の両立を力強く推進してまいります。
(3) 経営戦略
(B2Bサブスク事業)
国内の給食市場は、約5兆円と非常に大きく、高齢者施設や社食などを中心に安定的に推移している市場です。
一方で、昨今の人材不足や原材料・人件費による利益圧迫により、食の質の低下が懸念されるなか、給食業者の業
績悪化や再編の動きが顕在化しています。
中長期目標に向け、当社は、この市場再編の機会を捉え、ロールアップ型M&Aとオーガニック成長の両輪を推進
し、B2Bサブスク事業の売上高の持続的な成長と収益性の改善に努め、給食業界におけるトップティア入りを実現し
てまいります。
具体的な利益成長アクション
1. 売上高の持続的な成長戦略(M&A/オーガニック):
中長期でB2B領域のM&Aを中心に行う方針に基づき、直近ではシダックスホールディングスのフード事業を完
全子会社化し、コア事業の中核として位置付けています。このようなロールアップ戦略による事業規模の急
拡大と、オーガニック成長の掛け合わせにより、売上高の持続的な成長を目指します。
2. 収益性の改善戦略:
価格適正化の推進と店舗運営の標準化を徹底します。また、B2Cサブスク事業のノウハウを給食事業に展開
し、「タイパ給食モデル」やAI・DXの活用による労務費削減を推進します。中長期的には、「タイパ給食モ
デル」の導入拡大や調達・物流の最適化を通じて成長投資の原資を確保し、収益性を改善することを目指し
ます。
3. B2C知見を活用した商品開発:
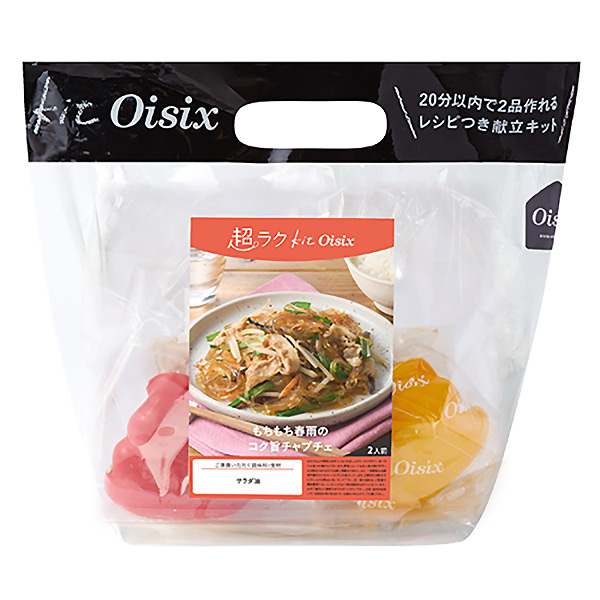
「Kit Oisix」の累計販売2.5億食で培った知見と技術力を、今後の商品開発に最大限活用してまいります。
この開発力を背景に、美味しさと品質を追求した高齢者施設向け完全調理品「元気ごはん」などの展開を強
化し、給食事業の高付加価値化を推進してまいります。
9/131
EDINET提出書類
オイシックス・ラ・大地株式会社(E27260)
有価証券報告書
(B2Cサブスク事業)
国内の食品宅配市場は約3兆円あり、今後も年成長率約3%が予想されており、順調に拡大が見込まれていま
す。一方、当社のマーケットシェアは数%程度であり、グローバルの他社事例を踏まえても、国内事業で引き続き
成長できると考えています。また、食品市場全体におけるEC比率も約4%とまだまだニッチであり、他社サービス
を含めた市場全体の活性化も見込まれています。
当社は、当該市場において、「スペシャリティ」×「サブスクリプション」の領域に特化したサービスを展開し
ており、付加価値が高い商品を生み出す契約生産者とのダイレクトネットワークやお客様インサイトに基づくサー
ビス開発スキル等、当該領域において高い参入障壁を築いており、流通総額でNo.1の地位を確立しています。
具体的な利益成長アクション
中長期目標の実現に向け、国内B2Cサブスク事業では「超ラクKit」「デリOisix」等のサービス・商品の進化を継
続してまいります。商品開発から販売に至るプロセスの細部までたゆまぬ改善を重ね、外部環境の変動に左右され
ない強固な収益基盤の構築を推進し、収益性の改善を目指します。
(4) 優先的に対処すべき事業上の課題
当社グループが認識している優先的に対処すべき事業上の課題は以下のとおりです。
①
お客さまの食ニーズに対する価値提案強化とパーソナライズ化
共働き世帯の増加による時短ニーズに加え、大容量やコスパなど、ライフスタイルや価値観の多様化が拡大して
います。これに対応するため、「超ラクKit」や「たすだけシリーズ」、「デリOisix」など多様なニーズに応える
商品展開を強化するとともに、蓄積されたデータとAIを活用したパーソナライズ型の商品提案を高度化し、顧客体
験(CX)を深化させることが求められています。また、食材費や物流費の高騰が継続する中、独自性のある商品提
案による顧客生涯価値(LTV)の最大化と、製造工程の内製化などのオペレーション改善による収益性の向上を両立
させていく必要があります。
②
ロールアップ型M&Aの推進と給食業界の構造的な収益力改善
国内給食市場は安定推移しているものの、深刻な人材不足や食材費・人件費の高騰により、給食業者の業績悪化
や破綻が顕在化しています。当社は、ロールアップ型M&Aとオーガニック成長の両輪で事業規模を拡大し、業界にお
いてトップティア入りを目指します。具体的には、B2C事業で培った商品開発ノウハウを活かした高齢者施設向け完
全調理品「元気ごはん」や業務用ミールキットの導入により、省人化と高付加価値を両立する「タイパ給食モデ
ル」を展開します。さらに、AIを活用した献立作成や需要予測、発注・シフト管理の自動化により運営の標準化を
推進し、収益構造の改善を図ります。
③
持続可能な食の未来の実現
世界的な気候変動や食品廃棄の増加、労働力不足など食を取り巻く課題が深刻化する中、持続可能な食の未来の
実現に向け、環境、サプライチェーン、人的資本に関する課題に対応していく必要があります。
環境面では、サプライチェーン全体での温室効果ガス削減、PB商品への環境配慮型素材の導入や食品廃棄物のリ
サイクル推進による資源循環、さらに未利用・低利用原料の活用による川上の食品ロス削減に注力いたします。
サプライチェーン面では、主要サプライヤーへの行動規範浸透や人権デューデリジェンス体制の構築を基盤と
し、代替タンパク質をはじめとする新たなサステナブル食材の研究開発を進め、生産者と共生する安定した食のイ
ンフラを構築してまいります。
人的資本面では、これらを推進する基盤として、専門職を含む女性管理職登用の推進やエンゲージメントの向上
を図り、多様な人材がその能力を最大限に発揮しイノベーションを創出できる組織文化の醸成と人的資本の強化に
努めます。
(5) 経営上の目標の達成状況を判断するための客観的な指標
当社グループが上記の経営戦略の達成を判断するため重視している経営指標は、売上高、EBITDA(営業利益+減
価償却費+のれん償却額)、1株当たり当期純利益とそれぞれの成長率であります。また、B2Bサブスク事業及びB2C
サブスク事業の成長性・収益性に関する指標として、両事業の売上高、EBITDAマージンに加え、Oisix会員数(B2C
サブスク事業)や契約施設数(B2Bサブスク事業)等を重視しております。
10/131
EDINET提出書類
オイシックス・ラ・大地株式会社(E27260)
有価証券報告書
2 【サステナビリティに関する考え方及び取組】
当社グループのサステナビリティに関する考え方及び取組は、次のとおりであります。なお、文中の将来に関する事
項は、当連結会計年度末現在において当社グループが判断したものであります。
(1)サステナビリティ全般
当社グループは、企業理念「これからの食卓、これからの畑」の下、食に関する社会課題をビジネスの手法で解決す
ることで、持続可能な社会の実現を目指しています。当社グループの事業は、豊かな地球環境の上に成り立っており、
取引先を含むサプライチェーン全体でESGの取組を推進することが、事業の成長や企業価値の向上に資すると認識してお
ります。当社グループは、事業への影響と社会・環境への影響の観点から、重要な6項目のマテリアリティを特定しま
した。
2026年2月には、かねてよりフードロス削減やGHG排出量削減に取組んでいたグリーン戦略室と人材の多様性に関する
取組を行っていたダイバーシティ・エクイティ&インクルージョン委員会を統合し、グループのサステナビリティ活動
全般の推進を担うグループESG委員会を発足しました。グループESG委員会は取締役会の諮問機関として、サステナビリ
ティに関わる経営基本方針の検討及び目標や施策の策定等を実施しており、グループESG委員会を中心にグループ横断で
更なる企業価値の向上に向けた取組を推進しております。
当社グループのサステナビリティに関する考え方及び個々の取組につきましては、当社のサステナビリティページ
(https://www.oisixradaichi.co.jp/sustainability/)をご参照ください。
①ガバナンス
当社グループは、サステナビリティ課題への対応を経営における重要課題の一つであると認識し、取締役会にお
いてサステナビリティに関するグループポリシーの承認、重要課題(マテリアリティ)の特定を実施しておりま
す。グループESG委員会は、代表取締役社長が委員長を務め、サステナビリティ関連の目標設定及び進捗状況の管
理、気候変動やグループの中長期的なESG課題に対する戦略の立案、重要課題(マテリアリティ)の選定、サステナ
ビリティ関連リスク・機会の分析等を行っております。監査役、社外取締役もアドバイザーとして関与するととも
に、委員会での議事内容については年2回、取締役会及び経営会議への報告を行う体制を整備し、経営レベルで監
督が行われています。また各事業及びグループ会社の経営管理責任者をESG責任者に任命し、委員会にてサステナビ
リティ関連取組の進捗報告を実施しています。
リスク管理委員会は、グループESG委員会と協働でサステナビリティ関連リスク・機会の分析を行っており、特に
事業影響が大きいリスクについて、対策の立案、社内へのリスク教育を実施し、四半期に1回経営会議への報告を
行っております。
②戦略
当社グループは、「食に関する社会課題を、ビジネスの手法で解決すること」をミッションとしています。その
達成のために、「より多くの人が、よい食生活を楽しむことができるような商品・サービスの開発」や「よい食を
作る生産者が報われ、誇りを持てる仕組みの構築」に取り組み、持続可能な社会の実現を目指しています。
これらの価値観に基づき、「環境負荷の低減と資源循環の推進」「持続可能な食のインフラ構築と生産者共生」
「食のインフラを通じた地域課題の解決とコミュニティの共創」「『美味しく、楽しい食卓』を通じたウェルビー
イングの実現」「多様な人材の活躍と人的資本の強化」「透明性の高いグループガバナンスと強靭な経営基盤の構
築」の6つをマテリアリティとして特定しました。
③リスク管理
当社グループでは、リスク管理委員会を中心にグループ全体のリスクマネジメントを行っております。サステナ
ビリティ関連のリスクと機会については、グループESG委員会と協働して戦略の立案、推進、進捗管理を行っており
ます。
11/131
EDINET提出書類
オイシックス・ラ・大地株式会社(E27260)
有価証券報告書
④指標及び目標
6つのマテリアリティに関する主な取組は以下の通りです。
マテリアリティ
取組
2030年度目標
環境負荷の低減と資源循環の推進
GHG排出量の削減
‐拠点(※1)での再生可能エネル
ギー使用率50%以上
資源(プラスチック、食品ロス)の ‐PB商品(※2)で使用する資材の
循環
環境配慮型素材(バイオマス・生
分解性・リサイクル素材・紙等)
導入率50%以上
‐食品廃棄物のリサイクル率70%
川上の食品ロス削減(※3)
‐川上のフードロス削減貢献量
2020年度比200%
持続可能な食のインフラ構築と生産
持続可能な調達
‐生産者やスタートアップと協働
者共生
し、メタン低減飼料を活用した畜
産モデルの実装や、代替タンパク
など新たなサステナブル食材の研
究開発を推進する
責任あるサプライチェーンマネジメ ‐主要サプライヤー(※4)のサプ
ント
食のインフラを通じた地域課題の解
ライヤー行動規範同意署名率100%
買い物アクセス制約の削減・解消
‐移動販売(※5)を通じた買い物
決とコミュニティの共創
アクセス制約の解消数30万人
被災地・復興支援エリアからの持続 ‐定量目標はなし
的な食材調達
「美味しく、楽しい食卓」を通じ
TABLE FOR TWO(※6)、WeSupport ‐ 未来 の 子 ど も へ の 延 べ 支援人数
た、ウェルビーイングの実現
Family(※7)等の取組を通じた未
1,000万人
来の子どもへの支援推進
食を通じた社会的つながりの促進
‐継続的な食育活動、食体験機会の
提供
多様な人材の活躍と人的資本の強化
活躍人材の育成及びDE&Iの推進
‐女性管理職(※8)比率50%以上
(国内グループ連結)
‐DE&Iサーベイの肯定回答率80%以
上(国内グループ連結)
透明性の高いグループガバナンスと
重大なコンプライアンス違反・情報 ‐毎年度発生0件(グループ連結)
強靭な経営基盤の構築
漏洩件数
※1 国内の事業所及び事務所
※2 国内B2Cの3ブランド(Oisix、大地を守る会、らでぃっしゅぼーや)のプライベートブランド商品
※3 生産地や製造元で発生するフードロスを「川上のフードロス」と定義
※4 PB商品の製造委託先のうち、年間取引額が上位10社以内のサプライヤー
※5 連結子会社である株式会社とくし丸の移動販売事業
※6 開発途上国の子どもたちに学校給食を届けるための寄付がついた商品を販売する取組
※7 困窮するひとり親家庭の食支援を行うフードバンク・プラットフォーム
※8 課長職・店長職相当以上の役職者
(2)環境・気候変動への取組
①ガバナンス
「(1)サステナビリティ全般
①ガバナンス」をご参照ください。
12/131
EDINET提出書類
オイシックス・ラ・大地株式会社(E27260)
有価証券報告書
②戦略
当社グループの事業は、豊かな自然環境の上に成り立っており、気候変動をはじめとする自然環境の変化は当社
グループの業績に様々な影響を及ぼします。このため、当社ではTCFD(気候関連財務情報開示タスクフォース)の
提言を踏まえ、シナリオ分析を実施しました。
気候変動については、2100年に産業革命前から1.5℃気温が上昇するシナリオ(1.5℃シナリオ)と、4℃上昇す
るシナリオ(4℃シナリオ)に基づき2030年時点での気候変動によるリスクと機会を検討しました。前提としたシ
ナリオと抽出したリスク、機会は次表のとおりです。
a. 前提としている主なシナリオ
シナリオ
主に参照したシナリオ
1.5℃シナリオ
SSP1-1.9シナリオ(IPCC,2023)
Net Zero Emissions by 2050シナリオ(IEA,2022)
4℃シナリオ
SSP5-8.5(IPCC,2023)
Stated Policyシナリオ(STEPS)(IEA,2022)
b. 気候変動リスクと機会
(リスク)
シナ
リスク分類
リオ
時間軸
炭素税の
中〜
導入
長期
財務影
響領域
コスト
影響度
可能性のある事業インパクト
‐農作物・水産品・畜産品・消耗費等の
1.5℃
4℃
大
小
中
小
大
小
中
小
大
小
小
小
小
小
原材料・仕入れコストが上昇する。
‐工場及び物流・配送のエネルギーコス
トが上昇する。
‐保有車両の見直しの必要性や自社排出
量に対しての費用が発生する。
プ ラ ス
中〜
政策
チック規
長期
と法
制の強化
GHG排出規
コスト
‐プラスチック規制が強化されること
で、包装材における代替素材の開発・
導入が求められコストが上昇する。
中期
制の強化
コスト/ ‐社有車や配送車両の電気自動車へ置き
資産
換えに伴い、転換コストなどの負担が
上昇する。
その他環
短期
境規制の
コスト/ ‐環境関連規制強化への対応による設備
資産
導入・強
移行
投資の増加や、食品安全基準等の見直
しへの対応コストが上昇する。
化
消費者の
中〜
環境志向
長期
収益
‐環境への取組みや非財務情報の開示が
不十分な場合、消費者からの支持が低
の変化
下し、ブランド力の下落や顧客離れに
よる減収が発生する。
エ ネ ル
業界
/
中期
コスト
‐化石燃料を用いたエネルギー調達コス
ギー需給
トが上昇し、原材料・仕入れの生産コ
の変化
ストやガソリン車(現車両)の利用に
よる配送コストが上昇する。
市場
‐再エネ調達需要の高まりにより、再エ
ネ価格や再エネ対応切り替え設備の稼
働価格が上昇する。
投資家の
中〜
評判変化
長期
資本
‐気候変動への取組みや非財務情報の開
示が不十分な場合、優遇金利が適用さ
れず、企業評価が低下する。
13/131
EDINET提出書類
オイシックス・ラ・大地株式会社(E27260)
有価証券報告書
シナ
リオ
リスク分類
時間軸
財務影
響領域
影響度
可能性のある事業インパクト
農・水産
中〜
コスト/ ‐農・水産業がスマート農業等脱炭素モ
業におけ
長期
資産
る生産イ
1.5℃
4℃
大
小
大
小
大
大
小
大
小
大
小
大
中
大
デルに移行するために最新設備等を導
入することでコスト負担が上昇する。
ノ ベ ー
移行
技術
ション
物流・配
中期
送におけ
コスト/ ‐配送車両の電気自動車へ置き換えに伴
資産
い、コスト負担が上昇する。
る イ ノ
ベーショ
ン
異常気象
短〜
の激甚化
長期
コスト
‐集中豪雨や台風によって生産地域の浸
水被害や、物流網の混乱が発生し、商
品の調達ができなくなる。
‐台風等の自然災害による運休の発生等
急性
で売上の減少や車両損傷による補償対
応が増加する。
‐事業所の浸水等により、事業活動が停
止する。
調達・供
長期
給体制へ
コスト/ ‐気候変動による直接的・間接的な収穫
収益
の影響
量の低下により、調達必要量の確保が
難しくなる。
‐需給バランスの調整が難しくなり、欠
品や廃棄処理の増加が懸念される。
‐高温により農作業効率が低下し収穫量
が減少する。
物理
品質への
長期
影響
コスト/ ‐当社グループが設定する水準の品質確
収益
保が難しくなる。
‐顧客への配送時に、冷凍食品を中心に
品質担保が困難になる。
慢性
‐熱中症や食中毒などの発生リスクが高
まり、発生してしまった場合に評判悪
化により売上が減少する。
コスト構
長期
コスト
造への影
‐原材料・資材等の仕入れコストが上昇
する。
響
‐人材不足や操業可能設備不足等からコ
スト負担が上昇する。
消費者の
長期
収益
‐消費者の生活における気候変動への適
食ニーズ
応負担が増加し、食費支出そのものが
全般の変
減少する。
化
※財務影響度の金額イメージ(大:20億円以上、中:1〜20億円、小:1億円未満)
※影響度は、当連結会計年度末現在において取得可能な情報をもとに算定しうる範囲で記載
※定量評価は、2030年時点まで2026年3月期と同様の事業規模拡大が続いていることを前提に評価
14/131
EDINET提出書類
オイシックス・ラ・大地株式会社(E27260)
有価証券報告書
(機会)
分類
炭素税の導入
対応
機会
‐カーボンニュートラルの達成 ‐省エネの積極的な導入によりコスト削減ができ
る。
‐カーボンニュートラル達成により、炭素税の負
担を減らせる。
プラスチック規制の強化
‐商品パッケージのさらなるグ ‐代替プラスチックの新包装材の先行導入により
その他環境規制の導入・強化
‐食品安全基準の強化
‐カーボンフットプリント開示規制の強化によ
‐特定フロン排出抑制
り、自社の優位性の訴求や、その他環境配慮に
リーン化
差異化をはかる。
対する補助金導入による金銭的なメリットを享
受する。
消費者の環境志向の変化
‐アップサイクル食品の販売推 ‐環境志向・ニーズの高まりに的確に対応し、顧
進
客との関係性を構築・向上させることで、ブラ
‐商品パッケージのさらなるグ
ンド力や既存顧客との関係性が強化されるだけ
リーン化
でなく、新たな顧客開拓・既存顧客のロイヤリ
ティ向上へも繋がる。
エネルギー需給の変化
‐省電力化
‐グリーン配送や、省エネ設備の早期導入等によ
‐オフィス・全物流拠点電力に
りコスト負担を抑えられる。
再生エネルギーを導入
農・水産業における生産イノ ‐サプライチェーン全体での持 ‐環境負荷が少ない食材の製造等、フードテック
ベーション
続可能性を高める
の活用・開発促進によりニューフードの市場を
活性化する。
‐冷凍食品、加工生産、可食化技術も含めたイノ
ベーティブな生産、安定供給体制を先行して構
築し差異化をはかる。
物流・配送におけるイノ
‐梱包資材の見直し
ベーション
‐配送車の省エネルギー配送と
EV化の検証
‐配送効率の高い資材の導入により、コスト負担
を抑制する。
‐気候変動に影響を受けにくい配送手段を選択
し、顧客にとって利便性の高い物流・配送体制
を先行して構築する。
15/131
EDINET提出書類
オイシックス・ラ・大地株式会社(E27260)
有価証券報告書
分類
対応
異常気象の激甚化
機会
‐サプライチェーン全体での持 ‐生産地の多様な地理的ポートフォリオにより、
続可能性を高める
局所的な収穫不良時でも商品の安定供給が図れ
‐良質なサプライの拡大
る。
‐ローコストオペレーション、 ‐学童における災害時の緊急連絡サービスの必要
マーケティングノウハウ共有
による収益力改善
調達・供給体制への影響
性が高まり、需要が増加する。
‐トレーサビリティのデータを有効活用し、需給
調整を綿密に実施し、安定供給が図れる。
‐国内外での収穫可能性の拡大を想定し、安定生
産できる栽培、生産方法の確立を後押しする。
品質への影響
‐従来の小売流通基準に満たない原材料(B級品
等)の活用機会を増加させ、顧客にもその価値
を理解してもらうことで、新たな訴求要素を確
立する。
消費者の食ニーズ全般の変化
‐熱中症予防や備蓄可能な食品に対するニーズが
高まる。
‐外出の困難化から宅配そのもののニーズが増加
する。
③リスク管理
気候変動に関するリスク管理は、「(1)サステナビリティ全般
③リスク管理」に記載のとおりです。
④指標及び目標
当社グループは、気候変動リスクと機会への対応の一環として、温室効果ガス排出量、フードロス及び商品資材
の削減に関し、以下の指標及び目標を設定しております。指標及び目標を定める際には、パリ協定やGHGプロトコル
等を参照しております。
◆温室効果ガス排出削減の全社目標(比較対象:2022年3月比)
項目
1
スコープ1、2
2030年3月までの目標
実施内容
2022年3月比で50%以上の削減を継続
・省電力化
・オフィス・全物流拠点電力に再生エネル
ギー導入を推進
2
スコープ3
削減に積極的なサプライヤーを増やして ・バイオ炭等、農業生産でのグリーン化の
いく
推進
・商品パッケージのグリーン化
・食品廃棄物の削減
・食品残渣のリサイクルの促進
16/131
EDINET提出書類
オイシックス・ラ・大地株式会社(E27260)
有価証券報告書
◆温室効果ガス排出量推移
排出量:CO2排出総量[t-COze]
原単位:CO2排出総量原単位(売上高あたり)[t-COze/百万円]
2024年3月期(※4)
項目
排出量
排出量
原単位
2025年3月期(※5)
排出量
排出量
原単位
2026年3月期(※6)
排出量
排出量
原単位
スコープ1(※1)
1,131
16,296
9,864
スコープ2(※2)
43
1,063
3,490
1,174
0.01
17,359
0.07
13,354
0.06
スコープ3(※3)
302,831
384,377
373,463
サプライチェーン排出量
304,005
2.60
401,735
1.60
386,817
1.62
自社排出量
(スコープ1+2)計
(スコープ1+2+3)計
※算定方法:排出量の算定はGHGプロトコルに基づく。
(※1):事業業者自らによる温室効果ガスの直接排出(燃料の燃焼、工業プロセス等)
(※2):他社から供給された電気・熱・上記の使用に伴う間接排出
(※3):スコープ1、スコープ2以外の間接排出(事業者の活動に関連する他社の排出)
※各期のGHG算定における組織境界(バウンダリ)は、算定期初における財務支配力基準を採用し、オイシックス・
ラ・大地株式会社単体及び以下の対象子会社を算定範囲として設定。
(※4):グループ会社(Three Limes,Inc.・株式会社フルーツバスケット・株式会社とくし丸)
(※5):グループ会社(シダックス株式会社及びその子会社、Three Limes,Inc.・株式会社フルーツバスケット・
株式会社とくし丸)
(※6):グループ会社(シダックスコントラクトフードサービス株式会社、シダックスフードサービス株式会社、
エス・ロジックス株式会社、シダックス大新東ヒューマンサービス株式会社)
◆フードロス削減量
品質に問題はないものの、形や色が原因で規格外となってしまい、通常の流通にはのらない野菜を「ふぞろい
Radish」と名付けて販売する取り組みや、見栄えや食感の悪さなどから食品として未活用だった食材をアップサイ
クルし、新しい商品にアップグレードすることをコンセプトとする「Upcycle by Oisix」等ブランド商品の販売を
通じて、川上でのフードロス削減(生産地や製造元で発生するフードロスの削減)に取り組んでいます。
項目
フードロス削減量
2024年3月期
506,654Kg
2025年3月期
525,783Kg
2026年3月期
590,075Kg
◆商品資材の削減
Oisixブランドにおける、リサイクル用紙使用率100%の段ボール活用や可変型段ボールの導入によるプラスチック
緩衝材の削減、Kit Oisix外装へのバイオマス素材の採用やプラスチック包装の最適化(薄肉化、簡易包装)を通
じて、商品資材の削減を推進しています。
項目
プラスチック使用量
2024年3月期
876t
2025年3月期
760t
2026年3月期
764t
※国内B2C 3ブランド(Oisix、大地を守る会、らでぃっしゅぼーや)のPB商品の資材及び商品の配送に要する緩衝
材等の梱包資材をプラスチック使用量として集計。PB商品には、他社OEM品を含む。
17/131
EDINET提出書類
オイシックス・ラ・大地株式会社(E27260)
有価証券報告書
(3)人的資本
①ガバナンス
経営戦略と人材戦略の連動を図るため、人事管掌取締役が執行役員を兼務し戦略の策定から実行までを一貫し
て担う体制を敷いております。また、経営会議が人的資本戦略の実効性及び統制を監督するガバナンス体制を構
築することで、経営への貢献を盤石なものとしています。
具体的には、策定された人的資本戦略は年2回、経営会議に答申することで、執行側全体での共通認識の徹底と
迅速な施策実行を確保しています。また、重要な戦略的事項については、取締役会への報告や提案を行い、社外
取締役の専門的知見を反映させることで、戦略の客観性と実効性を担保しております。
人材育成面においては、経営層との定期的な協議の場を通じて、事業戦略と人材育成方針の整合性を確認し、
施策のPDCAサイクルを回しています。組織及び人事の重要事項に関しても厳格なガバナンスを適用しており、部
室単位以上の組織変更や部長職の異動、部門間異動については、経営会議での決議を必須プロセスとすること
で、全社的な視点に立脚した組織運営の統制を徹底しております。
②戦略
私たちは、「これからの食卓、これからの畑」という企業理念のもと、食に関する社会課題をビジネスの手法
で解決することをミッションとしており、その実現のためには、社員の持続的な成長と活躍及び優秀な人材の確
保が不可欠であると考えています。
人材戦略としては『人が育ち、育てられ、社員が生き生きと働くことが出来る居場所(会社)を創造する!』
というビジョンを掲げ、以下の人材育成方針と環境整備方針を人的資本戦略の主要な柱として推進しています。
<人材育成方針>
1.企業理念の浸透と働きがいの醸成
社員目線での多様性や働きやすさを追求するとともに、企業理念を実現するための7つの行動規範「ORDism
(オーディズム)」の実践を通して会社への貢献を実感できるような仕組みづくりにより、社員の働きがいを醸
成しています。行動規範を体現し、成果を上げたチームや個人を社員総会等で表彰することに加えて、従業員に
向けた経営層によるビデオレター配信、生産者・お客様の話を聞く機会の提供、生産現場への訪問・農作業体験
などを通じて、社員が企業理念や自身の仕事の意義を深く理解できる機会を設けています。
2.中期事業ポートフォリオ戦略と連動した人材育成・獲得
中期事業ポートフォリオ戦略の完遂に向け、内部人材の計画的育成と外部人材の戦略的獲得を推進していま
す。育成に関しては、知識(Off-JT)と経験(OJT)の連動を図りつつ、現場での実践を中核に据えています。例
えば、将来の「エース人材」には、事業インパクトの大きい高難度アサインメントを戦略的に課し、短期間での
飛躍的な成長を促しています。また、経営層と人事による「成長支援会議」を定期開催し、経営戦略に沿った人
員配置や役割付与を実施することで、社員が最大限のパフォーマンスを発揮し、エンゲージメントを高められる
環境を構築しています。あわせて、マネジメントスキル習得プログラムやロジカルシンキングプログラム等の
Off-JTプログラムを連動させることで、個人の自律的な成長を支援しています。加えて経営の重要課題に関して
は、高度な専門性を有する外部人材を機動的に採用し、速やかなオンボーディングを行うことで、迅速に課題を
解決できる体制を整えています。
3.社員の自律的なキャリア支援と活躍人材の創出
当社では社員の自律的なキャリア形成と成長機会の提供を通じた「活躍人材の創出」に注力しています。具体
的には、社外取締役の知見を反映し設計した当社独自の「セルフ・キャリアドック」の仕組みを導入していま
す。2024年3月期より、全年代の社員が5年に1度は受講できる定期的な支援体制を構築し、社内キャリアコンサル
タントによる年齢別のキャリアセミナーや個別面談を実施しています。これらの施策を通じて、社員一人ひとり
のキャリア自律意識を高め、個々の専門性とエンゲージメントの向上を、業績への貢献と持続的な企業価値向上
につなげています。
18/131
EDINET提出書類
オイシックス・ラ・大地株式会社(E27260)
有価証券報告書
<環境整備方針>
持続的な価値創造の源泉は「人材」にあるとの方針を掲げ、社員一人ひとりの属性やライフステージに寄ら
ず、その能力を最大限に発揮できる職場環境づくりを推進しています。ダイバーシティ、エクイティ&インク
ルージョン(DE&I)の観点からは、産前産後・育児休業からの円滑な復職支援に加え、多様性の受容が革新的な
アイデアやサービスの創出につながるという考えのもと、「多様性」をテーマにした社員研修を四半期ごとに実
施しています。また、社員のパフォーマンス維持・生産性の向上を目的として、本社及び各拠点においてオフィ
ス環境の最適化を実施しています。グループアドレス制の導入、WEB会議専用ブースや集中スペースの拡充などを
通じ、社員の心身の健康維持とパフォーマンスの最大化を支援する柔軟なワークスタイルを実現しています。
③リスク管理
当社では、人的資本を中期事業ポートフォリオ戦略の遂行における不可欠な資本と捉え、その毀損を防ぐため
のリスク管理体制を構築しています。人的資本に関するリスクとして、戦略遂行に不可欠な専門人材の獲得遅延
や流出、次世代リーダーの育成停滞に加え、従業員の安全と健康の確保が重要であると認識しています。これら
のリスクは、リスク管理委員会を通じて定期的に特定・評価を行い、重要事案については経営会議及び取締役会
に報告・連携することでガバナンスを効かせています。
特に、事業継続の基盤となる「従業員の安全と健康」については最重要リスクの一つとして位置づけ、以下の
施策を中心にリスクの低減と予防を徹底しています。
<適正な労働時間管理と健康支援>
全社的な勤怠管理システムによるモニタリングとアラート体制により、過重労働を未然に防止しています。ま
た、健康経営の推進に向け、産業医・保健師による面談・指導体制を整備し、社員に対する心身両面からのサ
ポートを強化しています。
<現場での安全衛生の取り組み>
倉庫や生産拠点を含む一定規模の全現場において、リスクアセスメントに基づいた安全衛生委員会を定期的に
開催しています。現場実態に即した、作業環境の継続的な改善と安全教育を徹底することで、労働災害の防止と
安全文化の醸成を図っています。
④指標及び目標
当社では、上記②戦略で掲げた方針に対する成果を測定しPDCAサイクルを回すため、以下の主要指標について
モニタリングを行っています。
人的資本に関する指標
戦略
対象
2024年度
2025年度
2026年度
実績
実績
目標値
キャリア面談実施人数(人数)
人材育成方針
提出会社
120
113
184
DE&Iサーベイ(平均点数)
環境整備方針
提出会社
71.0
73.8
75.9
なお、管理職に占める女性労働者の割合、男性労働者の育児休業取得率及び、男女の賃金の額の差異について
の実績は、「第4 提出会社の状況
5
従業員の状況等
(2) 従業員の状況
④
管理職に占める女性労働者の
割合、男性労働者の育児休業取得率及び労働者の男女の賃金の額の差異」に記載のとおりです。
19/131
EDINET提出書類
オイシックス・ラ・大地株式会社(E27260)
有価証券報告書
3 【事業等のリスク】
有価証券報告書に記載した事業の状況、経理の状況等に関する事項のうち、投資者の判断に重要な影響を及ぼす可
能性のある事項には、以下のようなものがあると考えております。
なお、文中における将来に関する事項は、本書提出日現在において当社グループが判断したものであります。
(1) 事業戦略に関するリスク
リスク項目
リスクの内容・当社グループへの影響
リスクへの対応策
ビジネスモ 当社グループは、B2Cサブスク事業においては、お
当社グループでは、今後もお客様の環境・健康志
デル・競争客様の環境・健康志向が高まる中、有機栽培・特
向の高まりにより、当社が取り扱う高付加価値の
環境につい 別栽培等による青果や安全性を吟味した加工食品
食品市場及び食のEC市場のいずれも、引き続き
て
など高付加価値の食品を、ECを活用した利便性
伸長していくと推測しております。また、給食業
の高いサービスを通じて、より手軽により多くの
界内での合従連衡の進展や官から民への業務のア
お客様に提供しております。
ウトソーシングの加速化など、事業を取り巻く環
食のEC市場においては、ネットスーパーや各地
境は多くの機会も生まれてくると考えておりま
域の生活協同組合等の宅配事業、冷凍弁当などの
す。
宅配サービス事業などを事業領域の近しい業態と
お客様のそれぞれに異なる社会課題に対し、潜在
捉えており、今後、かかる事業者による食品販売
的ニーズをいち早く捉え、ニーズに即した商品・
への一層の注力等により、EC市場の食品分野に
サービスを迅速に展開し、当社サービスでしか出
おける競合が激化する可能性があります。
会うことの出来ない独自性のある商品や体験な
B2Bサブスク事業においては、企業、官公庁、学
ど、新しい価値提案をすることで差別化を図って
校、保育園等の食堂の給食及び管理業務、病院の
まいります。
入院患者を対象とした給食や老人保健施設等の給
食などの受託運営を行っております。
近年、給食業界において、大手企業間での競争が
激しくなっており、価格競争により受託価格が低
下する可能性があります。
また、社会サービス事業では、地方自治体から放
課後児童クラブ(学童保育)、図書館、児童館等
の施設管理及び運営、並びに民間企業から各種業
務を受託しております。
近年、少子高齢化の進展に伴う地方自治体の財政
縮減や民間企業のコスト削減ニーズが高まってい
る中、効率性を高めた事業運営の必要性が増して
おります。
このような環境下において当社が適切な対応を取
ることができない場合、当社グループの事業及び
業績に影響を及ぼす可能性があります。
20/131
EDINET提出書類
オイシックス・ラ・大地株式会社(E27260)
有価証券報告書
リスク項目
リスクの内容・当社グループへの影響
リスクへの対応策
事故の発生当社グループは、B2Cサブスク事業、B2Bサブスク
当社グループでは、重大な事故の発生を未然に防
について
事業において、食材・食事の提供サービスを行っ
止するため、安全に関する法令及び当社グループ
ており、当社グループの衛生管理等に起因する食
が定めた規定・基準・マニュアル等の遵守に努
中毒・異物混入・アレルギー事故などが発生した
め、定期的に内部監査による事業の運営状況の把
場合には、発生拠点における一定期間の営業停止
握を行っております。
や損害賠償責任が発生する可能性があります。
社会サービス事業においては、公共施設の運営管
理業務等を受託しており、施設運営に際して重大
な事故等を発生させてしまった場合には、損害賠
償責任の発生や所管する自治体等からの営業停止
命令等を受ける可能性があります。
また、これらの事象の発生により、当社グループ
に対する信頼低下を招き、当社グループの事業及
び業績に影響を及ぼす可能性があります。
(2) 気候変動に関するリスク
リスク項目
リスクの内容・当社グループへの影響
リスクへの対応策
大規模な風当社グループは、農業、漁業、牧畜業による第一
当社グループでは、取引産地を日本全国各地に分
水害につい 次産業産品を取り扱うことから、大規模な台風、
散するとともに、主要品目については原則として
て
大雨のような風水害が産地を襲った場合、欠品や
複数産地から調達可能な状況とすることにより、
品質劣化等の問題の発生などにより、当社グルー
特定地域の天候悪化による収穫不能・品質劣化時
プの事業及び業績に影響を与える可能性がありま
も別産地から商品の供給ができる体制をとってお
す。また、これらの大規模な風水害が、商品の流
ります。
通・物流に影響を及ぼし、出荷や配達に支障が出
た場合にも、当社グループの事業及び業績に影響
を与える可能性があります。
温室効果ガ 世界的規模で温室効果ガス排出規制や食料廃棄物
当社グループでは、農産物の生産現場や物流拠
ス削減・食削減の取組が行われており、当社グループにおい
点、ラストワンマイルの配送とサプライチェーン
品廃棄物に て対応が遅れた場合、社会的な信用低下を招く可
全体での温室効果ガスの削減を推進しておりま
ついて
能性があります。
す。
また、気候変動に伴う異常気象の増加により、農
また、食品廃棄物の削減についても、不揃い農産
産物などの供給に影響を及ぼす可能性がありま
物の積極的な活用や、ミールキットの販売拡大に
す。
よる家庭でのフードロス削減を推進するなどの施
策を積極的に行ってまいります。
21/131
EDINET提出書類
オイシックス・ラ・大地株式会社(E27260)
有価証券報告書
(3) サプライチェーンに関するリスク
リスク項目
リスクの内容・当社グループへの影響
リスクへの対応策
原材料の品当社グループの取扱商品について、生産者による
当社グループでは、各ブランドが提供する付加価
質について
農薬使用等に関する表示の偽装や品質に関する虚
値やターゲット層により細かな基準は異なるもの
偽の情報提供などが行われる可能性は否定できま
の、いずれの主要ブランドにおいても、独自の取
せん。また食品の放射能汚染問題については、そ
り扱い基準を設定し、産地の特定できる野菜や水
の安全性に関する社会通念上の見解が未だ明確で
産品、畜産物を生産者から直接仕入れておりま
ないことに加え、今後当該問題に関する何らかの
す。農産物は可能な限り農薬や化学肥料を使わず
法規制が設けられた場合、当該法規制が求める対
栽培した作物を、加工品は食品添加物を極力使用
応等が即時に実施できない可能性があります。
しない製品を取り扱っております。また、農産物
これらの事象が発生した場合、行政機関からの指
については産地視察や残留農薬の検査を実施し、
摘や処分、お客様からのクレームや損害賠償等が
加工品等については外部の有識者や第三者機関等
生じる可能性があり、当社グループのブランドイ
を活用した独自の検査体制を設け、さらには仕入
メージの失墜や対外的信用力の低下等により、当
先メーカーの衛生管理指導を行うなど、客観的か
社グループの事業及び業績に影響を及ぼす可能性
つ合理的な品質・安全性の確保に努めておりま
があります。
す。また入社時には品質保証に関する研修を実施
するなど、役職員への教育・啓発活動にも努めて
おります。
物流業務拠当社グループでは、自社運営による物流センター
当社グループでは、有事の際には全国7拠点のう
点の集中に を構え、取扱商品の検品・保管・仕分・梱包と
ち操業可能な拠点を活用する配送オペレーション
ついて
いった物流関連業務を集約しており、主にOisixブ
の調整を行うことにより、お客様への出荷業務を
ランドは神奈川県海老名市と厚木市、大地を守る
最大限継続してまいります。
会ブランドは千葉県習志野市の物流センター、ら
でぃっしゅぼーやブランドは全国4拠点を通して
お客様向けに出荷しております。
これら物流センターが自然災害又は火事などによ
り操業できなくなった場合、従業員の出勤稼働に
影響が出た場合、その他操業に支障が発生した場
合には、在庫の損失や配送遅延、サービス一時停
止などといった事態の発生により、当社グループ
の事業及び業績に影響を与える可能性がありま
す。
物流におけ 当社グループの主力セグメントであるB2Cサブスク
当社グループでは、ラストワンマイルだけではな
るヤマト運事業の売上高の5割強を占めるOisixブランドにお
く、調達物流においても共同でプロジェクトを行
輸株式会社 いては、ヤマト運輸株式会社によってお客様への
うなど、同社との良好な取引関係の維持に努めて
との取引関商品配送を行っておりますが、昨今の物流業界の
おります。
係について
状況に鑑み、同社からの大幅な配送料の値上げ要
請や取引関係の縮小などがあった場合、当社グ
ループの事業及び業績に影響を与える可能性があ
ります。
サ プ ラ イ 当社グループでは、調達から物流、ラストワンマ
当社グループでは、サプライチェーンを構成する
チェーン全 イルにわたり、多くの取引先との協働で事業を展
取引先との密なコミュニケーションにより、共同
体における 開しております。これらのサプライチェーンのい
でインシデント発生の可能性やセキュリティ体制
ガバナンス ずれかにおいて、労働環境に起因する労働災害の
を認識し、協働作業によりリスクの回避や軽減に
について
増加や、人権侵害、不正行為の隠蔽などのコンプ
努め、一方で、保険の活用や契約での免責、解除
ライアンス違反が発生した場合には、当社グルー
条項により、リスクの移転にも努めてまいりま
プの事業及び業績に影響を与える可能性がありま
す。
す。
22/131
EDINET提出書類
オイシックス・ラ・大地株式会社(E27260)
有価証券報告書
(4) 情報セキュリティに関するリスク
リスク項目
リスクの内容・当社グループへの影響
リスクへの対応策
システム障当社グループの食品宅配事業の業務は、Webサイト
当社グループでは、業務管理システムにおいて、
害について
の管理を始め、受注、発注、仕入、在庫、発送、
それぞれ予備系統や予備データの保有機能等の二
売上まで大半の業務が業務管理システムに依存し
重化措置やファイアウォール、ウィルスチェック
ております。しかしながら、想定を超えた受注申
等、外部からの攻撃を回避するための対策などに
込その他のアクセスの急激な増加や、コンピュー
加え、情報セキュリティ統括部門を中心に、CSIRT
タウィルスの侵入、人為的な破壊行為、又は構築
(※)の設置など有事・平時の両面から情報セ
したアプリケーションの不具合等、様々な要因に
キュリティ体制の強化を図っております。
よって当社グループのシステムに障害又は問題が
※Computer Security Incident Response Team
生じた場合、当社グループの事業及び業績に影響
を及ぼす可能性があります。
個人情報の 当社グループは、EC等による商品の販売に際し
当社グループでは、個人情報にかかる取組とし
取り扱いに てお客様の氏名、住所等の申し出を受け、多くの
て、2018年にISMS(※)認証を取得、データの暗号
ついて
個人情報を保有するため、「個人情報の保護に関
化、厳格なアクセスコントロール、並びに外部機
する法律」(個人情報保護法)に規定する個人情
関から定期的にシステム診断を受けること等に努
報取扱事業者に該当します。
めているほか、情報管理規程・マニュアルを制定
当社グループのお客様などの個人情報が社外に漏
し、プログラム作成者の教育訓練及び全社員を対
洩した場合には、損害賠償や社会的な信用失墜等
象とした社内教育を徹底しております。
により当社グループの事業及び業績に影響を及ぼ
※Information Security Management System (情
す可能性があります。
報セキュリティマネジメントシステム):組織に
おける情報資産のセキュリティを管理するための
枠組み。
技術革新へ 当社グループが事業を展開しているEC業界、イ
当社グループでは、技術革新等に伴うサービスモ
の対応につ ンターネット関連業界は、新たな技術革新やサー
デルの変更や新機能等を当社事業に活用するた
いて
め、積極的な対応に努めております。
ビスが次々と登場しており、技術革新等への対応
が遅れた場合や、システム等に関連する投資額や
費用が予想外に増加した場合には、当社グループ
の事業及び業績に影響を及ぼす可能性がありま
す。
23/131
EDINET提出書類
オイシックス・ラ・大地株式会社(E27260)
有価証券報告書
(5) 人材に関するリスク
リスク項目
リスクの内容・当社グループへの影響
リスクへの対応策
経営人材に 当社グループの設立の中心人物であり、事業の推
当社グループでは、同氏に過度に依存しない経営
ついて
進者である代表取締役社長髙島宏平は、経営方針
体制を構築すべく、他の取締役や従業員への権限
や経営戦略等、当社グループの事業活動全般にお
委譲等を進めております。
いて重要な役割を果たしており、同氏に対する当
社グループの依存度は高くなっております。
何らかの理由により同氏の業務遂行が困難となっ
た場合には、当社グループの事業及び業績に影響
を及ぼす可能性があります。
人材 の 確当社グループの属する市場が今後拡大し、競争が
当社グループでは、急激な事業拡大に伴って優秀
保・育成に 激化すれば、競合他社との人材獲得競争も激化
な人材の確保とその育成が重要な課題となってお
ついて
し、当社グループの人材が外部に流出すること
り、内部での人材育成と抜擢及び外部からの人材
や、人材確保に支障を来たすことも想定されま
登用に努めております。また、一部業務について
す。また、今後急激な受注増加などに伴い業務量
は労働集約的な側面があり、恒常的に一定数の従
が急増した場合、人員不足により業務効率の低下
業員を効率的に配置する必要があることから、当
などの事態が発生することも想定されます。この
社グループとしてはその採用と教育に努めており
ような事態が生じた場合、当社グループの事業及
ます。
び業績に影響を与える可能性があります。
(6) 法規制等に関するリスク
リスク項目
リスクの内容・当社グループへの影響
リスクへの対応策
主な法的規当社グループは、主に食品衛生法、食品リサイク
当社グループでは、当該リスクの発生を未然に防
制について
ル法、景品表示法、健康増進法、消費者契約法、
ぐために、倫理規程をはじめとした各種規程・ガ
道路交通法、道路運送法、独占禁止法、労働者派
イドラインを制定し、コンプライアンス推進体制
遣法、及び建築基準法等の規制を受けておりま
の整備、及び年に1回のコンプライアンス研修の
す。これらの法令・規制等を遵守できなかった場
実施をはじめとした、役職員への教育・啓発活動
合には、営業活動の制限・停止等により、当社グ
に努めております。また、役職員がコンプライア
ループの事業及び業績に影響を及ぼす可能性があ
ンス違反を認識した場合には、「企業倫理ホット
ります。
ライン」という内部通報制度を設けており、そこ
で受け付けた内容に基づき、必要な調査・是正措
置を行っております。
24/131
EDINET提出書類
オイシックス・ラ・大地株式会社(E27260)
有価証券報告書
4 【経営者による財政状態、経営成績及びキャッシュ・フローの状況の分析】
(1) 経営成績等の状況の概要
当連結会計年度における当社グループの経営成績及びキャッシュ・フローの状況(以下、「経営成績等」とい
う。)の概要は以下のとおりです。
①
経営成績の状況
(単位:百万円)
前連結会計年度
当連結会計年度
前年同期比増減
増減率
売上高
256,009
251,419
△4,589
△1.8%
売上原価
180,798
177,505
△3,292
△1.8%
販売費及び一般管理費
68,345
66,574
△1,771
△2.6%
営業利益
6,864
7,339
474
6.9%
経常利益
6,561
6,840
279
4.3%
親会社株主に帰属する当期純利益
3,638
4,527
888
24.4%
当連結会計年度のセグメント別業績は以下のとおりです。
(単位:百万円)
売上高
当連結会計
年度
前年同期比
増減
B2Cサブスク
94,286
△2,865
B2Bサブスク
83,385
社会サービス
営業利益又は営業損失(△)
当連結会計
年度
前年同期比
増減
△2.9%
8,265
△1,095
△11.7%
6,809
8.9%
2,908
1,568
117.0%
40,378
3,818
10.4%
1,505
279
22.8%
車両運行サービス
14,584
△12,590
△46.3%
1,369
△560
△29.0%
その他
21,702
563
2.7%
656
△392
△37.5%
調整額
△2,918
△325
12.6%
△7,365
676
△8.4%
合計
251,419
△4,589
△1.8%
7,339
474
6.9%
増減率
増減率
当連結会計年度より、報告セグメントの区分を変更しており、前連結会計年度との比較・分析は変更後の区分
に基づいて記載しております。報告セグメントの区分変更の詳細は、「第5
等
②
(1)連結財務諸表
経理の状況
1
連結財務諸表
注記事項(セグメント情報等)」をご参照ください。
キャッシュ・フローの状況
当連結会計年度のキャッシュ・フローについては、営業活動による9,284百万円の増加、投資活動による2,037
百万円の増加、財務活動による9,186百万円の減少等により、現金及び現金同等物(以下「資金」という。)は
2,136百万円増加したことから、期末残高は21,091百万円となりました。
③
生産、受注及び販売の実績
a.生産実績
当社グループは生産活動を行っていますが、事業全体における重要性が低いため、記載を省略しております。
b.受注実績
当社グループの主な事業は、商品を仕入れてから販売するまでの期間が極めて短期間のため、記載を省略して
おります。
c.販売実績
当連結会計年度における販売実績については「(1)経営成績等の状況の概要
とおりであります。
25/131
①
経営成績の状況」に記載の
EDINET提出書類
オイシックス・ラ・大地株式会社(E27260)
有価証券報告書
(2) 経営者の視点による経営成績等の状況に関する分析・検討内容
経営者の視点による当社グループの経営成績等の状況に関する認識及び分析・検討内容は次のとおりです。
①
財政状態及び経営成績の状況に関する分析・検討内容
a.財政状態及び経営成績
1)
財政状態
(資産合計)
当連結会計年度末における資産合計は108,137百万円となり、前連結会計年度末残高134,564百万円と比較し
て26,426百万円減少しました。
流動資産は53,235百万円となり、前連結会計年度末残高53,246百万円と比較して11百万円減少しました。こ
の主な要因は、現金及び預金2,108百万円の増加、売掛金2,259百万円の減少、未収入金312百万円の増加、その
他流動資産226百万円の減少等によるものです。
固定資産は54,902百万円となり、前連結会計年度末残高81,317百万円と比較して26,414百万円減少しまし
た。この主な要因は、有形固定資産3,629百万円の減少、無形固定資産19,149百万円の減少、投資その他の資産
3,635百万円の減少によるものです。無形固定資産の減少の主な要因は、車両その他の事業の売却に伴う組織再
編の影響等による顧客関連資産の減少11,470百万円、のれんの減少7,106百万円であります。
(負債合計)
当連結会計年度末における負債合計は79,067百万円となり、前連結会計年度末残高95,076百万円と比較して
16,009百万円減少しました。
流動負債は47,913百万円となり、前連結会計年度末残高45,933百万円と比較して1,979百万円増加しました。
この主な要因は、買掛金1,325百万円の減少、未払費用1,178百万円の減少、短期借入金4,060百万円の増加、未
払法人税等1,479百万円の増加等によるものです。
固定負債は31,154百万円となり、前連結会計年度末残高49,143百万円と比較して17,989百万円減少しまし
た。この主な要因は、長期借入金12,344百万円の減少、リース債務1,259百万円の減少、繰延税金負債4,074百
万円の減少等によるものです
(純資産合計)
当連結会計年度末における純資産合計は29,069百万円となり、前連結会計年度末残高39,487百万円と比較し
て10,417百万円減少しました。この主な要因は、親会社株主に帰属する当期純利益4,527百万円、非支配株主持
分の減少7,320百万円、資本剰余金の減少1,596百万円等によるものです。
経営成績
(売上高)
当連結会計年度における売上高は、新規契約数増加によりB2Bサブスク事業の売上は前年比で増加した一方、
2025年10月1日付の車両運行サービス事業及びその他事業売却も踏まえ、全社売上は減少し前連結会計年度と
比較して1.8%減の251,419百万円となりました。
(売上原価)
連結会計年度における売上原価は、B2Cサブスク事業において原材料高騰があった一方、B2Bサブスク事業に
おいて食材費高騰の影響を運営標準化によって吸収したこと等により、前連結会計年度と比較して1.8%減の
177,505百万円となりました。
(販売費及び一般管理費)
当連結会計年度における販売費及び一般管理費は、全社的な収益性改善を推進したこと等により、前連結会
計年度と比較して2.6%減の66,574百万円となりました。
(親会社株主に帰属する当期純利益)
当連結会計年度における親会社株主に帰属する当期純利益は、車両運行サービス事業及びその他事業の売却
益等の営業外収益・特別利益が発生した一方、支払利息や減損損失等の営業外費用・特別損失が発生いたしま
した。また、税務最適化の推進も踏まえ、当初予想を大幅に上回って着地し、前連結会計年度と比較して
24.4%増の4,527百万円となりました。
26/131
EDINET提出書類
オイシックス・ラ・大地株式会社(E27260)
有価証券報告書
b.セグメントごとの経営成績
B2Cサブスク事業では、ウェブサイトやカタログを通じてお客様より注文を受け、独自の栽培、生産基準に基づ
いた環境負荷の少ない高付加価値の食品(青果物・加工食品・ミールキット)や、日用品や雑貨等を宅配する事業
を行っております。
国内においてはインターネットやカタログを通じて主に食品・食材の直販を行い、「Oisix」「大地を守る会」
「らでぃっしゅぼーや」の3ブランドを展開しております。「Oisix」は、共働きの子育て世代を主要ターゲット
とし、プレミアムな時短を実現する商品、サービスを提供しております。「大地を守る会」は、"とことんナチュ
ラル、ひたすら国産"のコンセプトのもと、国産・オーガニックな食材を中心にサービスの磨き上げに注力してお
ります。「らでぃっしゅぼーや」は、料理などの日常生活を通じて社会貢献や生産者応援をしたい世帯を主要
ターゲットとし、「ふぞろいRadish」などの商品、サービス開発を進めております。
海外においては、米国で「Purple Carrot」ブランドを展開しております。「Purple Carrot」は、プラント
ベースを志向し、食生活を通じた健康な生活の実現に関心の高い消費者を主要ターゲットとし、プラントベース
に沿った時短を実現する商品、サービスを提供しております。
「Oisix」においては、会員数が直近2年間は35〜36万人台を推移しており、ARPUは超ラクKitなどを中心とし
た商品・サービスの改善などを背景に堅調に推移いたしましたが、売上高については、会員数が減少し、前年同
期と比べて減収となりました。
セグメント利益については、原材料高騰やマーケティング費用増加により、前年同期と比べて減少しました。
これらの結果、売上高は94,286百万円(前期比2.9%減)となり、セグメント利益については、8,265百万円(前期
比11.7%減)となりました。
B2Bサブスク事業では、保育園への食材卸事業と、企業・官公庁・学校・保育園等の食堂における給食や管理業
務、病院の入院患者を対象とした給食や老人保健施設等の給食などの受託運営、学校給食業務の受託運営、外食
産業向けに食材販売などを行っております。
売上高については、価格適正化および新規契約数増加により、前年同期と比べて増加しました。
セグメント利益については、運営の標準化が順調に進捗し、利益率は前年比で大きく改善し大幅増益となり、
前年同期と比べて増加しました。
これらの結果、売上高は83,385百万円(前期比8.9%増)となり、セグメント利益については、2,908百万円(前期
比117.0%増)となりました。
社会サービス事業では、地方自治体からの放課後児童クラブ(学童保育)、図書館、児童館等の施設管理及び
運営、並びに民間企業からの各種アウトソーシングを受託しております。
売上高については、少子高齢化による人手不足やコストアップの流れを受けた行政サービスの民間への委託の
ニーズをとらえ、前年度から継続して、積極的な提案活動を行っております。特に学童保育事業を中心に、多様
化する子育てニーズに対して様々なコンテンツの提案を行うことで、受託件数を着実に増加させたことにより、
前年同期と比べて増加しました。
セグメント利益については、学童保育事業が好調であることを踏まえ、前年同期と比べて増加しました。
これらの結果、売上高40,378百万円(前期比10.4%増)となり、セグメント利益については、1,505百万円(前期
比22.8%増)となりました。
車両運行サービス事業では、民間企業や地方自治体からの車両運行管理業務のアウトソーシングを受託してお
ります。なお、車両運行サービス事業に分類していた大新東株式会社ほか子会社1社の全株式を譲渡したことに
伴い、連結の範囲から除外したため、2025年4月1日から2025年9月30日までの業績を表示しております。
売上高については、企業の役員向け車両においてWebプロモーションの強化による好調な受注の継続に加え、既
存路線バスの撤退や学校の統廃合によるスクールバス需要等、地方における移動手段ニーズの高まりを捉えた提
案活動の強化による案件の獲得を行いましたが、連結除外の影響により前年同期と比べて減少しました。
セグメント利益については、連結除外の影響により前年同期と比べて減少しました。
これらの結果、売上高は14,584百万円(前期比46.3%減)となり、セグメント利益については、1,369百万円(前
期比29.0%減)となりました。
27/131
EDINET提出書類
オイシックス・ラ・大地株式会社(E27260)
有価証券報告書
その他事業は、他社EC支援事業や移動スーパー事業、投資事業等から構成されております。
売上高は、M&Aにて取得した子会社の寄与などの効果により、前年同期と比べ増加しました。
一方で、セグメント利益については、前年同期と比べ減少しました。
なお、その他事業に分類していたシダックスホールディングス株式会社及びシダックス株式会社ほか子会社4
社の全株式を譲渡したことに伴い、連結の範囲から除外したため、2025年4月1日から2025年9月30日までの業
績を表示しております。
これらの結果、売上高は21,702百万円(前期比2.7%増)となり、セグメント利益については、656百万円(前期比
37.5%減)となりました。
②
キャッシュ・フローの状況の分析・検討内容並びに資本の財源及び資金の流動性に係る情報
a.キャッシュ・フローの状況
当連結会計年度における現金及び現金同等物の期末残高は、前連結会計年度に比べ2,136百万円増加の21,091百
万円となりました。
当連結会計年度における各キャッシュ・フローの状況とそれらの主な要因は次のとおりであります。
(営業活動によるキャッシュ・フロー)
営業活動の結果得られた資金は、9,284百万円(前期比165.6%増)となりました。この主な要因は、税金等調整
前当期純利益7,435百万円、減価償却費4,387百万円、減損損失1,707百万円、のれん償却額1,187百万円があった
一方、関係会社株式売却益2,292百万円、法人税等の支払額1,965百万円、売上債権の増加額1,413百万円等があっ
たことであります。
(投資活動によるキャッシュ・フロー)
投資活動の結果得られた資金は、2,037百万円(前期は使用した資金12,451百万円)となりました。この主な要因
は、連結の範囲の変更を伴う子会社株式の売却による収入3,473百万円、有形固定資産の取得による支出1,104百
万円、無形固定資産の取得による支出771百万円等があったことであります。
(財務活動によるキャッシュ・フロー)
財務活動の結果使用した資金は、9,186百万円(前期比492.0%増)となりました。この主な要因は、長期借入金
の返済による支出20,876百万円、長期借入れによる収入11,020百万円、短期借入金の純増減額による収入4,360百
万円、連結の範囲の変更を伴わない子会社株式の取得による支出1,498百万円等があったことであります。
b.資本の財源及び資金の流動性
1)
財務政策
当社グループは現在、運転資金については、原則として手持資金(利益等の内部留保資金)及び当座貸越契約
に基づく短期借入金により充当しております。また、設備資金については、設備投資計画に基づき、手元資金
で不足が生じる場合は、長期借入金での調達を検討いたします。また、設備投資の案件が継続して発生する、
あるいは大型の案件が発生する場合については、長期的な財務体質の強化を意識し、資金調達を検討いたしま
す。
資金需要
当社グループの事業活動における運転資金需要の主なものは、商品の仕入、お客様へ商品を配送するための
荷造運賃発送費、新規顧客獲得を中心としたマーケティング費用等の営業費用であります。また、設備資金需
要としては、物流センター等の設備の新設・増強による投資、販売管理システムの改修等のソフトウエア開発
による投資等があります。
28/131
EDINET提出書類
オイシックス・ラ・大地株式会社(E27260)
有価証券報告書
③
重要な会計上の見積り及び当該見積りに用いた仮定
当社グループの連結財務諸表はわが国において一般に公正妥当と認められる企業会計基準に基づいて作成して
おります。その作成は、経営者による会計方針の選択・適用、資産・負債及び収益・費用の報告数値に影響を与
える見積りを必要とします。経営者は、これらの見積りについて、過去の実績等を勘案して合理的に見積りを
行っておりますが、見積り特有の不確実性があるため、実際の結果は、これらの見積りと異なる場合がありま
す。
当社及び連結子会社の重要な会計方針は、「第5
記事項
1
連結財務諸表等
(1) 連結財務諸表
注
(連結財務諸表作成のための基本となる重要な事項)」に記載しております。また、重要な会計上の見積
り及び当該見積りに用いた仮定については、「第5
記事項
経理の状況
経理の状況
1
連結財務諸表等
(1) 連結財務諸表
注
(重要な会計上の見積り)」に記載しております。
5 【重要な契約等】
シダックスグループに関する株主間契約の変更にかかる契約
契約締結日
相手先
契約の主な内容
2025年6月26日
志太勤一氏及びエスディーアイ株式会社他、
SDXHD及びシダックス株式会社の会社分割(新
シダックスホールディングス株式会社(以下
設分割)の実施および関連する株式譲渡・譲
「SDXHD」といいます。)の既存株主
受等に関する基本合意
SDXHDの新設分割会社の株式譲受
2025年9月30日
SDXHD
当社保有のSDXHD株式の同社への譲渡
上記契約の履行に伴い、SDXHDとの資本関係が解消したことから、SDXHDの創業家と締結済の2023年11月10日付株主
間契約、及びSDXHDの借入に関連する金融機関との契約については、重要性が低下したため、記載を除外しておりま
す。
6 【研究開発活動】
該当事項はありません。
29/131
EDINET提出書類
オイシックス・ラ・大地株式会社(E27260)
有価証券報告書
第3 【設備の状況】
1 【設備投資等の概要】
当連結会計年度において実施した設備投資等の総額は1,899百万円(リース資産含む)であり、その主なものはB2C
サブスク事業でのシステム関連投資等であります。
なお、当連結会計年度において重要な設備の除却、売却等はありません。
2 【主要な設備の状況】
当社グループにおける主要な設備は、以下のとおりであります。
(1) 提出会社
2026年3月31日現在
帳簿価額
事業所名
(所在地)
セグメントの
設備の内容
名称
本社
(東京都
品川区)
B2Cサブス
ク、B2Bサ
ブスク、各
部門共通
ORD 海老名
ステーショ
ン
(神奈川県
海老名市)
ORD 厚木冷
凍 ス テ ー
ション
(神奈川県
厚木市)
建物
(百万円)
機械及び
装置
(百万円)
工具、器具有形固定資
及び備品
産その他
(百万円)
(百万円)
統括業務
施設
162
75
B2Cサブス
ク
物流施設
438
1,228
B2Cサブス
ク
物流施設
300
1,979
従業員数
(人)
ソフト
ウエア
(百万円)
無形固定資
産その他
(百万円)
合計
(百万円)
6
977
203
1,424
729
(161)
213
9,478
55
11,414
36
(483)
445
7,342
174
10,242
3
(−)
(注) 1.上記の金額には消費税等を含めておりません。
2.従業員数の( )は臨時雇用人員を外書にしております。
3.無形固定資産その他には、商標権、ソフトウエア仮勘定等を含んでおります。
4.現在休止中の主要な設備はありません。
(2) 国内子会社
該当事項はありません。
(3) 在外子会社
該当事項はありません。
3 【設備の新設、除却等の計画】
(1) 重要な設備の新設等
当連結会計年度末現在における重要な設備の新設等の計画は次のとおりであります。
事業所名
(所在地)
本社
(東京都品川区)
セグメント
の名称
設備の
内容
B2C
サブスク
ソフトウエア
開発等
投資予定金額
着手及び完了予定
総額
(百万円)
既支払額
(百万円)
522
―
資金調達方法
着手
自己資金
業務効率化及び
2026年4月 2027年3月 セキュリティ体
制の強化
(2) 重要な設備の除却等
経常的な設備の更新のための除却等を除き、重要な設備の除却等の計画はありません。
30/131
完了
完成後の
増加能力
EDINET提出書類
オイシックス・ラ・大地株式会社(E27260)
有価証券報告書
第4 【提出会社の状況】
1 【株式等の状況】
(1) 【株式の総数等】
① 【株式の総数】
種類
発行可能株式総数(株)
普通株式
71,411,200
計
71,411,200
② 【発行済株式】
種類
事業年度末現在
発行数(株)
(2026年3月31日)
提出日現在
上場金融商品取引所名又は登録
発行数(株)
認可金融商品取引業協会名
(2026年6月24日)
普通株式
36,940,000
36,940,000
東京証券取引所
プライム市場
計
36,940,000
36,940,000
―
(2) 【新株予約権等の状況】
① 【ストックオプション制度の内容】
該当事項はありません。
② 【ライツプランの内容】
該当事項はありません。
③ 【その他の新株予約権等の状況】
該当事項はありません。
(3) 【行使価額修正条項付新株予約権付社債券等の行使状況等】
該当事項はありません。
31/131
内容
権利内容に何ら限定のな
い当社における標準となる
株式であり、単元株式数は
100株であります。
―
EDINET提出書類
オイシックス・ラ・大地株式会社(E27260)
有価証券報告書
(4) 【発行済株式総数、資本金等の推移】
年月日
発行済株式
総数増減数
(株)
発行済株式
総数残高
(株)
資本金増減額
(百万円)
資本金残高
(百万円)
資本準備金
増減額
(百万円)
資本準備金
残高
(百万円)
2021年4月1日〜
2022年3月31日
15,984
38,014,892
1
3,994
1
7,874
(注)1
2022年4月1日〜
2023年3月31日
13,200
38,028,092
1
3,995
1
7,876
(注)2
2025年5月30日
△68,092
37,960,000
−
3,995
−
7,876
(注)3
2026年3月30日
△1,020,000
36,940,000
−
3,995
−
7,876
(注)4
(注) 1.新株予約権の行使
2021年6月23日、2022年6月21日の定時株主総会の決議により発行した新株予約権の行使により、15,984株
増加となりました。
2. 新株予約権の行使
2022年6月21日の定時株主総会の決議により発行した新株予約権の行使により、発行済株式総数が13,200
株、資本金が1百万円、資本準備金が1百万円増加しております。
3. 2025年5月15日の取締役会決議により、2025年5月30日付で自己株式を消却し、発行済株式総数が68,092株
減少し、37,960,000株となっております。
4. 2026年3月26日の取締役会決議により、2026年3月30日付で自己株式を消却し、発行済株式総数が1,020,000
株減少し、36,940,000株となっております。
(5) 【所有者別状況】
2026年3月31日現在
株式の状況(1単元の株式数
区分
政府及び
地方公共
団体
金融機関
金融商品
取引業者
その他の
法人
100株)
外国法人等
個人以外
個人
個人
その他
計
単元未満
株式の状況
(株)
株主数
―
9
20
95
86
37
14,732
14,979
―
(人)
所有株式数
―
52,099
4,988
26,069
118,171
412
167,173
368,912
48,800
(単元)
所有株式数
―
14.12
1.35
7.07
32.14
0.11
45.31
100.00
―
の割合(%)
(注) 自己株式2,207,156株は、「個人その他」に22,071単元、「単元未満株式の状況」に56株含まれております。
32/131
EDINET提出書類
オイシックス・ラ・大地株式会社(E27260)
有価証券報告書
(6) 【大株主の状況】
氏名又は名称
髙島
宏平
東京都品川区
STATE STREET BANK AND TRUST
COMPANY 505001
(常任代理人株式会社みずほ銀行決
済営業部)
日本マスタートラスト信託銀行株式会
社(信託口)
THE BANK OF NEW YORK 133612
(常任代理人株式会社みずほ銀行決
済営業部)
株式会社日本カストディ銀行
(信託口)
THE BANK OF NEW YORK MELLON 140040
(常任代理人株式会社みずほ銀行決済
営業部)
藤田
住所
和芳
株式会社NTTドコモ
4,847,200
13.96
2,922,559
8.41
2,759,900
7.95
2,595,800
7.47
東京都中央区晴海1丁目8−12
2,221,100
6.39
240 GREENWICH STREET,NEW YORK,NY 10286
( 東京都港区港南 2 丁目 15 − 1 品川 イ ン
ターシティA棟)
1,154,300
3.32
東京都杉並区
1,032,516
2.97
東京都千代田区永田町2丁目11−1
1,000,000
2.88
1,000,000
2.88
925,242
2.66
20,458,617
58.9
ONE CONGRESS STREET, SUITE 1, BOSTON,
MASSACHUSETTS
(東京都港区港南2丁目15−1 品川イン
ターシティA棟)
東京都港区赤坂1丁目8番1号赤坂イン
ターシティAIR
BOULEVARD ANSPACH 1, 1000 BRUSSELS,
BELGIUM
( 東京都港区港南 2 丁目 15 − 1 品川 イ ン
ターシティA棟)
NORTHERN TRUST CO. ( AVFC ) RE USL
NON-TREATY CLIENTS ACCOUNT
(常任代理人香港上海銀行東京支店)
東京都千代田区丸の内1丁目9番2号 グラ
ントウキョウサウスタワー
50 BANK STREET CANARY WHARF LONDON E14 5NT,
UK
(東京都中央区日本橋3丁目11−1)
計
―
株式会社リクルート
2026年3月31日現在
発行済株式
(自己株式を
除く。)の
所有株式数
総数に対する
(株)
所有株式数
の割合(%)
(注) 1.日本マスタートラスト信託銀行株式会社、株式会社日本カストディ銀行の所有株式数は、すべて信託業務に
係るものであります。
2.2024年2月21日付で公衆の縦覧に供されている大量保有報告書(変更報告書)において、ベイリー・ギ
フォード・アンド・カンパニー(Baillie Gifford & Co)が2024年2月15日現在で以下の株式を所有している
旨が記載されているものの、当社として議決権行使基準日現在における実質所有株式数の確認ができません
ので、上記大株主の状況には含めておりません。
なお、当該大量保有報告書(変更報告書)の内容は次のとおりであります。
氏名又は名称
住所
ベイリー・ギフォード・アンド・カン
パニー
カルトン・スクエア、1グリーンサイド・ロ
ウ、エジンバラ EH1 3AN スコットランド
保有株券等
の数(千株)
株券等保有
割合(%)
3,536
10.18
3.2025年12月17日付で公衆の縦覧に供されている大量保有報告書(変更報告書)において、グランサム、マ
ヨ、ヴァン オッテルロー アンド カンパニー エルエルシー(Grantham, Mayo, Van Otterloo & Co. LLC)が
2025年12月16日現在で以下の株式を所有している旨が記載されているものの、当社として議決権行使基準日
現在における実質所有株式数の確認ができませんので、上記大株主の状況には含めておりません。
なお、当該大量保有報告書(変更報告書)の内容は次のとおりであります。
氏名又は名称
住所
グランサム、マヨ、ヴァン オッテル
ロー アンド カンパニー エルエル
シー
アメリカ合衆国 マサチューセッツ州
02109, ボストン, ステート・ストリート
53, スイート3300
33/131
保有株券等
の数(千株)
株券等保有
割合(%)
3,528
10.16
EDINET提出書類
オイシックス・ラ・大地株式会社(E27260)
有価証券報告書
(7) 【議決権の状況】
① 【発行済株式】
2026年3月31日現在
区分
株式数(株)
議決権の数(個)
内容
無議決権株式
―
―
―
議決権制限株式(自己株式等)
―
―
―
議決権制限株式(その他)
―
―
―
―
―
完全議決権株式(自己株式等)
完全議決権株式(その他)
単元未満株式
普通株式
2,207,100
普通株式
34,684,100
普通株式
48,800
発行済株式総数
36,940,000
総株主の議決権
―
346,841
―
―
―
―
―
346,841
―
② 【自己株式等】
所有者の氏名
又は名称
オイシックス・ラ・大地
株式会社
所有者の住所
東京都品川区大崎
一丁目11番2号
計
―
自己名義
所有株式数
(株)
他人名義
所有株式数
(株)
2,207,100
―
2,207,100
5.97
2,207,100
―
2,207,100
5.97
2 【自己株式の取得等の状況】
【株式の種類等】
2026年3月31日現在
発行済株式
所有株式数
総数に対する
の合計
所有株式数
(株)
の割合(%)
会社法第155条第7号による普通株式の取得
(1) 【株主総会決議による取得の状況】
該当事項はありません。
(2) 【取締役会決議による取得の状況】
該当事項はありません。
34/131
EDINET提出書類
オイシックス・ラ・大地株式会社(E27260)
有価証券報告書
(3) 【株主総会決議又は取締役会決議に基づかないものの内容】
区分
株式数(株)
価額の総額(円)
当事業年度における取得自己株式
74
116,328
当期間における取得自己株式
44
61,776
(注)
当期間における取得自己株式には、2026年6月1日からこの有価証券報告書提出日までの単元未満株式の買取
りによる株式は含まれておりません。
(4) 【取得自己株式の処理状況及び保有状況】
当事業年度
区分
株式数(株)
引き受ける者の募集を行った
当期間
処分価額の総額
(円)
―
株式数(株)
処分価額の総額
(円)
―
―
―
2,247,978,911
―
―
―
―
―
―
その他
―
―
―
―
保有自己株式数
2,207,156
―
2,207,200
―
取得自己株式
消却の処分を行った取得自己株式
合併、株式交換、株式交付、会社分割
に係る移転を行った取得自己株式
(注)
1,088,092
当期間における保有自己株式には、2026年6月1日からこの有価証券報告書提出日までの単元未満株式の買取
りによる株式は含まれておりません。
3 【配当政策】
当社は、株主に対する利益還元を経営の最重要課題の一つと位置付けております。今後の持続的な成長のための投
資財源の確保及び財務の健全性を維持しつつ、株主還元のさらなる充実を図るため、配当を実施する方針としており
ます。
なお、当社は、剰余金を配当する場合には、期末配当の年1回を基本的な方針としておりますが、中間配当制度を
採用しており、配当の決定機関は、期末配当及び中間配当のいずれも取締役会である旨を定款に定めております。
(注)
基準日が当事業年度に属する剰余金の配当は、以下の通りです。
決議年月日
2025年10月30日
取締役会決議
2026年5月14日
取締役会決議
配当金の総額(百万円)
1株当たり配当額(円)
277
8.00
416
12.00
35/131
EDINET提出書類
オイシックス・ラ・大地株式会社(E27260)
有価証券報告書
4 【コーポレート・ガバナンスの状況等】
(1) 【コーポレート・ガバナンスの概要】
①
コーポレート・ガバナンスに関する基本的な考え方
当社ではコーポレート・ガバナンスを経営統治機能と位置付けており、企業価値を継続的に高めていくための
不可欠な機能であるとの認識に基づき、コーポレート・ガバナンス体制の強化及び充実に努めております。
また、株主を含めた投資市場全体に対する説明責任を果たすべく、迅速かつ適切な情報開示の実施と意思決定
における透明性及び公平性を確保することが極めて重要と考えております。
コーポレート・ガバナンスを支えるコンプライアンスにつきましては、その本質は、その語義に戻って、社会
からの期待に応えることと捉えたうえで、いわゆる法令等の遵守もそれ自体が目的なのではなく、当社の掲げる
事業理念の実現や社会の課題をビジネスで解決していくための前提であり必要手段として考えております。ま
た、そのコンプライアンス体制の徹底により、株主及び事業パートナーをはじめとするステークホルダー(利害関
係者)の信頼を得ることも重要な経営課題と認識しております。
②
企業統治の体制の概要及び当該体制を採用する理由
イ.企業統治の体制の概要
当社は、監査役会設置会社であり、会社法上の機関として、株主総会、取締役会及び監査役会を設置し、任
意の機関として、経営会議及び指名・報酬委員会を設置しております。
a.取締役会
当社の取締役会は、本書提出日現在、取締役9名(うち社外取締役5名)により構成されており、毎月1回
の定例取締役会のほか、必要に応じて臨時取締役会を開催し、重要事項の意思決定をするとともに、相互に
職務の執行を監督しております。取締役会には監査役が毎回出席し、取締役会の業務執行状況の監査を行っ
ております。
議長
:取締役小﨑宏行(定款及び取締役会決議による)
取締役
:髙島宏平、堤祐輔、松本浩平
社外取締役:花田光世、田中仁、渡部純子、櫻井稚子、小脇美里
社外監査役:乙部智佳、諸江幸祐、小久保崇、和田健吾
取締役会における議案は、法令、定款及び社内の決裁権限に係る規定に基づいて上程されております。
なお、決裁権限につきましては、取締役会審議の実効性の観点から権限移譲を進める一方、取締役会決議
事項でない事案も、必要に応じて事前協議事項として取締役会に上程することにより適切な意思決定プロセ
スを図っております。
当事業年度の取締役会においては、グループ内の組織再編、株主還元方針、ESGおよび情報セキュリティ等
に関する議論を行っております。
当事業年度における主な活動状況
出
席
状
況
及
び
発
言
状
況
当事業年度に開催された取締役会13回のうち13回に出席いたしました。
取締役
花田光世
出席した取締役会において、人事・教育に関する学識経験者としての専
門的知識や豊富な経験から適宜発言を行っております。
当事業年度に開催された取締役会13回のうち12回に出席いたしました。
取締役
田中仁
出席した取締役会において、長年の経営者としての幅広い知識と経験か
ら適宜発言を行っております。
当事業年度に開催された取締役会13回のうち13回に出席いたしました。
取締役
渡部純子
出席した取締役会において、ECビジネス及び合弁会社を含む事業体の
運営に関する幅広い知識と経験から適宜発言を行っております。
当事業年度に開催された取締役会13回のうち13回に出席いたしました。
取締役
櫻井稚子
出席した取締役会において、食関連のコンテンツビジネス及びスポーツ
ビジネスに関する幅広い知識と経験から適宜発言を行っております。
36/131
EDINET提出書類
オイシックス・ラ・大地株式会社(E27260)
有価証券報告書
出
席
状
況
及
び
発
言
状
況
当事業年度に開催された取締役会13回のうち13回に出席いたしました。
取締役
出席した取締役会において、マーケティング及びブランディングに関す
小脇美里
る幅広い知識と経験及び生活者・消費者の観点から適宜発言を行ってお
ります。
当事業年度に開催された取締役会13回のうち13回、監査役会18回のうち
監査役
18回に出席いたしました。出席した取締役会及び監査役会において、各
乙部智佳
種会社における管理部門・監査部門に関する幅広い知識と経験から適宜
発言を行っております。
当事業年度に開催された取締役会13回のうち13回、監査役会18回のうち
監査役
18回に出席いたしました。出席した取締役会及び監査役会において、主
諸江幸祐
に企業経営及び投資市場を中心とした幅広い知識と経験から適宜発言を
行っております。
当事業年度に開催された取締役会13回のうち13回、監査役会18回のうち
監査役
18回に出席いたしました。出席した取締役会及び監査役会において、弁
小久保崇
護士及び他社取締役等としての幅広い知識と経験から適宜発言を行って
おります。
当事業年度に開催された取締役会13回のうち12回、監査役会18回のうち
監査役
18回に出席いたしました。出席した取締役会及び監査役会において、公
和田健吾
認会計士及び他社監査役等としての幅広い知識と経験から適宜発言を
行っております。
(注)上記のほか、書面決議を5回行っております。
各取締役の属性及びスキル(専門性、経験、知見等)は、以下のスキルマトリックスに記載の通りとなり
ます。(監査役につきましては、後記(3) 「監査の状況」に記載)
〈役員スキルマトリックス〉
特に顕著なスキルに絞って●で表示
◎委員長〇委員
属
氏名
社外性
独立
役員
髙島宏平
性
スキル(専門性、経験、知見等)
指名・
報酬
委員会
年齢
性別
担務
属性
資格等
〇
52
男
堤祐輔
48
就任
期間
(年)
企業
経営
事業
戦略
営業・マー
ケティング
ESG・サス
ティナ
ビリティ
創業者、
代表、社長
26
●
●
●
●
●
男
創業メンバー、
事業一般管掌
26
●
●
●
●
17
小﨑宏行
73
男
小売事業運営、
管理一般管掌
松本浩平
42
男
プロパー、
経営企画管掌
8
19
花田光世
●
●
◎
77
男
大学教授
(組織人事)
田中仁
●
●
〇
63
男
上場企業経営
11
7
渡部純子
●
●
48
女
情報デジタル事
業運営
櫻井稚子
●
●
53
女
マーケティング
事業運営
8
女
マーケティング
独立事業者
5
小脇美里
●
●
42
●
●
●
37/131
●
●
●
●
●
●
●
●
●
●
●
財務・
会計
●
●
●
●
法務・
リスク
管理
●
●
組織・
人事
●
●
●
EDINET提出書類
オイシックス・ラ・大地株式会社(E27260)
有価証券報告書
〈役員スキルマトリックス〉の補足
1997年の当社創業以来、当社の代表取締役として当社及び当社グループの経営をけん引
髙島宏平
し、当社及び当社グループの経営に関して幅広くかつ深い知見と思いを有しております。
1997年の当社創業メンバーの一人として、当社及び当社グループの運営、経営を担い、当
堤祐輔
社及び当社グループの経営に関して幅広くかつ深い知見と思いを有しております。
当社入社後、小売事業の運営・経営の経験を生かし、また、管理部門も担当して当社の成
小﨑宏行
長を支え、当社及び当社グループの経営に関して幅広くかつ深い知見と思いを有しており
ます。
当社入社後、経営企画系職務を経て取締役に就任し、当社及び当社グループの経営に関し
松本浩平
て幅広くかつ深い知見と思いを有しております。
大学教授としてのアカデミックな観点での人事組織を中心とした企業経営全般に関して幅
広い知見を有しております。また、同氏は当社の取締役をマザーズ上場前から務め、当社
花田光世
の成長の過程をつぶさに知り、他の社外役員とのバランスの中で、今後も当社にとって有
益な助言や意見がいただけることも期待しております。
なお、当社が依拠する東京証券取引所の定める独立性基準に照らし独立役員として届出て
おります。
長年にわたり株式会社ジンズホールディングスの代表取締役を務められており、企業経営
者としての豊富な経験に基づく適切な助言・提言および会社経営の監督を期待しておりま
田中仁
す。
なお、当社が依拠する東京証券取引所の定める独立性基準に照らし独立役員として届出て
おります。
リクルートグループにおいて、デジタルの観点から顧客管理に関するマネジメントについ
て幅広い知見を有しており、当社の経営に対する様々な助言及び意見を期待しておりま
渡部純子
す。
なお、当社が依拠する東京証券取引所の定める独立性基準に照らし独立役員として届出て
おります。
長年にわたる株式会社ABC Cooking Studioでの経験を有し、株式会社NTTドコモにおいては
コンテンツビジネスに関する豊かな知見を有しており、当社の経営に対する様々な助言及
櫻井稚子
び意見を期待しております。
なお、当社が依拠する東京証券取引所の定める独立性基準に照らし独立役員として届出て
おります。
衣食住の生活シーンに係る各種企画立案、コンサルティング、書籍出版等を経験されてお
り、食分野で新しい事業価値の創設を追求する当社にとって有益であり、生活者・消費者
小脇美里
の視点での経験と知見による助言及び意見を期待しております。
なお、当社が依拠する東京証券取引所の定める独立性基準に照らし独立役員として届出て
おります。
b.経営会議
当社は取締役(社外取締役除く)、常勤監査役及び執行役員等各部門責任者による経営会議を原則毎週開催
しており、取締役会に次ぐ意思決定機関として、日常の業務執行の確認や意思決定の迅速化を図っておりま
す。
議
長
取締役
:代表取締役社長髙島宏平
:堤祐輔、小﨑宏行、松本浩平
社外監査役:乙部智佳
執行役員
:山下寛人、菅美沙季、新宮歩、力丸進吾、冨士聡子、東海林園子、小松敦、
岸本綾、冨田祥彦、青木孝哲、長尾優毅、岡田ふみ子、中川徹哉
38/131
EDINET提出書類
オイシックス・ラ・大地株式会社(E27260)
有価証券報告書
c.監査役及び監査役会
当社の監査役は、常勤監査役1名と非常勤監査役3名で構成され、全監査役が社外監査役であります。監
査役会は、これらの監査役で構成されています。
各監査役は、取締役会をはじめとする重要な会議に出席して意見を述べる等、コーポレート・ガバナンス
の実効性を高めるよう努めております。監査役会は、原則として定例取締役会と同日に開催しております。
社外監査役:(常勤1名)乙部智佳
(非常勤3名)諸江幸祐、小久保崇、和田健吾
d.指名・報酬委員会の設置
当社は、2022年5月26日に開催された取締役会において、取締役会の諮問機関である任意の委員会とし
て、指名・報酬委員会を設置することを決議し、同年6月から活動を開始しております。従来の役員報酬諮
問会議を再編成したもので、社外役員の知見及び助言を活かすとともに、委員3名のうち過半数を独立役員
である社外取締役とすることで、取締役の指名及び報酬等の決定に関する手続の客観性及び透明性を確保
し、もって取締役会の監督機能を向上させ、コーポレート・ガバナンスのさらなる充実を図る趣旨となりま
す。
本書提出日現在、当社独立社外取締役である花田光世が指名・報酬委員会の委員長を、当社独立社外取締
役である田中仁及び当社代表取締役である髙島宏平が委員をそれぞれ務めており、いずれの委員も当事業年
度開催された2回の全てに参加しております。
指名・報酬委員会では、各取締役の報酬に関する制度設計、業務執行状況、当社業績、当社の事業計画や
課題を踏まえたあるべき経営体制等を含めて協議し、取締役の報酬及び指名について、取締役会からの諮問
に対して提言しています。
※当社は、2026年6月25日開催予定の定時株主総会の議案(決議事項)として「取締役9名選任の件」及び
「監査役1名選任の件」を提案しており、当該議案が承認可決された場合、当社の取締役は9名(内、社外
取締役5名)、監査役は4名(内、社外監査役3名)となり、その構成については、後記「(2)役員の状
況 ①b.」記載のとおりとなります。また、当該定時株主総会の直後に開催予定の取締役会の決議事項として
「指名・報酬委員会委員委嘱」について付議される予定です。これが承認可決された場合、指名・報酬委員
会の委員は、独立社外取締役花田光世、独立社外取締役田中仁、及び代表取締役社長髙島宏平となります。
ロ.当該体制を採用する理由
当社では、監査役会設置会社を採用しております。経営の最高意思決定機関である取締役会に業務執行の権
限・責任を集中させる一方で、取締役会から独立した監査役及び監査役会に取締役会に対する監査機能を担わ
せる両輪体制の下、十分な牽制の中で、取締役会における適正な意思決定や取締役の執行の監督が行われる体
制であると考えております。
39/131
EDINET提出書類
オイシックス・ラ・大地株式会社(E27260)
有価証券報告書
本書提出日現在における当社の企業統治の体制図は、以下のとおりです。
③
企業統治に関するその他の事項
イ.内部統制システムの整備状況
当社は、2006年10月30日開催の取締役会において、取締役の職務の執行が法令及び定款に適合することを確
保するための体制その他株式会社の業務の適正を確保するための体制を整備するために、「内部統制システム
構築の基本方針」を決議し、その後当該基本方針については適宜見直しを実施しております。
2024年3月21日開催の取締役会において改定され、現在運用している内容は下記のとおりです。
①
取締役の職務の執行が法令及び定款に適合することを確保するための体制
取締役は、自ら又は当社の子会社の取締役等及び使用人をして、当社企業理念の体現者として、法令及び定
款並びに社内規程を遵守し、常に社会的良識を持って行動しなければならない。
取締役会は、会議体自ら又は当社若しくは当社の子会社の取締役等及び使用人をして、実効性のある内部統
制システムの構築と、全社的なコンプライアンス体制の確立に努めなければならない。
監査役は、会社法の定めるところにより取締役会に出席するほか、取締役が主催する重要な会議に出席し意
見を述べることができるものとする。
②
取締役の職務の執行に係る情報の保存及び管理に関する体制
法令で定められた情報開示を必要とする重要情報については、速やかに情報を公開する。
取締役の職務執行に係る意思決定過程における稟議書、議事録、その他文書については、文書管理規程に基
づき適切な状態にて保存する。
なお、取締役及び監査役は、常時これらの文書を閲覧することができるものとする。
40/131
EDINET提出書類
オイシックス・ラ・大地株式会社(E27260)
有価証券報告書
③
損失の危険の管理に関する規程その他の体制
損失に関するリスク・マネジメントの観点から、各社内規程及びマニュアルにおいて該当する損失の危険の
管理について定める。
リスク管理を専門的に取り扱う部署としてリスク管理委員会を設置し、関連部署と連携して、当社及び当社
子会社の事業上及び経営上のリスクを把握し、リスクの分析・評価及び対策をまとめ、定期的に、取締役会及
び監査役会に報告する。
不測の事態が生じた場合に、役員、使用人全員が適切な行動を行えるように、連絡体制の整備、行動マニュ
アルの整備を行う。
④
取締役の職務の執行が効率的に行われることを確保するための体制
毎月1回の取締役会を開催し、法令及び定款並びに取締役会規程に定められた重要事項の決定、業務執行状
況の報告を行う。
当社の職務執行に関する意思決定を迅速に行うため、経営会議規程に基づき、常勤取締役及び指名された者
により経営会議を開催し議論を行い、業務の執行方針、重要事項の決定を行う。
⑤
使用人の職務の執行が法令及び定款に適合することを確保するための体制
企業理念を制定し企業活動の根本理念を明確にするとともに、使用人向けには、日常的な行動の際の根拠と
なる社員行動基準を定める。
当社及び当社子会社の使用人は、法令及び会社の定める規則(関連する規範を含む。)あるいは社会通念に
反する行為が行われていることを知ったときは、上司又は通報窓口に速やかに通報しなければならない。
内部監査室は、内部監査規程に基づき、当社及び当社子会社の業務全般に対し、コンプライアンスの状況及
び業務の手続と内容の妥当性等について定期的に内部監査を実施し、社長に対しその結果を報告する。
⑥
会社並びにその親会社及び子会社から成る企業集団における業務の適正を確保するための体制
当社は、当社子会社の職務執行が効率的に行われる体制を構築するため関係会社管理規程を定め、これに基
づき、当社に対し、当社子会社の取締役等の職務の執行に係る事項を適時かつ適切に報告させる。
これに加えて、当社は、主要な当社子会社には取締役又は監査役を派遣し、子会社の取締役等の職務執行の
監督及び監査を随時行うとともに当該派遣した者から当社子会社における業務執行に係る事項の報告を適宜受
ける。
当社経営企画本部長は、当社子会社が適切な内部統制システムの整備を行うよう指導することとする。
内部監査室は、当社子会社各社における内部監査を実施し、当社子会社各社の業務全般にわたる内部統制の
有効性と妥当性を確保するよう努める。
⑦
監査役がその職務を補助すべき使用人を置くことを求めた場合における当該使用人に関する事項
監査役がその職務を補助すべき使用人を置くことを求めた場合、取締役会は監査役と協議の上、内部監査室
及びその他必要と認める部署より必要と認める人員を、監査役を補助すべき使用人として指名する。
⑧
監査役の職務を補助すべき使用人の取締役からの独立性に関する事項及び当該使用人に対する指示の実効
性の確保に関する事項
監査役の職務を補助すべき使用人として指名された使用人は、補助すべき期間において、監査役の指揮命令
の下に行動し、取締役その他監査役以外の者から一切の指揮命令を受けない。また、監査役の職務を補助すべ
き行為に基づく当該使用人に係る人事異動、人事評価、賞罰、その他一切の事項は監査役の協議に基づき決定
し、取締役その他監査役以外の者からの独立性を確保する。
41/131
EDINET提出書類
オイシックス・ラ・大地株式会社(E27260)
有価証券報告書
⑨
取締役及び使用人が監査役に報告するための体制その他の監査役への報告に関する体制
当社及び当社子会社の取締役及び使用人は、業務の執行過程において重要と認められる事象が生じた場合に
は、監査役に対し当該事象の内容を速やかに報告しなければならない。また、監査役から報告の求めがあった
場合には、報告する義務を負う。なお、当該報告を行ったことを理由として解雇その他一切のいかなる不利益
な取り扱いを行わない。
当社及び当社子会社の取締役及び使用人からの相談・連絡・通報を受ける窓口(以下「内部通報窓口」とい
う)を設け、違反行為の早期発見に努め、適切に対処する。
内部通報窓口の事務局は、内部通報窓口への通報状況とその処理の状況について監査役に報告する。
当社及び当社子会社は、「内部通報規程」を全ての役職員に周知徹底を図り、通報者に対し、解雇その他一
切のいかなる不利益な取扱いを行わない。
⑩
その他監査役の監査が実効的に行われることを確保するための体制及び監査役の職務の執行について生ず
る費用の前払又は償還の手続その他の当該職務執行について生ずる費用又は債務の処理に係る方針に関する
事項
監査役はその職務の執行にあたり、他のいかなる者からも制約を受けることなく、当社及び当社子会社の取
締役の職務執行が法令及び定款に準拠して適切に行われているかどうかについて、独立して自らの意見形成を
行う権限を持つ。
この独立性と権限を確保するために、監査役監査基準において、監査役の権限を明確にするとともに、監査
役は、内部監査室、会計監査人、その他必要と認める者と連携して監査を実施し、監査の実効性を確保する。
監査役は、職務の執行にあたり必要に応じて、会社の費用で法律・会計の専門家を活用することができ、ま
た、当社及び当社子会社は監査役から職務の執行について生ずる所要の費用について請求を受けたときは、監
査役の職務の執行に必要でないと明白に認められるものを除き、速やかに精算処理する。
⑪
財務報告の適正性を確保するための体制
当社並びに連結子会社及び持分法適用関連会社は、財務報告の信頼性を確保し、金融商品取引法に規定する
内部統制報告制度に適切に対応するため、社内諸規程、会計基準、その他関連法令を遵守し、社内体制を整備
するとともに、全ての役職員に周知徹底し、意識向上を図るとともに、当該有効性を定期的に評価する。
⑫
反社会的勢力排除に向けた基本的な考え方及びその整備状況
当社は、反社会的勢力との一切の関係を遮断する旨を謳った「反社会的勢力対策についての宣言」を定めて
おり、新規取引開始時の取引先の属性チェックなどを実施することにより、反社会的勢力及びそれに共生する
グループとの関係が発生しないよう未然防止に努めている。
また、当社及び当社子会社は反社会的勢力からの接触があった場合に備えて「反社会的勢力対応マニュア
ル」を策定し、管理本部を中心にその対応に当たることを定めるほか、必要とあれば早期に顧問弁護士や警
察・暴追センターに相談し適切な措置を講ずる体制としている。
42/131
EDINET提出書類
オイシックス・ラ・大地株式会社(E27260)
有価証券報告書
ロ.リスク管理体制の整備の状況
当社のリスク管理及びコンプライアンス体制整備については、リスク管理委員会を中心に実施しておりま
す。
同委員会は執行役員他によって構成され、常勤監査役も常に参加しており、役職員に対するコンプライアン
ス意識の普及・啓発や法令違反行為等の通報の受付と事実関係の調査等をその任務としております。具体的に
は、テーマごとの分科会活動を中心として、また、月1回定例の会議を開催し、内部通報の有無の確認や、反
社会的勢力への対応、労務関連の法令遵守状況等コンプライアンスに関連する事項のほか、リスク管理に関す
る事項や内部統制の対応状況等について、報告並びに議論を行っております。
また、当社では、公益通報者保護法の趣旨に則り、コンプライアンスの徹底に資することを目的として内部
通報制度(「企業倫理ホットライン」という。)を定めております。当社の従業員は、本制度を通じ、公益通報
者保護法に定める法令違反及びその他の重大なコンプライアンス違反等の通報対象の事実が生じているか、又
は、まさに生じようとしていることを、社外弁護士窓口または社内窓口担当者に通報することができます。ま
た、通報者にはしかるべき保護措置を行うほか、通報された情報等は企業倫理ホットライン窓口担当者よりリ
スク管理委員会に報告があり、必要な場合、是正措置を行うこととしております。
加えて、全ての当社役職員が遵守すべき規範として「倫理規程」、「オイシックスグループ倫理規範」、
「オイシックスグループ人権ポリシー」、「環境ポリシー」及び「オイシックスグループ贈収賄、腐敗防止に
関するポリシー」を設け、人権の尊重、自然環境への配慮、公正な取引、社会的常識を超える接待・贈答の禁
止、及び情報管理等について定め、その普及・啓蒙に努めております。また、個別業務に関するコンプライア
ンスへの取組として、個人情報保護法、景表法、特商法といった当社業務と関連の深い諸法令の遵守状況の確
認や、毎年1回全社員を対象として実施するコンプライアンス研修や入社時の研修等を通じて法令に関する知
識の普及等を行っております。
ハ.子会社の業務の適正を確保するための体制整備の状況
経営企画本部長は、子会社及び関連会社等当社グループ各社が適切な内部統制システムの整備を行うよう指
導することとしております。
内部監査室は、子会社及び関連会社等当社グループ各社が内部監査を実施し、各社の業務全般にわたる内部
統制の有効性と妥当性を確保するよう努めております。
ニ.取締役の定数
当社の取締役は、11名以内とする旨を定款で定めております。
ホ.取締役の選任の決議要件
当社は、取締役の選任決議は、議決権を行使することができる株主の議決権の3分の1以上を有する株主が
出席し、その議決権の過半数をもって行う旨を定款に定めております。
また取締役の選任決議は、累積投票によらないものとする旨を定款に定めております。
ヘ.株主総会の特別決議の要件
当社は、株主総会の円滑な運営を行うことを目的として、会社法第309条第2項に定める特別決議について、
議決権を行使することができる株主の議決権の3分の1以上を有する株主が出席し、その議決権の3分の2以
上をもって行う旨を定款に定めております。これは、株主総会における特別決議の定足数を緩和することによ
り、株主総会の円滑な運営を行うことを目的とするものであります。
43/131
EDINET提出書類
オイシックス・ラ・大地株式会社(E27260)
有価証券報告書
ト.株主総会決議事項を取締役会で決議することができるとした事項
a.剰余金の配当等の決定機関
当社は、剰余金の配当等会社法第459条第1項各号に定める事項について、法令の別段の定めがある場合を
除き、株主総会の決議によらず取締役会の決議により定める旨を定款に定めております。これは、株主への
機動的な利益還元を行うことを目的とするものであります。
b.中間配当制度に関する事項
当社は、会社法第454条第5項の規定により、取締役会の決議によって毎年9月30日を基準日として、中間
配当を行うことができる旨を定款に定めております。これは、株主への機動的な利益還元を行うことを目的
とするものであります。
c.自己株式の取得
当社は、自己株式の取得について、経済情勢の変化に対応して財務政策等の経営諸政策を機動的に遂行す
ることを可能とするため、会社法第165条第2項の規定により、取締役会の決議によって自己の株式を取得す
ることができる旨を定款に定めております。
チ.責任限定契約の内容の概要
当社は、会社法第427条第1項及び当社定款の規定に基づき、取締役(業務執行取締役等であるものを除
く。)及び監査役との間において、会社法第423条第1項の損害賠償責任について、職務を行うにつき善意でか
つ重大な過失がない場合は、会社法第425条第1項各号の額の合計額を限度とする責任限定契約を締結しており
ます。
リ.役員等賠償責任保険契約の概要
当社は、優秀な人財確保、職務執行の萎縮の防止のため、以下の内容を概要とする役員等賠償責任保険契約
を締結しており、2026年10月に更新予定です。
a.被保険者の実質的な保険料負担割合
保険料は特約部分も含め会社負担としており、被保険者の実質的な保険料負担はありません。
b.填補の対象となる保険事故の概要
特約部分も合わせ、被保険者である役員等がその職務の執行に関し責任を負うこと、または当該責任の
追及に係る請求を受けることによって生ずることのある損害について填補します。ただし、法令違反の行
為であることを認識して行った場合等一定の免責事由があります。
44/131
EDINET提出書類
オイシックス・ラ・大地株式会社(E27260)
有価証券報告書
(2) 【役員の状況】
①
役員一覧
a.本書提出日現在の当社の役員の状況は以下のとおりです。
男性
9名
女性
役職名
4名
(役員のうち女性の比率
氏名
30.8%)
生年月日
略歴
1998年4月
マッキンゼー・アンド・カンパニー・
インク ジャパン入社
2000年6月
2011年6月
当社代表取締役社長(現任)
一般社団法人東の食の会代表理事
(現任)
Oisix Hong Kong Co.,Ltd.董事
2015年10月
2018年12月
(現任)
株式会社とくし丸代表取締役会長
(現任)
Oisix Inc. Director(現任)
2019年5月
Three Limes,Inc.(Purple Carrot)
2016年7月
任期
所有株式数
(株)
(注)3
4,847,200
Director(現任)
2019年10月
株式会社ウェルカム(DEAN & DELUCA)
取締役(現任)
2022年11月
一般社団法人 Data for Social
Transformation( 現一般社団法人
代表取締役社長
髙島
宏平
1973年8月15日生
EVIDENCE STUDIO)共同代表理事(現任)
2023年10月
一般社団法人SEOU会(現一般社団法
人PDA)代表理事(現任)
2024年1月
株式会社新潟アルビレックス・ベース
ボール・クラブ代表取締役会長(現株
式会社新潟プロ野球団)(現任)
2024年5月
株式会社オイシクル代表取締役(現任)
2025年1月
株式会社ベネッセコーポレーション社
外取締役(現任)
2025年4月
公益財団法人経済同友会幹事(現任)
2025年5月
シダックスコントラクトフードサービ
ス株式会社代表取締役(現任)
シダックスフードサービス株式会社代
表取締役(現任)
2025年9月
シダックスヒューマン&フードサービ
ス株式会社代表取締役(現任)
45/131
EDINET提出書類
オイシックス・ラ・大地株式会社(E27260)
有価証券報告書
役職名
氏名
任期
所有株式数
(株)
シダックスフードサービス株式会社代 (注)3
表取締役(現任)
720,000
生年月日
略歴
1997年6月
1999年10月
2008年7月
2018年7月
当社入社
当社取締役
当社取締役執行役員(現任)
カラビナテクノロジー株式会社取締役
(現任)
2024年4月
シダックスコントラクトフードサービ
ス株式会社代表取締役(現任)
取締役
執行役員
堤
祐輔
1978年3月22日生
エス・ロジックス株式会社代表取締役
(現任)
2024年5月
株式会社ノンピ(現ボンディッシュ株
式会社)社外取締役(現任)
2025年9月
シダックスヒューマン&フードサービ
ス株式会社取締役(現任)
取締役
執行役員
小﨑
宏行
1952年10月14日生
1975年4月
2006年9月
2006年10月
2008年7月
2009年6月
2024年8月
2025年9月
取締役
執行役員
2008年4月
2014年7月
2017年4月
2018年6月
2019年8月
松本
浩平
1984年1月24日生
株式会社ダイエー入社
同社執行役員
同社取締役
当社入社顧問
当社取締役執行役員(現任)
一般社団法人サステナブルキャリア支
援協会理事(現任)
シダックスヒューマン&フードサービ
ス株式会社取締役(現任)
株式会社豊洲漁商産直市場取締役(現
任)
2021年9月
株式会社HiOLI社外取締役(現任)
2022年7月
株式会社MiL 社外取締役(現任)
46/131
86,000
(注)3
7,400
当社入社
当社執行役員
株式会社日本農業取締役(現任)
当社取締役執行役員(現任)
Future Food Fund株式会社代表取締役
(現任)
2021年3月
(注)3
EDINET提出書類
オイシックス・ラ・大地株式会社(E27260)
有価証券報告書
役職名
取締役
氏名
花田
生年月日
光世
1948年8月8日生
略歴
1986年4月
1990年3月
2007年6月
2011年6月
2014年4月
2014年4月
2017年5月
取締役
田中
仁
1963年1月25日生
1988年7月
有限会社ジェイアイエヌ(現株式会社
ジンズホールディングス)設立同社
代表取締役(現任)
2011年6月
株式会社ブランドニューデイ代表取締
役
当社社外取締役(現任)
株式会社ジンズジャパン(現株式会社
ジンズ)代表取締役
株式会社Think Lab代表取締役
2015年6月
2018年5月
2018年12月
2021年6月
2022年10月
2023年12月
2000年4月
2002年5月
2004年10月
2014年4月
2019年6月
2020年4月
取締役
渡部
純子
産業能率大学教授
慶應義塾大学総合政策学部教授
当社社外取締役(現任)
三谷産業株式会社社外取締役(現任)
慶應義塾大学名誉教授(現任)
一般財団法人SFCフォーラム代表理事
(現任)
一般社団法人キャリアアドバイザー協
議会代表理事(現任)
1977年6月27日生
2020年8月
2020年10月
2025年3月
47/131
任期
所有株式数
(株)
(注)3
4,800
(注)3
20,000
(注)3
―
日本通信株式会社社外取締役(現任)
めぶくグラウンド株式会社社外取締役
(現任)
株式会社ジンズ取締役(現任)
大日本印刷株式会社入社
株式会社インプレッション入社
株式会社リクルート入社
株式会社リクルートライフスタイル執
行役員
当社社外取締役(現任)
株式会社リクルートIDポイントプロダ
クトサービス開発部部長(現任)
同社横断CRM部(現横断マーケティ
ング部)部長(現任)
同社 クオリティーコーディネート室
(現クオリティマネジメント室)室長
(現任)
株式会社ロイヤリティマーケティング
社外取締役(現任)
YUDAミルク株式会社社外取締役(現任)
EDINET提出書類
オイシックス・ラ・大地株式会社(E27260)
有価証券報告書
役職名
氏名
生年月日
略歴
2002年1月
任期
所有株式数
(株)
(注)3
―
(注)3
−
株式会社 ジ ェ ン ヌ ( 現株式会社 ABC
Cooking Studio)入社
取締役
櫻井
稚子
2013年7月
2017年1月
2018年6月
2021年1月
同社代表取締役社長
株式会社NTTドコモ入社
当社社外取締役(現任)
2022年6月
2023年5月
株式会社NTTドコモ執行役員(現任)
株式会社NTTドコモ・スタジオ&ライ
ブ取締役(現任)
PlusW America Inc.代表取締役社長
1973年5月1日生
2025年1月
2025年4月
2026年4月
2006年4月
2009年4月
2011年4月
2011年6月
PlusW株式会社代表取締役社長(現任)
(現任)
株式会社愛知国際アリーナ取締役(現
任)
株式会社ジャパンナショナルスタジア
ム・エンターテイメント取締役(現任)
株式会社静岡セントラルアリーナ
代表取締役社長(現任)
アパレルブランド「Joias」を立ち上
げ、プレス・デザイナー兼任
雑誌「CanCam」ファッションエディ
ターとしてメイン企画を多数担当
株式会社LYLA代表取締役(現任)
ウェディングドレス ブランド
「heureux de Misato Kowaki」を立ち
取締役
小脇
美里
1983年10月23日生
2015年9月
2016年9月
2020年5月
2020年8月
2020年10月
2021年6月
48/131
上げ、人気アーティスト等のスタイリ
ストや書籍、写真集を担当
セブン&アイグループにて「モノトー
ン収納」をセレクト
サンリオの大人女性向けプロジェクト
「TOKYOOTONAKITTY」を立ち上げ、ア
ドバイザーに就任
ベストマザー賞経済部門受賞
鯖江市顧問女性活躍推進アドバイ
ザー就任
WEBメディア「MOTHERS編集部」を設
立、編集長に就任
当社社外取締役(現任)
EDINET提出書類
オイシックス・ラ・大地株式会社(E27260)
有価証券報告書
役職名
氏名
生年月日
略歴
1990年4月
1999年8月
監査役
(常勤)
乙部
智佳
1965年9月4日生
2005年11月
2006年6月
2012年7月
2021年6月
1979年3月
1985年11月
1988年7月
1998年11月
2008年8月
監査役
(非常勤)
諸江
幸祐
1955年7月18日生
2009年6月
2011年6月
2014年3月
2018年9月
2021年11月
2000年10月
2014年3月
2017年1月
監査役
(非常勤)
小久保崇
1974年1月18日生
和田健吾
1977年10月28日生
―
ジャスコ株式会社(現イオン株式会社)
入社
野村證券株式会社入社
ゴールドマン・サックス証券会社入社
同社マネージング・ディレクター
株式会社YUMEキャピタル設立代表取
締役(現任)
株式会社いとはんジャパン設立代表
取締役(現任)
当社社外監査役(現任)
アイエムエム・フードサービス株式会
社取締役(現任)
スミダコーポレーション株式会社社外
取締役
株式会社ジョイフル本田社外取締役
レンティオ株式会社社外取締役(現任)
(注)4
4,800
(注)4
―
(注)4
―
弁護士登録
西村総合法律事務所(現西村あさひ法
律事務所・外国法共同事業)入所
小久保法律事務所設立
AOI TYO Holdings 株式会社 ( 現
2000年10月
朝日監査法人(現有限責任あずさ監査
2006年2月
法人)入所
GCA 株式会社 ( 現 フ ー リ ハ ン ・ ロ ー
2015年2月
監査役
(非常勤)
(注)4
2024年8月
2019年6月
2020年6月
2022年1月
2023年6月
2024年7月
2017年6月
2017年7月
2018年2月
2023年8月
2024年6月
キー株式会社)入社
株式会社エイ・アイ・パートナーズ代
表取締役(現任)
株式会社じげん社外監査役(現任)
アルー株式会社社外監査役
クラウドエース株式会社社外監査役
(現任)
株式会社Gunosy社外監査役(現任)
当社社外監査役(現任)
計
(注) 1.取締役
2.監査役
所有株式数
(株)
株式会社日本興業銀行(現株式会社み
ずほ銀行)入行
有限会社ディー・エヌ・エー(現株式
会社ディー・エヌ・エー)入社管理
担当
同社社長室内部監査担当
同社監査役
個人事業主としてスタートアップ企業
支援事業
当社社外監査役(現任)
KANAMEL株式会社)監査等委員
株式会社アズーム社外取締役(現任)
弁護士法人小久保法律事務所代表社員
(現任)
ナイス株式会社社外取締役(現任)
当社社外監査役(現任)
株式会社xpd社外取締役
株式会社TalentX社外監査役(現任)
株式会社FOLIOホールディングス社外
監査役(現任)
KANAMEL株式会社社外取締役(現任)
2017年1月
2017年3月
任期
5,690,200
花田光世、田中仁、渡部純子、櫻井稚子及び小脇美里は社外取締役であります。
乙部智佳、諸江幸祐、小久保崇及び和田健吾は、社外監査役であります。
3.2026年3月期にかかる定時株主総会終結の時までであります。
4.2028年3月期にかかる定時株主総会終結の時までであります。
49/131
EDINET提出書類
オイシックス・ラ・大地株式会社(E27260)
有価証券報告書
5.当社では、取締役会の一層の活性化を促し、取締役会の意思決定・業務執行の監督機能と各事業部の業務執行機能を明確に区分
し、経営効率の向上を図るために執行役員制度を導入しております。
役員名
役
執行役員
割
・業務執行役員としての役割、所管及び担当する領域の業績KPI、マネジメント全般を通じた問題解
決、実行KPIをリードする役割を担う
・経営会議案件審議、経営の重要課題の審議・提案の役割を担う
専門役員
・本人固有のスペシャリティで貢献できる部門のミッションKPIを担う
・担当専門分野の知見、ネットワークを活かし問題解決を支援する役割を担う
・アジェンダにより、経営会議・執行役員会で審議・提案の役割を担う
・執行役員は16名で、堤祐輔、小﨑宏行、松本浩平(以上3氏は取締役兼務)、山下寛人、菅美沙季、新宮歩、力丸進吾、冨士
聡子、東海林園子、小松敦、岸本綾、冨田祥彦、青木孝哲、長尾優毅、岡田ふみ子、中川徹哉で構成されております。
b. 2026年6月25日開催予定の定時株主総会の議案(決議事項)として「取締役9名選任の件」及び「監査役1名
選任の件」を提案しており、当該議案が承認可決された場合、当社の役員は下記のとおりとなる予定です。
男性
9名
女性
役職名
4名
(役員のうち女性の比率
氏名
30.8%)
生年月日
略歴
1998年4月
マッキンゼー・アンド・カンパニー・
インク ジャパン入社
2000年6月
2011年6月
当社代表取締役社長(現任)
一般社団法人東の食の会代表理事
(現任)
Oisix Hong Kong Co.,Ltd.董事
2015年10月
2018年12月
(現任)
株式会社とくし丸代表取締役会長
(現任)
Oisix Inc. Director(現任)
2019年5月
Three Limes,Inc.(Purple Carrot)
2016年7月
任期
所有株式数
(株)
(注)3
4,847,200
Director(現任)
2019年10月
株式会社ウェルカム(DEAN & DELUCA)
取締役(現任)
2022年11月
一般社団法人 Data for Social
Transformation( 現一般社団法人
代表取締役社長
髙島
宏平
1973年8月15日生
EVIDENCE STUDIO)共同代表理事(現任)
2023年10月
一般社団法人SEOU会(現一般社団法
人PDA)代表理事(現任)
2024年1月
株式会社新潟アルビレックス・ベース
ボール・クラブ代表取締役会長(現株
式会社新潟プロ野球団)(現任)
2024年5月
株式会社オイシクル代表取締役(現任)
2025年1月
株式会社ベネッセコーポレーション社
外取締役(現任)
2025年4月
公益財団法人経済同友会幹事(現任)
2025年5月
シダックスコントラクトフードサービ
ス株式会社代表取締役(現任)
シダックスフードサービス株式会社代
表取締役(現任)
2025年9月
シダックスヒューマン&フードサービ
ス株式会社代表取締役(現任)
50/131
EDINET提出書類
オイシックス・ラ・大地株式会社(E27260)
有価証券報告書
役職名
氏名
生年月日
略歴
1997年6月
1999年10月
2018年7月
当社入社
当社取締役
カラビナテクノロジー株式会社取締役
(現任)
2024年4月
シダックスコントラクトフードサービ
任期
所有株式数
(株)
(注)3
720,000
(注)3
86,000
(注)3
7,400
ス株式会社代表取締役(現任)
取締役
執行役員
シダックスフードサービス株式会社代
堤
祐輔
1978年3月22日生
表取締役(現任)
エス・ロジックス株式会社代表取締役
(現任)
2024年5月
株式会社ノンピ(現ボンディッシュ株
式会社)社外取締役(現任)
2025年9月
シダックスヒューマン&フードサービ
ス株式会社取締役(現任)
取締役
執行役員
小﨑
宏行
1952年10月14日生
1975年4月
2006年9月
2006年10月
2008年7月
2009年6月
2024年8月
2025年9月
取締役
執行役員
2008年4月
2014年7月
2017年4月
2018年6月
2019年8月
松本
浩平
1984年1月24日生
株式会社ダイエー入社
同社執行役員
同社取締役
当社入社顧問
当社取締役執行役員(現任)
一般社団法人サステナブルキャリア支
援協会理事(現任)
シダックスヒューマン&フードサービ
ス株式会社取締役(現任)
当社入社
当社執行役員
株式会社日本農業取締役(現任)
当社取締役執行役員(現任)
Future Food Fund株式会社代表取締役
(現任)
2021年3月
株式会社豊洲漁商産直市場取締役(現
任)
2021年9月
株式会社HiOLI社外取締役(現任)
2022年7月
株式会社MiL 社外取締役(現任)
51/131
EDINET提出書類
オイシックス・ラ・大地株式会社(E27260)
有価証券報告書
役職名
取締役
氏名
花田
生年月日
光世
1948年8月8日生
略歴
1986年4月
1990年3月
2007年6月
2011年6月
2014年4月
2014年4月
2017年5月
取締役
田中
仁
1963年1月25日生
1988年7月
有限会社ジェイアイエヌ(現株式会社
ジンズホールディングス)設立同社
代表取締役(現任)
2011年6月
株式会社ブランドニューデイ代表取締
役
当社社外取締役(現任)
株式会社ジンズジャパン(現株式会社
ジンズ)代表取締役
株式会社Think Lab代表取締役
2015年6月
2018年5月
2018年12月
2021年6月
2022年10月
2023年12月
2000年4月
2002年5月
2004年10月
2014年4月
2019年6月
2020年4月
取締役
渡部
純子
産業能率大学教授
慶應義塾大学総合政策学部教授
当社社外取締役(現任)
三谷産業株式会社社外取締役(現任)
慶應義塾大学名誉教授(現任)
一般財団法人SFCフォーラム代表理事
(現任)
一般社団法人キャリアアドバイザー協
議会代表理事(現任)
1977年6月27日生
2020年8月
2020年10月
2025年3月
52/131
任期
所有株式数
(株)
(注)3
4,800
(注)3
20,000
(注)3
―
日本通信株式会社社外取締役(現任)
めぶくグラウンド株式会社社外取締役
(現任)
株式会社ジンズ取締役(現任)
大日本印刷株式会社入社
株式会社インプレッション入社
株式会社リクルート入社
株式会社リクルートライフスタイル執
行役員
当社社外取締役(現任)
株式会社リクルートIDポイントプロダ
クトサービス開発部部長(現任)
同社横断CRM部(現横断マーケティ
ング部)部長(現任)
同社 クオリティーコーディネート室
(現クオリティマネジメント室)室長
(現任)
株式会社ロイヤリティマーケティング
社外取締役(現任)
YUDAミルク株式会社社外取締役(現任)
EDINET提出書類
オイシックス・ラ・大地株式会社(E27260)
有価証券報告書
役職名
氏名
生年月日
略歴
2002年1月
任期
所有株式数
(株)
(注)3
―
(注)3
−
株式会社 ジ ェ ン ヌ ( 現株式会社 ABC
Cooking Studio)入社
取締役
櫻井
稚子
2013年7月
2017年1月
2018年6月
2021年1月
同社代表取締役社長
株式会社NTTドコモ入社
当社社外取締役(現任)
2022年6月
2023年5月
株式会社NTTドコモ執行役員(現任)
株式会社NTTドコモ・スタジオ&ライ
ブ取締役(現任)
PlusW America Inc.代表取締役社長
1973年5月1日生
2025年1月
2025年4月
2026年4月
2006年4月
2009年4月
2011年4月
2011年6月
PlusW株式会社代表取締役社長(現任)
(現任)
株式会社愛知国際アリーナ取締役(現
任)
株式会社ジャパンナショナルスタジア
ム・エンターテイメント取締役(現任)
株式会社静岡セントラルアリーナ
代表取締役社長(現任)
アパレルブランド「Joias」を立ち上
げ、プレス・デザイナー兼任
雑誌「CanCam」ファッションエディ
ターとしてメイン企画を多数担当
株式会社LYLA代表取締役(現任)
ウェディングドレス ブランド
「heureux de Misato Kowaki」を立ち
取締役
小脇
美里
1983年10月23日生
2015年9月
2016年9月
2020年5月
2020年8月
2020年10月
2021年6月
53/131
上げ、人気アーティスト等のスタイリ
ストや書籍、写真集を担当
セブン&アイグループにて「モノトー
ン収納」をセレクト
サンリオの大人女性向けプロジェクト
「TOKYOOTONAKITTY」を立ち上げ、ア
ドバイザーに就任
ベストマザー賞経済部門受賞
鯖江市顧問女性活躍推進アドバイ
ザー就任
WEBメディア「MOTHERS編集部」を設
立、編集長に就任
当社社外取締役(現任)
EDINET提出書類
オイシックス・ラ・大地株式会社(E27260)
有価証券報告書
役職名
監査役
(常勤)
氏名
小林
絵美
生年月日
略歴
1980年11月13日生
2003年4月
東濃信用金庫入庫
2008年12月
あずさ監査法人(現有限責任あずさ監
査法人)入社
小林絵美公認会計士事務所代表(現
任)
当社入社
当社監査役(現任)
2022年10月
2022年10月
2026年6月
1979年3月
1985年11月
1988年7月
1998年11月
2008年8月
監査役
(非常勤)
諸江
幸祐
1955年7月18日生
2009年6月
2011年6月
2014年3月
2018年9月
2021年11月
2000年10月
2014年3月
2017年1月
監査役
(非常勤)
小久保崇
2000年10月
朝日監査法人(現有限責任あずさ監査
2006年2月
法人)入所
GCA 株式会社 ( 現 フ ー リ ハ ン ・ ロ ー
2015年2月
監査役
(非常勤)
和田健吾
1977年10月28日生
2017年6月
2017年7月
2018年2月
2023年8月
2024年6月
キー株式会社)入社
株式会社エイ・アイ・パートナーズ代
表取締役(現任)
株式会社じげん社外監査役(現任)
アルー株式会社社外監査役
クラウドエース株式会社社外監査役
(現任)
株式会社Gunosy社外監査役(現任)
当社社外監査役(現任)
計
(注) 1.取締役
2.監査役
(注)4
―
(注)4
4,800
(注)4
―
(注)4
―
律事務所・外国法共同事業)入所
小久保法律事務所設立
AOI TYO Holdings 株式会社 ( 現
2024年8月
2019年6月
2020年6月
2022年1月
2023年6月
2024年7月
所有株式数
(株)
弁護士登録
西村総合法律事務所(現西村あさひ法
KANAMEL株式会社)監査等委員
株式会社アズーム社外取締役(現任)
弁護士法人小久保法律事務所代表社員
(現任)
ナイス株式会社社外取締役(現任)
当社社外監査役(現任)
株式会社xpd社外取締役
株式会社TalentX社外監査役(現任)
株式会社FOLIOホールディングス社外
監査役(現任)
KANAMEL株式会社社外取締役(現任)
2017年1月
2017年3月
1974年1月18日生
ジャスコ株式会社(現イオン株式会社)
入社
野村證券株式会社入社
ゴールドマン・サックス証券会社入社
同社マネージング・ディレクター
株式会社YUMEキャピタル設立代表取
締役(現任)
株式会社いとはんジャパン設立代表
取締役(現任)
当社社外監査役(現任)
アイエムエム・フードサービス株式会
社取締役(現任)
スミダコーポレーション株式会社社外
取締役
株式会社ジョイフル本田社外取締役
レンティオ株式会社社外取締役(現任)
任期
5,690,200
花田光世、田中仁、渡部純子、櫻井稚子及び小脇美里は社外取締役であります。
諸江幸祐、小久保崇及び和田健吾は、社外監査役であります。
3.2027年3月期にかかる定時株主総会終結の時までであります。
4.2028年3月期にかかる定時株主総会終結の時までであります。
54/131
EDINET提出書類
オイシックス・ラ・大地株式会社(E27260)
有価証券報告書
②
社外役員の状況
本書提出日現在、当社の社外取締役は5名、社外監査役は4名であります。
社外取締役の花田光世は、慶應義塾大学名誉教授として、主に人事教育等の人材の観点で企業経営全般に関し
て幅広い知見を有する立場から、監督・提言を行っております。
社外取締役の渡部純子は、当社の主要株主である株式会社リクルートにおいて、顧客管理に関するマネジメン
トについての幅広い知見から、監督・提言を行っております。
社外取締役の田中仁は、長年にわたり株式会社ジンズホールディングスの代表取締役社長を務められており、
経営者としての豊富な経験と幅広い見識をもとに、監督・提言を行っていただくものであります。
社外取締役の櫻井稚子は、長年にわたる株式会社ABC Cooking Studioでの経験と当社の大株主である株式会社
NTTドコモで食関連のコンテンツビジネスに関する豊かな知見を有しており、当社の経営に対する様々な助言及び
意見をいただくものであります。
社外取締役の小脇美里は、フリーの立場で、衣食住の生活シーンに係る各種企画立案、コンサルティング、書
籍出版等を経験されてきました。それは、生活者・消費者側の視点での活動でもあります。これらの経験と知見
により、食分野で新しい事業価値の創設を追求する当社にとって、有益な視点での助言を行っていただくもので
あります。
社外監査役の乙部智佳は、一部上場企業の管理部門や内部監査部門、監査役、そして、多様な企業の経営支援
の知見により、当社の監査体制の充実に努めております。
社外監査役の諸江幸祐は、証券アナリストとしての専門知識・経験等を活かして、当社の監査体制の充実に努
めております。
社外監査役の小久保崇は、弁護士としての専門知識・経験等を活かして、当社の監査体制の充実に努めており
ます。
社外監査役の和田健吾は、公認会計士としての専門知識・経験等を活かして、当社の監査体制の充実に努めて
おります。
なお、社外取締役の花田光世及び社外監査役の諸江幸祐はそれぞれ4,800株の当社株式を、また社外取締役の田
中仁は20,000株の当社株式を保有しております。それ以外に社外取締役及び社外監査役と当社との間に人的関
係、資本的関係又は取引関係等の特別な利害関係はありません。
また、当社は、社外取締役及び社外監査役を選任するための独立性に関する基準又は方針として明確に定めた
ものはありませんが、東京証券取引所の定める独立性基準を参照し、その選任に際しては、見識や専門的な知見
に基づく客観的かつ適切な監督又は監査が遂行できることを個別に判断しております。
③
社外取締役又は社外監査役による監督又は監査と内部監査、監査役監査及び会計監査との相互連携並びに内部
統制部門との関係
社外取締役5名は、それぞれ経営企画部門、人材企画部門及び管理部門との間で情報交換を行うことで業務の
効率性、有効性の向上に努めております。
また、社外監査役4名による内部監査、監査役監査及び会計監査との相互連携並びに内部統制部門との関係に
ついては、下記(3)監査の状況に記載のとおりであります。
55/131
EDINET提出書類
オイシックス・ラ・大地株式会社(E27260)
有価証券報告書
(3) 【監査の状況】
①
監査役監査の状況
a.組織・人員
当社は監査機能の充実を図るため、2007年6月より監査役会を設置しております。監査役会は4名の監査役(常
勤監査役1名、非常勤監査役3名)で構成されており、本書提出日現在、監査役は、全員、独立役員及び社外監査
役の要件を満たしております。
各監査役の属性及びスキル(専門性、経験、知見等)は、以下のスキルマトリックスに記載の通りとなりま
す。多種多様な知見や観点から、取締役の業務執行に対して、現実的かつ実効的な監査を実現しております。
〈役員スキルマトリックス〉
特に顕著なスキルに絞って●で表示
属
スキル(専門性、経験、知見等)
年齢
性別
担務
属性
資格等
60
女
管理系コンサル
ティング
5
70
男
投資事業経営
17
●
52
男
弁護士
6
●
48
男
公認会計士
2
社外性
独立
役員
乙部智佳
●
●
諸江幸祐
●
●
小久保崇
●
和田健吾
●
氏名
指名・
報酬
委員会
性
(※)
就任
期間
(年)
企業
経営
事業
戦略
ESG・サス
営業・マー
法務・リ
ティナビリ
ケティング
スク管理
ティ
●
●
●
●
●
●
財務
会計
組織
人事
●
●
●
●
●
●
※ 指名・報酬委員会は、3名の取締役(花田光世、田中仁、髙島宏平の各氏)で構成されており、監査役は構
成員とはなっておりません。監査役会は同委員会の答申内容及びそれに基づく取締役の判断を監査する立場
にあります。
〈役員スキルマトリックス〉の補足
乙部智佳
ITベンチャー企業の創業メンバーの一人として管理部門や内部監査部門を立ち上げ、同社の成
長とともに上場まで担当後、同社監査役に就任。その後は、これらの経験を生かして、スター
トアップを中心とする企業運営の全般を支援し、企業の規模や業種を問わず、また、監査者・
被監査者双方の立場を理解して、現実的かつ実効的な監査を実現することができます。
諸江幸祐
小売・流通分野や投資事業・資本市場における、企業を経営する側と外部のアナリストや市場
側の視点を持ち、財務・会計に関する十分な知見を有しております。また、それらを背景とし
て複数企業の社外役員に就任しております。当社の東京証券取引所上場前から監査役を務めて
おり、当社の変遷や実態を理解しつつ、客観的な視点の下、現実的かつ実効的な監査を実現す
ることができます。
小久保崇
弁護士。大手法律事務所を経て自身の事務所を開設し企業法務全般を経験。その一方で、投資
系企業の経営に参画し、また、複数の企業の社外取締役・社外監査役を務めるなど、法務に加
えて、財務・会計に関する十分な知見を有し、現実的かつ実効的な監査を実現することができ
ます。
和田健吾
公認会計士。公認会計士としての経験・見識が豊富であり、公認会計士としての高い専門的知
見を有することに加え、M&Aや投資・ファイナンスを通じて多様な業種のビジネスに関わると
ともに、複数の企業の社外監査役を務めるなど、財務・会計に関する十分な知見をもとに、現
実的かつ実効的な監査を実現することができます。
56/131
EDINET提出書類
オイシックス・ラ・大地株式会社(E27260)
有価証券報告書
b.監査役会の活動
各監査役は監査役会で決定された監査方針(※)及び監査計画に従って、取締役会や重要な会議への出席、取締
役との意見交換、重要な事業所への往査、重要な決裁書類等の閲覧、会計監査人並びに内部監査室との連携等を
通じ、業務監査及び会計監査を実施しております。
重要な会議への出席としては、経営会議、執行役員会、リスク管理委員会などがあります。いずれも週1回定
例会議への出席のほか、リスク管理委員会は月1回の全体会議に出席し、リスク管理体制の整備・運用状況を確
認しております。
事業所への往査としては、重要な物流・製造拠点において棚卸立ち会い、実査を行なっております。
その他、業務全般の状況把握のため、各部門に対するヒアリングを年次計画に基づき実施しております。
内部監査部門との連携については、週1回定例会議を実施し、内部統制の整備とその運用状況について確認を
行なっております。
(※)監査方針
基本方針として、具体的に(1)〜(6)を掲げております。
1.基本方針
当社監査役は、監査役監査基準を指針として、取締役の職務の執行を監査することにより、会社が企
業理念の実現に向けて持続的に成長し、中長期的な企業価値の創出を実現し、社会的信頼に応える良
質な企業統治体制を確立することに貢献する。
(1)
会社の健全性の確保
(2)
経営意思決定プロセスの重視
(3)
内部統制システムの継続的改善の検証
(4)
意見形成と表明
(5)
企業集団監査への対応
(6)
柔軟な監査体制
c.
監査役会の運営
監査役会は、原則月1回(1回あたり所要時間は約1時間)の定例監査役会に加え、必要に応じて臨時監査役
会を開催し、監査役会規程に基づき、監査に関する事項について協議、決定を行っております。また、取締役会
に出席し、取締役の業務執行状況および取締役会の決議等について監査を行なっております。
当事業年度における、監査役会および取締役会における個々の監査役の出席状況は次のとおりであります。
氏名
乙部智佳
監査役会
(参考)
開催/出席回数
取締役会
(うち臨時)
開催/出席回数
18/18
13/13
(6/6)
諸江幸祐
18/18
18/18
13/13
健吾
18/18
(6/6)
主に企業経営及び投資市場を中心とした幅広い知識
と経験から適宜発言を行っております。
13/13
(6/6)
和田
各種会社における管理部門・監査部門に関する幅広
い知識と経験から適宜発言を行っております。
(6/6)
小久保崇
発言等内容
弁護士及び他社取締役・監査役としての幅広い知識
と経験から適宜発言を行っております。
13/12
公認会計士及び他社取締役・監査役としての幅広い
知識と経験から適宜発言を行っております。
(注)取締役会は、上記のほか、書面決議を5回行っております。
57/131
EDINET提出書類
オイシックス・ラ・大地株式会社(E27260)
有価証券報告書
d.
監査役会の活動
監査役会における主な決議、協議、報告事項は以下の通りです。
(定例監査役会)
決議事項
監査方針・監査計画、監査役会の監査報告書、会計監査人の再任、会計監査人の監
(7件)
査報酬に関する同意 など
協議・報告事項
取締役会議案に関する意見交換、会計監査人の監査方針・計画案、監査役会の監査
(36件)
報告書案、グループリスク管理状況、内部監査四半期定例報告 など
(臨時監査役会)
当事業年度は6回開催しており、四半期定例の会計監査人からの会計監査内容の説明に関する確認やKAM(監査
上の主要な検討事項)などについて確認・議論しております。
②
内部監査の状況
当社の内部監査は、「内部監査規程」に基づき、当社の業務運営及び財産管理の実態を、一般に公正妥当な基
準をもって、原則として年1回、全部門を対象に客観的な調査・評定を行うとともに、意見又は方策を各部門に
勧告することにより、経営の合理化並びに業務効率の向上に寄与することを目的として実施しております。
内部監査は当社の内部監査室が担当しており、その人員は11名で、「内部監査規程」に基づき必要に応じて社
内の適任者による支援が可能な体制となっております。
内部監査の活動内容及び結果等については取締役会に報告しております。また、監査役監査及び会計監査人と
も以下のとおり相互連携しております。
監査役とは、定期的に内部監査の実施状況等について情報交換を行うとともに、監査役会において四半期ごと
に監査状況について報告を行っております。
会計監査人との間の情報交換・意見交換については、会計監査人による四半期定例会計監査内容の監査役への
報告に同席して情報の共有を図るとともに、監査上の問題点の有無や今後の課題等について随時意見交換等を
行っております。
③
会計監査の状況
a.監査法人の名称
有限責任監査法人トーマツ
b.継続監査期間
19年間
c.業務を執行した公認会計士
指定有限責任社員
業務執行社員
中桐
光康
指定有限責任社員
業務執行社員
大山
顕司
d.監査業務に係る補助者の構成
公認会計士20名、その他37名
e.監査法人の選定方針と理由
当社は、会計監査人の選定に際しては、当社の広範な業務内容に対応して効率的な監査業務を実施すること
ができる一定の規模とネットワークを持つこと、審査体制が整備されていること、監査計画の概要及び具体的
な監査実施要領並びに監査費用が合理的かつ妥当であること、さらに監査実績等を考慮し、総合的な判断で会
計監査人を選定する方針としており、これらを十分に満たす有限責任監査法人トーマツを会計監査人として選
定しております。
58/131
EDINET提出書類
オイシックス・ラ・大地株式会社(E27260)
有価証券報告書
f.監査役及び監査役会による監査法人の評価
当社の監査役会は、有限責任監査法人トーマツに対する評価を行っており、同監査法人による会計監査が適
正に行われていることを確認しております。
監査役会は、会計監査人の再任に関する確認決議をしており、その際には日本監査役協会が公表する「会計
監査人の評価及び選定基準策定に関する監査役等の実務指針」に基づき、総合的に評価しております。
④
監査報酬の内容等
a.監査公認会計士等に対する報酬
前連結会計年度
区分
当連結会計年度
監査証明業務に基づく 非監査業務に基づく 監査証明業務に基づく 非監査業務に基づく
報酬(百万円)
報酬(百万円)
報酬(百万円)
報酬(百万円)(注)
提出会社
180
―
120
―
連結子会社
73
3
7
1
計
254
3
127
1
(注)連結子会社における非監査業務の内容は、課題調査業務であります。
b.監査公認会計士等と同一のネットワークに属する組織に対する報酬(a.を除く)
前連結会計年度
区分
当連結会計年度
監査証明業務に基づく 非監査業務に基づく 監査証明業務に基づく 非監査業務に基づく
報酬(百万円)
報酬(百万円)
報酬(百万円)
報酬(百万円)
提出会社
―
―
―
―
連結子会社
―
―
―
―
計
―
―
―
―
c.その他の重要な監査証明業務に基づく報酬の内容
該当事項はありません。
d.監査報酬の決定方針
当社の監査公認会計士等に対する監査報酬の決定方針としましては、有限責任監査法人トーマツが策定した
監査計画、監査内容、監査日数等を勘案し、当社と同監査法人で協議の上、監査役会の同意を得て決定してお
ります。
e.監査役会が会計監査人の報酬等に同意した理由
取締役会が提案した会計監査人に対する報酬等に対して、当社の監査役会が会社法第399条第1項の同意をし
た理由は、有限責任監査法人トーマツが策定した監査計画の内容、会計監査の職務遂行状況及び報酬見積もり
等が当社の事業規模や事業内容に適切であると判断した為であります。
59/131
EDINET提出書類
オイシックス・ラ・大地株式会社(E27260)
有価証券報告書
(4) 【役員の報酬等】
①
取締役の個人別の報酬等の内容に係る決定方針
2021年2月25日付取締役会で決定し、2022年5月26日付取締役会での指名・報酬委員会の設置に伴い所要の変
更をしております。
取締役の個人別の報酬等の内容に係る決定方針
1.基本方針
当社の取締役の報酬は、企業価値の持続的な向上を図るインセンティブと
して十分に機能する報酬体系とし、個々の取締役の報酬の決定に際しては各
職責や業績等を踏まえた適正な水準とすることを基本方針とする。
具体的には、役位、担当職務、各期の業績、他社水準を踏まえて決定する
固定報酬のみを支払うこととする。
2.基本報酬(金銭報酬)の個人別の報酬等の額の決定に関する方針 (報酬等を
与える時期又は条件の決定に関する方針を含む。)
当社の取締役の基本報酬は、月例の固定報酬とし、株主総会で決議された
総額の範囲内で、役位、担当職務、各期の業績等を考慮しながら、総合的に
勘案して決定する。
3.取締役の個人別の報酬等の内容についての決定に関する事項
個人別の報酬額については、取締役会決議に基づき代表取締役社長が、そ
の具体的内容について委任をうけ、その権限の内容は基本報酬の額の決定と
する。
当該権限が代表取締役社長によって適切に行使されるよう、代表取締役
は、指名・報酬委員会で審議した内容を尊重して決定する。