2026年10月度月次情報のお知らせ
Bull 0
Bear 0
Routine
3179
Fiscal year ends March
Quarters are offset from the calendar — Q1 is Apr–Jun
|
Syuppin Co., Ltd. is an e-commerce company that buys and sells new and used luxury goods, cameras, watches, and writing instruments through its online platforms and physical stores. The company operates three main business segments: the camera business under the brand Map Camera, which handles brands like Leica, Rollei, Hasselblad, and Zeiss; the watch business under the brands GMT and BRILLER, featuring Patek Philippe, Lange & Söhne, Rolex, and Cartier; and the writing instrument business under the brand KINGDOM NOTE. Syuppin provides authentication services, maintenance, and dynamic pricing systems such as AIMD and AI Support MD to facilitate safe transactions. The company serves customers in Japan and internationally via cross-border e-commerce platforms like eBay, focusing on a circular business model where customers can both buy and sell items. The bicycle business segment, operated under the brand CROWN GEARS, was discontinued as of March 31, 2026. Summarised from the annual report, fiscal year ended Mar 2026 |
Industry Internet Retail | Homepage syuppin.co.jp |
| Sector Consumer Cyclical | IR page syuppin.co.jp/ir | |
|
Tags
used goods, luxury watches, cameras, writing instruments, authentication, e-commerce, omnichannel, dynamic pricing, cross-border e-commerce, Map Camera, GMT, BRILLER, KINGDOM NOTE, CROWN GEARS, AIMD, AI Support MD
|
Press page syuppin.co.jp/news |
Metrics
| Valuation | |
|---|---|
| Market cap | ¥ 28.508B |
| Market cap (USD) | $ 178.177M |
| P/E | 27.33 |
| PEG | — |
| P/BV | 3.08 |
| P/S | 0.56 |
| P/OCF | 15.50 |
| P/FCF | 13.64 |
| Dividend yield | 3.5% |
| Turnover / mcap | — |
| Returns | |
|---|---|
| ROE | 16.5% |
| ROI | 11.9% |
| ROIC | 12.3% |
| Profit margin | 3.2% |
| Growth | |
|---|---|
| Revenue growing | No |
| Profits growing | No |
| Revenue up 3y | No |
| Revenue up 5y | No |
| Earnings growth 3y (net profit CAGR) | -0.24% |
| Quality | |
|---|---|
| Profitable | Yes |
| Margin expanding | No |
| Buying back stock | Yes |
| Diluting (TTM) | No |
| Debt/Equity | — |
| Podcast bulls (TTM) | Sign up |
| Podcast bears (TTM) | Sign up |
| Podcast sentiment (TTM) | Sign up |
| Podcast sentiment % (TTM) | Sign up |
| News sentiment (TTM) | 3 |
| Quality score | -11.1% |
| Insiders | |
|---|---|
| Buys, 1w | Sign up |
| Buys, 1m | Sign up |
| Buys, 1y | Sign up |
| Sells, 1w | Sign up |
| Sells, 1m | Sign up |
| Sells, 1y | Sign up |
Sign up to see this company's insider trades
| Figure | FY 2026 | FY 2025 | FY 2024 | FY 2023 | FY 2022 | FY 2021 | FY 2020 | FY 2019 | FY 2018 | FY 2017 | FY 2016 | FY 2015 | FY 2014 | FY 2013 |
|---|---|---|---|---|---|---|---|---|---|---|---|---|---|---|
| Revenue | 51.925B | 52.658B | 48.842B | 45.619B | 43.453B | 33.961B | 34.659B | 34.609B | 30.921B | 24.996B | 22.705B | 19.166B | 15.604B | 12.463B |
| Net profit | 1.685B | 2.021B | 2.322B | 1.697B | 2.208B | 1.068B | 1.194B | 982.62M | 1.077B | 741.092M | 560.372M | 563.515M | 390.006M | 231.698M |
| Free cash flow | 3.042B | 411.707M | 1.965B | 799.275M | 985.046M | -841.997M | 945.187M | 461.693M | -6.845M | 282.343M | -230.83M | — | — | — |
| Figure | FY 2026 | FY 2025 | FY 2024 | FY 2023 | FY 2022 | FY 2021 | FY 2020 | FY 2019 | FY 2018 | FY 2017 | FY 2016 | FY 2015 | FY 2014 | FY 2013 |
|---|---|---|---|---|---|---|---|---|---|---|---|---|---|---|
| Share price | 1.1K | 1.135K | 1.233K | 855 | 1.313K | 569.39 | 636.93 | 818.09 | 1.274K | 1.628K | 650.8 | 790.94 | 310.91 | 216.68 |
| Price performance 12m | -0.03 | -0.08 | 0.44 | -0.35 | 1.31 | -0.11 | -0.22 | -0.36 | -0.22 | 1.5 | -0.18 | 1.54 | 0.43 | — |
Filed figures
Lines the statements and their notes report beside the headline figures, read from the filings' XBRL as filed (no restatement applied), with figures computed from one filing's own lines. Cash-flow lines carry their cash direction: an outflow is negative. Each period links to its filing; a figure's period, report date and tag are in its tooltip.
| Figure | Mar 2017 | Mar 2018 | Mar 2019 | Mar 2020 | Mar 2021 | Mar 2022 | Mar 2023 | Mar 2024 | Mar 2025 | Mar 2026 |
|---|---|---|---|---|---|---|---|---|---|---|
| Balance sheet detail | ||||||||||
| Trade receivables (JPY) | 1.61B | 1.85B | 1.92B | 1.69B | 2.1B | 2.6B | 2.47B | 2.73B | 3.28B | 2.77B |
| ↳ YoY growth | +21.5% | +14.8% | +3.5% | -11.8% | +24.5% | +23.6% | -5.1% | +10.7% | +19.9% | -15.4% |
| ↳ 5y CAGR | +9.7% | +10.0% | +5.9% | +7.4% | +14.2% | +5.7% | ||||
| Borrowings, current (JPY) | 1.43B | 1.47B | 1.83B | 1.75B | 1.75B | 2.78B | 2.9B | 2.55B | 2.95B | 3.16B |
| Borrowings, non-current (JPY) | 323M | 1.1B | 1.02B | 2.67B | 2.18B | 2.78B | 2.9B | 1.75B | 1.54B | 1.46B |
| Cash and deposits (JPY) | 644M | 1.27B | 1.4B | 3.53B | 1.83B | 1.17B | 1.42B | 1.32B | 1.73B | 1.81B |
| Intangible assets (JPY) | 469M | 443M | 377M | 330M | 359M | 450M | 624M | 893M | 834M | 2.05B |
| Net debt (borrowings + leases - cash) (JPY) | 1.11B | 1.3B | 1.45B | 897M | 2.1B | 4.39B | 4.38B | 2.98B | 2.76B | 2.8B |
| Cash flow detail | ||||||||||
| Operating cash flow (JPY) | 388M | 134M | 690M | 1.09B | -389M | 1.3B | 1.24B | 2.36B | 1.21B | 3.05B |
| Purchases of property, plant and equipment (JPY) | -14.8M | -36.7M | -93.2M | -6.58M | -288M | -5.26M | -65M | -15.9M | -312M | -9.94M |
| Purchases of intangible assets (JPY) | -90.9M | -104M | -135M | -143M | -166M | -307M | -380M | -382M | -484M | -1.27B |
| Change in receivables (cash effect) (JPY) | -286M | -238M | -65.7M | 226M | -414M | -497M | 132M | -263M | -545M | 506M |
| Change in inventories (cash effect) (JPY) | -452M | -985M | -587M | -512M | -1.53B | -1.5B | -483M | -453M | -703M | 955M |
| Change in payables (cash effect) (JPY) | -117M | 222M | 160M | -456M | 404M | 331M | -111M | 89M | 57.5M | -275M |
| Dividends paid (cash effect) (JPY) | -95.8M | -144M | -239M | -332M | -378M | -378M | -587M | -631M | -762M | -872M |
| Share buybacks (cash effect) (JPY) | — | -224,000 | -175M | -76.9M | — | -2.81B | -420M | — | — | -1,000M |
| Interest paid (cash effect) (JPY) | -11M | -12.5M | -11.3M | -10.1M | -15.2M | -19.6M | -24M | -18.5M | -31.4M | -50.9M |
| Income taxes paid (cash effect) (JPY) | -231M | -421M | -502M | -505M | -601M | -485M | -1.31B | -647M | -1.15B | -871M |
| Operating cash flow before change in receivables (JPY) | 674M | 372M | 755M | 868M | 25.1M | 1.8B | 1.11B | 2.63B | 1.75B | 2.55B |
| Free cash flow (OCF - PPE - intangibles) (JPY) | 282M | -6.85M | 462M | 945M | -842M | 985M | 799M | 1.96B | 412M | 1.77B |
| Income detail | ||||||||||
| Provision for credit losses (JPY) | -336,000 | -726,000 | — | — | — | — | — | — | — | — |
| Credit cost ratio (credit losses / average receivables) (%) | 0.0% | 0.0% | — | — | — | — | — | — | — | — |
| Reported | Jun 28, 2017 | Jun 27, 2018 | Jun 26, 2019 | Jun 26, 2020 | Jun 25, 2021 | Jun 24, 2022 | Jun 23, 2023 | Jun 28, 2024 | Jun 23, 2025 | Jun 23, 2026 |
Sign up to see institutional holdings
Sign UpPodcast Mentions
Sign up to see podcast mentions and sentiment
Sign UpTimely disclosures published on TDnet, newest first, titles as filed in Japanese. The link opens the disclosure on TDnet. Filings with EDINET (periodic reports, extraordinary reports, offerings, holding and buy-back reports), newest first, titles as filed in Japanese. The link opens the filing on EDINET. Press releases from the company's own website, newest first.


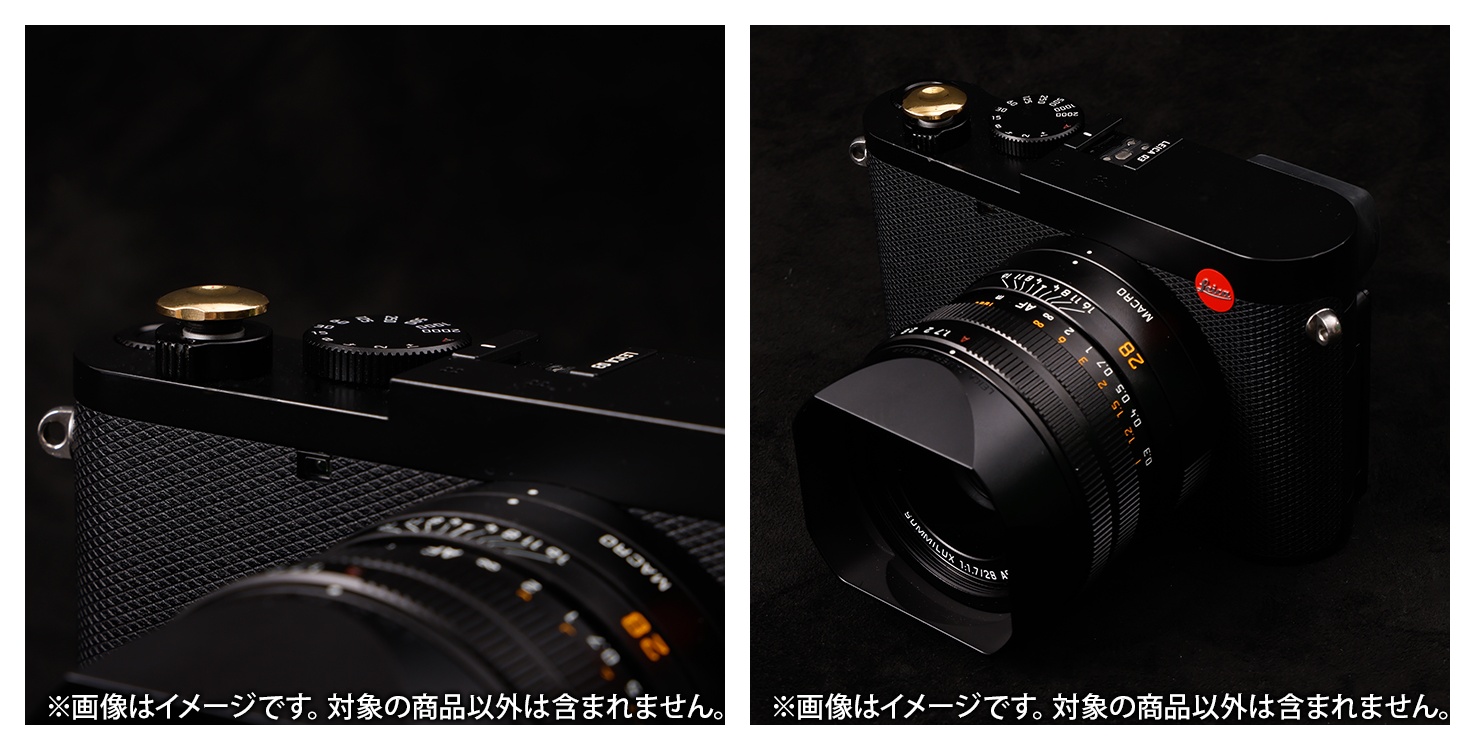



 ■今後の展開
店頭展示やスタイリング紹介、オンライン特集ページなどを通じ、カメラとファッションをつなぐ新しい楽しみ方を提案してまいります。
※内容は検討段階であり、詳細は決定次第お知らせします。


Prompts
Click prompts to add them under the company line, click again to take one out, then copy the result into your AI chat. Shared by Asian Century Stocks and Uncovered Thai Stocks. Thank you.
Syuppin Co., Ltd. (ticker 3179), listed in Japan.
Copied
ETFs Holding Syuppin Co., Ltd.
Exchange-traded funds whose newest published daily portfolio holds one of the company's listings, largest weight first.
| ETF | Weight in ETF | Shares | Market value | As of |
|---|---|---|---|---|
| DFIS | 0.00% | 37,400 | $ 239.51K | Nov 12, 2026 |
| DFSI | 0.00% | 3,200 | $ 20.493K | Nov 12, 2026 |
| DFIC | 0.00% | 31,000 | $ 198.524K | Nov 12, 2026 |
| DFAI | 0.00% | 22,000 | $ 140.888K | Nov 12, 2026 |
| DFAX | 0.00% | 13,600 | $ 87.094K | Nov 12, 2026 |
| AVDE | 0.00% | 11,400 | $ 75.515K | Nov 16, 2026 |
| AVDV | 0.00% | 2,200 | $ 14.573K | Nov 16, 2026 |
| AVSD | 0.00% | 2,600 | $ 17.223K | Nov 16, 2026 |
| AVDS | 0.00% | 1,600 | $ 10.599K | Nov 16, 2026 |