First Half of Fiscal Year Ending September 30, 2026 Results Presentation Sanyo Trading Co., Ltd. (Stock exchange code: 3176) Copyright © 2023 SANYO TRADING CO., LTD. All Rights Reserved. May 18, 2026 Today's Topics 1 Net sales and operating profit…
First Half of Fiscal Year
Ending September 30, 2026
Results Presentation
Sanyo Trading Co., Ltd. (Stock exchange code: 3176)
Copyright © 2023 SANYO TRADING CO., LTD. All Rights Reserved.
May 18, 2026
Today's Topics
1
Net sales and operating profit increased year on year. Full-year earnings forecast revised
upward following strong first-half performance.
2
There was no impact from the Middle East situation in the first half.
3
Continued execution of capital policy measures and planned implementation of
management with awareness of cost of capital and share prices.
4
To achieve important targets under SV2028*, we steadily executed a growth strategy, with
growth in existing businesses and new business development as two core objectives.
- SV2028: SANYO VISION 2028 A five-year, long-term management plan that was announced in November 2023
(The same applies hereafter.)
Copyright © 2023 SANYO TRADING CO., LTD. All Rights Reserved.
2
INDEX
01
Results for First Half of Fiscal Year Ending
September 30, 2026
02
Forecasts for Fiscal Year Ending September 30, 2026
03
Topics Related to Capital Policy
04
Toward Achieving SV2028
Copyright © 2023 SANYO TRADING CO., LTD. All Rights Reserved.
3
01
01
Results for First Half of Fiscal Year Ending
September 30, 2026
02
Forecasts for Fiscal Year Ending September 30, 2026
03
Topics Related to Capital Policy
04
Toward Achieving SV2028
Copyright © 2023 SANYO TRADING CO., LTD. All Rights Reserved.
4
Results for First Half of Fiscal Year Ending September 30, 2026
◼ Profits increased as SG&A expenses were controlled through productivity improvements, in addition to the rise
in gross profit that resulted mainly from an increase in net sales and price revisions.
◼ Progress toward the initial full-year plan: Steady progress with 72% for operating profit and 89.2% for profit
attributable to owners of parent. Full-year forecasts were revised upwards (described below).
◼ Profit attributable to owners of parent increased year on year, reflecting the recording of a gain on sale of
cross-shareholdings.
FYE September 2025
FYE September 2026
H1
(Million yen)
H1
Result
Result
Full fiscal year
Initial full
fiscal year plan
YoY
68,129
11,815
70,258
12,544
+3.1%
7,711
4,104
8,077
4,466
+4.7%
4,410
Profit attributable to
owners of parent
EPS (yen)
Net sales
Gross profit
(Gross profit ratio)
Selling, general and
administrative expenses
Operating profit
(Operating profit ratio)
Ordinary profit
(Ordinary profit ratio)
Rate of progress
(announced on Nov. 10, 2025)
130,000
54.0%
+8.8%
6,200
72.0%
4,506
+2.2%
6,500
69.3%
3,451
3,657
+5.9%
4,100
89.2%
119.86
126.93
142.31
(17.3%)
(6.0%)
(6.5%)
(17.9%)
(6.4%)
(6.4%)
+6.2%
(4.8%)
( 5.0%)
Note: The Company plans to conduct a 2-for-1 split of its common shares effective July 1, 2026, but the figures for earnings per share (EPS) are those before the stock split.
Copyright © 2023 SANYO TRADING CO., LTD. All Rights Reserved.
5
Factors Affecting Operating Profit in the First Half of Fiscal Year
Ending September 30, 2026
(Million yen)
• Increase in logistics expenses
(transportation fees and
storage fees)
• Floor expansion etc.
6,000
• Increased personnel at
Group companies
5,000
728
-121
4,000
Profit
increase from
sales growth
3,000
2,000
4,104
1,000
Increase in
personnel
expenses
-10
Increase in
depreciation
-235
Other
Increase in SG&A
(including amortization
of goodwill)
(+) Increase in depreciation
(+) Increase in goodwill amortization
associated with the consolidation of EMAS
(-) Decrease in goodwill amortization
associated with impairment
4,466
0
FYE September
2025 H1
+362
FYE September
2026 H1
Copyright © 2023 SANYO TRADING CO., LTD. All Rights Reserved.
6
Summary of Results by Segment
Net sales YoY
Operating profit YoY
+2.12 billion yen (+3.1%)
+0.36 billion yen (+8.8%)
(Million yen)
(Million yen)
70,258
68,129
Fine
Chemicals
21,741
+319
(+1.5%)
Industrial
Products
19,411
+720
(+3.7%)
20,131
Sustainability
6,347
(74)
(-1.2%)
6,273
Life Science
20,025
+983
(+4.9%)
22,060
784
FYE September
2025 H1
FYE September
2026 H1
+108
(+7.8%)
1,386
Increase in sales /
Increase in profit
Industrial Products
Increase in sales /
Decrease in profit
Sustainability
Decrease in sales /
Decrease in profit
Life Science
Increase in sales /
Increase in profit
1,494
1,825
(19)
(-1.1%)
1,806
873
(79)
(-9.1%)
794
1,007
+179
(+17.7%)
1,186
21,008
603
4,466
4,104
Fine Chemicals
(989)
(813)
FYE September
2025 H1
FYE September
2026 H1
Copyright © 2023 SANYO TRADING CO., LTD. All Rights Reserved.
7
Segment Composition
◼ Fine Chemicals, Industrial Products, and Life Science account for approx. 30% each in terms of net sales.
◼ There were no material changes in net sales and operating profit composition by segment from the end of the
previous fiscal year.
Fine Chemicals
Industrial Products
Sustainability
Life Science
Field: Synthetic rubber, paints, inks
and coating agents
Field: All moving vehicles
Field: Renewable energy (biomass,
geothermal energy and marine
resources) and livestock feed
Field: Food additives, cosmetics,
home medical care, scientific
instruments and biotechnologies
Rubber
merchandise
40%
30%
Chemical
merchandise
Segment composition
31%
Automotive
interior parts
40%
Benchmarking services
provided by means of scanning
Segment composition
35%
30%
29%
20%
20%
10%
10%
Wood biomass
40%
Electronic
materials
Marine surveys for
offshore wind power
generation
Segment composition
40%
Evaluation
system
Segment composition
30%
30%
30%
29%
20%
20%
16%
10%
23%
10%
9%
0%
0%
Net sales Operating profit
0%
Net sales
Operating profit
Net sales
Operating profit
0%
Net sales
Operating profit
Note: net sales and operating profit ratios by segment were calculated based on values before consolidation adjustments. The total does not add up to 100% because "Others" are not indicated.
Copyright © 2023 SANYO TRADING CO., LTD. All Rights Reserved.
8
Overview of Each Segment: Fine Chemicals
(Million yen)
FYE September
2025 H1
FYE September
2026 H1
YoY
Net sales
21,741
22,060
+1.5%
Operating
profit
1,386
1,494
+7.8%
(Operating profit ratio)
(6.4%)
(6.8%)
Comments
Net sales
Rubber:
(+) Demand for raw materials for domestic markets
was brisk.
Chemicals: (-) Demand for mainstay domestic products,
including inks, paints, and raw materials of
adhesives, remained weak.
(+) New business launch
Operating
profit
Rubber:
(+) An increase in sales and revision of sales prices.
Chemicals: (+) Sales price revisions.
[Major products we deal in]
Thermoplastic elastomers
and resins
Specialty monomers
• High-pressure hose
• Exterior wall paints
• Tires
• Home electric
appliances
Rubber reinforcements
and fillers
• Inks and printed
materials
• Adhesives
• Plastic products
Pigments
Wax
Silane coupling
agents
Copyright © 2023 SANYO TRADING CO., LTD. All Rights Reserved.
9
Overview of Each Segment: Industrial Products
(Million yen)
FYE September
2025 H1
FYE September
2026 H1
YoY
Net sales
Net sales
19,411
20,131
+3.7%
Operating
profit
1,825
1,806
(1.1%)
(Operating profit ratio)
(9.4%)
(9.0%)
Comments
Domestic: (+) Steady sales
Overseas: (+) Some exports from Alabama, the United States
and Thailand were strong.
(+) Consolidation of EMAS
(-) The market environment remained challenging in
China.
(-) Upfront investment for the development of new
products
(+) Higher level of profit due to exchange rate
fluctuations
Operating
profit
[Major products we deal in]
Flexible touch sensors
Lumbar support
systems
Gas springs
Sensors that detect
children left in vehicles
Sustainable material
(QUARTECH)
4D front radar
Benchmarking services provided
by means of scanning
Seat heaters
Seat sensor
4D corner radar
Motor for seat
Heater for high-voltage batteries
Filter for cleaning vehicle interior air
EV battery maintenance equipment (Ever Blüe Drive)
Copyright © 2023 SANYO TRADING CO., LTD. All Rights Reserved.
10
Overview of Each Segment: Sustainability
(Million yen)
FYE September
2025 H1
FYE September
2026 H1
YoY
Net sales
Net sales
6,347
6,273
(1.2%)
Operating
profit
873
794
(9.1%)
(13.8%)
(Operating profit ratio)
[Major products we deal in]
(12.7%)
Comments
Operating
profit
(+) Strong sales of wearing parts related to feed processing
machines
The sales were posted based on the steady progress of
major projects in the wood-biomass-related business.
(-) Impact of a transitional period in the ocean developmentrelated business.
Geothermal heat-related equipment also recorded a
decrease.
(-) Decline in profit attributed to the above decline in sales in the
ocean development-related business.
Pellet mill
Low-temperature
belt dryer for
wood chips
Gasification unit
Remotely operated vehicle (ROV)
• Feed/fertilizer
• Oil and gas
• Food, industrial
products, etc.
• Geothermal development
TP cover
• Renewable energy
• Offshore wind power
generation
• Ocean investigation
(Different types of pellets)
Various hammer mills
Cogeneration unit
Top drive system
Cable protection system
Copyright © 2023 SANYO TRADING CO., LTD. All Rights Reserved.
11
Overview of Each Segment: Life Science
(Million yen)
FYE September
2025 H1
FYE September
2026 H1
YoY
Comments
Net sales
20,025
21,008
+4.9%
Operating
profit
1,007
1,186
+17.7%
(Operating profit ratio)
(5.0%)
(5.6%)
[Major products we deal in]
Net sales
(+) Material Solution*: Growth of core products for export business,
including electrical materials
(+) Scientific instruments: Progress made in delivery in large
projects on the back of a recovery in demand
(+) YPTECH: Increase in sales quantity of functional feed materials
(-) Scrum Inc.: Impact of termination of contract for biotech
products
Operating
profit
(+) Strong performances of Material Solution, scientific
instruments, and YPTECH
(-) Impact of biotech products
Electronic materials
Different types
of film
Cosmetics (raw
materials / containers)
• Electronics and battery
3D bioprinter
• Research and
development
• Air freshener
• Pet food
Equipment for dispersion
and powder evaluation
• Diaper
• Quality control
• Genetic research
• Cellular research
Next-generation sequencer
for genetic analysis (NGS)
• Production control
Fragrance
High-performance
resins
Weather resistance tester
• Protein research
• Pathology research
• Inspection
Food Tech
Gene-discovery analysis services
and drug discovery support services
• Drug discovery
support
Copyright © 2023 SANYO TRADING CO., LTD. All Rights Reserved.
12
ASEAN
8.0%
Net Sales and Situations in Each Region
China
5.3%
◼ Overseas sales increased 9.0% year on year. Net sales were strong in North
America and ASEAN. In China, sales decreased but showed signs of bottoming out.
North
◼ Development of locally originated businesses is underway under the initiative of
America
17.1%
overseas bases.
China
Net sales YoY
➢ The market environment
remained challenging, with intensifying
competition between Japanese and Chinese
automakers.
(4%)
(Germany)
➢ Strong performance attributed to an
increase in demand for cables
➢ Sales activities, such as running a booth
at trade shows, are being strengthened.
Net Sales
in Each Region
- First half of fiscal year ending
September 30, 2026
Japan
65.5%
North America
➢ Products related to lithium-ion batteries for
EVs performed well.
Other
Other
4.0%
25/9期
2025/9
H1
上半期
(America)
➢ Automobile-related products for Alabama (which
has been operating in full scale since July 2023),
highly functional resins, and films performed well.
26/9期
2026/9
H1
上半期
(Mexico)
➢ Rubber-related products struggled due to a
decline in demand in sales destinations.
ASEAN
(Thailand)
➢ Exports of some automobile-related
products were strong.
➢ Brisk performance has been achieved in
sales of rubber-related high value-added
merchandise.
(Singapore)
➢ Consolidation of EMAS
Net sales YoY
Net sales YoY
+22%
+22%
2025/9
25/9期
H1
上半期
2026/9
26/9期
H1
上半期
25/9期
2025/9
H1
上半期
26/9期
2026/9
H1
上半期
Copyright © 2023 SANYO TRADING CO., LTD. All Rights Reserved.
13
02
01
Results for First Half of Fiscal Year Ending
September 30, 2026
02
Forecasts for Fiscal Year Ending September 30, 2026
03
Topics Related to Capital Policy
04
Toward Achieving SV2028
Copyright © 2023 SANYO TRADING CO., LTD. All Rights Reserved.
14
Forecasts for Fiscal Year Ending September 30, 2026
◼ Forecasts were revised upwards, reflecting the progress in the first half.
◼ Sales and profits are expected to increase year on year, with a decline in profits from certain businesses absorbed
by growth and improved profitability in existing businesses.
FYE September 2025
Full-year results
(Million yen)
Net sales
132,703
Gross profit
22,564
(Gross profit ratio)
FYE September 2026
Initial full
fiscal year plan
(announced on
Nov. 10, 2025)
Revised forecasts
YoY
(announced on
May 12, 2026)
Vs. initial plan
YoY
130,000
(2.0%)
133,000
+3,000
+0.2%
(17.0%)
Selling, general and
administrative expenses
16,133
Operating profit
6,430
(4.8%)
6,200
(3.6%)
6,500
(Operating profit ratio)
+300
+1.1%
Ordinary profit
(4.8%)
(4.9%)
6,879
(5.2%)
6,500
(5.5%)
6,600
(Ordinary profit ratio)
+100
(4.1%)
Profit attributable to
owners of parent
4,615
4,100
(11.2%)
4,800
+700
+4.0%
EPS (yen)
80.12
71.16
83.28
(5.0%)
(5.0%)
Note: The Company plans to conduct a 2-for-1 split of its common shares effective July 1, 2026. Accordingly, basic earnings per share (EPS) shows an amount that takes into account the impact of the
stock split on both full-year results for the fiscal year ended September 30, 2025 and forecasts for the fiscal year ending September 30, 2026.
Copyright © 2023 SANYO TRADING CO., LTD. All Rights Reserved.
15
Forecasts by Segment for Fiscal Year Ending September 30, 2026
◼ We will respond promptly to cost increases and tight supply, which are expected given the turmoil in the Middle
East, aiming to mitigate their impact.
◼ We have revised upwards our full-year forecasts in consideration of the materialization of ongoing projects.
Net sales
(Million yen)
FYE September
2025
Result
Operating profit
FYE September FYE September
2026
2026
Initial forecast Revised forecast
FYE September
2025
Result
YoY
FYE September FYE September
2026
2026
Initial forecast Revised forecast
YoY
Fine Chemicals
42,384
44,000
44,750
+5.6%
2,413
2,700
2,800
+16.0%
Industrial Products
36,812
35,000
35,750
(2.9%)
2,682
2,500
2,550
(4.9%)
Sustainability
13,518
11,500
12,250
(9.4%)
1,886
1,100
1,150
(39.0%)
Life Science
38,670
38,000
38,750
+0.2%
1,362
1,600
1,700
+24.8%
Other
1,318
1,500
1,500
(1,914)
(1,700)
(1,700)
Total
132,703
130,000
133,000
+0.2%
6,430
6,200
6,500
+1.1%
Copyright © 2023 SANYO TRADING CO., LTD. All Rights Reserved.
16
03
01
Results for First Half of Fiscal Year Ending
September 30, 2026
02
Forecasts for Fiscal Year Ending September 30, 2026
03
Topics Related to Capital Policy
04
Toward Achieving SV2028
Copyright © 2023 SANYO TRADING CO., LTD. All Rights Reserved.
17
Status of reduction of cross-shareholdings
◼ A full-scale reduction of cross-shareholdings began in the previous fiscal year (ended September 30, 2025).
◼ We drove the sale of shares in business partners in the first half and posted 1.24 billion yen as a gain on sale of
investment securities.
◼ We will continue with the policy of reducing cross-shareholdings, judging the reasonability of holding them from
the medium- to long-term perspective.
◼ The ratio to net assets after the reduction is approximately 5%.
Amount of cross-shareholdings posted on the
政策保有株式BS計上額(時価)
(Million yen)
Number of stocks
銘柄数
Nikkei Stock Average (closing price)
日経平均株価(終値)
balance sheet (market value)
50,339
6,000
51,064
44,933
5,000
37,920
40,487
39,895
35,618
4,000
3,000
28
28
29
29
29
23
2,000
16
1,000
0
2024.9
FYE September 2024
2024.12
2025.3
2025.6
FYE September 2025
2025.9
2025.12
2026.3
FYE September 2026
Copyright © 2023 SANYO TRADING CO., LTD. All Rights Reserved.
18
Impairment of Investment Securities
◼ A loss on valuation of investments was posted for startup investment projects, which show a gap from the initial
business plan.
◼ Carefully examine each project and reflect the results in future investing activities and decision-making processes.
◼ Monitor investment destinations regularly, report to the Board of Directors, and take appropriate action in a timely
manner.
Further improvement in financial soundness
• Improvement in balance sheet quality
Evaluation of businesses
• Strictly apply investment discipline (withdrawal criteria).
• Shift management resources to growing businesses by
choosing to focus on core businesses.
Capital efficiency improvement
Major impairment cases
(FYE September 2025 to FYE September 2026)
• Business of developing and manufacturing new film materials
• Business of supporting drug development with biotechnology
• Development and manufacturing of biomass silica
(rice husk silica)
• Service of watching over senior citizens with location
information for elderly facilities, etc.
• Optimize capital efficiency indicators, including ROE
and ROIC.
Copyright © 2023 SANYO TRADING CO., LTD. All Rights Reserved.
19
Stock Split and Shareholder Returns
◼ We have conducted a 2-for-1 split of our shares, targeting an investment unit price of around 100,000 yen, which
Tokyo Stock Exchange has indicated is the level sought by private investors.
◼ In light of our strong performance in the first half, we have increased the interim dividend by 1 yen from our
initial forecast.
◼ We revised the forecast year-end dividend to reflect the stock split, increasing it by 1 yen when calculating it
based on the ratio before the stock split.
Continued payment of stable dividends over the
◼ We also flexibly consider the purchase of treasury shares.
13 consecutive years since the company was first listed
Payout ratio (%)
60.0%
Dividend policy for the SANYO VISION 2028 period
SANYO VISION 2028 period
A payout ratio of 30% or more and progressive dividends
50.0%
Interim
dividend
中間配当
Year-end
期末配当dividend
Dividend (yen)
80
70
Payout ratio
配当性向
Annual
dividend
55 yen
40.0%
Annual
dividend
57 yen
30.0%
Dividend
forecast
60 yen
36.6%
36.0%
29
(Forecast)
30.4%
60
18.5
20.0%
15.5
12.5
10.0%
7.5
12.5
7.5
2013.9
2014.9
22
12
11.5
2015.9
2016.9
2017.9
2026.9
Result
Initial forecast After revision
28 yen
29 yen
30 yen
29 yen
29 yen
15 yen
(30 yen)
57 yen
58 yen
45 yen
(60 yen)
50
Year-end
40
Annual
30
Values in ( ) are dividend forecasts calculated based
on the ratio before the stock split.
20
13
14
2025.9
17
9.5
7.5
19
21
Interim
30
33
20
Dividend policy for FYE September 2026
15
2018.9
18.5
18.5
19
19
21
2019.9
2020.9
2021.9
2022.9
2023.9
22
2024.9
28
30
(Result)
10
0.0%
0
2012.9
2025.9
2026.9
2028.9
- Effective date: On July 1, 2026, the Company will conduct a 2-for-1 split of its common stock. The forecast year-end dividend for the fiscal year ending September 30, 2026 was calculated based on the ratio before the stock split.
Copyright © 2023 SANYO TRADING CO., LTD. All Rights Reserved.
20
04
01
Results for First Half of Fiscal Year Ending
September 30, 2026
02
Forecasts for Fiscal Year Ending September 30, 2026
03
Topics Related to Capital Policy
04
Toward Achieving SV2028
Copyright © 2023 SANYO TRADING CO., LTD. All Rights Reserved.
21
Market-oriented Strategy in Growth Markets
◼ Expanding businesses in growth markets with expertise in business segments and cross-sectoral
collaboration
Our strengths
Target Markets / Products
Partnership model
Electrical materials(semiconductors, battery, data centers)
• Electrical materials and chemicals
• Carbon nanotubes(CNT)
• LiB battery-related parts and materials
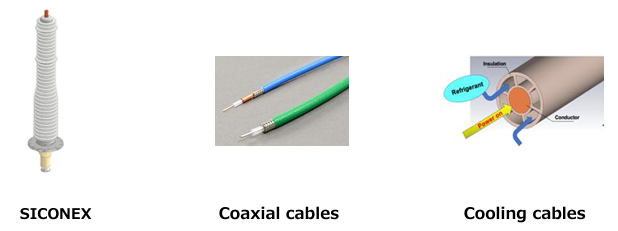
• High-frequency coaxial cable
• Cooling cable
High value-added/niche products
Expertise and technical sales
Strong financial base
×
Strategic measures
Enhancing product models handled
Expanding the value chain
Enhancing overseas operations
Business investment and M&A
EV
• EV battery checker
• Benchmarking services
• Functional compounding agents
(for heat release/flame resistance)
Fine Chemicals
Industrial Products
Life Science
Fine Chemicals
Industrial Products
Renewable energy
• Equipment related to offshore wind power
generation systems
• Wood-biomass-related equipment
• Equipment related to geothermal power
generation
Food tech
• Solutions for reducing food loss
• Food additives
• New functional feeds and feed additives
Related segments
Sustainability
• Pellet mills for feed
Sustainability
Life Science
Copyright © 2025 SANYO TRADING CO., LTD. All Rights Reserved.
22
Fine Chemicals
Rubber-related Products:
Sales Expansion of Next-generation Core Products
- Dowhon:
A major Chinese manufacturer of
pre-compound with chemicals
blended into fluorine-containing
rubber in advance. Featuring
superior heat resistance, oil
resistance, and chemical
resistance, fluorine-containing
rubber is used in functional
rubber parts in addition
to automotive hoses.
◼ Sole agent in Japan of fluorine-containing rubber from Dowhon*,
a leading company in China
◼ Sales expansion activities targeting Japanese corporate customers based on stable supply (annual production
capacity of 10,000 tons, which will be increased to 14,000 tons by 2027)
◼ Driving environmentally friendly business by including fluorine-containing rubber products compatible with
PFAS-free emulsifiers
Synergy of the two companies' strengths
Sanyo Trading
Provide solutions
Globalization
[Market size and roadmap of development]
Automotive parts
Dowhon
World-leading supply
capacity
High technological
capabilities
Environmental
considerations
[Targets]
Achieving domestic
market share at 20%
Full-scale
sales
2024/9 - 2025/9
• Building a system for
stable supply
• PFAS-free emulsifierbased products
2026/9
[Examples of applications of finished goods]
(Annual market size of
5,000 tons*)
- The current market size in 2025
2027/9
2028/9
2029/9 and onward
Healthcare/ food equipment
Chemicals plant
Semiconductor
manufacturing equipment
Aerospace
Automotive parts: O-shaped rings for fuel injectors, inner surface seal for fuel hoses,
engine oil seal
Chemical plants: O-shaped rings for valves, pump shaft seal
Semiconductor manufacturing equipment: O-shaped rings for vacuum chambers,
seal for gas supply lines
Healthcare/food equipment: Gaskets for pipe flanges, seal for pump's sliding section
Aerospace: Heat-resistant seal for aircraft engines
Copyright © 2023 SANYO TRADING CO., LTD. All Rights Reserved.
23
Sustainability
Expansion of Deep-ocean Mineral Resource Business
◼ Participation in the Minamitorishima Rare Earth Project — Delivery of lifting pipes, floats, ROV, and miner and
provision of technical support
Total support towards success in full-scale test-mining (planned in 2027)
Leveraging our outstanding technologies established 6,000 meters below sea level, we will lead the development of nextgeneration deep-ocean mineral resources, including rare earth mud, manganese nodules, and hydrothermal deposits.
We will open up unknown domains of deep-ocean mineral resources and accelerate the growth of our ocean business.
Chikyu
deep-sea scientific
drilling vessel
Lifting pipes: Delivered at the end of May 2025, Total: 424 pipes
Floats: Delivered at the end of August 2024, Total: 820 units
Lifting pipes
ROV
(Remote-controlled unmanned
underwater vehicle)
Edokko Mark-1
©SIP/JAMSTEC
Marine environment
monitoring system
ROV: Delivered and mounted on Chikyu in the autumn of 2025
©SIP/JAMSTEC
Miner: Delivered in the winter of 2025 after completion of its maintenance
Edokko Mark-1
Closed-loop
mining system
6,000 m below
the sea level
Miner
©SIP/JAMSTEC
©SIP/JAMSTEC
©SIP/JAMSTEC
Copyright © 2023 SANYO TRADING CO., LTD. All Rights Reserved.
24
Sustainability
Expansion of Business Related to Offshore Wind Power Generation
◼ Starting with fixed-foundation projects in shallow sea areas, we expect floating projects in deep sea areas to begin
increasing around 2033.
◼ With an increase in floating projects, the necessary equipment will also increase, resulting in the expansion of
earning opportunities of Cosmos Shoji, whose strength lies in broad product lineup.
◼ Fixed-foundation systems are expected to fully begin yielding profit in the fiscal year ending September 30, 2027
or thereafter.
Products we deal in for fixed foundation and floating systems
Fixed foundation system (water depth: 30 m to 40 m)
TP cover
TME (Netherlands)
Floating system (water depth: 100 m or deeper):
Compatible with sea areas of Japan
Davit crane
Granada Cranes (UK)
TP cover, davit crane, and CPS
Also used in floating systems
Fiber mooring rope
CSL (Brazil)
Lankhorst (Netherlands)
Connector
Balltec (UK)
Mooring chain
GWEC (UK)
Pile gripper
OSBIT (UK)
Semi-submersible
Hammer
MENCK (Germany)
Linear tensioner
Bezemer (Netherlands)
Cable protector (CPS)
Balmoral (UK)
Underwater
inspection service
Barge
Spar-buoy
TLP
Underwater buoy
Balmoral (UK)
Anchor
Bruce Anchor (UK)
DELP (Brazil)
ROV
(Remote-controlled unmanned
underwater vehicle)
Copyright © 2023 SANYO TRADING CO., LTD. All Rights Reserved.
25
Sustainability
Enhancing Value Chain of Offshore Wind Power and Marine Survey Businesses
— Implementation of Strategic M&A (Kitakyu Sensui) —
◼ We have acquired shares in Kitakyu Sensui, which has been providing marine survey, inspection, and
construction service, etc. in the Kyushu area for more than 40 years.
◼ We will drive initiatives to win new deals in offshore wind power and marine survey businesses by providing
solutions combining the trading company function of Cosmos Shoji (goods) and the research function of Kitakyu
Sensui (people).
◼ We will drive M&A and business investments further with an aim to enhance services, so as to be Japan's core
corporate entity in the marine business.
Strengths of Kitakyu Sensui
Conceptual rendering of value chain enhancement
• Solid business foundation in the Kyushu area based on more than 40 years of business history
• Readiness to provide services of conducting surveys and inspections with ROV in addition to
underwater operation by divers
• A 7-meter-deep pool at the headquarters is available for test run, demonstrations, and training
of human resources.
(3) Value-added services as something extra
Driving M&A and
business
investment further
Building the second pillar
following the ocean
resource development
business
Kitakyu Sensui
(1) Marine equipment (goods)
Future business development
March 2027-
Launch of
services in Japan
FY2030-
(2) Marine surveys/construction
and inspection (people)
FY2034-
NEDO floating system
Full-scale operation of
demonstration
business with commercial
floating systems
Software, materials, and
equipment (ROV, etc.)
Three Strengths
Track record, practical personnel, and customer base
Copyright © 2023 SANYO TRADING CO., LTD. All Rights Reserved.
26
Investment Strategy
◼ We will implement bolt-on M&A activities in growth fields. The specific strategy is as follows.
Growth
investment
Fine Chemicals
➢ Expansion of overseas sales channels
➢ Investments related to electronic materials (acquiring commercial rights)
➢ Development of new products
Industrial Products
➢ Investments related to automotive aftermarket
(broadening the lineup of products we deal in and enhancing services)
➢ Investment related to environmentally friendly fiber materials
Business
investment
20.0 billion to
30.0 billion yen
Human capital
investment
DX-related
investment
Sustainability
➢ Investments related to offshore wind power generation and marine survey
(broadening the lineup of products we deal in and strengthening the value chain)
➢ Businesses peripheral to wood biomass(broadening the lineup of products we deal in
and enhancing services)
Life Science
➢ Investments related to healthcare(acquiring commercial rights and broadening the
lineup of products we deal in)
➢ Investments related to feed additives (expanding sales channels)
➢ Recruitment, education, assessment, allocation, etc. to promote the idea of Sanyo as a people company
➢ ERP (operation started in October 2024 and horizontally deployed to Group companies)
Copyright © 2023 SANYO TRADING CO., LTD. All Rights Reserved.
27
Investment in Human Capital for Helping Achieve SV2028
— Human Capital Structure of the Sanyo Trading Group —
◼ Human capital of the Group means employees who provide the best solutions in an uncompromising manner.
Ultimate raison d'être of Sanyo Trading (purpose)
Providing the maximum added value to customers
— Touching customers' heartstrings —
Internal support
(motivating opportunities)
Sanyo Growth Style
Producing self-motivated
human resources
Employees' growth
External support
(work environment)
Sanyo Work Style
A workplace environment that
fosters fulfillment at work
Advancing three integrated elements:
hands-on experience, talent
development, and environmental
support
Recruitment
Self-motivated
Evaluation
personnel
Remuneration
Dramatic improvement in the quality
and quantity of the best solutions
Development
Training
Transfer
Staffing
Work
environment
Work styles
Altruism
Values: Act with integrity, Be a challenger,
Demonstrate agility, Pursue innovation,
and Embrace altruism
Continuous
employment
Health and
productivity
management
Support with practical settings and opportunities (on-site experience)
Top niche products
Lean and highly skilled team
Partnership model:
one product, one supplier
Open and inclusive organizational culture
Copyright © 2023 SANYO TRADING CO., LTD. All Rights Reserved.
28
Appendix
Copyright © 2023 SANYO TRADING CO., LTD. All Rights Reserved.
29
[Growth Strategy in Each Segment] Fine Chemicals
◼ This is our founding business. We aim to achieve continued growth by leveraging our functions as a trading
company with high-level expertise.
Our strengths
Business environment
• We deal in a wide variety of products in the fields of
rubber and chemical products
• Our bases in Japan and other countries coordinate to
provide products and services with no regional
differences
• The expertise and technological capabilities we use
in the handling of high value-added products
• Ability to ensure supply stability by leveraging our
financial foundation
• While the domestic market is maturing, excluding the
demand for products with next-generation applications and
functional products, overseas markets continue to expand
• Among overseas suppliers, moves to reduce
investment in the Japanese market and seek high-level
expertise and technological capabilities from trading
companies have been in progress
• Creating new markets through shift to EVs (such as batteries)
• Accelerating switch to environmentally friendly products
×
Basic
strategies
◼ Deepening relationships with overseas suppliers
◼ Strengthening overseas expansion (Japanese manufacturers and overseas local companies)
◼ Newly expanding sales of high value-added/environmentally friendly products
◼ Expansion of investment in core business areas
◼ DX to streamline small-scale businesses
Factors that
are keys to the
achievement of
the plan
◼ Consolidation of distributors by overseas suppliers --> Acquisition of commercial rights
◼ Reorganization of domestic synthetic rubber manufacturers --> Increase in our market share for
the products we deal in
◼ Maintaining the market share of Japanese cars in overseas markets --> Maintaining sales to
automotive parts manufacturers
Results forecasts
Results and outlook of
sales (existing and new) and operating profit
[Period: FYE September 2025 to FYE September 2028]
(Million yen)
Net sales
60,000
Existing business
New business
既存事業
新規事業
Operating profit
40,000
6,000
4,000
20,000
2,000
◼ Rubber: Synthetic rubber from Arlanxeo and silicone rubbers from Dow Toray
Existing ◼ Chemicals: Raw materials for inks, paints, coatings, resins, and adhesives
Business
New
◼ Rubber: Fluoro rubber from Dowhon, functional materials, and naturally derived
materials
◼ Chemicals: Environmentally friendly materials and chemicals for electrical materials
0
0
25/09
25/9期
26/09
26/9期
27/09
27/9期
28/09
28/9期
実績
予算
見通し
見通し
Results
Target
Forecast
Forecast
Copyright © 2023 SANYO TRADING CO., LTD. All Rights Reserved.
30
[Growth Strategy in Each Segment] Industrial Products
◼ This is one of our large drivers of revenue. We will develop new businesses to push forward with the
replacement of our business portfolio.
Our strengths
Business environment
• We provide end-to-end solution services, from sales,
development design, and quality assurance to just-intime delivery
• Business relationships established with every
Japanese automaker
• Knowledge accumulated in the automotive interior
parts business
• Ability to ensure supply stability by leveraging our
financial foundation
• Structural changes in the global automotive industry that
are a result of technological innovation such as the shift to
EVs, autonomous driving, and MaaS
• Commoditization and intensifying competition in existing
businesses
• Growth of non-Japanese automakers
• Expansion of the markets in the field of information and
communications, including the semiconductor, data center,
and quantum computer markets
Basic
strategies
Factors that
are keys to the
achievement of
the plan
×
Results forecasts
Results and outlook of
sales (existing and new) and operating profit
[Period: FYE September 2025 to FYE September 2028]
(Million yen)
Net sales
50,000
Existing business
既存事業
New business
Operating profit
6,000
新規事業
◼ Firmly maintaining existing businesses
◼ Enhancing trade with overseas automakers
◼ Diversifying our value chain functions (from the new car parts market to the aftermarket)
◼ Developing new products and introducing them to the Japanese market
◼ U.S. trade and tariff policy trends --> Impact on profit
◼ Maintaining the share of the Japanese automobiles in overseas markets --> Maintaining sales to
automobile and parts manufacturers
◼ Reinforcing the China Plus One supply system --> Diversifying suppliers
4,000
25,000
2,000
Existing ◼ Automotive interior materials such as seat heaters and lumbar support systems
Business
New
◼ Automotive benchmarking, EV battery testers, environmentally friendly fiber
materials, high-frequency coaxial cables, and optical cables (for next-generation
datacenters and the semiconductor field)
0
0
25/09
25/9期
Results
実績
26/09
26/9期
Target
予算
27/09
27/9期
Forecast
見通し
28/09
28/9期
Forecast
見通し
Copyright © 2023 SANYO TRADING CO., LTD. All Rights Reserved.
31
[Growth Strategy in Each Segment] Sustainability
◼ The growth of business has been accelerated by the expansion of the renewable energy market.
Our strengths
Business environment
• We provide comprehensive end-to-end solutions from
plant design and construction to after-sales services
• An unrivaled share of the domestic pellet mills for the
feed market
• Large share of the geothermal development equipment
market
• An extensive lineup of equipment related to offshore
wind power generation
• Acceleration of automation and streamlining of feed
manufacturing sites
• Progress in decarbonization and the shift to renewable
energy in the energy mix
• Trend of major electric power companies strengthening
their renewable energy businesses
• Offshore wind power generation systems transitioning from
fixed-foundation systems to floating systems
Basic
strategies
Factors that
are keys to the
achievement of
the plan
×
◼ Tapping into demand for the equipment replacement supported by a large market share
◼ Increasing recurring revenue with after-sales services for equipment (pellet mills and wood
biomass)
◼ Developing new uses of pellet mills (e.g., organic fertilizer business)
◼ Winning major offshore wind power generation projects/diversifying products
◼ Enhancing value chains in the ocean resource development and offshore wind power generation
businesses (M&A is also included in the available options)
Results forecasts
Results and outlook of
sales (existing and new) and operating profit
[Period: FYE September 2025 to FYE September 2028]
(Million yen)
Net sales
50,000
Existing business
New business
既存事業
新規事業
Operating profit 6,000
4,000
25,000
◼ Acceleration of large-scale investments associated with the integration and reorganization of
feed mills --> Tapping into demand for the equipment replacement
◼ Stabilization of business revenue from renewable energy projects --> Market expansion
2,000
◼ Pellet mill
Existing ◼ Equipment related to geothermal development
Business
New
◼ Wood-biomass-related equipment
◼ Equipment related to ocean resource development and survey/offshore wind power
generation
◼ New materials and films
0
0
25/9期
26/9期
27/9期
28/9期
実績
予算
見通し
見通し
Copyright © 2023 SANYO TRADING CO., LTD. All Rights Reserved.
32
[Growth Strategy in Each Segment] Life Science
◼ Discover and develop QOL and environmental products for growth markets
Our strengths
• With a global business foundation, all of our bases
cooperated in the operation of our businesses
• We deal in materials and equipment that support
advanced technologies
• The expertise and technological capabilities we use in
the handling of high value-added products
• Ability to ensure supply stability by leveraging our
financial foundation
• Immunity bioinformatics and information and structural
analysis
Business environment
×
• A sustainable society through the co-creation of technology,
health, and the environment
• Strengthened support for research and development
(securing of budgets, subsidies, etc.)
• Changes in measurement needs (e.g., revision of
the Japanese Automobile Standards and shift to EVs)
• Creating new markets through shift to EVs (such as
batteries)
Basic
strategies
◼ Deepening relationships with domestic and overseas suppliers
◼ Domestic and overseas bases cooperating to drive global expansion
◼ Digital marketing and sales activities based on the proposal of applications to expand sales and
improve efficiency
◼ Development of businesses through the promotion of industry-academia cooperation
◼ Expanding the product models handled and our sales channels (M&A and partial investments)
Factors that
are keys to the
achievement of
the plan
◼ Domestic and overseas suppliers restructuring their production and supply --> Market changes
◼ Progress in the shift to EVs --> Creation of new markets
◼ Development of the domestic bio-industry --> Market expansion
◼ U.S. trade and tariff policy trends --> Impact on profit
Existing
Business
Results forecasts
Results and outlook of
sales (existing and new) and operating profit
[Period: FYE September 2025 to FYE September 2028]
(Million yen)
Net sales
60,000
Existing business
New business
既存事業
新規事業
Operating profit
40,000
4,000
20,000
2,000
◼ Electrical materials, films, SAP, surfactants, and materials in the field of heat
dissipation
◼ Scientific instruments Biotech products/reagents
0
0
New
6,000
◼ LiB-related parts and materials
◼ New functional feeds
◼ Food additives
25/9期
26/9期
27/9期
28/9期
実績
予算
見通し
見通し
Copyright © 2023 SANYO TRADING CO., LTD. All Rights Reserved.
33
Life Science
Strengthening Feed Additive-related Business
— Strengthening the Business in Kyushu Area through M&A of Kyushu Mitaka —
◼ To increase our market share in the three prefectures in South Kyushu (Kumamoto, Kagoshima, and Miyazaki)
as livestock prefectures, we have acquired shares in Kyushu Mitaka Corporation, which has its own sales
channels in Kumamoto Prefecture, among others.
◼ Increasing sales in Kumamoto by selling YPTECH products to Kyushu Mitaka's sales channels (dairy farmers'
association and cooperative, and agricultural corporations)
Company Profile
Projection of sales growth in the future
⚫ Company name: Kyushu Mitaka Corporation
⚫ Business:
• Wholesale distribution of feeds and feed additives
• Wholesale distribution of livestock farming equipment
• Wholesale distribution of livestock medicines
⚫ Established:
May 1983 (41 years)
⚫ Date of share
transfer:
October 31, 2025
YPTECH
Net sales
Product models handled
◆ Feed additives
◆ Livestock medicines
Growth through
M&A activities
◆ Livestock farming
equipment
Kyushu area
(Approx. 15%)
• Complete premix
• Amino acid formulations
• Fat formulations
• Other functional additives
• Large fans for livestock farming
• Mist cooling systems for livestock
farming
• Other materials for livestock farming
Current Situation
2.0
billion yen
Independent
growth
Vision
Copyright © 2023 SANYO TRADING CO., LTD. All Rights Reserved.
34
Consolidated Balance Sheet
(Million yen)
25/9 4Q
26/9 2Q
26/9 2Q
(As of September
30, 2025)
Cash and deposits
11,896
13,179
12,544
14,280
Notes and accounts
receivable - trade, etc.
Notes and accounts payable trade
26,409
26,964
Short-term borrowings
2,960
1,760
Inventories
26,387
27,979
Other current liabilities
12,600
13,742
Other current assets
5,221
6,440
Long-term borrowings
100
100
Property, plant and equipment
3,464
3,333
Other non-current liabilities
1,968
1,862
Other non-current assets
8,116
7,759
Net assets
51,321
54,420
81,496
86,165
Total liabilities and net assets
81,496
86,165
Total assets
(As of March 31,
2026)
Liabilities
25/9 4Q
Assets
[Key Points]
• Drove posting of profits and repayment of borrowings through
the sale of cross-shareholdings
(As of September
30, 2025)
(As of March 31,
2026)
25/9 4Q
26/9 2Q
(As of September 30,
2025)
(As of March 31,
2026)
Ratio of interest-bearing debt
6.0%
3.4%
Shareholders’ equity ratio
62.9%
63.1%
Calculation method) Interest-bearing debt ratio: Interest-bearing debt (*1: Excluding lease liabilities)/ Equity (*2)
Equity ratio: Equity/Total assets at the end of the fiscal year
(*1) Interest-bearing debt = Short-term borrowings + Long-term borrowings
(*2) Equity = Net assets - Share acquisition rights - Non-controlling interests
Copyright © 2023 SANYO TRADING CO., LTD. All Rights Reserved.
35
Consolidated Cash Flows
Cash flows from operating activities: Profitability maintained by effective inventory management and other activities
Cash flows from investing activities: Net cash used in M&A and business investments
Cash flows from financing activities: Dividends paid and repayments of short-term borrowings
(Million yen)
5,000
4,328
4,044
4,000
3,575
3,000
2,000
1,218
1,000
1,155
521
369
0
(1,000)
(2,000)
(1,219)
(1,569)
(542)
(887)
(1,073)
(1,166)
(2,236)
(3,000)
(2,066)
(4,000)
2022.3
2023.3
2024.3
Operating cash flow
営業CF
2022.3
2023.3
2025.3
Investing
投資CF cash flow
2024.3
2026.3
Financing
財務CF cash flow
2025.3
2026.3
Operating CF + Investing CF
(2,419)
573
2,082
3,246
966
Cash and cash equivalents
6,605
6,218
8,895
10,664
13,083
Copyright © 2023 SANYO TRADING CO., LTD. All Rights Reserved.
36
Notice
Official Sanyo Trading
Instagram account
Official Sanyo Trading
X account
Scan the QR code and follow us.
Scan the QR code and follow us.
We have created
official social
media accounts.
Sponsored reports are
available at the IR pages
of our website.
https://www.sanyo-trading.co.jp/ir/
Copyright © 2023 SANYO TRADING CO., LTD. All Rights Reserved.
37
Inquiries about IR
Yoshimi Namba, Executive Officer, General Manager of Corporate Planning Department, Sanyo Trading Co., Ltd.
Tel.: +81-3-3518-1052 Email: [email protected]
Caution Concerning Forward-Looking Statements
The sole purpose of this material is providing information to investors. It is not intended for the solicitation of
trade.
Forward-looking statements included in the material are based on targets and forecasts and do not ensure any
commitments or provide any guarantee. Note that actual results at the Company may differ from the forwardlooking statements made as of the date of their publication.
Statements about the industry, among others, are made based on data that are considered reliable. We do not
guarantee the accuracy or integrity.
This material is presented on the assumption that investors will use it at their own discretion and under their
own responsibility, whatever their purposes may be. The Company does not assume any responsibility for its
use by investors under any circumstances.
Copyright © 2023 SANYO TRADING CO., LTD. All Rights Reserved.
38






 三洋貿易公式X
 三洋貿易公式Instagram
 三洋貿易公式YouTubeチャンネル