自己株券買付状況報告書(法24条の6第1項に基づくもの)
Bull 2
Bear 0
Capital return
Fiscal year ends March
Quarters are offset from the calendar — Q1 is Apr–Jun
|
TOKAI Holdings Corporation is a diversified Japanese conglomerate operating across six main business segments: Energy, Information & Communication, CATV, Construction & Real Estate, Aqua, and Other Services. The Energy segment is the core business, comprising LP gas, city gas, high-pressure gas, security, and hydroelectric power generation. Key subsidiaries in this segment include The Tokai, Tokai Gas, and Nikaho Gas, which supply LP gas, LNG, and natural gas in Japan and Southeast Asia. The Information & Communication segment provides broadband ISP services under the TNC and @T COM brands, MVNO mobile services via LIBMO, and enterprise IT solutions through subsidiaries like Tokai Communications and Size. The CATV segment operates cable television networks through subsidiaries such as Tokai Cable Network and Ichihara Cable TV. The Construction & Real Estate segment involves building construction, equipment installation, and real estate management, led by The Tokai and Nisshin Kogyo. The Aqua segment focuses on the manufacturing and sale of natural water beverages. The Other Services segment includes wedding venue operations at Grandiere Bouquetokai, ship repair, insurance agency, and elderly care services provided by Tokai Life Plus and Tender. Summarised from the annual report, fiscal year ended Mar 2026 |
Industry Conglomerates | Homepage tokaiholdings.co.jp |
| Sector Industrials | IR page tokaiholdings.co.jp | |
|
Tags
lp gas, city gas, broadband isp, mvno, cable television, construction, real estate, ship repair, elderly care, insurance agency, hydroelectric power, The Tokai, Tokai Gas, Nikaho Gas, Fujipro, Isesaki Gas, Tokai Shipbuilding & Transport, Energy Line, Gat, TOKAI Myanmar Co. Ltd., MIEN TRUNG GAS JOINT STOCK COMPANY, V-GAS PETROLEUM CORPORATION, T&T Energy, Shizuoka Liquid Oxygen, Chiba General Gas Center, REPOWER ENERGY DEVELOPMENT CORPORATION, TOKAI Communications, TNC, @T COM, LIBMO, Size, Amuz Unity, Query, J-Support, U-I-S, G&F, PT TOKAICOM Mitra Indonesia, Cloud Master, TOKAI Cable Network, Ichihara Cable TV, Atsugi Isehara Cable Network, LCB, Kurashiki Cable TV, Tokochannel Shizuoka, Tokyo Bay Network, TV Tsuyama, Sendai CATV, Okinawa Cable Network, Net Technology Shizuoka, Nisshin Kogyo, Chuo Denki Koji, Inoue Technica, Marco Polo Kago, Wood Recycling, Tokai City Service, Grandiere Bouquetokai, Waei, TOKAI Life Plus, Tender, TOKAI Kids Touch, TOKAI Management Services
|
Press page tokaiholdings.co.jp/english/ir/news |
Metrics
| Valuation | |
|---|---|
| Market cap | ¥ 183.197B |
| Market cap (USD) | $ 1.145B |
| P/E | 14.59 |
| PEG | 0.79 |
| P/BV | 1.72 |
| P/S | 0.73 |
| P/OCF | 6.60 |
| P/FCF | 13.89 |
| Dividend yield | 2.7% |
| Turnover / mcap | — |
| Returns | |
|---|---|
| ROE | 10.7% |
| ROI | 7.1% |
| ROIC | 8.2% |
| Profit margin | 4.4% |
| Growth | |
|---|---|
| Revenue growing | Yes |
| Profits growing | Yes |
| Revenue up 3y | Yes |
| Revenue up 5y | Yes |
| Earnings growth 3y (net profit CAGR) | 18.5% |
| Quality | |
|---|---|
| Profitable | Yes |
| Margin expanding | Yes |
| Buying back stock | No |
| Diluting (TTM) | No |
| Debt/Equity | — |
| Podcast bulls (TTM) | Sign up |
| Podcast bears (TTM) | Sign up |
| Podcast sentiment (TTM) | Sign up |
| Podcast sentiment % (TTM) | Sign up |
| News sentiment (TTM) | 52 |
| Quality score | 42.1% |
| Insiders | |
|---|---|
| Buys, 1w | Sign up |
| Buys, 1m | Sign up |
| Buys, 1y | Sign up |
| Sells, 1w | Sign up |
| Sells, 1m | Sign up |
| Sells, 1y | Sign up |
Sign up to see this company's insider trades
| Figure | FY 2026 | FY 2025 | FY 2024 | FY 2023 | FY 2022 | FY 2021 | FY 2020 | FY 2019 | FY 2018 | FY 2017 | FY 2016 | FY 2015 | FY 2014 | FY 2013 |
|---|---|---|---|---|---|---|---|---|---|---|---|---|---|---|
| Revenue | 244.838B | 243.482B | 231.513B | 230.19B | 210.691B | 196.726B | 195.952B | 191.6B | 186.069B | 178.631B | 180.94B | 187.511B | 188.987B | 181.684B |
| Net profit | 10.749B | 9.216B | 8.481B | 6.465B | 8.969B | 8.815B | 8.241B | 7.772B | 6.62B | 7.337B | 3.458B | 3.934B | 2.598B | 3.085B |
| Free cash flow | 10.163B | 12.093B | 13.695B | 7.23B | 7.463B | 19.298B | 10.943B | 9.182B | 9.244B | 15.361B | 9.96B | — | — | — |
| Figure | FY 2026 | FY 2025 | FY 2024 | FY 2023 | FY 2022 | FY 2021 | FY 2020 | FY 2019 | FY 2018 | FY 2017 | FY 2016 | FY 2015 | FY 2014 | FY 2013 |
|---|---|---|---|---|---|---|---|---|---|---|---|---|---|---|
| Share price | 1.163K | 982.09 | 988.13 | 874.27 | 862.74 | 955.84 | 937.77 | 919.61 | 1.078K | 856.73 | 585.42 | 521.63 | 350.98 | 325.24 |
| Price performance 12m | 0.18 | -0.01 | 0.13 | 0.01 | -0.1 | 0.02 | 0.02 | -0.15 | 0.26 | 0.46 | 0.12 | 0.49 | 0.08 | — |
Filed figures
Lines the statements and their notes report beside the headline figures, read from the filings' XBRL as filed (no restatement applied), with figures computed from one filing's own lines. Cash-flow lines carry their cash direction: an outflow is negative. Each period links to its filing; a figure's period, report date and tag are in its tooltip.
| Figure | Mar 2017 | Mar 2018 | Mar 2019 | Mar 2020 | Mar 2021 | Mar 2022 | Mar 2023 | Mar 2024 | Mar 2025 | Mar 2026 |
|---|---|---|---|---|---|---|---|---|---|---|
| Balance sheet detail | ||||||||||
| Trade receivables (JPY) | 22.8B | 23.8B | 24.8B | 25.9B | 26.3B | 56.2B | 59.1B | 59.3B | 65.4B | 64.5B |
| ↳ YoY growth | +7.2% | +4.2% | +4.2% | +4.3% | +1.8% | +113.5% | +5.2% | +0.3% | +10.4% | -1.4% |
| ↳ 5y CAGR | +4.3% | +19.7% | +19.9% | +19.0% | +20.4% | +19.6% | ||||
| Borrowings, current (JPY) | 23.5B | 23.9B | 22.4B | 20B | 12.2B | 14.4B | 15.8B | 14.2B | 14B | 17.2B |
| Borrowings, non-current (JPY) | 30.6B | 27.1B | 28.2B | 28.2B | 30B | 29.7B | 30.9B | 32.1B | 32.1B | 30.6B |
| Bonds payable (JPY) | 3.78B | 596M | 398M | 230M | 112M | — | — | — | — | — |
| Lease liabilities (JPY) | 12.3B | 13.2B | 13.5B | 14.6B | 15.3B | 17.1B | 18.3B | 19.2B | 19B | 19B |
| Cash and deposits (JPY) | 3.24B | 3.14B | 4.16B | 4.63B | 5.58B | 4.74B | 4.36B | 5.76B | 5.64B | 5.41B |
| Intangible assets (JPY) | 11B | 11.2B | 11.1B | 10.8B | 10.7B | 11B | 10.5B | 10.1B | 13B | 13.2B |
| Net debt (borrowings + leases - cash) (JPY) | 63.2B | 61B | 59.9B | 58.2B | 51.8B | 56.5B | 60.6B | 59.8B | 59.5B | 61.4B |
| Cash flow detail | ||||||||||
| Operating cash flow (JPY) | 26.7B | 20.9B | 21.6B | 22.5B | 32.2B | 20.8B | 21.2B | 30.1B | 25.8B | 27.2B |
| Purchases of property, plant and equipment (JPY) | -11.3B | -11.7B | -12.4B | -11.6B | -12.9B | -13.3B | -14B | -16.4B | -13.7B | -17.1B |
| Change in receivables (cash effect) (JPY) | -1.96B | -306M | -1.27B | -978M | 286M | -3.32B | -655M | -140M | -2.33B | 1.13B |
| Change in inventories (cash effect) (JPY) | 553M | -333M | -306M | 650M | 17M | 156M | -1.92B | 1.32B | -307M | -731M |
| Change in payables (cash effect) (JPY) | 1.46B | 757M | -673M | -459M | 2.1B | 1.34B | 1.05B | -54M | -2.18B | -2.52B |
| Dividends paid (cash effect) (JPY) | -2.16B | -3.99B | -3.67B | -3.68B | -3.68B | -4.07B | -4.33B | -4.2B | -4.46B | -4.45B |
| Share buybacks (cash effect) (JPY) | -262M | -1M | 0.00 | -1M | 0.00 | -119M | -278M | 0.00 | 0.00 | -2B |
| Interest paid (cash effect) (JPY) | -545M | -448M | -371M | -311M | -297M | -275M | -273M | -311M | -409M | -523M |
| Income taxes paid (cash effect) (JPY) | -3.26B | -5.35B | -3.24B | -5.35B | -4.74B | -5.9B | -6.57B | -3.94B | -4.97B | -5.48B |
| Operating cash flow before change in receivables (JPY) | 28.7B | 21.2B | 22.9B | 23.5B | 31.9B | 24.1B | 21.8B | 30.2B | 28.1B | 26.1B |
| Free cash flow (OCF - PPE - intangibles) (JPY) | 15.4B | 9.24B | 9.18B | 10.9B | 19.3B | 7.46B | 7.23B | 13.7B | 12.1B | 10.2B |
| Income detail | ||||||||||
| Total comprehensive income (JPY) | 8.68B | 6.37B | 6.13B | 5.83B | 13.7B | 7.13B | 7.73B | 13.2B | 8.95B | 15B |
| Comprehensive income to owners (JPY) | 8.6B | 6.27B | 5.98B | 5.63B | 13.6B | 6.97B | 7.54B | 13B | 8.84B | 14.8B |
| Provision for credit losses (JPY) | 228M | 305M | 237M | 171M | 79M | 116M | 156M | 212M | 294M | 293M |
| Credit cost ratio (credit losses / average receivables) (%) | 1.0% | 1.3% | 1.0% | 0.7% | 0.3% | 0.3% | 0.3% | 0.4% | 0.5% | 0.5% |
| Reported | Jun 28, 2017 | Jun 27, 2018 | Jun 26, 2019 | Jun 25, 2020 | Jun 25, 2021 | Jun 28, 2022 | Jun 28, 2023 | Jun 26, 2024 | Jun 23, 2025 | Jun 22, 2026 |
Sign up to see institutional holdings
Sign UpPodcast Mentions
Sign up to see podcast mentions and sentiment
Sign UpTimely disclosures published on TDnet, newest first, titles as filed in Japanese. The link opens the disclosure on TDnet. Filings with EDINET (periodic reports, extraordinary reports, offerings, holding and buy-back reports), newest first, titles as filed in Japanese. The link opens the filing on EDINET. Press releases from the company's own website, newest first.
経営 グループ会社の役員人事のお知らせ
Bull 0
Bear 0
Routine
2026 年 11 月 5 日 各位 株式会社TOKAIホールディングス
グループ会社の役員人事のお知らせ 当社は、本日開催の取締役会においてグループ会社の役員人事について下記の通り決定いたしましたので お知らせいたします。 記 1. 株式会社TOKAIコミュニケーションズ (1)役員の分掌変更 (新)
(現)
近藤雄二
管理本部長、人事部、総務部、管理本部長、人事部、総務部、
(代表取締役専務)
経営管理部、経理部、コンプライアン
経営管理部、経理部、コンプライアン
ス・リスク管理部担当
ス・リスク管理部担当、人事部長
飯塚武久
システム開発本部長、事業推進部、 システム開発本部長、事業推進部、
(取締役)
開発室、プロジェクト管理部、IT プ
開発室、プロジェクト管理部、IT プ
ロフェッショナル推進室、事業統括部担
ロフェッショナル推進室、事業統括部担
当、事業統括部長
当
(2026 年 12 月 1 日実施予定) 2. 東海ガス株式会社 (1)役員の分掌変更 (新)
(現)
佐藤淳史
ライフソリューション本部長、営業企画部
ライフソリューション本部長、営業企画部
(常務取締役)
担当
担当、営業企画部長
(2026 年 11 月 5 日実施)
3. 厚木伊勢原ケーブルネットワーク株式会社 (1)取締役新任 (2)取締役退任
森
直紀
本間竜平
取締役 (専務取締役)
(3)役付取締役の選定 常務取締役
森
直紀
(4)役員の分掌変更 (新) 森
直紀
営業部、カスタマーセンター担当
(現) (新任)
(常務取締役) (以上、2026 年 12 月 1 日実施予定) 4. 株式会社トコちゃんねる静岡 (1)取締役新任 本間竜平
取締役
森
(常務取締役)
(2)取締役退任 直紀
(3)役付取締役の選定 専務取締役
本間竜平
(4)役員の分掌変更 (新) 本間竜平
営業一部、営業二部担当
(専務取締役) (以上、2026 年 12 月 1 日実施予定)
(現) (新任)
5. 沖縄ケーブルネットワーク株式会社 (1)役員の分掌変更 (新)
(現)
大石祥広
顧客管理部、総務部担当、顧客
顧客管理部、総務部担当、顧客
(常務取締役)
管理部長、総務部長
管理部長
(2026 年 11 月 16 日実施予定) 6. シティ・ガス株式会社 (1)代表取締役の選定 林
直孝
(2)監査役新任 花村雅之
監査役 (以上、2026 年 11 月 4 日実施)
7. 株式会社カナジュウ・コーポレーション (1)代表取締役の選定 林
直孝
(2)監査役新任 花村雅之
監査役 (以上、2026 年 11 月 4 日実施)
8. カナジュウサービス株式会社 (1)代表取締役の選定 林
直孝
(2)監査役新任 花村雅之
監査役 (以上、2026 年 11 月 4 日実施)
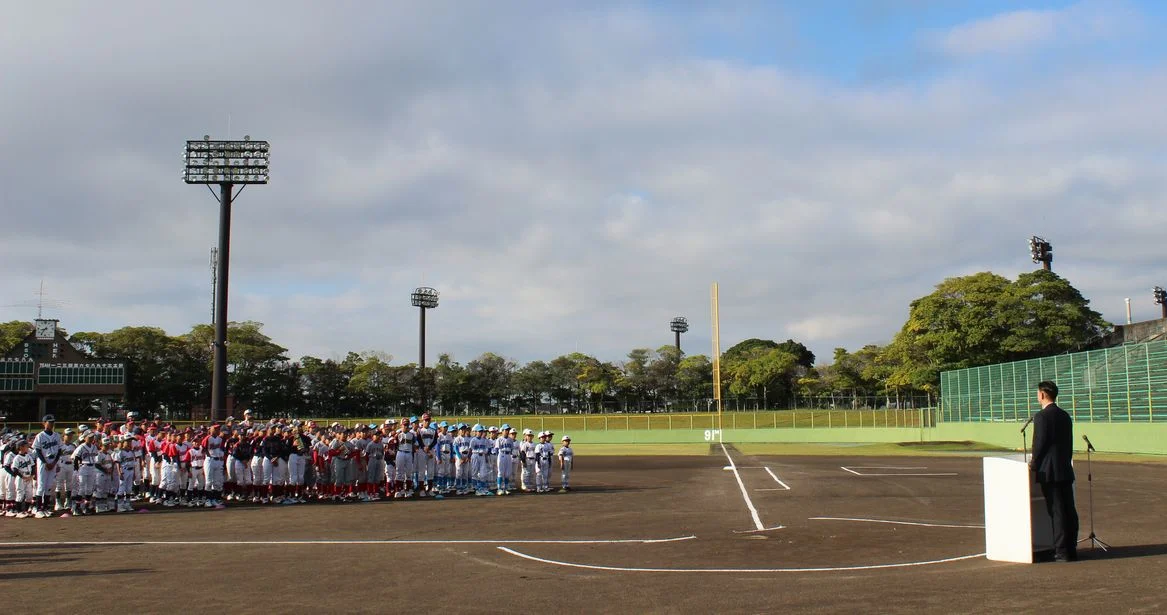 開会式の様子
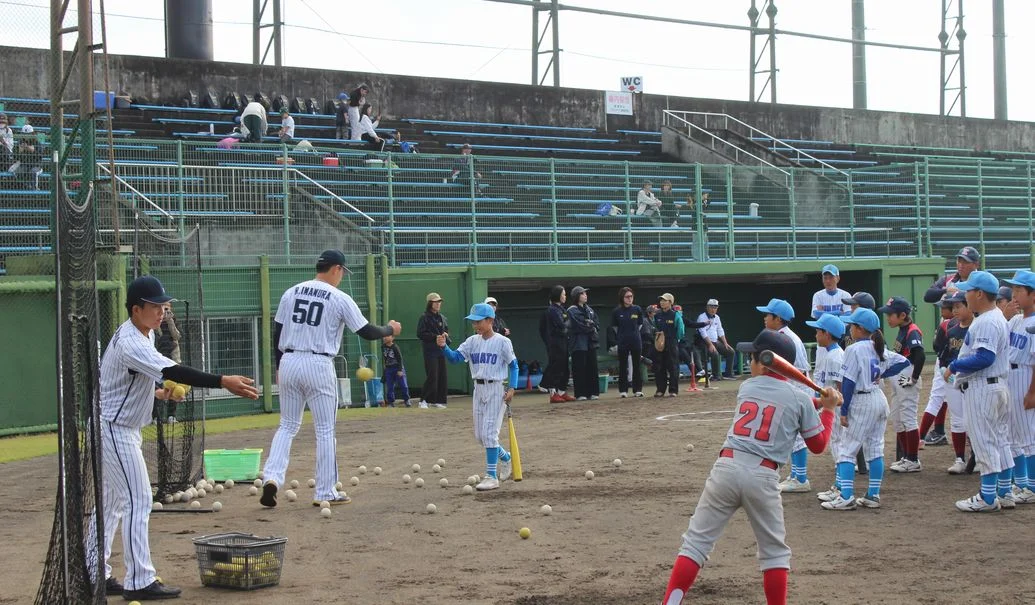 野球教室
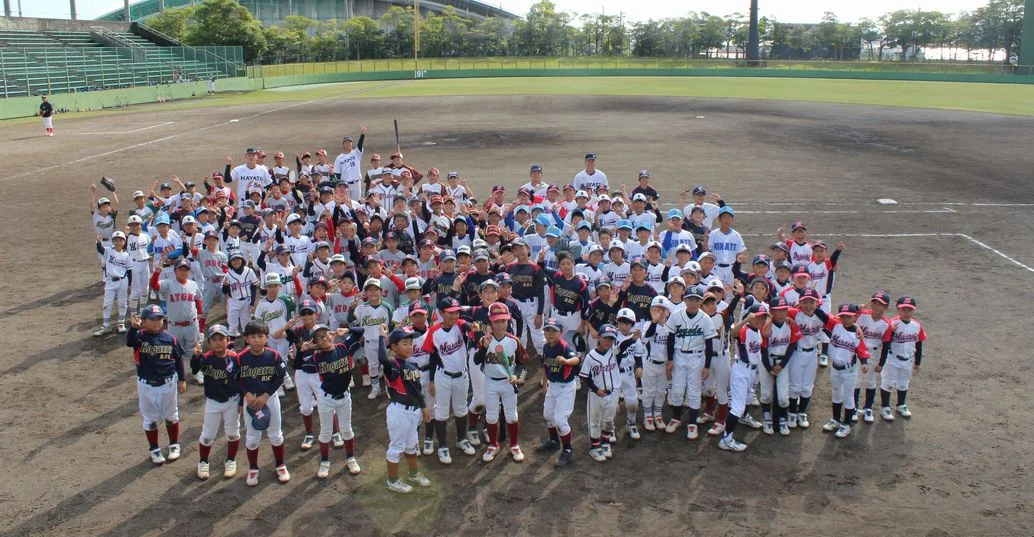 集合写真
Prompts
Click prompts to add them under the company line, click again to take one out, then copy the result into your AI chat. Shared by Asian Century Stocks and Uncovered Thai Stocks. Thank you.
TOKAI Holdings Corporation (ticker 3167), listed in Japan.
Copied
ETFs Holding TOKAI Holdings Corporation
Exchange-traded funds whose newest published daily portfolio holds one of the company's listings, largest weight first.
| ETF | Weight in ETF | Shares | Market value | As of |
|---|---|---|---|---|
| AVDV | 0.11% | 2,656,100 | $ 22.023M | Nov 16, 2026 |
| AVDS | 0.04% | 17,000 | $ 140.954K | Nov 16, 2026 |
| DFIS | 0.02% | 144,900 | $ 1.18M | Nov 12, 2026 |
| DXIV | 0.02% | 6,000 | $ 48.856K | Nov 12, 2026 |
| AVDE | 0.01% | 225,800 | $ 1.872M | Nov 16, 2026 |
| DFIC | 0.01% | 179,370 | $ 1.461M | Nov 12, 2026 |
| DFSI | 0.01% | 11,800 | $ 96.083K | Nov 12, 2026 |
| DFAX | 0.01% | 85,500 | $ 696.191K | Nov 12, 2026 |
| DFAI | 0.00% | 108,300 | $ 881.842K | Nov 12, 2026 |