指名・報酬諮問委員会の委員構成変更に関するお知らせ
Bull 0
Bear 0
Routine
Fiscal year ends November
Quarters are offset from the calendar — Q1 is Dec–Feb
|
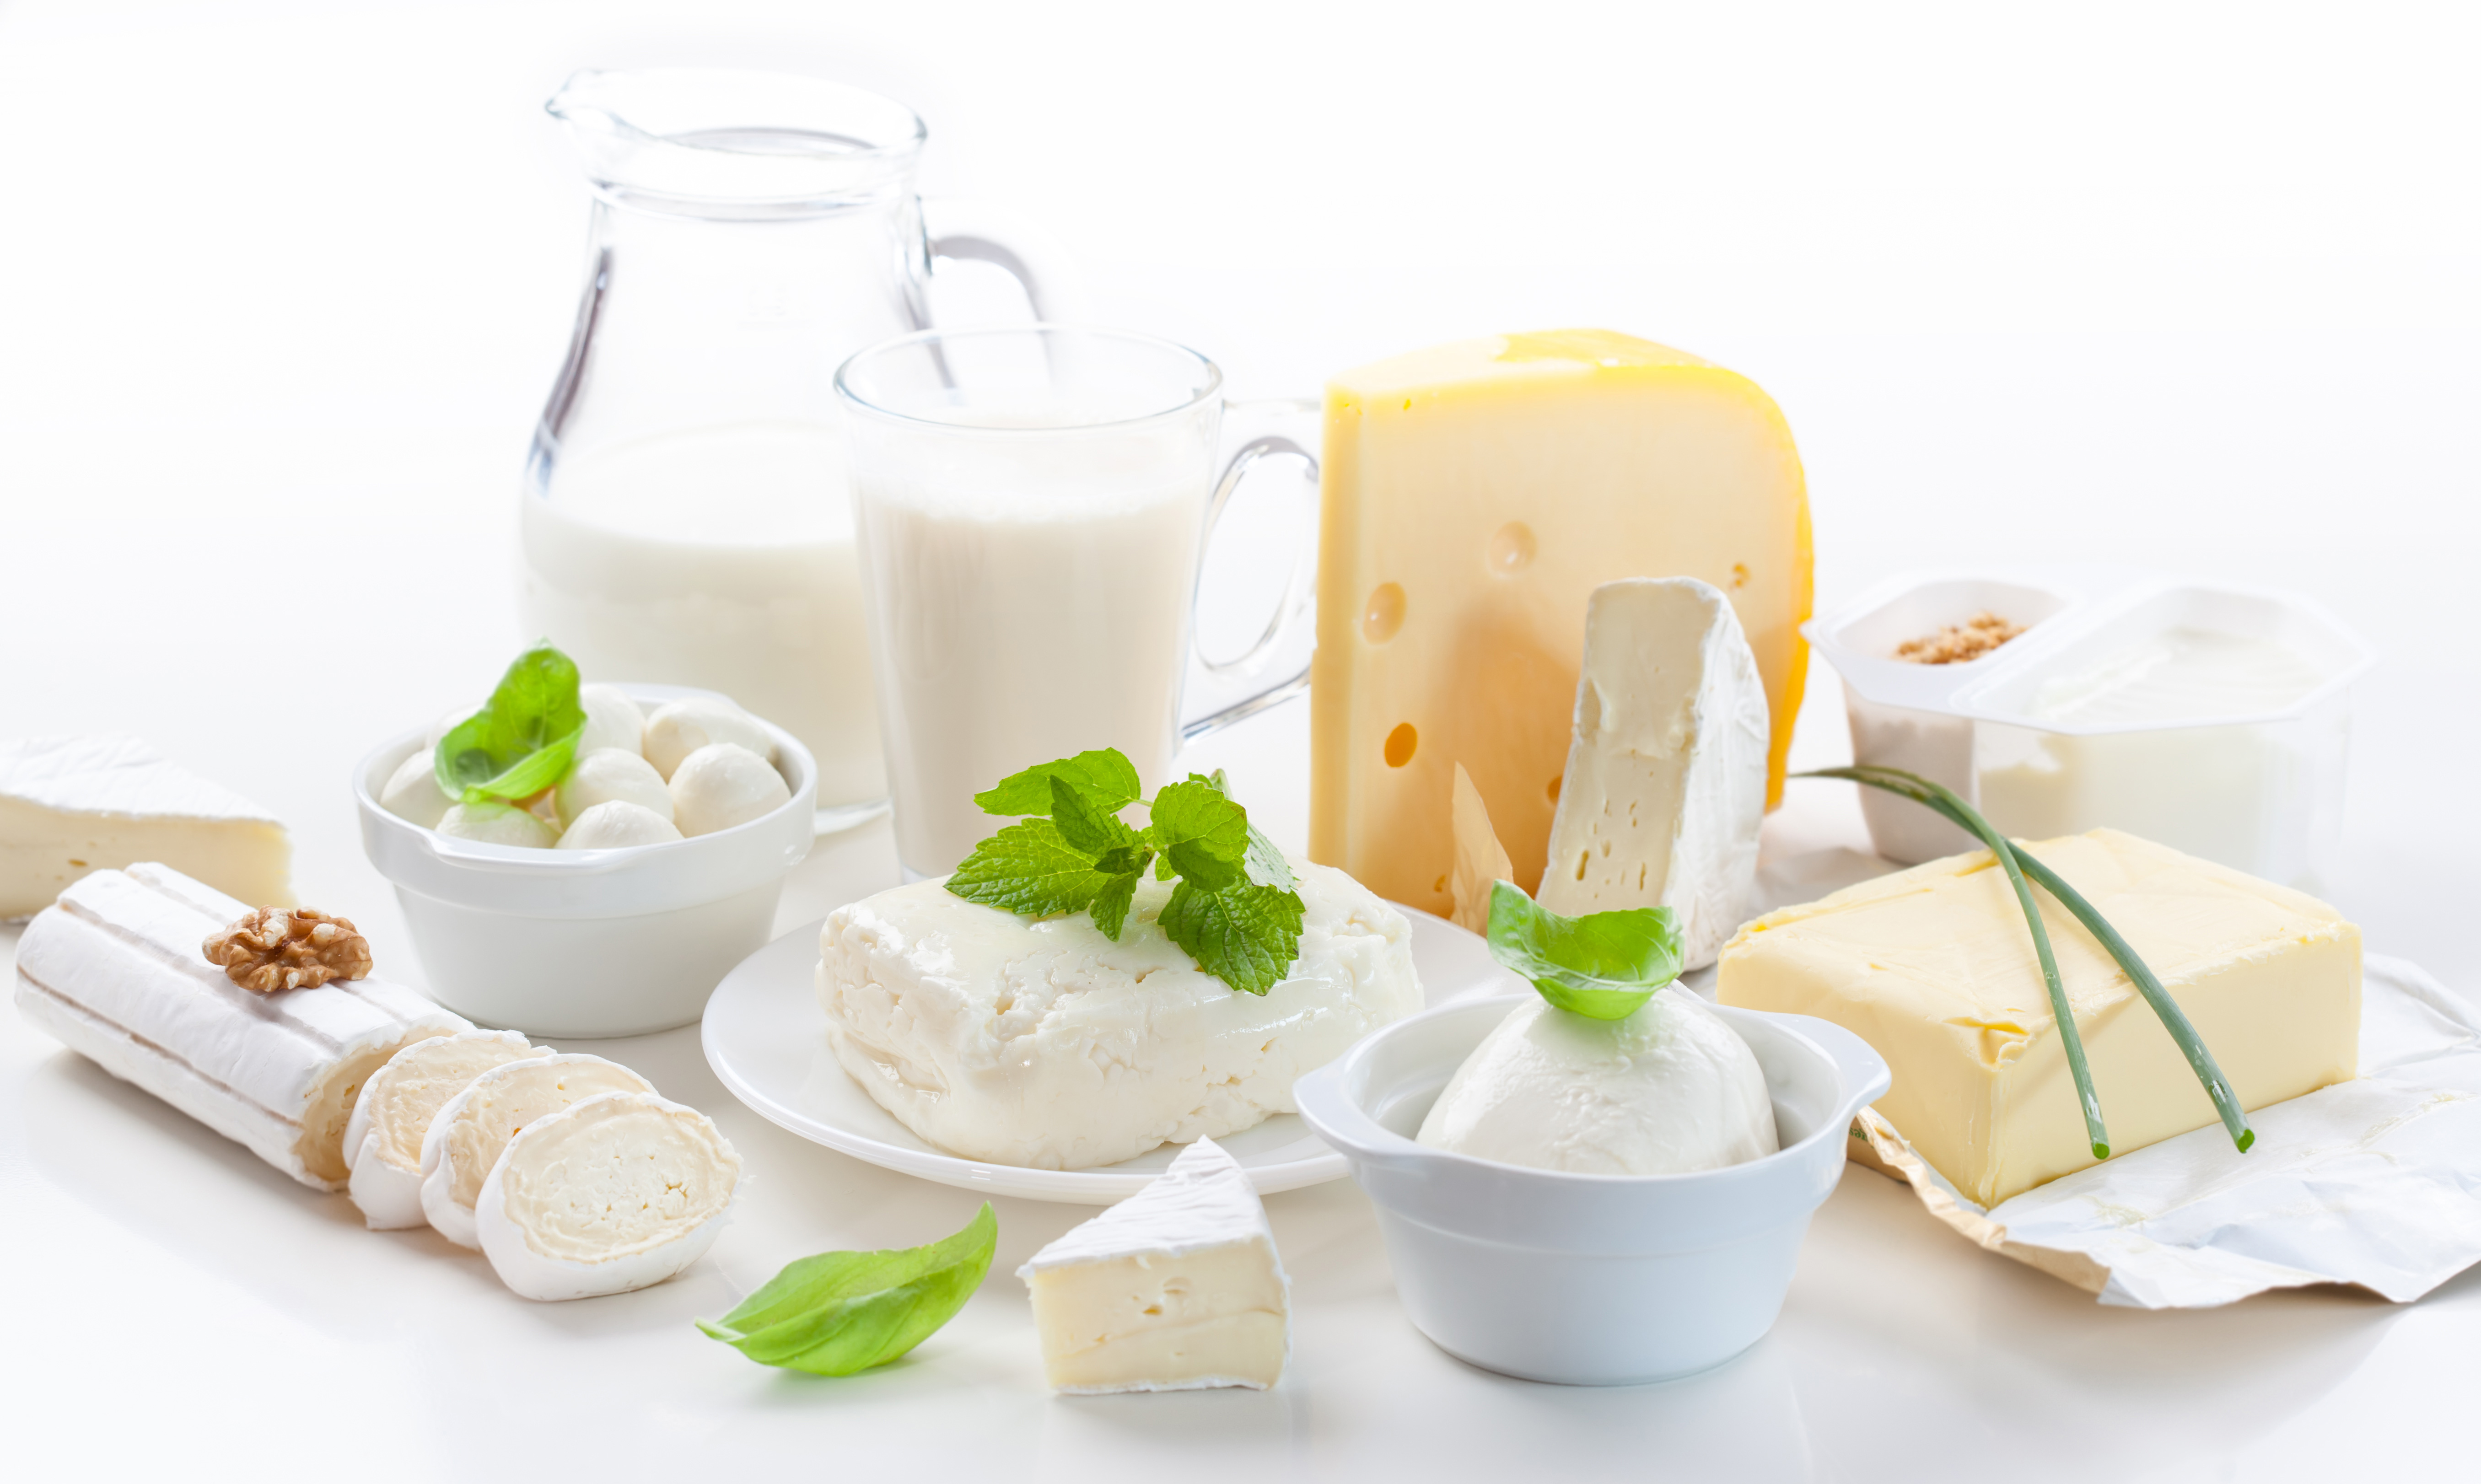
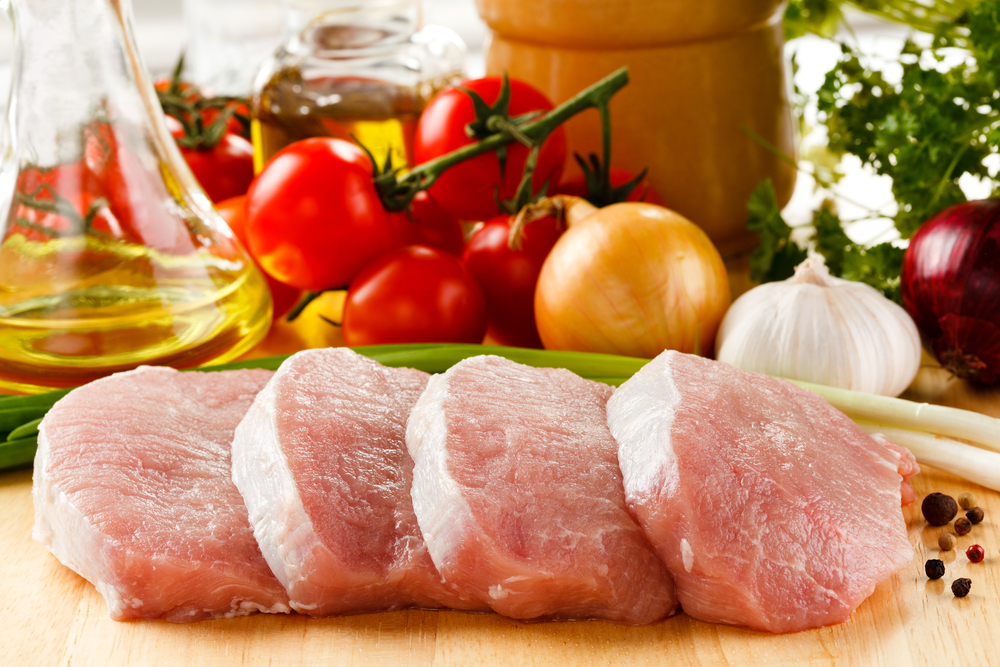
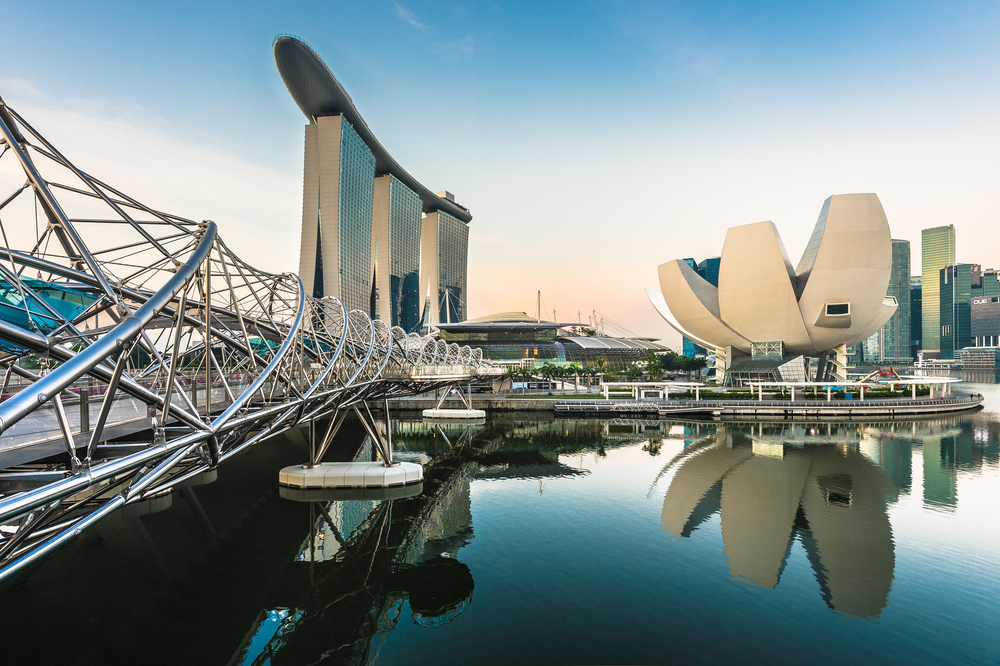
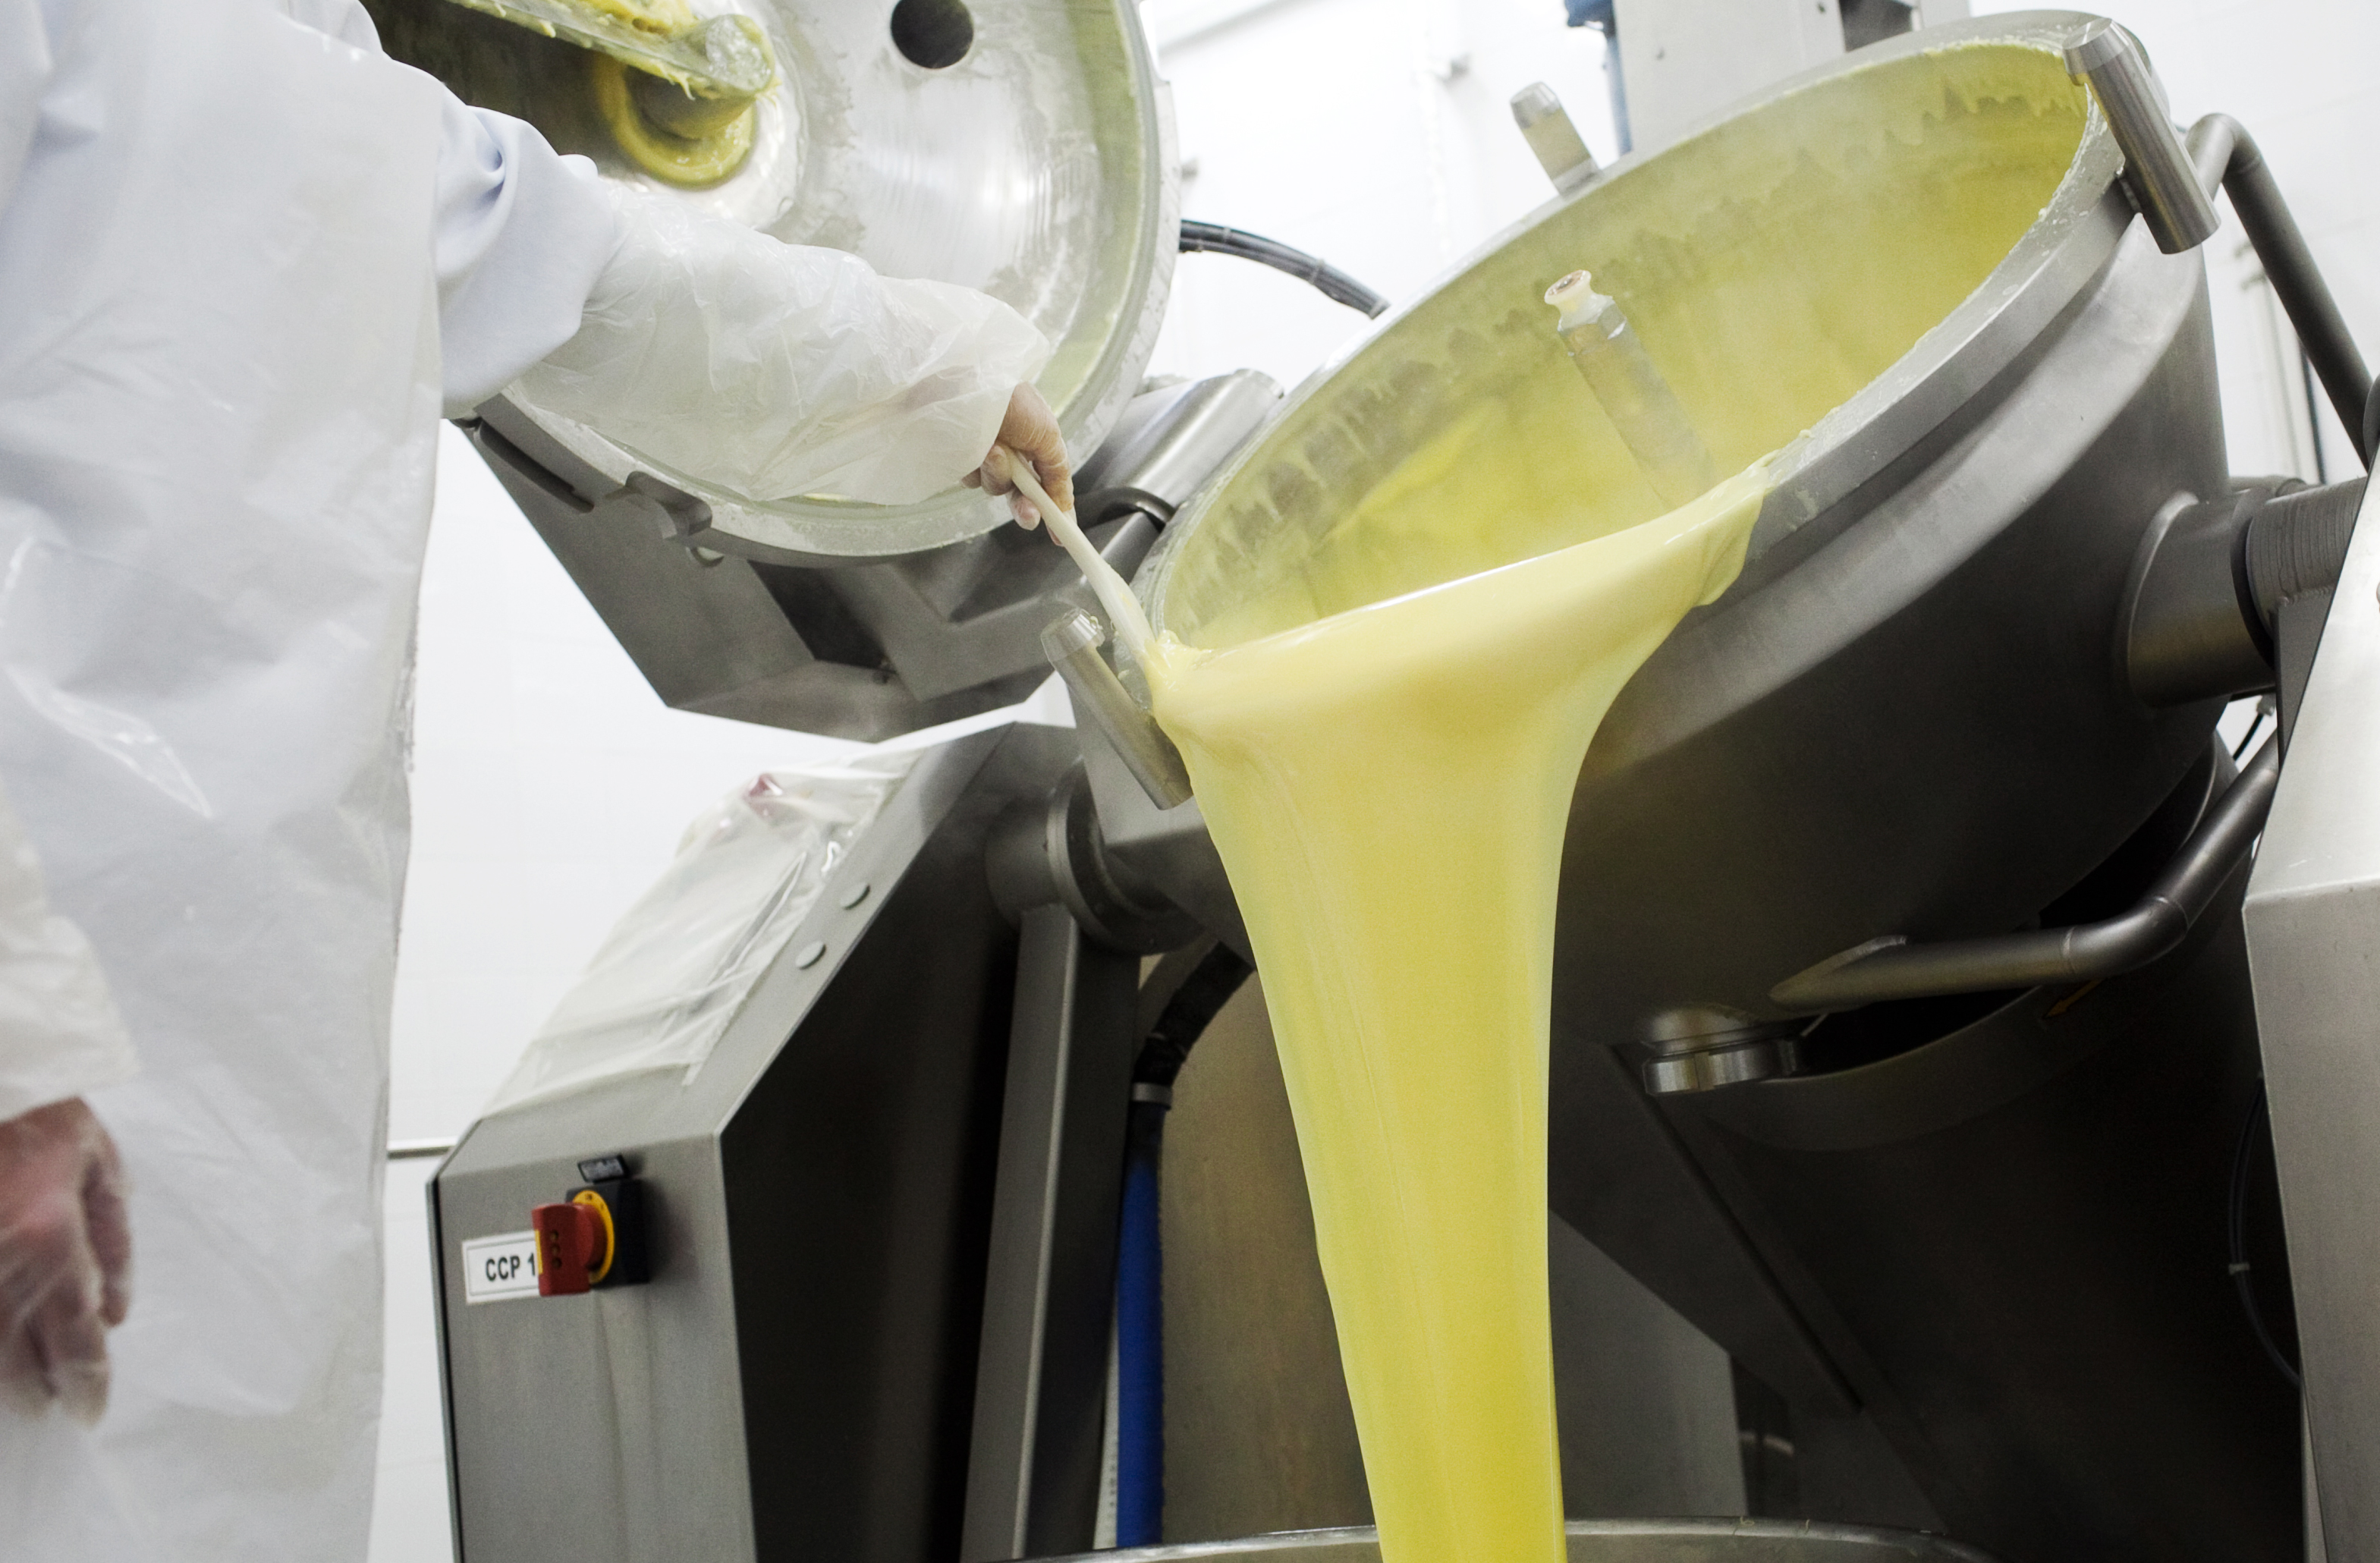
Lacto Japan Co., Ltd. is a food trading and manufacturing company that imports and distributes dairy ingredients, functional food ingredients, and meat products. The company operates through several business divisions: the Dairy Ingredients & Cheese division, which supplies raw dairy materials and natural cheese to food manufacturers; the Meat Ingredients division, which imports chilled and frozen pork, chicken, and processed meats; and the Functional Food Ingredients division, which sells high-protein dairy ingredients, soy protein, gelatin, and collagen to the sports nutrition, beauty, and healthcare sectors. In Asia, the group manufactures and sells process cheese and natural cheese products under the FOODTECH and CHOOSY brands, with production facilities in Singapore, Thailand, and Indonesia. The company serves customers in Japan, the United States, Australia, Europe, and various Asian markets, including Japan-based and local enterprises. Key subsidiaries include LACTO USA INC., LACTO OCEANIA PTY.LTD., LACTO ASIA PTE.LTD., LACTO ASIA (M) SDN.BHD., FOODTECH PRODUCTS (THAILAND) CO.,LTD., LACTO SHANGHAI CO.,LTD., LACTO EUROPE B.V., LACTO PHILIPPINES INC., PT. LACTO TRADING INDONESIA, and PT. PACIFIC LACTO JAYA. The company has been a partner to Seaboard Foods for pork imports since 2004. Summarised from the annual report, fiscal year ended Nov 2025 |
Industry Food Distribution | Homepage lactojapan.com |
| Sector Consumer Defensive | IR page lactojapan.com/ja/index.html | |
|
Tags
dairy ingredients, cheese manufacturing, meat import, functional food ingredients, protein ingredients, food trading, b2b supply, halal certified products, LACTO USA INC., LACTO OCEANIA PTY.LTD., LACTO ASIA PTE.LTD., LACTO ASIA (M) SDN.BHD., FOODTECH PRODUCTS (THAILAND) CO. LTD., LACTO SHANGHAI CO. LTD., LACTO EUROPE B.V., LACTO PHILIPPINES INC., PT. LACTO TRADING INDONESIA, PT. PACIFIC LACTO JAYA, FOODTECH, CHOOSY, Seaboard Foods
|
Press page lactojapan.com/ja/ir/news |
Metrics
| Valuation | |
|---|---|
| Market cap | ¥ 34.321B |
| Market cap (USD) | $ 214.511M |
| P/E | 9.66 |
| PEG | 0.41 |
| P/BV | 1.02 |
| P/S | 0.18 |
| P/OCF | -128.07 |
| P/FCF | -19.14 |
| Dividend yield | 3.9% |
| Turnover / mcap | — |
| Returns | |
|---|---|
| ROE | 14.4% |
| ROI | 6.9% |
| ROIC | 7.1% |
| Profit margin | 2.4% |
| Growth | |
|---|---|
| Revenue growing | Yes |
| Profits growing | Yes |
| Revenue up 3y | Yes |
| Revenue up 5y | Yes |
| Earnings growth 3y (net profit CAGR) | 23.6% |
| Quality | |
|---|---|
| Profitable | Yes |
| Margin expanding | Yes |
| Buying back stock | No |
| Diluting (TTM) | No |
| Debt/Equity | — |
| Podcast bulls (TTM) | Sign up |
| Podcast bears (TTM) | Sign up |
| Podcast sentiment (TTM) | Sign up |
| Podcast sentiment % (TTM) | Sign up |
| News sentiment (TTM) | 0 |
| Quality score | 33.3% |
| Insiders | |
|---|---|
| Buys, 1w | Sign up |
| Buys, 1m | Sign up |
| Buys, 1y | Sign up |
| Sells, 1w | Sign up |
| Sells, 1m | Sign up |
| Sells, 1y | Sign up |
Sign up to see this company's insider trades
| Figure | FY 2025 | FY 2024 | FY 2023 | FY 2022 | FY 2021 | FY 2020 | FY 2019 | FY 2018 | FY 2017 | FY 2016 | FY 2015 | FY 2014 | FY 2013 | FY 2012 |
|---|---|---|---|---|---|---|---|---|---|---|---|---|---|---|
| Revenue | 182.816B | 170.907B | 158.328B | 147.423B | 110.884B | 110.838B | 116.794B | 115.441B | 101.335B | 88.679B | 98.001B | 96.55B | 75.943B | 55.201B |
| Net profit | 4.317B | 3.146B | 2.049B | 2.287B | 1.959B | 2.062B | 1.963B | 1.784B | 1.755B | 946.443M | 831.404M | 988.238M | 1.007B | 422.237M |
| Free cash flow | -1.793B | -185M | 2.063B | -10.569B | -4.224B | 4.379B | 3.297B | 60.169M | -5.112B | 3.407B | 2.232B | — | — | — |
Filed figures
Lines the statements and their notes report beside the headline figures, read from the filings' XBRL as filed (no restatement applied), with figures computed from one filing's own lines. Cash-flow lines carry their cash direction: an outflow is negative. Each period links to its filing; a figure's period, report date and tag are in its tooltip.
| Figure | Nov 2016 | Nov 2017 | Nov 2018 | Nov 2019 | Nov 2020 | Nov 2021 | Nov 2022 | Nov 2023 | Nov 2024 | Nov 2025 |
|---|---|---|---|---|---|---|---|---|---|---|
| Balance sheet detail | ||||||||||
| Trade receivables (JPY) | 14.3B | 17.2B | 15.9B | 17.9B | 13.8B | 19.3B | 42.1B | 37.4B | 48.1B | 47.9B |
| ↳ YoY growth | +12.5% | +20.5% | -7.7% | +12.5% | -22.4% | +39.2% | +118.6% | -11.2% | +28.5% | -0.3% |
| ↳ 5y CAGR | +1.8% | +6.2% | +19.6% | +18.7% | +21.9% | +28.2% | ||||
| Borrowings, current (JPY) | 4.3B | 8.38B | 11.7B | 13.2B | 8.99B | 14.3B | 21.9B | 21.8B | 24.6B | 28.9B |
| Borrowings, non-current (JPY) | 12.8B | 11.3B | 9.21B | 4.32B | 5.06B | 5.01B | 8.96B | 9.13B | 8.29B | 7.66B |
| Bonds payable (JPY) | 2.21B | 2.07B | 1.38B | 720M | 270M | — | — | — | — | — |
| Cash and deposits (JPY) | 6.72B | 4.01B | 4.93B | 4.47B | 5B | 5.51B | 6.38B | 7.78B | 9.08B | 10.2B |
| Intangible assets (JPY) | 55.6M | 20.7M | 39.5M | 29.5M | 20.4M | 44.6M | 39.1M | 73.7M | 321M | 754M |
| Net debt (borrowings + leases - cash) (JPY) | 10.4B | 15.7B | 16B | 13B | 9.05B | 13.8B | 24.5B | 23.1B | 23.8B | 26.4B |
| Cash flow detail | ||||||||||
| Operating cash flow (JPY) | 3.56B | -5.05B | 356M | 3.37B | 4.53B | -4.04B | -10.4B | 3.22B | 636M | -268M |
| Purchases of property, plant and equipment (JPY) | -149M | -63.2M | -268M | -67.1M | -154M | -162M | -151M | -1.11B | -557M | -1.07B |
| Purchases of intangible assets (JPY) | -3.67M | -8.86M | -28.1M | -1.84M | -794,000 | -25.3M | -9.72M | -47.4M | -264M | -457M |
| Change in receivables (cash effect) (JPY) | -1.73B | -2.9B | 1.34B | -2.02B | 3.86B | -5.16B | -965M | 2.63B | -5.2B | 394M |
| Change in inventories (cash effect) (JPY) | 5.38B | -8.33B | -3.77B | 2.26B | 1.53B | -3.39B | -16.2B | 1.73B | -2.24B | -3.84B |
| Change in payables (cash effect) (JPY) | -1.63B | 4.51B | -241M | 1.51B | -2.82B | 2.27B | 4.58B | -3.47B | 3.11B | -245M |
| Dividends paid (cash effect) (JPY) | -147M | -156M | -186M | -196M | -216M | -296M | -315M | -633M | -546M | -985M |
| Share buybacks (cash effect) (JPY) | — | -107,000 | — | -82.8M | -148,000 | -145M | — | -92,000 | -166M | 0.00 |
| Interest paid (cash effect) (JPY) | -276M | -257M | -260M | -242M | -204M | -142M | -182M | -240M | -313M | -488M |
| Income taxes paid (cash effect) (JPY) | -378M | -491M | -1.04B | -721M | -683M | -868M | -675M | -1.25B | -559M | -1.7B |
| Operating cash flow before change in receivables (JPY) | 5.29B | -2.15B | -986M | 5.39B | 673M | 1.12B | -9.44B | 589M | 5.83B | -662M |
| Free cash flow (OCF - PPE - intangibles) (JPY) | 3.41B | -5.12B | 60.2M | 3.3B | 4.38B | -4.22B | -10.6B | 2.06B | -185M | -1.79B |
| Income detail | ||||||||||
| Total comprehensive income (JPY) | 1.18B | 1.48B | 1.75B | 1.78B | 1.78B | 2.37B | 3.17B | 2.8B | 3.52B | 5.82B |
| Comprehensive income to owners (JPY) | 1.18B | 1.48B | 1.75B | 1.78B | 1.78B | 2.37B | 3.17B | 2.8B | 3.52B | 5.82B |
| Provision for credit losses (JPY) | — | 122M | -119M | 2.41M | 17.9M | 18.9M | 3.5M | -9.28M | 20M | 4M |
| Credit cost ratio (credit losses / average receivables) (%) | — | 0.8% | 0.7% | 0.0% | 0.1% | 0.1% | 0.0% | 0.0% | 0.0% | 0.0% |
| Reported | Feb 27, 2017 | Feb 28, 2018 | Feb 27, 2019 | Feb 27, 2020 | Feb 26, 2021 | Feb 28, 2022 | Feb 24, 2023 | Feb 28, 2024 | Feb 27, 2025 | Feb 24, 2026 |
Sign up to see institutional holdings
Sign UpPodcast Mentions
Sign up to see podcast mentions and sentiment
Sign UpTimely disclosures published on TDnet, newest first, titles as filed in Japanese. The link opens the disclosure on TDnet. Filings with EDINET (periodic reports, extraordinary reports, offerings, holding and buy-back reports), newest first, titles as filed in Japanese. The link opens the filing on EDINET. Press releases from the company's own website, newest first.
役員人事に関するお知らせ
Bull 0
Bear 0
Routine
-
CLOSE
-
MENU
-
個人投資家向け説明資料
個人投資家向け説明資料
JAEN
サブ-ナビゲーション
-
現在位置:個人投資家向け説明資料
個人投資家向け説明資料
JAEN
2026年11月期
SBI証券 オンライン会社説明会(2026年10月22日開催)
-
会社説明資料
 (4,581KB)
-
会社説明資料(説明文あり)
(5,745KB)
Custom Search
| | จัดเรียงตาม Relevance Date |
ラクト・ジャパンとは
事業内容
サステナビリティ
株主・投資家情報
企業情報
採用情報

Custom Search
| | จัดเรียงตาม Relevance Date |
BACK
BACK
BACK
BACK
BACK
BACK
BACK
BACK
BACK
BACK
BACK
BACK
BACK
BACK
BACK
Custom Search
| | จัดเรียงตาม Relevance Date |
-
IR
絞込み条件を クリア
-
すべて
-
決算短信
-
業績
-
適時開示
-
PR
-
IR
-
ガバナンス
-
株主総会
-
有価証券報告書
-
その他
-
General Meeting of Shareholders
-
ニュース
絞込み条件を クリア
-
すべて
-
採用
-
サステナビリティ
-
お知らせ
-
News
絞込み条件を クリア
-
すべて
-
Information
絞込み条件をクリア
絞り込み結果 0 件中 0 件
表示する項目がありません
ページの先頭へ
ページの先頭へ
-
CLOSE
-
MENU
サイト内検索
Copyright (C) 2002- Lacto Japan Co., Ltd. All Rights Reserved.
| | |
| | |
| | |

Prompts
Click prompts to add them under the company line, click again to take one out, then copy the result into your AI chat. Shared by Asian Century Stocks and Uncovered Thai Stocks. Thank you.
Lacto Japan Co., Ltd. (ticker 3139), listed in Japan.
Copied
ETFs Holding Lacto Japan Co., Ltd.
Exchange-traded funds whose newest published daily portfolio holds one of the company's listings, largest weight first.
| ETF | Weight in ETF | Shares | Market value | As of |
|---|---|---|---|---|
| AVDS | 0.01% | 1,000 | $ 22.041K | Nov 16, 2026 |
| DISV | 0.01% | 14,400 | $ 316.548K | Nov 12, 2026 |
| DFIS | 0.01% | 13,200 | $ 290.169K | Nov 12, 2026 |
| DFSI | 0.00% | 1,900 | $ 41.767K | Nov 12, 2026 |
| DFIC | 0.00% | 14,000 | $ 307.755K | Nov 12, 2026 |
| DFAX | 0.00% | 6,900 | $ 151.679K | Nov 12, 2026 |
| DFAI | 0.00% | 9,300 | $ 204.437K | Nov 12, 2026 |
| AVSD | 0.00% | 600 | $ 13.225K | Nov 16, 2026 |