For the year ended March 31, 2026 CONTENTS P1 P2 P4 P9 P 11 P 27 P 30 P 36 P 38 P 39 P 40 P 42 P 44 Key Financial Data History Information on subsidiaries and associates Management policy, management environment and issues to be addressed Approach to…
For the year ended March 31, 2026
CONTENTS
P1
P2
P4
P9
P 11
P 27
P 30
P 36
P 38
P 39
P 40
P 42
P 44
Key Financial Data
History
Information on subsidiaries and associates
Management policy, management environment and issues to be addressed
Approach to Sustainability and our initiatives
Business and other risks
Management’s analysis of financial performance, operating results, and cash flows
Consolidated Statement of Financial Position
Consolidated Statement of Income
Consolidated Statement of Comprehensive Income
Consolidated Statement of Changes in Equity
Consolidated Statement of Cash Flows
Notes to Consolidated Financial Statements
Key Financial Data
(Millions of Yen, unless stated otherwise)
IFRS
Fiscal Year
97th
business term
98th
business term
99th
business term
100th
business term
101st
business term
Year end
March 2022
March 2023
March 2024
March 2025
March 2026
Revenue
1,421,451
1,604,036
1,953,625
1,954,218
2,037,063
64,529
52,291
88,008
47,096
61,918
39,260
14,679
58,521
16,719
23,271
73,686
34,348
95,476
21,944
64,672
386,162
400,741
449,597
447,420
485,256
964,740
1,007,392
1,128,491
1,094,831
1,182,385
(Yen)
2,066.53
2,144.33
2,518.57
2,504.56
2,716.10
(Yen)
210.15
78.57
315.17
93.65
130.30
(Yen)
210.13
78.56
315.12
93.63
130.27
(%)
40.0
39.8
39.8
40.9
41.0
(%)
10.9
3.7
13.8
3.7
5.0
(Times)
9.5
27.2
8.1
21.2
18.5
122,933
89,428
174,898
121,834
142,965
(40,893)
(36,461)
(86,698)
(60,955)
(75,499)
(48,664)
(40,812)
(91,595)
(54,377)
(48,358)
Cash and cash equivalents at
end of period
237,952
248,195
244,191
249,721
278,507
Number of Employees
44,264
44,581
46,972
45,004
45,521
[7,777]
[8,849]
[9,401]
[7,857]
[9,029]
Profit before income taxes
Profit attributable to owners of
the parent
Comprehensive income
Total equity attributable to
owners of the parent
Total assets
Equity per share attributable to
owners of the parent
Earnings per share attributable
to owners of the parent –
Basic
Earnings per share attributable
to owners of the parent –
Diluted
Ratio of equity attributable to
owners of the parent
Ratio of profit to equity
attributable to owners of the
parent
Price earnings ratio
Cash flows from operating
activities
Cash flows from investing
activities
Cash flows from financing
activities
[Average number of part-time
employees, not included in
number of employees above]
(Persons)
(Notes) 1. Number of employees is the number of workers (excluding people dispatched from Toyota Boshoku
Corporation and its consolidated subsidiaries (“the Group”) to outside the Group, but including people
dispatched from outside the Group to the Group).
2. The consolidated financial statements have been prepared in accordance with International Financial
Reporting Standards (IFRS).
-1-
History
Date
January 1918
November 1923
September 1931
February 1942
Overview
Founded Toyoda Boshoku Corporation
Established Kariya Plant
Merged with Kikui Boshoku Corporation
Merged with four companies Utsumi Boshoku Co., Ltd., Chuo Boshoku Co., Ltd.,
Kyowa Boseki Co., Ltd., and Toyoda Oshikiri Boshoku Corporation to establish Chuo
Spinning Company
November 1943 Merged with Toyota Motor Co., Ltd. (currently Toyota Motor Corporation)
May 1950
Established Minsei Spinning Co., Ltd. as a separate independent entity from Toyota
Motor Co., Ltd. (currently Toyota Motor Corporation)
August 1950
Stock listed on the Nagoya Stock Exchange
September 1956 Established Oguchi Plant
August 1967
Company name changed to Toyoda Boshoku Corporation
March 1968
Merged with Gifu Boseki Co., Ltd. (currently Gifu Plant)
December 1972 Added “Production, processing and sales of auto parts” to its purpose of business
February 1973
Started production of ignition coils
September 1973 Started production of seat fabrics
April 1985
Started production of air filters
February 1990
Started production of fender liners
May 1990
Started production of molded headliners
April 1995
Started production of airbag base fabrics
December 1995 Started production of bumpers
January 1998
Started production of cabin air filters and revolving sensors
January 1999
Started production of silencer pads
June 1999
Started production of oil filters
March 2000
Stock listed on the Tokyo Stock Exchange, First Section
May 2000
Began production for the first time as an interior system supplier for Toyota Motor
Corporation’s new RAV4
July 2000
Started production of intake manifolds
October 2000
Merged with Toyota Kakoh Co., Ltd.
Through merger, succeeded to Kisogawa Plant and other three plants, and added floor
carpets to the Company’s production lineup
October 2004
Merged with two companies Araco Corporation (car interior components business) and
Takanichi Co., Ltd. to form Toyota Boshoku Corporation
Through merger, succeeded to Sanage Plant, Takaoka Plant and other seven plants, and
added seats and door trims to the Company’s production lineup
July 2005
TNAT (THAILAND) CO., LTD. was merged with TOYODABO ASIA CO., LTD., and
the surviving company was renamed TOYOTA BOSHOKU ASIA CO., LTD. (currently
a consolidated subsidiary) and was made the Asian regional management hub
July 2005
Two companies TOYODABO AMERICA, INC. and Takanichi-USA, Inc. were merged
with ARACO AMERICA INC., and the surviving company was renamed TOYOTA
BOSHOKU AMERICA, INC. (currently a consolidated subsidiary) and was made the
North American regional management hub
July 2005
Established TOYOTA BOSHOKU EUROPE N.V. (currently a consolidated subsidiary)
in Belgium as European regional management hub
October 2007
Reorganized the businesses of six Japanese subsidiaries through a merger into four
companies in order to optimize the production system and reform the operational
processes
-2-
Date
February 2008
Overview
Changed the operations of TOYOTA BOSHOKU (SHANGHAI) CO., LTD. from trading
operations to investment operations and changed its name to TOYOTA BOSHOKU
(CHINA) CO., LTD. (currently a consolidated subsidiary) to strengthen the business
management and collaboration function in the China region
August 2008
Established Toyota Boshoku Technical Skills Academy for the purpose of developing
human resources that will become core personnel of technical-related workplaces
September 2008 A subsidiary in the North American region acquired and reorganized five plants of Trim
Masters, Inc. with the aim of establishing an efficient system for business operations in
the Americas region
October 2008
Acquired Sieto Plant from FAURECIA S.A., a French automobile seat manufacturer, and
established TOYOTA BOSHOKU SOMAIN S.A.S. (currently a consolidated subsidiary)
October 2008
Spun off the Research and Development Department as an independent organization to
establish Toyota Boshoku Research Laboratories
August 2009
Established Fuji Susono Plant to streamline production and build an optimal supply
system in domestic plants
May 2010
Established the No.2 building of Sanage Technical Center to consolidate and fortify
development functions for automotive interior systems
July 2011
Acquired the interior business of POLYTEC Holding AG to strengthen interior
technological capabilities and realize business with European car manufacturers
December 2012 Started production of motor core components for hybrid systems
July 2013
Started production of railway seats utilized in the Hokuriku Bullet Train “Gran Class”
car
April 2015
Started production of aircraft seats for economy class on domestic flights, which were
jointly developed with ALL NIPPON AIRWAYS CO., LTD.
November 2015 Acquired the business for automotive seat frame mechanism components such as
recliners and slide rails for Toyota Motor Corporation and the Company that had been
owned by Aisin Seiki Co., Ltd. (currently AISIN CORPORATION) and Shiroki
Corporation (currently AISIN SHIROKI CORPORATION)
June 2016
Through reorganization of the Europe business, all the shares of Boshoku Automotive
Europe GmbH, Boshoku Automotive Poland Sp. Z o.o., and Boshoku Automotive Czech
s. r. o. and part of business operations of the Munich Branch of TOYOTA BOSHOKU
EUROPE N.V. were transferred to Megatech Industries AG
January 2018
Marked the 100th anniversary of the Company’s founding
November 2019 Established MONOZUKURI Innovation Centre in order to build next-generation
production lines that utilize AI technology and automation technology, and to promote
the streamlining and enhancement of product manufacturing
August 2020
Established the New Main Building of the Global Mainstay Hub in Kariya Japan in order
to consolidate the corporate functions and strengthen the global management base
April 2022
The Company’s stock that had been listed on the First Section of the Tokyo Stock
Exchange was transferred to the Prime Market due to a restructuring of the market
segments of the Tokyo Stock Exchange
-3-
Information on subsidiaries and associates
Company name
Location
Share
capital
Principal
business
Relationship
Percentage
Conof voting
rights of current
service Loan of
Lease of
the
Business transactions
by
funds
facilities
Company
officers,
(%)
etc.
(Consolidated subsidiaries)
TOYOTA
BOSHOKU
KitakamiTOHOKU
shi, Iwate
CORPORATION
(Note 3)
JPY million
Auto parts
1,667
100.0
None
COWERK CO.,
LTD. (Note 3)
JPY million
Auto parts
97
52.0
Yes
Kariya-shi,
Aichi
TOYOTA
BOSHOKU
KanzakiKYUSHU
shi, Saga
CORPORATION
(Note 3)
JPY million
Auto parts
480
100.0
Yes
None
Purchase of
TOYOTA
BOSHOKU
TOHOKU
CORPORATION’s
products
Yes
None
Purchase of
COWERK CO.,
LTD.’s products
Yes
None
Purchase of
TOYOTA
BOSHOKU
KYUSHU
CORPORATION’s
products
Yes
Yes
JPY million
Auto parts
869
66.4
Yes
Yes
Purchase of
TOYOTA
BOSHOKU
SEIKO
CORPORATION’s
products
CNY
thousand Auto parts
45,000
90.0
(90.0)
None
None
Sales of the
Company’s products
None
TB LOGISTICS Toyota-shi,
CORPORATION Aichi
TransportaJPY million
tion
50
business
100.0
Yes
None
Transportation
services for the
Company’s products
Yes
TOYOTA
BOSHOKU
Kentucky,
AMERICA, INC. U.S.A.
(Notes 3, 4)
USD
thousand Auto parts
539,742
100.0
Yes
Yes
Contracting of design
work
None
TOYOTA
BOSHOKU
JACKSON
Tennessee,
TENNESSEE
U.S.A.
COMPANY, LLC
(Notes 2, 3)
USD
thousand Auto parts
22,000
100.0
(100.0)
None
None
Sales of the
Company’s products
None
TOYOTA
BOSHOKU
Tennessee,
TENNESSEE,
U.S.A.
LLC (Notes 2, 3)
USD
thousand Auto parts
50,000
100.0
(100.0)
None
None
Sales of the
Company’s products
None
TOYOTA
BOSHOKU
Kentucky,
KENTUCKY,
U.S.A.
LLC (Notes 2, 3)
USD
thousand Auto parts
29,989
100.0
(100.0)
None
None
Sales of the
Company’s products
None
TOYOTA
BOSHOKU
ARGENTINA
S.R.L. (Notes 2,
3)
Buenos
Aires,
Argentina
ARS
thousand Auto parts
519,149
95.0
(95.0)
None
None
Sales of the
Company’s products
None
TOYOTA
BOSHOKU
CANADA, INC.
(Notes 2, 3)
Ontario,
Canada
USD
thousand Auto parts
29,000
100.0
(100.0)
None
None
Sales of the
Company’s products
None
TOYOTA
BOSHOKU
TakahamaSEIKO
shi
CORPORATION Aichi
(Note 3)
SEAT METAL
PARTS CHINA
CO., LTD
(Notes 2, 3)
Zhejiang,
China
-4-
Company name
Location
Share
capital
Principal
business
Relationship
Percentage
Conof voting
rights of current
service Loan of
Lease of
the
Business transactions
by
funds
facilities
Company
officers,
(%)
etc.
TOYOTA
BOSHOKU
Mississippi,
MISSISSIPPI,
U.S.A.
LLC (Notes 2, 3)
USD
thousand Auto parts
49,000
100.0
(100.0)
None
None
Sales of the
Company’s products
None
TOYOTA
BOSHOKU DO
BRASIL LTDA.
(Notes 2, 3)
Sao Paulo,
Brazil
BRL
thousand Auto parts
245,318
100.0
(0.1)
None
None
Sales of the
Company’s products
None
TOYOTA
BOSHOKU
INDIANA, LLC
(Notes 2, 3)
Indiana,
U.S.A.
USD
thousand Auto parts
115,000
100.0
(100.0)
None
None
Sales of the
Company’s products
None
TOYOTA
BOSHOKU
ILLINOIS, LLC
(Notes 2, 3)
Illinois,
U.S.A.
USD
thousand Auto parts
57,400
100.0
(100.0)
None
None
Sales of the
Company’s products
None
TOYOTA
BOSHOKU
Kentucky,
WESTERN
U.S.A.
KENTUCKY,
LLC.(Notes 2, 3)
USD
thousand Auto parts
134,800
100.0
(100.0)
None
None
Sales of the
Company’s products
None
TOYOTA
BOSHOKU
(CHINA) CO.,
LTD. (Note 3)
Shanghai,
China
USD
thousand Auto parts
133,498
100.0
Yes
None
Contracting of design
work
None
CHENGDU
TOYOTA
BOSHOKU
AUTOMOTIVE
PARTS CO.,
LTD. (Notes 2, 3)
Chengdu,
Sichuan
Province,
China
USD
thousand Auto parts
15,560
53.0
(53.0)
None
None
Sales of the
Company’s products
None
NINGBO
TOYOTA
BOSHOKU
AUTOMOTIVE
PARTS CO.,
LTD. (Notes 2, 3)
Ningbo,
Zhejiang
Province,
China
USD
thousand Auto parts
8,200
80.0
(40.0)
Yes
None
Purchase of
NINGBO TOYOTA
BOSHOKU
AUTOMOTIVE
PARTS CO., LTD.’s
products
None
TIANJIN INTEX
AUTO PARTS
Tianjin,
CO., LTD.
China
(Notes 2, 3)
USD
thousand Auto parts
24,500
75.0
(75.0)
Yes
None
Sales of the
Company’s products
None
TIANJIN
TOYOTA
BOSHOKU
AUTOMOTIVE
PARTS CO.,
LTD. (Note 3)
Tianjin,
China
USD
thousand Auto parts
11,800
100.0
Yes
None
Sales of the
Company’s products
None
GUANGZHOU
INTEX AUTO
PARTS CO.,
LTD. (Notes 2, 3)
Guangzhou,
Guangdong
Province,
China
USD
thousand Auto parts
22,500
75.0
(75.0)
Yes
None
Sales of the
Company’s products
None
TOYOTA
BOSHOKU
(GUANGZHOU)
AUTOMOTIVE
PARTS CO.,
LTD. (Notes 2, 3)
Guangzhou,
Guangdong
Province,
China
USD
thousand Auto parts
20,000
100.0
(100.0)
Yes
None
Sales of the
Company’s products
None
-5-
Company name
Location
Share
capital
Principal
business
Relationship
Percentage
Conof voting
rights of current
service Loan of
Lease of
the
Business transactions
by
funds
facilities
Company
officers,
(%)
etc.
USD
thousand Auto parts
9,600
100.0
Yes
None
Sales of the
Company’s products
Purchase of
TOYOTA
BOSHOKU
FOSHAN CO.,
LTD.’s products
TOYOTA
BOSHOKU
(TIANJIN)
Tianjin,
AUTOMOTIVE China
PARTS CO.,
LTD. (Notes 2, 3)
USD
thousand Auto parts
16,500
100.0
(100.0)
Yes
None
Sales of the
Company’s products
None
SHENYANG
TOYOTA
BOSHOKU
AUTOMOTIVE
PARTS CO.,
LTD. (Notes 2, 3)
Shenyang,
Liaoning
Province,
China
CNY
thousand Auto parts
510,000
100.0
(100.0)
Yes
None
Sales of the
Company’s products
None
TOYOTA
BOSHOKU
ASIA CO., LTD.
(Note 3)
Bangkok,
Thailand
THB
thousand Auto parts
744,630
100.0
None
None
Contracting of design
work
None
SHIN SAN
Hsinchu,
SHING CO.,
Taiwan
LTD. (Notes 2, 3)
TWD
thousand Auto parts
330,000
47.0
[3.8]
None
None
Sales of the
Company’s products
None
None
TOYOTA
BOSHOKU
FOSHAN CO.,
LTD. (Note 3)
Foshan,
Guangdong
Province,
China
None
Jawa Barat,
Indonesia
USD
thousand Auto parts
13,750
81.8
None
None
Sales of the
Company’s products
Purchase of PT.
TOYOTA
BOSHOKU
INDONESIA’s
products
TOYOTA
BOSHOKU
Laguna, the
PHILIPPINES
Philippines
CORPORATION
(Note 3)
PHP
thousand Auto parts
377,000
95.0
None
None
Sales of the
Company’s products
None
TOYOTA
BOSHOKU
GATEWAY
(THAILAND)
CO., LTD.
(Notes 2, 3)
Chachoengsao,
Thailand
THB
thousand Auto parts
250,000
80.0
(30.0)
None
None
Sales of the
Company’s products
None
TOYOTA
BOSHOKU
AUTOMOTIVE Karnataka,
INDIA PRIVATE India
LIMITED
(Notes 2, 3)
INR
thousand Auto parts
795,285
95.0
(25.0)
None
None
Sales of the
Company’s products
None
TOYOTA
BOSHOKU
FILTRATION
SYSTEM
(THAILAND)
CO., LTD.
(Notes 2, 3)
THB
thousand Auto parts
300,000
80.0
(80.0)
None
None
Sales of the
Company’s products
None
PT. TOYOTA
BOSHOKU
INDONESIA
(Note 3)
Rayong,
Thailand
-6-
Company name
Location
Share
capital
TOYOTA
BOSHOKU
SIAM METAL
CO., LTD.
(Notes 2, 3)
Chonburi,
Thailand
THB
thousand Auto parts
350,000
87.1
(87.1)
None
None
Sales of the
Company’s products
None
TOYOTA
BOSHOKU
HAIPHONG
CO., LTD.
(Note 3)
Haiphong,
Vietnam
USD
thousand Auto parts
9,100
100.0
None
None
Sales of the
Company’s products
None
PT. TOYOTA
BOSHOKU
DEVICE
INDONESIA
(Notes 2,3)
Jawa Barat,
Indonesia
USD
thousand Auto parts
29,900
80.0
(80.0)
None
None
Sales of the
Company’s products
None
BOSHOKU
AUTOMOTIVE
(THAILAND)
CO., LTD.
(Notes 2, 3)
Rayong,
Thailand
THB
thousand Auto parts
331,000
90.0
(90.0)
None
None
None
None
TOYOTA
BOSHOKU
DEVICE
Haryana
INDIA PRIVATE India
LIMITED
(Note 2)
INR
thousand Auto parts
462
100.0
(100.0)
None
None
Sales of the
Company’s products
None
TOYOTA
BOSHOKU
EUROPE N.V.
(Note 3)
Zaventem,
Belgium
EUR
thousand Auto parts
436,134
100.0
None
None
Contracting of design
work
None
TOYOTA
BOSHOKU
TURKIYE
OTOMOTIV
SANAYI VE
TICARET A.S.
(Notes 2, 3)
Adapazari,
Turkey
TRY
thousand Auto parts
25,696
90.0
(90.0)
None
None
Sales of the
Company’s products
None
ZAR
thousand Auto parts
225,750
85.0
(85.0)
None
None
Sales of the
Company’s products
None
EUR
thousand Auto parts
2,698
100.0
(100.0)
None
None
Sales of the
Company’s products
None
PLN
thousand Auto parts
56,263
100.0
(100.0)
None
None
Sales of the
Company’s products
None
TOYOTA
KwazuluBOSHOKU
Natal,
SOUTH AFRICA
South
(PTY) LTD.
Africa
(Notes 2, 3)
Zone
TOYOTA
Industrie
BOSHOKU
lle de la
SOMAIN S.A.S. Renaissa
nce,
(Notes 2)
France
Lower
TOYOTA
Silesian
BOSHOKU
VoivodePOLAND SP. Z
ship,
O.O. (Notes 2, 3)
Poland
Principal
business
Relationship
Percentage
Conof voting
rights of current
service Loan of
Lease of
the
Business transactions
by
funds
facilities
Company
officers,
(%)
etc.
25 other
companies
-7-
Company name
Location
Share
capital
Principal
business
(Associates accounted for using
equity method)
TOKAI
Mitake-cho,
CHEMICAL
JPY million
Kani-gun,
Auto parts
INDUSTRIES,
100
Gifu
LTD.
AUNDE
Aisho-cho,
JPY million
Boshoku Co.,
Echi-gun,
Auto parts
490
LTD.
Shiga
Relationship
Percentage
Conof voting
rights of current
service Loan of
Lease of
the
Business transactions
by
funds
facilities
Company
officers,
(%)
etc.
20.0
None
None
20.0
None
Yes
Purchase of TOKAI
CHEMICAL
INDUSTRIES,
LTD.’s products
Purchase of AUNDE
Boshoku Co., LTD.’s
products
None
Yes
TOYOTA
BOSHOKU AKI
USA, LLC
(Note 2)
Alabama,
U.S.A.
USD
thousand Auto parts
60,000
50.0
(50.0)
Yes
None
None
None
QINGDAO
INJELIC
MOULD CO.,
LTD. (Note 2)
Shandong
Province
Qingdao
China
CNY
thousand Auto parts
87,500
20.0
(20.0)
Yes
None
None
None
16 other companies
(Notes) 1.The name of business division is shown in the “Principal business” field.
2. In the “Percentage of voting rights of the Company” field, the figures shown in parentheses, included in
the figures directly above, represent the indirect ownership ratio, and the figures shown in square
brackets, not included in the figures directly above, represent the ownership ratio of close persons, etc.
3. Companies indicated are specified subsidiaries.
4. Revenue of TOYOTA BOSHOKU AMERICA, INC. accounts for more than 10% of consolidated
revenue (excluding inter-segment revenue between consolidated companies).
Key Financial Data
(1)
(2)
(3)
(4)
(5)
Revenue
Loss before income
taxes
Loss for the period
Total equity
Total assets
513,360 million yen
12,439 million yen
12,933 million yen
43,264 million yen
299,424 million yen
- As Toyota Motor Corporation is treated as an “other affiliated company” and its information is stated
under “Related party transactions,” its information is not stated here. In addition, Toyota Motor
Corporation files an annual securities report.
-8-
Management policy, management environment and issues to be addressed
This section contains forward-looking statements, which are based on the group’s judgments as of the end of the
current fiscal year.
(1) Management policy
The Group sets the following management policies as “Basic Principles”.
- Society
The Company will promote corporate growth while fulfilling the following
responsibilities as a good corporate citizen:
- Maintain ethical values, ensuring that our corporate activities are fair and transparent;
- Supply safe products that do not harm the environment; Promote corporate activities
that help protect the global environment;
- Create a better society as a member of our local communities
- Customers
The Company will develop innovative technologies and products to deliver quality that
satisfies our customers.
- Shareholders
The Company will promote innovative management policies that ensure future corporate
growth and the trust of our shareholders.
- Employees
The Company will build and maintain positive labor-management relations, respect the
individuality of its employees and create safe and comfortable workplaces.
- Business partners
The Company will promote open and mutually beneficial relationships with its business
partners in pursuit of long-term growth and prosperity.
(2) Management environment and issues to be addressed
In order to continue our sustainable growth, we will promote the following initiatives.
(i)
We will work to enhance our planning & proposals and R&D capabilities in order to become an Interior
Space Creator:
- Establish systems and processes to accurately identify customer needs in order to realize comprehensive
mobility space planning;
- Strengthen our planning capabilities for interior design and packaging that address customer needs;
- Insource advanced technologies (sound, thermal, and lighting technologies);
- Improve development efficiency and fundamentally reform cost planning methodologies
(ii)
We aim to secure MONOZUKURI competitiveness that wins us customer trust and patronage:
- Ensure that safety and quality remain the highest priorities throughout the supply chain;
- Improve productivity through the thorough elimination of waste and the promotion of manufacturing
process reforms;
- Accelerate automation, including among suppliers
(iii) In order to win the patronage of customers around the world, we will work to strengthen our sales capability:
- Continuously capture market and customer information through enhanced marketing capability;
- Capture diverse business opportunities, including new customers and new business domains;
- Strengthen the sales foundation for key customers and priority regions
(iv) We will work to strengthen the management foundation that supports the implementation of i) through iii)
above across the board:
- Create a comfortable work environment centered on health and well-being;
- Promote appropriate personnel placement through the utilization of the human resource portfolio;
- Achieve fundamental improvements in operational efficiency through the use of AI;
- Establish a resource circulation foundation for the realization of a circular economy;
- Enhance earning power in priority regions
-9-
Our 2030 target is to become a company, as the Interior Space Creator, which realizes comfortable mobility
interior spaces and contributes to solving social issues while expanding our product range and customer base.
Through the practice of CSV management*, we aim to enhance both economic and social value and become a
company that continues to be needed by society.
- CSV (Creating Shared Value) management: A management approach that addresses social issues through core
business activities, aiming to achieve both economic and social value.
Approach to Sustainability and our initiatives
The group’s sustainability approaches and initiatives are as follows.
This section contains forward-looking statements, which are based on the group’s judgments as of the end of the
current fiscal year.
(1) Sustainability
[Strategy]
Based on the Principles of Toyoda, which bring together the ideas of our founder Sakichi Toyoda, the Toyota
Boshoku group has established its Corporate Philosophy and is steadily implementing this in our business
activities in order to continue to earn the trust of all stakeholders.
We are striving to enhance our economic value through the pursuit of sustainable growth and to return the
results to our stakeholders. We are also striving to enhance our corporate value over the medium and long term
by investing in sustainable growth, thereby meeting the expectations of our stakeholders and contributing to
the development of the international and local communities.
We are already actively involved in CSR activities and have contributed to the achievement of the SDGs. In
line with changes in society, since March 2019 we have been accelerating the shift from CSR to CSV
management. In July 2020, we defined as our materiality the identification of important issues to be addressed
through our group’s operations from among a variety of social issues and the approach we adopt to resolve
them.
Furthermore, in order to clarify the concept of CSV management, we reviewed the concept of CSR and,
formulated the Toyota Boshoku Group Sustainability Policy with the approval of the Board of Directors in
November 2021.
We have also formulated and shared the TB Way and the Toyota Boshoku Group Code of Conduct as common
values and patterns of behavior on a global scale in order to put our Corporate Philosophy into practice.
Toyota Boshoku Group Sustainability Policy
The Toyota Boshoku group's Sustainability Policy is composed of the "Management Concept," "Materiality," and
"The management structure we aim to become."
-
Management Concept
The Toyota Boshoku Group has established Materiality based on the
Principles of Toyoda* and contributes to society through its core
business activities.
*Toyota Boshoku’s company belief, which stipulates the founding
spirit of Sakichi Toyoda, “for the world and for people,” as our daily
motto
-
Materiality
As an Interior Space Creator, we will create comfort, safety,
and reassurance and contribute to people’s quality of life and
a society with no traffic casualties. We will also take on the
challenge of using renewable energy and realizing carbon
neutrality in the circular economy.
-
The management structure we aim to become
We will contribute to social value as a good corporate citizen
and improve economic value through efforts to strengthen our
competitiveness and management foundation. Through these,
we will strive to increase the corporate value by meeting
expectations of our stakeholders and pursuing sustainable
growth.
[Governance]
The CSV Promotion Meeting (chaired by the Sustainability Field Cheif) reports and deliberates on issues and
the direction to take in order to enhance corporate value, establishes goals and monitors progress in
implementing them.
All chief officers responsible for ESG KPIs, which are organized from an ESG perspective and measure
progress on materiality, attend the CSV Promotion Meeting to monitor ESG KPIs. Through these activities, we
accurately assess the degree to which materiality has been achieved, and we implement the PDCA cycle, as
necessary, to get back on track. In addition, the details reported and deliberated on at the CSV Promotion
Meeting are reported to the Board of Directors.
Cooperating with each function and related divisions, we promote initiatives to contribute to social value of the
Toyota Boshoku group as a whole through daily activities.
Structural Chart
Report
Report
[Risk management]
From April 2019 to July 2020, we made a company-wide effort to identify important issues and formulated our
materiality.
The important issues identified were classified into those that “Matters for which positive effects are to be
maximized,” which enrich people and their lives, and those that “Matters for which negative effects are to be
minimized,” which avoid risk. They were then organized into “Issues Relating to Safety, Environment, and
Comfort to Resolve through Our Business Operations,” and “Issues Relating to the People and Organizations
that are Our Sources for Exercising Competitiveness.” The materiality of the Toyota Boshoku group was
determined by adding the approach we adopt to resolve each issue.
Plotting of social issues and extraction of important issues
The materiality of the Toyota Boshoku group
[Indicators and targets]
In December 2021, we established ESG KPIs, non-financial KPIs to measure social value. In October 2023,
we reviewed these ESG KPIs in conjunction with the formulation of our 2030 Mid-term Business Plan.
By advancing initiatives to realize our materiality while measuring progress using the ESG KPIs, we aim to
enhance corporate value and meet the expectations of our stakeholders.
The ESG KPIs are monitored by the CSV Promotion Meeting, chaired by the Sustainability Field Chief.
Approach to formulation of ESG KPIs
- Organize from an ESG standpoint
- In line with the Toyota Boshoku Group Sustainability Policy
- Progress toward materiality can be measured
- In line with the Corporate Governance Code
- Responds to the demands of society
No.
Materiality
(*)
KPIs
Plant GHG emissions reduction ratio (total volume)
(compared to FY2020)
Ratio of reduction in Scope 3 emissions (total
volume) (compared to FY2020)
Renewable energy installation ratio
Waste emissions reduction ratio (compared to
FY2012)
1
(iii)
2
(iii)
3
(iii)
4
(iii)
5
(iii)
Water withdrawal reduction ratio (compared to
FY2014)
6
(i) (iii)
Ratio of recycled materials applied to products
7
(iii)
8
(iii) (iv)
Symbiosis with nature (number of trees planted)
Number of “people-friendly” autonomation items
implemented
(1) Implementation rate on mass production
(2) Achievement rate of processing cost reduction
target
9
(v)
10
(v)
11
(iv)
Number of participants in social contribution
activities (annual)
Ratio of female managers
12
(iv)
Ratio of men taking childcare leave
13
(iv)
14
(i)
15
16
(i) (ii)
(i) (ii)
17
(iv)
18
(iv)
Number of non-Japanese company members
Ratio of new product development leading to
Interior Space Creator
Number of patent applications
Number of external presentations and papers
Ratio of those who have an exercise habit (40 years
and older)
Rate of company members receiving thorough
medical examinations after general health checkups
Implementation of Supplier Satisfaction Survey
Target
FY2026 targets
(Year ended
March 31, 2026)
FY2026 results
(Year ended
March 31, 2026)
-25%
-49%
-50%
-18%
Under calculation
-30%
35%
46%
-14%
-14%
-6%
-52%
50%
FY2020 level or
less
-34%
(compared to
FY2020)
Completion of
recycled resin
development
Cumulative 640k
Completion of
recycled resin
development
Cumulative 830k
Cumulative 900k
(1) 100%
(2) 100%
(1) 100%
(2) 89%
(1) 100%
(2) 100%
Expansion ratio
100%
Expansion ratio
100%
Expansion ratio
100%
Total 3,100
Total 3,240
Total 3,500
4.0%
90%
(100% applicant
take-up)
135
3.3%
74%
(100% applicant
take-up)
194
5.0%
90%
(100% applicant
take-up)
180
15%
15%
30%
320/year
90/year
490/year
97/year
500/year
120/year
24%
22.1%
30%
100%
99.8%
100%
FY2031
(Year ended
March 31, 2031)
25% or more
19
(iv)
20
(iii) (v)
21
(v)
22
(v)
23
(iii) (v)
24
(v)
Number of fatal accidents involving company
members
Number of fatal accidents involving outside
contractors and visitors
Implementation of continuous tax payments to the
state and regions
Degree of implementation of the Toyota Boshoku
Group Guiding Principles
Number of environmental abnormalities and
complaints
Number of serious cyber security incidents
0
0
0
0
0
0
Tax payment made Tax payment made Tax payment made
in all countries
in all countries
in all countries
where the group
where the group
where the group
operates
operates
operates
90%
95%
90%
0
3
0
0
0
0
(*) Of the above KPI results and targets, No. 1, 2, 4, 5, 6, 7, 19, 20, 21, 22, 23, and 24 apply to the global Toyota Boshoku group and
No. 3, 8, 9, 10, 11, 12, 13, 14, 15, 16, 17, and 18 apply to the non-consolidated Toyota Boshoku Corporation.
(2)Human Capital
[Our approach to human capital in sustainability]
As a fundamental principle of our approach to human capital in sustainability, the Toyota Boshoku group regards
its people as one of our most important management resources and as a source of sustainable growth.
Amid changes in the business environment surrounding the automotive market and the diversification of
customer needs, it is essential to create an environment in which each employee can maximize their capabilities
and take the initiative to play an active role in order to continuously enhance corporate value.
To realize our 2030 Target, which is to “become a company, as the Interior Space Creator, which realizes
comfortable mobility interior spaces and contributes to solving social issues while expanding our product range
and customer base,” we position human capital as a key element supporting sustainable value creation. We
promote human capital management to enable people with expertise and diverse perspectives to enhance one
another’s capabilities and continuously create new value.
Employee engagement is regarded as an important indicator for measuring the effectiveness of human resource
strategies and the health of the organization, and is used for metrics to measure the effectiveness of human
capital management. Our basic approach to human capital is to improve engagement through investment in
human capital and thereby contribute to the sustainable enhancement of corporate value.
[Policy on human resources development and key initiatives]
The Company develops human resources by clarifying the quality and quantity of personnel needed for the
execution of our management strategy, based on changes in the medium-term market environment,
technological advances, and developments in the competitive landscape. Based on a human resource portfolio
formulated in light of our management strategy and future business development, we promote recruitment,
development, and placement in an integrated manner while continuously monitoring and reviewing the status
of their activities, thereby securing and developing human resources in a timely and efficient manner. In addition,
we are optimizing the posts of many Japanese coordinators (non-line managers) seconded overseas to facilitate
coordination with the headquarters in Japan, while creating opportunities for those returning from overseas
assignments to play an active role in new fields. At the same time, we are systematically promoting the
appointment of local personnel to senior posts at business sites in countries outside Japan and at Regional
Management & Collaboration Hubs, thereby enhancing our global management structure.
Under these initiatives, we promote the development and appointment of human resources who possess both
expertise and diverse perspectives and can demonstrate well-balanced capabilities on a global basis, based on
the TB Way competencies, which define the type of people we are looking for. With a view to developing future
management resources who will guide the Company, we also implement a global executive training program to
cultivate the next generation of management leaders. Furthermore, to support self-directed growth and diverse
career development, we provide educational programs designed to cultivate personnel who will lead the creation
of new businesses. We create an environment in which each company member can consider their own career
and take on challenges in new roles and fields by introducing in-house application systems and an in-house sidejob system.
In addition, to enable our human resources to continue demonstrating their capabilities, we conduct KPI-based
monitoring and have established mechanisms that support growth and active contribution by providing training
and career opportunities beyond an individual’s own area of expertise, cultivating digital human resources, and
implementing supervisor-subordinate career interviews, thereby strengthening our human resource foundation
that supports the sustainable growth of the organization as a whole.
[Policy on workplace environment development and key initiatives]
The Company respects diverse career paths and work styles and positions the development of a workplace
environment in which people can thrive by embracing their diversity and leveraging their individual strengths,
regardless of nationality, age, gender, or physical or mental disability, as a foundation for sustainable growth
and the creation of new value. Believing that diversity provides the foundation for innovation, we seek to
enhance organizational creativity and individual employee engagement by fostering an open workplace culture
in which everyone can openly and freely express their ideas. As part of our diversity and inclusion activities, we
have established five Employee Network Resource Groups (ENRGs) comprising company members with
diverse backgrounds and values (women, younger people, non-Japanese company members, seniors, and people
with disabilities). Approximately 120 members participate in these groups, ascertaining the real views of
company members and engaging in discussions to promote their success.
We are also developing work rules and systems that support flexible, efficient, and creative ways of working,
while striving to create a workplace environment in which everyone can work happily and energetically. To
support work styles that accommodate diverse life stages, we create an environment that enables greater
participation in childcare by developing systems that encourage men to take childcare leave and promoting
understanding in the workplace, as part of the enhancement of measures to help company members balance
work and family responsibilities.
Furthermore, based on the basic belief that the top priority should be placed on safety and health at work, we
promote health management and safety & health management. Through ensuring a safe and secure workplace
environment and the maintenance and promotion of company members’ physical and mental well-being, we are
creating an environment in which each member can maximize their potential. Under the Toyota Boshoku Health
Declaration, we have established a promotion system, with the CEO as the person holding chief responsibility,
and implements initiatives based on the strategic map for health management. In recognition of these activities,
we were certified as an Excellent Enterprise of Health and Productivity Management 2026 (White 500), for the
fifth consecutive year.
We position compliance and respect for human rights as important management priorities, and we are
developing an internal environment that supports sustainable business activities through sound organizational
management that respects diverse cultures and values, going beyond mere compliance with laws and regulations.
As part of these efforts, we have strengthened our harassment prevention activities, and we are creating an
ethical workplace with an emphasis on compliance through animation-based training programs.
In addition, in order to respond promptly to risks related to management and risks arising from the external
environment, we are actively working to strengthen risk management and reduce risks.
[Indicators related to the relevant policies, and their results and targets]
Based on changes in the management and business environment and our recognition of key human resource
issues, the Company has established seven HR strategies as the framework for its human capital management.
In promoting these HR strategies, we have established KPIs and enhance the effectiveness of human capital
management by continuously monitoring implementation through the PDCA cycle and reviewing and advancing
initiatives as necessary. Through such operation, we are building an organizational framework capable of
delivering flexible and sustainable results even in a rapidly changing business environment.
Changes in the
Priority issue
management/business
awareness related to
environment
HR
Expansion of global
business/new value
areas
HR strategies
Major initiatives
Indicators
・ Promotion of
Percentage of local
training and
company members in
appointment of
positions such as
local employees to presidents of sites
・ Securing and
management
outside Japan
training human
positions in
resources with
countries other
diverse expertise
than Japan
Number of foreign
and advanced
・ Recruitment and
employees *1
skills necessary to (1), (2), (3)
promotion of
expand new value Clearly identify
foreign and global
areas
human resources
essential human
・ Expand the roles resources and secure, ・ Planned
and contributions train and assign talent
recruitment of
Number of employees
of local human
persons with
with disabilities
in a planned fashion
resources at
disabilities and
based on a human
overseas offices
promotion of their
resource portfolio
・ Shift resources to
active participation
new areas,
through expansion
leveraging existing
of job fields
human resource
・ Reskilling and
Employment ratio of
strengths
assignment aimed persons with
at improving
disabilities
expertise
・ Development of
global executives
Number of women in
management positions
・ Create an
environment
(4), (5)
where each
・ Optimization of
individual can
evaluation and
Realization of HR
proactively
treatment systems
management
that
Diversification of
demonstrate his or enhances both
・ Promotion of
workstyles and values
her talent, placing motivation and growth
workstyle
emphasis on
innovation
opportunities, and
diversified
・ D&I initiatives
promotion of D&I
workstyles and
values
Ratio of women in
management positions
*2
Number of men taking
childcare leave
Ratio of men taking
childcare leave
(Acquisition rate of
applicants )
Employee
engagement
Indicators
Percentage of local company members in
Unit
2024
2025
2026
2031
%
29.2
29.5
31.0
80.0
Number of foreign employees *1
persons
100
153
194
180
Number of employees with disabilities
persons
166
168
175
–
Employment ratio of persons with disabilities
%
2.54
2.46
2.55
2.8
Number of women in management positions
persons
35
40
52
65
Ratio of women in management positions *2
%
2.7
2.6
3.3
5.0
persons
145
146
202
–
positions such as presidents of sites outside Japan
Number of men taking childcare leave
Ratio of men taking childcare leave
(Acquisition rate of applicants)
Employee engagement
%
%
67
69
74
90
(96)
(99)
(100)
(100)
–
51
54
60
- Number of full-time employees and ICT (Intra Company Transferee)
- In accordance with the revision of the reemployment system in FY2025, reemployed staff (those in
management positions) are included in the calculation from FY2025 onward as reemployed staff
maintain their pre-retirement job grades (they were not included in or before FY2024).
(3) Response to the TCFD
Toyota Boshoku group is working as one team to contribute to global environment protection for the realization
of a sustainable society, based on our Corporate Philosophy to “Promote corporate activities that help protect
the global environment.”
We formulated the 2050 Environmental Vision in FY2017 and identified our Materiality (important issue to be
resolved through our business operations) of “Together with our business partners, we will realize
MONOZUKURI innovations that minimize environmental stress” in FY2021 in order to promote environmental
initiatives. In response to evolving social trends, we revised a part of the 2050 Environmental Vision in FY2024.
In April 2020, we endorsed the recommendations of the Task Force on Climate-related Financial Disclosures
(TCFD). By extensively analyzing the impact of climate change on our business and the risks and opportunities
that result from it based on scenarios, we are reviewing the applicable costs required and reflecting
countermeasures in our management strategy. Based on the results of scenario analysis, we will continue to
strengthen our response to risks and opportunities and work on further information disclosure.
[Governance]
Concrete measures related to climate change and other environmental issues are decided upon by the Board of
Directors, and the progress of these measures is reported at such bodies as the Corporate Strategy Meeting, the
Corporate Planning Meeting, and the Corporate Management Meeting.
Policies and plans to respond to environmental issues resolved and discussed at the Board of Directors, the
Corporate Strategy Meeting, and the Corporate Planning Meeting are shared at the Environmental Promotion
Meeting, which is held three times annually, and is connected with implementation planning and progress
management for environmental issues affecting the Toyota Boshoku group. Additionally, KPI are created based
on implementation planning, and these are reported and subjected to management review at monthly Corporate
Management Meetings.
Matters deliberated upon at the Environmental Promotion Meeting are reported to the Board of Directors as
needed, whose resolutions and supervision allow such matters to be incorporated into group strategy.
[Strategy]
Scenario analysis of climate-related risks and opportunities
(i) Scenario analysis results
We have identified short-term, medium-term, and long-term risks and opportunities based on the 1.5 and 2°C
scenario1 developed by the International Energy Agency (IEA), in which the impact of transition to a lowcarbon society is tangible, and the 4°C scenario2 developed by the Intergovernmental Panel on Climate Change
(IPCC), in which the impact of physical risks surfaces. The table below lists the risks and opportunities that are
assessed as particularly high.
1
1.5°C scenario: Net Zero Emissions (NZE), in which greenhouse gas (GHG) emissions reach net zero by 2050
(IEA World Energy Outlook 2021); under 2°C scenario: Sustainable Development Scenario (SDS), in which
the rise in atmospheric temperature by 2100 is kept to below 2°C (IEA World Energy Outlook 2021)
2
4°C scenario: The Representative Concentration Pathways (RCP) scenario with the highest volume of GHG
emissions, where the rise in atmospheric temperature by 2100 is approximately 4°C (RCP 8.5) (IPCC 5th
Assessment Report)
Identified risks and opportunities
In our assessment of financial impact, we identified important risks and opportunities as events whose
respective scores, when multiplied together, produce a value of 6 or higher, using four levels of “likelihood of
occurrence,” and three levels of “business impact.”
Impact assessment and results
We compiled the actions to address the identified risks and opportunities, and their single-year costs.
(ii) Priority action
Challenge to Carbon Neutrality through a Circular Economy for Product Materials
The Toyota Boshoku group promotes the reduction of GHG emissions in the product life cycle. In addition to
reducing the weight of products, using plant-derived materials (biomass), and developing technologies for
electrified products, we will improve the recyclability of products. We will also work to reduce GHG emissions
from the materials used in our products toward carbon neutrality.
(1) Measures to reduce GHG emissions from product materials
(2) Initiatives for a circular economy
Challenge to carbon neutrality by 2050 by recycling product materials and using biomass
1
Reusing products as raw materials to produce new products
2
Chemical decomposition of used products and reuse as raw materials for new products
3
A renewable resource of biological origin
[Risk management]
The Sustainability Field monitors climate change-related changes in the external or internal environment for the
entire Toyota Boshoku group, and identifies risks that could negatively impact our business.
Climate-related risks are selected at the Risk Management Promotion Meeting, with the Chief Human Resources
Officer (CHRO), head of the Human Resources & General Administration Segment, acting as chairperson. The
Risk Management Promotion Meeting receives reports from various departments, including the Sustainability
Field, and discusses climate change-influenced risks of all kinds, such as typhoons and flooding. Judgments are
made concerning the relative severity of risks, with consideration made to the relationship between various risks.
Finally, climate-related risks which affect the Toyota Boshoku group are selected.
Selected risks are reported to the Board of Directors, under the management of the Chief Risk Officer (CRO) who
is also the President.
[Indicators and targets]
The Toyota Boshoku group is working to reduce GHG emissions in accordance with the 2050 Environmental
Vision.
The 2030 Environmental Action Plan targets a 50% reduction in factory GHG emissions and a 30% reduction in
logistics CO2 emissions by 2030 compared to FY2020.
In addition, we aim to reduce factory GHG emissions by 100% from the FY2020 level as our 2035 stretch goal.
Medium- and long-term targets
2050 Environmental Vision
Product life cycle GHG net zero
Plant GHG net zero
GHG emissions
Targets
Scope 1, 2
Scope 3
・2030 targets
2035 targets
100% reduction in GHG emissions versus FY2020
2030 targets
50% reduction in GHG emissions versus FY2020
Environmental Action Plan for 2025
30% reduction in GHG emissions versus FY2020
25% reduction in CO2 emissions versus FY2020
Results
Items
FY2026 Results
(estimated)1
FY2020 Results
(Year ended March 31,
2020)
(Year ended March 31, 2026)
Reduction rate
compared to FY2020
GHG (scope 1)
60,460 t-CO₂e
76,444 t-CO₂e
49% reduction
GHG (scope 2)
112,465 t-CO₂e
260,470 t-CO₂e
GHG (scope 3)
Calculating2
- A third-party guarantee will be obtained from KPMG AZSA Sustainability Co., Ltd.
- Calculations are ongoing due to changes in the calculation method for scope 3.
Scope 3 emissions in FY2026 are disclosed in the ESG data on our website together with a third-party guarantee.
Reference: Scope 3 emissions in FY2025 were 12,500,541 t-CO2e.
Business and other risks
In relation to the matters described in the annual securities report concerning the overview of business or financial
information, the management recognizes the following key risks that may have a material impact to the consolidated
financial position, financial performance and cash flows of the Group. Forward-looking statements in this report
represent the judgment of the Group as of the filing date of Japanese annual securities report (June 9, 2026).
(1) Economic conditions
The Group’s businesses encompass the production and sales of products and the provision of services
worldwide. Demand for automobile-related products, which make up an important part of that, is vulnerable
to the effects of the economic conditions of the countries or regions in which we provide our products and
services. Accordingly, an economic recession or a shrinkage in demand for automobiles in the Group’s major
markets, including Japan, North, Central and South America, China, Asia, and Europe may have an adverse
impact on the Group’s financial performance and financial position.
Moreover, the Group’s businesses may be indirectly affected by the economic conditions of regions in which
competitors conduct their production. For example, if a competitor has employed a labor force in the place of
production at lower personnel costs and provides the same type of products as the Group provides but at lower
prices, then that may have an adverse impact on the sales of the Group. Furthermore, if there is a fall in the
local currency of a region where components or raw materials are produced, the cost of production may drop
not only for the Group but for other manufacturers as well. If such a trend arises, competition for exports and
prices would intensify, which may have an adverse impact on the Group’s financial performance and financial
position.
(2) Reliance on certain customers
The Group mainly sells various auto parts, notably auto interior parts to Toyota Motor Corporation (“TMC”).
For the current fiscal year, the sales to TMC accounted for 23.5% of the Company’s revenue. Therefore, the
performance of TMC’s vehicle sales may have an adverse impact on the Group’s financial performance and
financial position.
As of March 31, 2026, the ratio of the Company’s voting rights held by TMC was 32.4%, which indicates the
direct ownership ratio.
(3) Potential risks associated with international activities and overseas operations
The production and sales activities of the Group are conducted in a wide range of markets, including Japan,
North, Central and South America, China, Asia, and Europe. Therefore, the deployment of business operations
in these regional markets involves various risks such as those listed below due to differences in the various
circumstances of the countries.
- Unforeseen changes to laws and regulations and disadvantageous changes to the tax system
- Immaturities in public infrastructure that affect business activities
- Occurrence of disadvantageous circumstances from political or economic causes
- Risks associated with hiring or securing personnel and labor problems
- Social turmoil caused by terrorism, war, infectious disease or other factors
(4) Exchange rate fluctuations
The Group’s businesses encompass the production and sales of products and the provision of services
worldwide. Items denominated in foreign currency including sales, expenses, assets and liabilities in each
region are converted into yen to prepare consolidated financial statements. Even if values of these items do
not change in the local currency, the exchange rate when converting these items could have an impact on the
values of these items after conversion into yen. Generally, the strengthening of the yen against other currencies
may have an adverse impact on the Group’s financial performance and financial position.
(5) Price competition
The Group faces extremely intensified price competition in the automobile industry.
The Group considers itself as a corporate enterprise that supplies products of superior technology, quality and
price to all markets globally, and which is capable of meeting its customers’ demands, but the Group has no
assurances that it can effectively compete like this in the future as well. That is because a new competitor in
a specific product market or regional market in which the Group operates could form a business alliance with
existing competitors and rapidly expand their market share. Loss of customers due to price pressure or being
unable to effectively compete may have an adverse impact on the Group’s financial performance and financial
position.
(6) Reliance on suppliers of raw materials and components
The Group’s products rely on various raw materials and components from suppliers outside the Group. The
Group has concluded basic business contracts with suppliers outside the Group and such stable transactions
for raw materials and components are a base for the Group’s stable production. However, the Group has no
assurances against future securement of raw materials and components, which may arise from a global
shortage due to tight supply, an unforeseen accident involving a supplier, or large earthquake, typhoon or
flooding caused by abnormal weather, or infectious disease outbreak involving a supplier. Such shortages
could have a delay on the Group’s production and cause an increase in costs. In addition, a significant increase
in the price of electricity, gas and other energy used in the production of raw materials and parts may also
increase costs.
(7) Environmental regulations
Guided by its corporate philosophy, the Group considers that part of its fundamental activities and promotion
of corporate activities with an emphasis on protection of the global environment, and takes thorough efforts
to reduce environmental burdens and to comply with laws and regulations. Specifically, the Group strives to
develop products that meet the environmental regulations; to develop processes and technologies that reduce
the occurrence of environmentally harmful materials; and to reduce environmentally harmful materials at the
production stage.
However, various environmental laws and regulations could also be revised and strengthened in the future.
Accordingly, any delays by the Group in responding to such changes could result in restrictions or reductions
in product development and product manufacturing, and may have an adverse impact on the Group’s financial
performance and financial position.
Moreover, if the Group is delayed in its response to various laws and regulations relating to the environment,
it could lose trust from countries, municipalities, local residents, and customers, which may have an adverse
impact on the Company’s reputation and credibility.
(8) Capability to develop new products
The Group makes efforts to develop new products that anticipate the sophisticated and diversifying market
needs and earn customer satisfaction in line with one of its corporate philosophies: to develop innovative
technologies and products to deliver quality products that satisfy our customers. Going forward, the Group
believes it will be able to continue to develop and sell new products. However, the process required to achieve
this is complicated and uncertain and involves various risks, including the risks below.
- The Group has no assurances of adequacy regarding the necessary funds and resources for investment in
new products and new technologies going forward.
- The Group has no assurances that long-term investments and usage of a large amount of resources will
lead to successful development of new products or new technologies.
- The value of the Group’s products may sharply drop due to rapid progress in technology or changes in
market needs.
- The Group may be unable to respond to the demands of the market and miss out on earning opportunities
due to delays in the commercialization of new technologies currently under development.
(9) Intellectual property rights
The Group accumulates technology and know-how to differentiate its products from those made by other
companies and directs efforts toward the protection of that technology and know-how. However, in certain
regions it is difficult to completely protect intellectual property or the Group is currently in a situation where
there is only limited protection of intellectual property. Therefore, the Group may be unable to prevent a third
party from producing a product that is similar to the Group’s product by using the Group’s intellectual property.
In addition, a third party may develop technology that is similar or superior to that of the Group, and the
Group may be unable to prevent a third party from emulating or analyzing and studying the Group’s patents
and corporate secrets. Moreover, the Group conducts development of products and technologies while being
conscientious of the intellectual property rights of third parties. However, in the future, circumstances may
arise where the Group is judged to have violated a third party’s intellectual property rights.
(10) Product defects
The Group is engaged in initiatives aimed at harnessing its total capabilities to improve quality in line with
one of its corporate philosophies: to supply safe products that do not harm the environment and promote
corporate activities that help protect the global environment. However, the Group cannot guarantee all its
products will be defect-free and that product recalls will not occur in the future.
Moreover, the Group takes out an insurance policy against product liability indemnities. However, the Group
has no assurances that the insurance will cover all amounts of indemnities that the Group may ultimately have
to bear. Product defects that could lead to large-scale recalls and product liability indemnities could result in
significant costs and a decline in our group's reputation, which could adversely affect our group's operating
results and financial position due to a decrease in sales.
(11) Large-scale disasters
The Group carries out various measures to minimize the impact on business activities from large-scale
disasters, such as by promoting the development of systems for business continuity, creating a safety
confirmation system, and carrying out regular training and regular checks and inspections of its production
facilities.
However, there is no assurance the Group can completely prevent or lessen the impact of human related or
natural disasters and power blackouts occurring at the Group’s and its suppliers’ production facilities.
Specifically, a number of the Group’s domestic production facilities and its business partners are located in
the Tokai region, and if a large-scale earthquake, a typhoon, flooding from local torrential downpour in this
region, such an event may cause delays or stoppages of production or shipment activities. If such delays or
stoppages and the turmoil are prolonged, it could have an adverse impact on the Group’s financial performance
and financial position.
(12) Information security
With regard to cyberattacks, which are becoming increasingly sophisticated and precise, the Group recognizes
that illegal intrusions and access to systems by third parties, infections of computer viruses, leakage of
confidential information or other cyber security breaches are serious risks, and promotes security measures.
The Group believes it is important to also strengthen the operational aspects through awareness campaigns,
education and trainings targeting employees, and in addition to strengthening measures to protect systems,
efforts are carried out to maintain and enhance trust in the Group by systematically and continuously raising
the security awareness of employees. We are working together with our suppliers to strengthen security.
However, cyberattacks or intentional fraudulent acts or negligence could cause information system failure or
confidential information leakage to the third parties. Such occurrences could have a stalling effect on the
Group’s business activities or lower society’s trust in the Group, which may have an adverse impact on the
Group’s financial performance and financial position.
To address the aforementioned and other risks, the Group comprehensively identifies and manages risks
through the Risk Management Promotion Meeting and conducts activities to prevent and mitigate potential
losses from those risks.
Management’s analysis of financial performance, operating results, and cash flows
(1) Summary of business results
The following is a summary of the group’s financial position, financial performance, and cash flows (hereinafter
“business results”) for the fiscal year ended March 31, 2026.
1)
Financial position and financial performance
■ Business environment
During the fiscal year ended March 31, 2026, signs of recovery were seen in some areas of the global
economy, driven in part by the easing of inflation rate despite uncertainties surrounding geopolitical risks
and policy trends in various countries. Overall, amid a complex interplay of various factors, the economy
maintained generally stable growth, albeit at a moderate pace. At the same time, we must continue to
closely monitor changes in the external environment that affect business operations, such as exchange rate
fluctuations, trends in energy and resource prices, and rising geopolitical risks.
In the automotive industry, production and sales remained generally stable despite persistently high raw
material and logistics costs. While efforts toward carbon neutrality continue, technological innovation
centered on BEV1 and SDV2 is advancing. Furthermore, against the backdrop of rising geopolitical risks
and the trade policies of various countries, changes in the business environment are becoming increasingly
apparent, including the ongoing review of supply chains and production systems.
■
Business overview for the fiscal year ended March 31, 2026
a
Strengthening the competitiveness in the current situation
Amid high raw material and logistics costs, our company strived to maintain a stable production and
supply system by flexibly adapting to fluctuations in automobile production volumes. Building on our
long-standing integrated development and production system―which spans from components to finished
products―we strengthened collaboration across factories and regions. Additionally, we worked to enhance
our manufacturing competitiveness by leveraging TPS3 and digital transformation (DX) to improve
production processes. Furthermore, we continuously implemented cost improvement initiatives through
cost planning and the promotion of VA4, and worked to enhance our competitiveness by strengthening our
profitability.
b
Initiatives from a medium- to long-term perspective
We are continuing our efforts to realize our vision as outlined in our 2030 Mid-Term Management Plan:
“The company that creates comfortable mobility spaces as an ‘Interior Space Creator’5, contributes to
solving social issues, and expands its product and customer base.” Under an integrated structure combining
our product business and technology development divisions, we are strengthening our planning and
proposal capabilities with a holistic view of the vehicle interior, thereby accelerating our value-proposal
initiatives.
As part of these efforts, we have presented concept proposals and technology demonstrations for
mobility spaces at various exhibitions, such as the JAPAN MOBILITY SHOW 2025, focusing not only on
comfort and coziness but also on environmental considerations and new experiential value. At the same
time, we are continuing to work on the development of materials and technologies that contribute to
reducing environmental impact6, as well as on demonstration with a view to future commercialization7.
Moving forward, we will continue to aim for sustainable growth and the enhancement of corporate value
by creating products, technologies, and services with enhanced value from a medium- to long-term
perspective.
1
BEV (Battery Electric Vehicle): Electric Vehicle
2
SDV (Software Defined Vehicle): Cars that continue to evolve even after being manufactured and sold
through updates to the software that controls them.
3
TPS (Toyota Production System): Toyota Production System
4
VA (Value Analysis): One of the methods to realize cost reduction through design and process changes
without lowering the quality and function of the proposed product.
5
Interior Space Creator: A leading company that can create solutions by designing and proposing seats and
interiors as an integrated system, delivering new spatial value that exceeds customer expectations.
6
Research and development of low-cost, high-impact-resistant cellulose structural materials utilizing plantderived cellulose nanofibers (CNF) obtained from wood and other sources (selected for the New Energy
and Industrial Technology Development Organization (NEDO) Leading-Edge Research Program), etc.
7
Road tests of “hydrogen bicycles” equipped with electric assist functions powered by our proprietary
compact hydrogen power generation system, the “Hydrogen Power System,” and other initiatives.
For the year ended March 31, 2026, revenue increased by 82.8 billion yen or 4.2%, year over year, to
2,037.0 billion yen due to an increased production in North, Central, and South America and the launch of
new products in Japan. Operating profit increased by 11.5 billion yen or 27.2%, year over year, to 53.9
billion yen due to the impact of impairment losses recorded in the previous fiscal year, the effects of new
products, and global cost reduction, despite the recording of quality-related expenses. Profit before income
taxes increased by 14.8 billion yen or 31.5%, year over year, to 61.9 billion yen. Profit attributable to
owners of the parent increased by 6.5 billion yen or 39.2%, year over year, to 23.2 billion yen.
For the year ended March 31, 2026, assets increased by 87.5 billion yen to 1,182.3 billion yen due to
increases in cash and cash equivalents and property, plant and equipment. Liabilities increased by 48.5
billion yen to 653.3 billion yen. The main factor was an increase in provisions. Equity increased by 39.0
billion yen to 529.0 billion yen. The main factor was an increase in exchange differences on translation of
foreign operations.
Segment results are as follows.
Japan
Revenue in Japan increased by 28.7 billion yen or 3.1%, year over year, to 968.0 billion yen due to the
launch of new products. Operating profit decreased by 5.0 billion yen or 49.8%, year over year, to 5.1
billion yen due to the recording of quality-related expenses, despite the impact of the previous year’s
impairment losses, new production accompanying the model change, and cost reduction.
North, Central and South America
Revenue in North, Central and South America increased by 53.2 billion yen or 10.9%, year over year, to
542.3 billion yen due to an increase in production volume and changes in model mix. Operating loss was
9.8 billion yen (26.0 billion yen Operating loss in the same period of the previous fiscal year) due to the
impact of tariffs and the recording of quality-related expenses, despite the impact of the previous year’s
impairment losses and cost reduction.
China
Revenue in China decreased by 17.4 billion yen or 7.5%, year over year, to 216.0 billion yen due to a
decrease in production volume. Operating profit decreased by 1.8 billion yen or 10.9%, year over year, to
14.7 billion yen due to the decreased production volume and changes in model mix, despite cost reduction.
Asia
Revenue in Asia increased by 16.0 billion yen or 5.6%, year over year, to 302.2 billion yen due to an
increase in production volume and the impact of foreign exchange rates. Operating profit increased by 3.8
billion yen or 10.6%, year over year, to 40.0 billion yen due to cost reduction and the impact of foreign
exchange rates, despite an increase in miscellaneous expenses.
Europe and Africa
Revenue in Europe and Africa increased by 5.8 billion yen or 5.0%, year over year, to 124.0 billion yen
due to the impact of foreign exchange rates. Operating profit decreased by 1.6 billion yen or 30.6%, year
over year, to 3.7 billion yen due to the impact of market fluctuations despite cost reduction and the impact
of foreign exchange rates.
2)
Explanation of Cash Flow
Cash and cash equivalents as of March 31, 2026 on a consolidated basis increased 28.7 billion yen, 11.5%,
to 278.5 billion yen.
The status of each cash flow and their factors during the current fiscal year are as follows.
Net cash provided by operating activities
Net cash provided by operating activities resulted in an increase in cash by 142.9 billion yen as a result of
operating activities. This was mainly due to an increase in cash provided by income before tax of 61.9
billion yen and depreciation and amortization of 52.9 billion yen.
Net cash used in investing activities
Net cash used in investing activities resulted in a decrease in cash by 75.4 billion yen as a result of
investment activities. This was mainly due to cash outflows of 64.9 billion yen for purchases of property,
plant and equipment.
Net cash used in financing activities
Net cash used in financing activities resulted in a decrease in cash by 48.3 billion yen as a result of
financing activities. This was mainly due to a decrease in cash due to the repayment of lease liabilities of
42.7 billion yen and payment of dividends of 15.3 billion yen.
Production, Orders and Sales
a. Production
The table below shows production performance by segment in the current fiscal year.
Segment name
FY2026
Year-on-year change
(April 1, 2025 - March 31, 2026)
(%)
Japan (millions of yen)
913,528
4.3
North, Central and South America (millions of yen)
510,078
12.3
China (millions of yen)
198,583
(5.3)
Asia (millions of yen)
270,347
5.5
Europe & Africa (millions of yen)
104,877
7.5
1,997,414
5.5
Total
(Notes) 1. Amounts are based on sales prices.
2. Production performance in the North, Central and South America segment increased mainly due to an
increase in production volume.
b. Orders
The group receives production plans for each quarter and the following month from various customers,
mainly Toyota Motor Corporation, and makes production plans and products in consideration of production
capacity.
c. Sales
The table below shows sales performance by segment in the current fiscal year.
FY2026
Year-on-year change
(April 1, 2025 - March 31, 2026)
(%)
Segment name
Japan (millions of yen)
891,184
3.2
North, Central and South America (millions of yen)
537,656
11.1
China (millions of yen)
202,377
(8.9)
Asia (millions of yen)
285,145
5.9
Europe & Africa (millions of yen)
120,698
4.6
2,037,063
4.2
Total
(Notes) 1. Inter-segment transactions are offset and eliminated.
2. Sales performance in the Japan segment increased mainly due to an increase in production volume.
3. Sales performance by major business partners and their ratio of total sales results for the two most recent
fiscal years are as follows.
Business partner
FY2025
(April 1, 2024 - March 31,
2025)
Amount
Ratio
(millions of yen)
(%)
FY2026
(April 1, 2025 - March 31,
2026)
Amount
Ratio
(millions of yen)
(%)
Toyota Motor Corporation
448,758
23.0
478,328
23.5
Toyota Motor North America
207,926
10.6
255,384
12.5
TOYOTA AUTO BODY CO.,
LTD.
220,899
11.3
204,578
10.0
(2) Management’s analysis and discussion of business results
1)
Material Accounting Policies and Significant Accounting Estimates
Material Accounting Policies adopted by the group in its consolidated financial statements are described
in “Notes to Consolidated Financial Statements”, “3. Material Accounting Policies” and, “4. Significant
Accounting Estimates and Judgments.”
Understanding, analysis and discussion of business results for the current fiscal year
As for the group’s operating results for the current fiscal year, consolidated revenue increased by 82.8
billion yen, or 4.2% to 2,037.0 billion yen. Consolidated operating profit increased by 11.5 billion yen or
27.2% year over year to 53.9 billion yen. Consolidated profit before tax increased by 14.8 billion yen or
31.5% year over year to 61.9 billion yen. Profit attributable to owners of the parent increased by 6.5 billion
yen or 39.2% year over year to 23.2 billion yen.
The group is affected by fluctuations in automobile production volume, sales volume, and vehicle models
sold by the automobile manufacturers with whom it does business, among other factors that have a
significant impact on its operating results.
a. Revenue
Revenue increased by 82.8 billion yen or 4.2% year over year to 2,037.0 billion yen, due to increased
production in North, Central and South America and the launch of new products in Japan.
b. Operating profit
Operating profit increased by 11.5 billion yen or 27.2% year over year to 53.9 billion yen, due to the impact
of impairment losses recorded in the previous fiscal year, the effects of new products, and global cost
reduction, despite the recording of quality-related expenses.
c. Profit before income taxes
Profit before income taxes increased by 14.8 billion yen or 31.5% year over year to 61.9 billion yen, mainly
due to the increase in operating profit.
d. Income tax expenses
Income tax expense increased by 9.1 billion yen or 43.0% year over year to 30.4 billion yen. Additionally,
the ratio to profit before tax increased from 45.2% in the previous fiscal year to 49.2%.
e. Profit attributable to owners of the parent
Profit attributable to owners of the parent increased by 6.5 billion yen or 39.2% year over year to 23.2
billion yen, with basic earnings per share amounting to 130.30 yen.
3)
Analysis and discussion of cash flows and information on capital resources and liquidity of funds
a. Cash flows
An analysis of cash flows for the current fiscal year is presented in “(1) Summary of business
results, 2) Cash flows.”
b. Approach to management and finances
The group’s Management Vision is to enhance corporate value over the medium to long term by steadily
and continuously returning the fruits of economic value enhancement to stakeholders and reinvesting for
future growth. Therefore, we will strengthen our management foundation and competitiveness, while
offering multi-dimensional value to customers and society and expanding our business domain.
c. Funding policy and methods
The group raises funds to continue its business activities, maintain adequate liquidity, stabilize its financial
structure, and invest in growth. Funding methods are determined based on a comprehensive assessment of
the market environment for both direct and indirect financing, as well as diversification of funding methods
and economic rationality.
Long-term capital needs, such as capital expenditures and R&D expenses, are met by long-term
borrowings from financial institutions and the issuance of bonds. In doing so, we level the amount of
repayments and redemptions by fiscal year in order to reduce the repayment burden. Working capital needs
are met through short-term borrowings.
In addition, in order to ensure a stable financing environment within a diversifying financing environment,
the group has obtained credit ratings from rating agencies in Japan. As of the date of submission of this
report, Japan Credit Rating Agency, Ltd. has assigned us a rating of AA (stable). These evaluations of the
group’s financial condition by external institutions are based on the fact that the group maintains a certain
level of cash position, among other factors.
In addition, the Company has established a commitment line of credit to secure funds for urgent capital
needs.
4)
Management policies and strategies, objective indicators for judging the achievement of management
goals
In the Mid-term Business Plan announced in November 2023, we set our management targets for 2030 as
“become a company, as the Interior Space Creator, which realizes comfortable mobility interior spaces and
contributes to solving social issues while expanding our product range and customer base” and set our
financial targets for 2030 as follows: revenue of 2,200 billion yen, operating profit of 150 billion yen, and
an operating profit ratio of 7%.
Financial results for FY2026 show that revenue increased by 82.8 billion yen year over year, to 2,037.0
billion yen, operating profit increased by 11.5 billion yen year over year, to 53.9 billion yen.
To achieve the goals set in the Mid-term Business Plan for 2030, we are steadily advancing activities to
improve profitability, particularly in the United States, and introducing new products with enhanced added
value. We are working to establish a stable revenue structure while efficiently executing strategic
investments in human resources and research and development, with the aim of realizing the 2030 Midterm
Business Plan.
Consolidated Financial Statements
Consolidated Statement of Financial Position
(Millions of yen)
Notes
As of March 31, 2025
As of March 31, 2026
Assets
Current assets
Cash and cash equivalents
7
249,721
278,507
Trade and other receivables
8
290,236
297,783
Inventories
9
87,142
94,018
Other financial assets
30
19,191
29,429
7,882
6,156
14,457
17,492
668,631
723,387
Income taxes receivable
Other current assets
10
Total current assets
Non-current assets
Property, plant and equipment
11
317,221
345,387
Goodwill
12
4,938
4,937
Intangible assets
12
19,548
18,683
Investments accounted for using the equity method
13
14,002
16,430
Other financial assets
30
33,923
39,585
Deferred tax assets
14
32,846
30,578
Other non-current assets
10
3,719
3,394
426,199
458,997
1,094,831
1,182,385
Total non-current assets
Total assets
The accompanying notes are an integral part of these consolidated financial statements.
(Millions of yen)
Notes
As of March 31, 2025
As of March 31, 2026
Liabilities and equity
Liabilities
Current liabilities
Trade and other payables
15
234,869
224,070
Bonds and borrowings
16
20,787
34,335
Other financial liabilities
30
5,149
5,694
14,836
13,653
Income taxes payable
Provisions
18
7,155
29,107
Other current liabilities
19
104,653
121,267
387,452
428,128
Total current liabilities
Non-current liabilities
Bonds and borrowings
16
146,531
155,000
Other financial liabilities
30
7,338
7,181
Retirement benefit liability
20
55,075
52,137
Provisions
18
713
712
Deferred tax liabilities
14
5,000
6,622
Other non-current liabilities
2,652
3,535
Total non-current liabilities
217,311
225,188
604,763
653,317
Total liabilities
Equity
Share capital
21
8,400
8,400
Capital surplus
21
3,245
3,339
Retained earnings
21
397,533
407,113
Treasury shares
21
(21,211)
(21,170)
Other components of equity
59,452
87,574
Total equity attributable to owners of the
parent
447,420
485,256
Non-controlling interests
42,647
43,811
Total equity
490,067
529,068
1,094,831
1,182,385
Total liabilities and equity
Consolidated Statement of Income and Consolidated Statement of Comprehensive Income
Consolidated Statement of Income
(Millions of yen)
Notes
Revenue
Fiscal year ended
March 31, 2025
23
Fiscal year ended
March 31, 2026
1,954,218
2,037,063
Cost of sales
1,745,012
1,829,658
Gross profit
209,206
207,405
Selling, general and administrative
expenses
24
136,469
151,529
Other income
25
7,623
7,538
Other expenses
25
37,960
9,465
42,399
53,948
Operating profit
Finance income
26
7,674
8,451
Finance expenses
26
5,153
2,504
Share of profit (loss) of investments
accounted for using the equity method
13
2,175
2,022
47,096
61,918
21,292
30,454
25,803
31,464
Owners of the parent
16,719
23,271
Non-controlling interests
9,084
8,192
93.65
130.30
Profit before income taxes
Income tax expense
14
Profit for the period
Profit attributable to
Earnings per share attributable to owners
of the parent
27
Basic (Yen)
Diluted (Yen)
93.63
The accompanying notes are an integral part of these consolidated financial statements.
130.27
Consolidated Statement of Comprehensive Income
(Millions of yen)
Notes
Profit for the period
Fiscal year ended
March 31, 2025
Fiscal year ended
March 31, 2026
25,803
31,464
Other comprehensive income
Items that will not be reclassified to profit or
loss
Remeasurements of defined benefit plans
20,28
2,080
1,000
Net change in fair value of equity
instruments measured at fair value
through other comprehensive income
28,30
(2,299)
3,949
Share of other comprehensive income of
investments accounted for using the
equity method
13,28
(115)
50
28
(3,405)
27,414
28,30
0
0
13,28
(120)
793
Total other comprehensive income, net of tax
(3,859)
33,208
Comprehensive income
21,944
64,672
Owners of the parent
12,734
53,071
Non-controlling interests
9,209
11,600
Items that may be reclassified to profit or loss
Exchange differences on translation of
foreign operations
Net change in fair value of debt
instruments measured at fair value
through other comprehensive income
Share of other comprehensive income of
investments accounted for using the
equity method
Comprehensive income attributable to
The accompanying notes are an integral part of these consolidated financial statements.
Consolidated Statement of Changes in Equity
Fiscal year ended March 31, 2025
(Millions of yen)
Equity attributable to owners of the parent
Other components
of equity
Notes
Share capital
Capital surplus
8,400
Balance at April 1, 2024
Retained earnings Treasury shares Remeasurements
of defined benefit
plans
3,095
394,213
(21,515)
-
16,719
Profit for the period
1,969
Other comprehensive income
-
Comprehensive income
16,719
-
Purchase of treasury shares
21
Disposal of treasury shares
(15)
Dividends
21
22
Changes in ownership interest
in subsidiaries
13
179
-
1,969
(0)
304
(15,352)
(14)
Change in scope of consolidation
30
Transfer to retained earnings
1,953
-
149
(13,399)
304
(1,969)
8,400
3,245
397,533
(21,211)
-
Total transactions with owners
Balance at March 31, 2025
(1,969)
Equity attributable to owners of the parent
Other components of equity
Net change in fair
Net change in fair
value of debt
Exchange
value of equity
Notes
instruments
differences on
instruments measured
measured at fair
translation of
at fair value through
value through other
foreign
other comprehensive
comprehensive
operations
income
income
(81)
47,714
21
21
22
(7,692)
493,642
25,803
(3,859)
21,944
(0)
288
(23,045)
(2,415)
(2,415)
0
0
(3,539)
(3,539)
13
179
(1,348)
(1,168)
(14)
(1,567)
(1,582)
(10,608)
42,647
(11)
(25,519)
490,067
Profit for the period
Other comprehensive income
Comprehensive income
Purchase of treasury shares
Disposal of treasury shares
Dividends
Changes in ownership interest
In subsidiaries
Change in scope of
consolidation
Transfer to retained earnings
4
(11)
Total transactions with owners
4
-
-
(14,911)
Balance at March 31, 2025
15,359
(81)
44,175
447,420
The accompanying notes are an integral part of these consolidated financial statements.
44,045
9,084
125
9,209
Total
449,597
16,719
(3,985)
12,734
(0)
288
(15,352)
Balance at April 1, 2024
17,770
Non-controlling
interests
Total
30
Fiscal year ended March 31, 2026
(Millions of yen)
Equity attributable to owners of the parent
Other components
of equity
Notes
Share capital
Capital surplus
8,400
Balance at April 1, 2025
Retained earnings Treasury shares Remeasurements of
defined benefit
plans
3,245
397,533
(21,211)
-
23,271
Profit for the period
1,270
Other comprehensive income
-
Comprehensive income
Purchase of treasury shares
21
Disposal of treasury shares
21
Dividends
22
Changes in ownership interest in
subsidiaries
13
23,271
-
1,270
-
(0)
(6)
41
(15,363)
94
Change in scope of consolidation
30
Transfer to retained earnings
1.678
Transfer from retained
earnings to capital surplus
6
(6)
-
94
(13,692)
41
(1,270)
8,400
3,339
407,113
(21,170)
-
Total transactions with owners
Balance at March 31, 2026
(1,270)
Equity attributable to owners of the parent
Other components of equity
Notes
Net change in fair
Net change in fair
value of debt
Exchange
value of equity
instruments
differences on
instruments measured
measured at fair
translation of
at fair value through
value through other
foreign
other comprehensive
comprehensive
operations
income
income
15,359
Balance at April 1, 2025
(81)
Non-controlling
interests
Total
Total
44,175
447,420
42,647
490,067
8,192
3,408
31,464
33,208
11,600
64,672
Other comprehensive income
3,999
0
24,528
23,271
29,800
Comprehensive income
3,999
0
24,528
53,071
Profit for the period
21
21
22
(0)
34
(15,363)
(7,607)
(0)
34
(22,971)
Changes in ownership interest
in subsidiaries
Change in scope of
consolidation
13
94
(2,829)
(2,734)
Transfer to retained earnings
30
Purchase of treasury shares
Disposal of treasury shares
Dividends
(408)
Transfer from retained
earnings to capital surplus
Total transactions with owners
Balance at March 31, 2026
-
-
-
-
-
-
(408)
-
-
(15,235)
(10,436)
(25,671)
18,951
(80)
68,703
485,256
43,811
529,068
Consolidated Statement of Cash Flows
(Millions of yen)
Fiscal year ended
March 31, 2025
Fiscal year ended
March 31, 2026
Profit before income taxes
47,096
61,918
Depreciation and amortization
56,011
52,967
Impairment losses (reversal of impairment losses)
32,331
3,671
Cost of sales from sublease
12,058
27,020
Interest and dividend income
(7,643)
(8,125)
Decrease (increase) in trade receivables
8,504
9,185
Decrease (increase) in inventories
(5,169)
(2,089)
Increase (decrease) in trade payables
4,474
(9,283)
Increase (decrease) in provisions
2,556
22,919
Increase (decrease) in other current liabilities
(2,921)
7,136
Other
(1,372)
(708)
145,927
164,613
Interest received
7,448
7,980
Dividends received
637
828
Interest paid
(1,807)
(2,202)
Income taxes paid
(30,371)
(28,253)
Net cash provided by (used in) operating activities
121,834
142,965
Notes
Cash flows from operating activities
(Subtotal)
The accompanying notes are an integral part of these consolidated financial statements.
(Millions of yen)
Fiscal year ended
March 31, 2025
Fiscal year ended
March 31, 2026
(72,670)
(64,989)
Proceeds from sales of property, plant and equipment
6,170
1,404
Purchase of intangible assets
(4,967)
(4,124)
Payments into time deposits
(21,548)
(39,637)
Proceeds from withdrawal of time deposits
32,675
31,052
Other
(615)
794
(60,955)
(75,499)
Notes
Cash flows from investing activities
Purchase of property, plant and equipment
Net cash provided by (used in) investing activities
Cash flows from financing activities
Proceeds from short-term borrowings
32
86,290
86,324
Repayments of short-term borrowings
32
(75,269)
(74,104)
Proceeds from long-term borrowings
32
1,574
20,000
Repayments of long-term borrowings
32
-
(11,496)
Redemption of bonds
32
(10,000)
-
Dividends paid
22
(15,352)
(15,363)
(7,681)
(7,550)
Dividends paid to non-controlling interests
Repayments of lease liabilities
32
(33,049)
(42,784)
Purchase of shares of subsidiaries not resulting
in change in scope of consolidation
13
(1,168)
(2,763)
(280)
(619)
Net cash provided by (used in) financing activities
(54,377)
(48,358)
Effect of exchange rate changes on cash and cash
equivalents
(1,842)
9,677
Net increase (decrease) in cash and cash equivalents
4,659
28,785
Cash and cash equivalents at beginning of period
244,191
249,721
870
-
249,721
278,507
Other
Increase (decrease) in cash and cash equivalents
included in assets held for sale
Cash and cash equivalents at end of period
7
Notes to Consolidated Financial Statements
- Reporting Entity
Toyota Boshoku Corporation (hereinafter, the “Company”) is a company domiciled in Japan. The addresses of
its registered head office and principal offices are disclosed on the Company’s website (URL https://www.toyotaboshoku.com).
The accompanying consolidated financial statements comprise the Company and its consolidated subsidiaries
(collectively, the “Group”), and the Company’s interests in affiliates. The Group manufactures and sells mainly
seats, interior and exterior components, and unit parts in automotive components in the segments of “Japan”,
“North, Central and South America”, “China”, “Asia” and “Europe and Africa”.
- Basis of Presentation
(1) Compliance with international financial reporting standards (“IFRS”)
As the Company meets the requirements of “Specified Company Applying Designated International Financial
Reporting Standards” pursuant to Article 1-2 of the Ordinance on Consolidated Financial Statements, the
consolidated financial statements of the Company have been prepared in accordance with IFRS as permitted
by the provision of Article 312 of the Ordinance.
The consolidated financial statements have been approved by Hiroyuki Suzuki, Chief Financial Officer, on
July 31 2026.
(2) Basis of measurement
These consolidated financial statements have been prepared on a historical cost basis, except for financial
instruments, the application of hyperinflation accounting in a subsidiary in Argentina, and others measured at
fair value as detailed in “3. Material Accounting Policies” and “35. Hyperinflation adjustment.”
(3) Functional currency and presentation currency
These consolidated financial statements are presented in Japanese yen, which is the Company’s functional
currency, rounded down to the nearest million yen.
(4) Change in Presentation
In the consolidated statements of cash flows for the previous fiscal year, “Interest expense ” and“ Change in
other current assets, ” which were presented as separate lines under “Cash flows from operating activities ”,
are included in“ Other ” from the current fiscal year because their materiality has become immaterial. To reflect
this change in presentation, 1,568 million yen presented in “Interest expense ” and 1,606 million yen presented
in“ Change in other current assets ” of “Cash flows from operating activities ” in the consolidated statements
of cash flows for the previous fiscal year have been reclassified as“ Other ”.
In addition, “Proceeds from sales of investment securities ” which were presented as separate lines under“ Cash
flows from investing activities ” are included in “Other ” from the current fiscal year because their materiality
has become immaterial. To reflect this change in presentation, 112 million yen presented in “Proceeds from
sales of investment securities ” of“ Cash flows from investing activities ” in the consolidated statements of
cash flows for the previous fiscal year has been reclassified as “Other ”.
“Purchase of treasury stock ” which was presented as separate lines under“ Cash flows from financing
activities ” is included in “Other ” from the current fiscal year because its materiality has become immaterial.
In addition, “Purchase of shares of subsidiaries without change in scope of consolidation ” which was included
in“ Other ” is presented as separate lines from the current fiscal year because its materiality has increased. To
reflect this change in presentation, 1 million yen presented in “Purchase of treasury stock ” and 887 million
yen presented in“ Other ” in “Cash flows from financing activities ” in the consolidated statements of cash
flows for the previous fiscal year have been reclassified as“ Purchase of shares of subsidiaries without change
in scope of consolidation ” (1,168 million yen) and “Other ” (280 million yen).
- Material Accounting Policies
(1) Basis of consolidation
- Subsidiaries
Subsidiaries are entities that are controlled by the Group. The Group controls an entity when the Group is
exposed, or has rights, to variable returns from the Group’s involvement with the entity and has the ability
to affect those returns through its power over the entity.
Consolidation of a subsidiary begins from the date the Group obtains control of the subsidiary and ceases
on the date it loses control of the same subsidiary.
Subsidiaries’ financial statements are adjusted if their accounting policies differ from those of the Group.
Intra-group balances, transactions and any unrealized gains or losses resulting from intra-group
transactions are eliminated in preparing the consolidated financial statements.
When the ownership interest in a subsidiary is partially disposed of, the transaction is accounted for as an
equity transaction if the Group retains control of the subsidiary. The carrying amount of the Group’s equity
and non-controlling interests is adjusted to reflect changes in the Group’s interest in its subsidiary. Any
difference between the amount of adjustment to the non-controlling interests and the fair value of the
consideration is recognized directly in equity attributable to owners of the parent.
If the Group loses control of a subsidiary, gain or loss on disposal is calculated as the difference between
the total of the fair value of the consideration received and the fair value of the residual interest and the
carrying amount of the subsidiary’s assets (including goodwill), liabilities and non-controlling interests at
the time control is lost, and is recognized in profit or loss.
- Associates
Associates are entities over which the Group has significant influence in participating in the financial and
operating policy decisions but of which the Group does not control or jointly control of those policies.
Investments in associates are accounted for by the equity method. Under the equity method, investments
in associates are initially recognized at cost, and the Group’s share of the investee’s profit or loss and other
comprehensive income is recognized as the Group’s profit or loss and other comprehensive income and
the carrying amount of the investee is adjusted, from the date on which the Group possesses a significant
influence until the date on which the Group loses the significant influence. Any excess of the initial cost
of acquisition over the net fair value of the identifiable assets and liabilities of the investee is recognized
as goodwill and included in the carrying amount of the investment, and is not amortized.
(2) Business combinations and goodwill
Business combinations are accounted for using the acquisition method. The consideration for acquisition is
measured as the sum of the acquisition-date fair values of the assets transferred in exchange of control of the
acquiree, the liabilities incurred by the Group to former owners of the acquiree, and the equity interests issued
by the Group. The Group chooses on a transaction-by-transaction basis whether non-controlling interests are
measured at fair value or based on the proportionate share of non-controlling interests in the acquiree’s
identifiable net assets.
Any excess of the consideration for acquisition over the fair value of the identifiable assets and liabilities is
recognized as goodwill in the consolidated statement of financial position. If the consideration for acquisition
is lower than the fair value of the identifiable assets and liabilities, the difference is immediately recognized as
profit or loss in the consolidated statement of income. Acquisition-related costs are recognized as expenses
when they are incurred. Goodwill is carried at cost less accumulated impairment losses, without being
amortized but tested for impairment.
The identifiable assets acquired and the liabilities assumed are measured at fair values at the acquisition date,
except that:
• Deferred tax assets and liabilities and liabilities (or assets) related to employee benefit arrangements are
recognized and measured in accordance with IAS 12, “Income Taxes,” and IAS 19, “Employee Benefits,”
respectively;
• Non-current assets or disposal groups that are classified as held for sale in accordance with IFRS 5, “Noncurrent Assets Held for Sale and Discontinued Operations,” are recognized and measured in
accordance with the standard;
• Liabilities or equity instruments related to share-based payment of the acquiree or the replacement of the
acquiree’s share-based payment with share-based payment of the Group are measured in accordance with IFRS
2, “Share-based Payment”; and
• As for leases in which the acquiree is the lessee, the Group deems acquired leases to be new leases at the
acquisition date, and measures lease liabilities at the present value of the remaining lease payments. In addition,
right-of-use assets are measured at an amount equal to the lease liability in principle. For a short-term lease
with a lease term of 12 months or less and a lease with an underlying asset of low value, the Group does not
recognize the right-of-use asset and the lease liability.
The additional acquisition of non-controlling interests after obtaining control is accounted for as an equity
transaction without recognition of goodwill.
If the initial accounting for a business combination has not been completed by the end of the reporting period
in which the business combination occurs, the Group reports provisional amounts for the items for which the
accounting is incomplete. The Group will retrospectively adjust the provisional amounts during the
measurement period (not exceeding one year) or recognize additional assets or liabilities in order to reflect
new information obtained about the facts and circumstances that existed as of the date of acquisition and would
have affected the amounts recognized on the date of acquisition, if known.
(3) Foreign currency translation
- Foreign currency transactions
Foreign currency transactions are converted into the functional currency of each Group company using the
exchange rate at the transaction date.
Monetary assets and liabilities denominated in foreign currencies are converted into the functional
currency using the exchange rate at the end of the reporting period. Non-monetary assets and liabilities
denominated in foreign currencies that are measured at fair value are translated into the functional currency
using the exchange rate at the date of measurement.
Translation differences arising from these translations or settlements of transactions are recognized as
profit or loss. However, if a gain or loss on non-monetary items is recorded in other comprehensive income,
translation differences are also recorded in other comprehensive income.
- Financial statements of foreign operations
Assets and liabilities of foreign operations are translated at the exchange rate at the end of the reporting
period. Income and expenses of foreign operations are translated at the average exchange rates during the
reporting period, except in cases where exchange rates fluctuate significantly or the currency is of a
hyperinflationary economy. Translation differences arising from translation of financial statements of
foreign operations are recognized as other comprehensive income. These differences are included as
exchange differences on translation of foreign operations in other components of equity. If a foreign
operation is disposed of and the Group loses control over the operation, cumulative translation differences
are transferred to profit or loss in the period of the disposal. The financial statements of subsidiaries in
hyperinflationary economies are translated at closing rates and reflected in the consolidated financial
statements.
(4) Reconciliation of hyperinflation
In accordance with IAS 29 "Financial Reporting in Hyperinflationary Economies," our group has included in
the consolidated financial statements the current unit of measure at the end of the reporting period for its
subsidiaries whose functional currency is the Argentine peso.
In the presentation of foreign exchange differences arising from the translation of foreign operations in a
hyperinflationary economy, we have adopted a restated approach and present the effect of translation in other
comprehensive income.
(5) Financial instruments
- Financial assets (excluding derivatives)
(i) Initial recognition and measurement
Financial assets are classified into financial assets based on their nature and holding purposes. The Group
determines the classification at initial recognition. The sale or purchase of financial assets that occurred in
the normal course of business are recognized or derecognized on the transaction date.
(a) Financial assets measured at amortized cost
The Group classifies financial assets as financial assets measured at amortized cost if the following
conditions are met:
• The asset is held within a business model whose objective is to hold assets in order to collect contractual
cash flows; and
• The contractual terms of the financial asset give rise on specified dates to cash flows that are solely
payments of principal and interest on the principal amount outstanding.
At initial recognition, financial assets measured at amortized cost are measured at fair value plus
transaction costs that are directly attributable to the acquisition.
(b) Debt instruments measured at fair value through other comprehensive income
The Group classifies financial assets as debt instruments measured at fair value through other
comprehensive income if the following conditions are met:
• The financial asset is held within a business model whose objective is achieved by both collecting
contractual cash flows and selling financial assets; and
• The contractual terms of the financial asset give rise on specified dates to cash flows that are solely
payments of principal and interest on the principal amount outstanding.
At initial recognition, debt instruments measured at fair value through other comprehensive income are
measured at fair value plus transaction costs that are directly attributable to the acquisition.
(c) Equity instruments measured at fair value through other comprehensive income
Among financial assets to be measured at fair value through profit or loss without being classified as
financial assets measured at amortized cost or debt instruments measured at fair value through other
comprehensive income, as for investments in equity instruments not held for trading, it is permitted to
make an irrevocable election to present in other comprehensive income subsequent changes in the fair
value of such investments, and the Group makes this designation for each financial instrument.
At initial recognition, equity instruments measured at fair value through other comprehensive income are
measured at fair value plus transaction costs that are directly attributable to the acquisition.
(d) Financial assets measured at fair value through profit or loss
The Group classifies financial assets other than the above as financial assets measured at fair value through
profit or loss.
At initial recognition, financial assets measured at fair value through profit or loss are measured at fair
value, and transaction costs that are directly attributable to the acquisition are recognized in profit or loss
when they occur.
(ii) Subsequent measurement
After initial recognition, financial assets are measured based on the following classifications:
(a) Financial assets measured at amortized cost
Carrying amount of financial assets measured at amortized cost are measured using the effective interest
method. The effective interest rate is the rate that exactly discounts estimated future cash receipts through
the expected life of financial assets to the gross carrying amount of the financial assets. Interest income is
recognized in profit or loss, and included in “Finance income” in the consolidated statement of income.
In cases where a financial asset measured at amortized cost is derecognized, the difference between the
carrying amount and the consideration received or receivable is recognized in profit or loss.
(b) Debt instruments measured at fair value through other comprehensive income
After initial recognition, such financial assets are measured at fair value and any subsequent changes in
fair value are recognized in other comprehensive income. When such financial assets are derecognized,
the accumulated amount recognized as other comprehensive income is transferred to profit or loss.
(c) Equity instruments measured at fair value through other comprehensive income
After initial recognition, such financial assets are measured at fair value and any subsequent changes in
fair value are recognized in other comprehensive income. When such financial assets are derecognized,
the accumulated amount recognized as other comprehensive income is transferred to retained earnings, not
to profit or loss. Dividends are recognized as profit or loss.
(d) Financial assets measured at fair value through profit or loss
After initial recognition, such financial assets are measured at fair value and any subsequent changes in
fair value are recognized in profit and loss.
(iii) Impairment of financial assets
Financial assets measured at amortized cost and debt instruments measured at fair value through other
comprehensive income are assessed for impairment based on expected credit losses.
At the end of the reporting period, if credit risk has not increased significantly since initial recognition, the
amount of loss allowance is calculated based on the expected credit losses resulting from default events
that are possible within 12 months after the reporting date (12-month expected credit losses). On the other
hand, at the end of the reporting period, if credit risk has increased significantly since initial recognition,
the amount of loss allowance is calculated based on the expected credit losses resulting from all possible
default events over the life of the financial instrument (lifetime expected credit losses).
However, regardless of the above, lifetime expected credit loss measurement always applies to trade
receivables and lease receivables.
(iv) Derecognition of financial assets
The Group derecognizes a financial asset only when the contractual rights to the cash flows from the asset
expire, or when the Group transfers the contractual right to receive cash flows from financial assets in
transactions in which substantially all the risks and rewards of ownership of the asset are transferred to
another entity. If the Group neither transfers nor holds substantially all the risks and rewards of ownership
of the asset and continues to control the transferred asset, the Group recognizes the retained interest on the
assets and the relevant liabilities that might possibly be paid in association therewith.
2) Financial liabilities (excluding derivatives)
(i) Initial recognition and measurement
The Group classifies financial liabilities as financial liabilities measured at amortized cost. All financial
liabilities are initially measured at fair value after deducting transaction costs that are directly attributable
to the issuance of financial liabilities.
(ii) Subsequent measurement
After initial recognition, financial liabilities are measured at amortized cost using the effective interest
method. The interest cost is included in “Finance expenses” in the consolidated statement of income. Gains
or losses on derecognition are recognized as “Finance income” or “Finance expenses” in the consolidated
statement of income.
(iii) Derecognition of financial liabilities
The Group derecognizes financial liabilities when they are extinguished, that is, when the obligation
specified in the contract is discharged or cancelled or expires.
3) Derivatives
The Group employs derivatives, including currency swaps, interest rate swaps, and foreign exchange
forward contracts to mitigate foreign exchange and interest rate risks. These derivatives are initially
measured at fair value when the contract is entered into, and are subsequently remeasured at fair value at
the end of each reporting period.
4) Offsetting financial assets and liabilities
Financial assets are offset against financial liabilities and the net amounts are presented in the consolidated
statement of financial position when, and only when, the Group currently has a legally enforceable right
to offset the recognized amounts and intends either to settle on a net basis, or to realize assets and settle
liabilities simultaneously.
(6) Cash and cash equivalents
Cash and cash equivalents consist of cash on hand, demand deposits, and short-term investments that are readily
convertible to known amounts of cash and subject to insignificant risk of change in value and due within three
months from the date of acquisition.
(7) Inventories
Inventories are measured at the lower of acquisition cost and net realizable value. The cost of inventories is
determined mainly by using the weighted-average method. The cost of inventories comprises all costs of
purchase, costs of conversion and other costs incurred in bringing them to the present location and condition.
Net realizable value is the estimated selling price in the ordinary course of business less the estimated costs of
completion and the estimated selling cost.
(8) Property, plant and equipment
Property, plant and equipment are measured using the cost model and stated at cost less accumulated
depreciation and accumulated impairment losses. The cost of property, plant and equipment includes cost
directly incidental to the acquisition of assets, the costs of dismantling and removing the assets and restoration
costs, as well as borrowing costs to be capitalized. Except for assets that are not subject to depreciation such as
land and construction in progress, property, plant, and equipment is mainly depreciated using the straight-line
method over the respective estimated useful lives.
The estimated useful lives of major asset items are as follows:
• Buildings and structures
3 to 50 years
• Machinery and equipment and vehicles 2 to 10 years
• Tools, furniture and fixtures
2 to 20 years
The estimated useful lives, residual values and depreciation methods of assets are reviewed at the end of each
fiscal year, and any changes are applied prospectively as a change in an accounting estimate.
Property, plant and equipment is derecognized on disposal or when no future economic benefits are expected
from its use or disposal. Any gain or loss arising from derecognition is included in profit or loss when it is
derecognized.
(9) Intangible assets
Intangible assets are measured using the cost model and stated at cost less accumulated amortization and
accumulated impairment losses.
- Intangible assets acquired separately
Intangible assets acquired separately are measured at acquisition cost at initial recognition and are carried
at cost less accumulated amortization and accumulated impairment losses.
Intangible assets acquired separately with indefinite useful lives are carried at cost less accumulated
impairment losses, without being amortized but tested for impairment, in the same way as goodwill.
- Internally generated intangible assets
Expenditure on research is recognized as an expense in the consolidated statement of income in the fiscal
year in which it is incurred. An intangible asset arising from development (or from the development phase
of an internal project) is recognized if, and only if, the Group can demonstrate all of the following:
(i) the technical feasibility of completing the intangible asset so that it will be available for use or sale
(ii) its intention to complete the intangible asset and use or sell it
(iii) its ability to use or sell the intangible asset
(iv) how the intangible asset will generate probable future economic benefits
(v) the availability of adequate technical, financial and other resources to complete development and to use or
sell the intangible asset
(vi) its ability to measure reliably the expenditure attributable to the intangible asset during its development
The amount initially recognized of an internally generated intangible asset is the sum of expenditure
incurred from the date when the intangible asset first meets the recognition criteria above.
After initial recognition, internally generated intangible assets are carried at cost less accumulated
amortization and accumulated impairment losses.
- Intangible assets acquired in a business combination
Intangible assets acquired in a business combination are measured at fair value at the acquisition date.
After initial recognition, intangible assets acquired in a business combination are carried at cost less
accumulated amortization and accumulated impairment losses.
4) Amortization of intangible assets
Intangible assets with finite useful lives are amortized on a straight-line basis over their estimated useful
lives.
The estimated useful lives of major intangible assets are as follows:
• Software 5 years
• Development cost 5 years
• Customer-related intangible assets
5 years
The estimated useful lives, residual values and amortization methods of assets are reviewed at the end of
each fiscal year, and any changes are applied prospectively as a change in an accounting estimate.
5) Derecognition of intangible assets
Intangible assets are derecognized on disposal or when no future economic benefits are expected from its
use or disposal. Any gain or loss arising from derecognition is included in profit or loss when it is
derecognized.
(10) Leases
The Group assesses whether a contract is, or contains, a lease at inception of a contract. If a contract conveys
the right to control the use of an identified asset for a period of time in exchange for consideration, the contract
is, or contains, a lease.
- Leases as lessee
If the Group determines that a contract is, or contains, a lease, it recognizes right-of-use assets and lease
liabilities at the commencement date of the lease. Lease liabilities are measured at the present value of the
lease payments that are not paid at that date, and right-of-use assets are measured at cost that comprises
the initial measurement amount of lease liability, any lease payments made at or before the commencement
date, any initial direct costs incurred by the lessee and an estimate of costs to be incurred by the lessee in
restoring the underlying asset to the condition required by the terms and conditions of the lease and others.
To many of lease contracts on land and buildings entered into by the Group, an extension option exercisable
by the Group as the lessee is included for a variety of purposes such as ensuring flexibility in business.
The Group assesses whether it is reasonably certain to exercise an extension option. When the Group
determines that it is reasonably certain, the extension option period is included in the lease term.
After initial recognition, right-of-use assets are depreciated using the straight-line method over their useful
lives or lease terms, whichever is shorter.
However, for a short-term lease with a lease term of 12 months or less and a lease with an underlying asset
of low value, the Group recognizes the lease payments as expenses over the lease terms either on a straightline basis or other systematic basis, instead of recognizing the right-of-use asset and the lease liability.
Right-of-use assets are included in “Property, plant and equipment” or “Intangible assets” in the
consolidated statement of financial position, and stated at cost less accumulated depreciation and
amortization and accumulated impairment losses. Lease liabilities are included in “Trade and other
payables” and “Other financial liabilities” in the consolidated statement of financial position.
- Leases as lessor
The Group classifies its leases as either an operating lease or a finance lease. A lease is classified as a
finance lease if it transfers substantially all the risks and rewards incidental to ownership of an underlying
asset, and classified as an operating lease if it does not transfer substantially all the risks and rewards
incidental to ownership of an underlying asset.
For lease receivables related to finance lease transactions, an amount equal to the net investment in the
lease is recognized as receivables. If the Group is a manufacturer lessor in a finance lease, for the portion
deemed as sales of goods, it recognizes revenue and the corresponding cost of sales and selling profit or
loss at the commencement date of the lease.
(11) Borrowing costs
Borrowing costs directly attributable to the acquisition, construction, or production of qualifying assets, which
are assets that necessarily take a substantial period of time to prepare for their intended use or sale, are added
to the cost of those assets, until the assets are substantially ready for their intended use or sale.
All other borrowing costs are recognized in profit or loss in the period in which they are incurred.
(12) Impairment of non-financial assets
The Group reviews non-financial assets of consolidated companies, excluding inventories and deferred tax
assets, at the end of each reporting period to determine whether there is any indication of impairment. If there
is any indication of impairment, impairment testing is conducted by estimating the recoverable amount of the
asset or the cash-generating unit to which the asset belongs. A cash-generating unit is the smallest identifiable
group of assets that generates cash inflows that are largely independent of the cash inflows of other assets or
groups of assets. In addition, for goodwill and intangible assets with indefinite useful lives, and intangible assets
not yet available for use, the Group conducts impairment testing at the same time every year, or if there is any
indication of impairment by estimating the recoverable amount. For goodwill, the cash-generating unit is
determined based on the lowest level for internal management purposes of goodwill, which is equal to or smaller
than an operating segment.
The recoverable amount of an asset or cash-generating unit is the higher of its value in use and its fair value
less costs of disposal. In the calculation of value in use, estimated future cash flows are calculated using the
cash flow model where cash flows are discounted by a discount rate.
Because corporate assets of consolidated companies do not generate independent cash inflows, if there is an
indication that a corporate asset may be impaired, impairment testing is conducted based on the recoverable
amount for the cash-generating unit to which the corporate asset belongs.
Impairment loss is recognized in profit or loss when the carrying amount of the asset or cash-generating unit
exceeds the recoverable amount. An impairment loss recognized in relation to a cash-generating unit is allocated
to first reduce the carrying amount of goodwill allocated to the cash-generating unit, and then the carrying
amount of other assets within the cash-generating unit is reduced on a pro rata basis.
The Group assesses whether any indication of a potential decrease in impairment loss recognized in prior
periods for an asset other than goodwill exists, such as any changes in assumptions used for the determination
of the recoverable amount. If any such indication exists, the recoverable amount of the asset or cash-generating
unit is estimated. In cases that the recoverable amount exceeds the carrying amount of the asset or cashgenerating unit, impairment losses are reversed up to the lower of the estimated recoverable amount and the
carrying amount less necessary depreciation and amortization costs that would have been determined if no
impairment losses had been recognized in prior periods. An impairment loss recognized for goodwill is not
reversed.
(13) Non-current assets held for sale
An asset or asset group for which the carrying amount is expected to be recovered through a sale transaction
rather than through continuing use is classified as a held-for-sale when the following conditions are met: it is
highly probable that the asset or asset group will be sold within one year, the asset or asset group is available
for immediate sale in its present condition, and the Group management commits to the sale plan. In such cases,
the non-current asset is not depreciated or amortized and is measured at the lower of its carrying amount and
its fair value less costs to sell.
(14) Provisions
Provisions are recognized when there are present legal or constructive obligations as a result of past events, it
is probable that outflows of resources embodying economic benefits will be required to settle the obligations,
and reliable estimates can be made of the amount of obligations. In case the time value of money is material,
provisions are measured at the present value by the estimated future cash flow that is discounted by a pre-tax
rate that reflects the time value of money and the risks specific to the liability. The unwinding of the discount
due to the passage of time is recognized as “Finance expenses” in the consolidated statement of income.
Provision for product warranties is recorded based on the estimated amount of claims expected to occur during
the remaining warranty period, using past performance as a basis. Additionally, for the payments related to the
safely measures including recalls, the Company estimates and records the amount reasonably expected to be
borne by the company, taking into account the number of units affected, repair costs per unit, action rate, and
the degree of responsibility with customers.
(15) Employee benefits
- Post-employment benefits
(i) Defined benefit plans
The Group has the defined benefit corporate pension plan and lump-sum retirement benefit plan.
Retirement benefit assets (liabilities) are calculated for each plan by making adjustments for the asset
ceiling where necessary, considering economic benefits available, to the estimated amount of future
benefits earned by employees over the previous fiscal years and the current fiscal year less fair value of
the plan assets.
Market yields on high grade investment corporate bonds with the similar maturity to that of the Group’s
defined benefit obligations as of the end of the reporting period are used in calculating the discount rate.
Increase/decrease in benefit obligations for employees’ past service at the present value due to revisions to
the pension plan are recognized in profit or loss. The Group recognizes other remeasurements of the net
defined benefit liability in other comprehensive income and then immediately reclassifies them from other
comprehensive income to retained earnings.
(ii) Defined contribution plans
Defined contribution plans are post-employment benefit plans in which the employer pays fixed
contributions into separate entities and will have no legal or constructive obligation to make further
contributions. Contributions under the defined contribution plan are expensed during the period when the
employees’ services are provided.
- Other long-term employee benefits
Other long-term employee benefits are recognized as a liability when the Group has present constructive
obligations to pay as a result of employee service in prior fiscal years and the current fiscal year, and when
reliable estimates of the obligation can be made. The Group’s other long-term employee benefits are
calculated by discounting the estimated future amount of benefits to the present value.
Market yields on high grade investment corporate bonds with the similar maturity to that of the Company’s
obligations as of the end of the reporting period are used in calculating the discount rate.
- Short-term employee benefits
Costs of short-term employee benefits are expensed as the relevant services are provided and are not
discounted.
For bonus accrual and paid absences, when the Group has present legal or constructive obligations to pay
as a result of past employee service, and when reliable estimates of the obligation can be made, the Group
recognizes the estimated amount to be paid based on these plans as a liability.
(16) Share-based payment
The Company has introduced a transfer-restricted share-based payment plan as an equity-settled share-based
payment plan for directors (excluding outside directors).
Consideration for services received is measured at fair value as of the grant date of shares of the Company and
recognized as expenses over the vesting period from the grant date, and the corresponding amount is recognized
as an increase in equity.
(17) Equity
- Common shares
The amount of equity instruments issued by the Company is recognized in “Share capital” and “Capital
surplus,” and direct issuance costs (net of tax) are deducted from “Capital surplus.”
- Treasury shares
When the Company acquires treasury shares, the consideration paid, together with direct transaction costs
and tax effects, is recorded as a deduction from equity. When the Company disposes treasury shares, gains
or losses on disposal, including the exercise of stock options, are recorded in “Capital surplus.”
(18) Revenues
The Group recognizes revenue for the transfer of goods or services, other than revenue from lease contracts
within the scope of IFRS 16 Leases, at an amount that reflects the consideration to which it expects to be entitled
in exchange for those goods or services based on the following steps.
(i) Identify the contract with a customer
(ii) Identify the performance obligations in the contract
(iii) Determine the transaction price
(iv) Allocate the transaction price to the separate performance obligations in the contract
(v) Recognize revenue when (or as) the entity satisfies a performance obligation
The Group mainly engages in manufacture and sale of automotive components. For sales of such products, the
Group recognizes revenue when a customer accepts goods since the customer obtains control of the goods at
that time and the performance obligations are considered to be satisfied, the Group normally recognizes revenue
when a customer accepts goods after inspection. Revenue is measured at the amount of consideration promised
in a contract with the customer.
(19) Government grants
Government grants are measured at fair value and recognized when there is reasonable assurance that the Group
will comply with the conditions attaching to them, and that the grants will be received. Grants related to income
are recorded as revenue in the same fiscal year in which the expenses are incurred. Government grants related
to assets are presented by deducting the grant in arriving at the carrying amount of the asset.
(20) Income taxes
Income taxes consist of current taxes and deferred taxes. The income taxes are recognized in profit or loss,
except for items that are recognized in other comprehensive income or directly in equity and those arising from
business combinations.
Current taxes are recognized at the amount that expected to be paid to or refunded from the taxation authorities.
For the calculation of the tax amount, the Group uses the tax rates and tax laws that have been enacted or
substantively enacted by the end of the period.
Deferred tax assets are recognized for deductible temporary differences and unused tax credits and tax losses
carried forward to the extent that it is probable that taxable profit will be available against which they can be
utilized. Deferred tax liabilities are, in principle, recognized for all taxable temporary differences.
Deferred tax assets and liabilities are not recognized for the following temporary differences:
• Taxable temporary differences arising from the initial recognition of goodwill;
• Temporary differences arising from the initial recognition of assets or liabilities in transactions that are not
business combinations and affect neither accounting profit nor taxable profit or tax loss at the time of the
transaction;
• For taxable temporary differences associated with investments in subsidiaries and associates, in cases where
the timing of reversal can be controlled and it is probable that such temporary differences are not reversed in
a foreseeable future; and
• For deductible temporary differences associated with investments in subsidiaries and associates, in cases
where it is not probable that sufficient taxable profits will be available against which the benefits of the
temporary differences can be utilized, or cases where it is not probable that the temporary differences are
expected to be reversed in the foreseeable future.
Deferred tax assets and liabilities are measured at the tax rates that are expected to apply to the period when the
asset is realized or the liability is settled, based on tax rates and tax laws that have been enacted or substantively
enacted by the end of the reporting period.
Deferred tax assets are reviewed in every period, and their carrying amount is reduced to the extent that it is no
longer probable that sufficient taxable profits will be available to allow the benefit of all or part of that deferred
tax asset to be utilized. Unrecognized deferred tax assets are reassessed in every period and recognized to the
extent that it has become probable that the deferred tax assets can be recovered by future taxable profits.
The Group recognizes the amount of the reasonable estimate for uncertain tax positions related to income tax
as an asset or liability based on the interpretation of tax laws.
Deferred tax assets and liabilities are offset if, and only if the Group has a legally enforceable right to offset
current tax assets against current tax liabilities, and they are related to income taxes levied by the same taxation
authority on the same taxable entity.
Current tax assets and liabilities are offset, if, and only if the entity has a legally enforceable right to offset
current tax assets against current tax liabilities, and intends either to settle on a net basis, or to realize the asset
and settle the liability simultaneously.
(21) Fair value measurements
Certain assets and liabilities are required to be recognized at fair value. The fair values of those assets and
liabilities have been determined using market information such as quoted market prices and valuation
methodologies such as the market approach and cost approach. The following three levels of inputs are used to
measure fair value.
Level 1
The market prices of the same assets or liabilities in active markets (which continuously ensure sufficient
trading frequencies and transaction volumes) that the Group can access to as of the measurement date are used
without adjustments.
Level 2
This level includes the published prices of similar assets or liabilities in active markets; the published prices
of the same assets or liabilities in markets that are not active; inputs other than the observable published prices
of assets and liabilities; and inputs derived principally from or corroborated by observable market data by
correlation or other means.
Level 3
Because data are available only from limited markets, the Group uses unobservable inputs which reflect the
judgment of the Group in the assumptions used by market participants to decide the prices of assets and
liabilities. The Group calculates inputs based on the best available information, including the data of the Group
itself.
(22) Levies
A liability to pay a levy is recognized in the amount to be paid when the Group has a present obligation to pay
the levy.
(23) Earnings per share
Basic earnings per share is calculated by dividing profit or loss attributable to ordinary shareholders of the
parent company by the weighted-average number of common shares outstanding, adjusted by the number of
treasury shares, during the period. Diluted earnings per share are calculated by adjusting the effects of all
dilutive potential common shares.
(24) Dividends
Dividends are recognized as liabilities in the period in which each year-end dividend and interim dividend is
approved by the Board of Directors.
- Significant Accounting Estimates and Judgments
The preparation of the consolidated financial statements in conformity with the IFRS accounting standards
requires management to make judgments, estimates, and assumptions that affect the application of accounting
policies and the reported amounts of assets, liabilities, revenues and expenses. Actual results could differ from
these estimates.
The estimates and underlying assumptions are reviewed on an ongoing basis. The effect of a change in an
accounting estimate is recognized in the period of the change and future periods.
The following items are accounting estimates and judgments that have significant effects on the amounts
recognized in the consolidated financial statements for the current and future periods.
(1) Impairment assessment for property, plant and equipment and intangible assets in the Company’s Unit
Components Business
An indication of impairment has been identified in the Unit Components Business, which is a cash-generating
unit of the Company within the Japan segment, since the operating results have deteriorated in the Unit
Components Business as seen in continuous negative operating results. As a result of considering whether the
recoverable amount of the Unit Components Business is less than the carrying amount, the recoverable amount
exceeded the carrying amount, and therefore no impairment losses were recognized.
Carrying amount of property, plant and equipment and intangible assets in the Company’s Unit Components
Business
Before impairment recognition: 18,040 million yen and 16,828 million yen as of March 31, 2025 and 2026,
respectively.
After impairment recognition: 15,359 million yen as of March 31, 2025
The recoverable amount is measured based on value in use. The value in use is calculated by discounting
estimated future cash flows. The Company forecasts the estimated total amount of future cash flows based on
the Group’s profit plan approved by management. This estimate includes the future sales projections reflecting
external factors such as the business environment and production plans presented by the auto makers and variable
cost projections, assumptions such as a discount rate, and estimates of net cash-flows to be received for the
disposal of land and buildings at the end of the useful lives of assets. The discount rate used to calculate the value
in use was a pre-tax weighted average cost of capital (WACC) of 10.8% (discount rate in the previous fiscal year:
11.1%).
While these assumptions are determined based on the management’s best estimates and judgments, they may be
affected by results of changes in uncertain economic conditions in the future, and could have significant effects
on amounts to be recognized in consolidated financial statements in the next fiscal year if they need to be
reviewed.
(2) Impairment assessment for property, plant and equipment and intangible assets in the North, Central and South
America Segment
In the North, Central and South America segment, the consolidated subsidiaries located in the United States,
Canada and Mexico are treated as a single cash-generating unit (“North and Central America Group”) in the
impairment assessment since management monitors operations for sales, production and other activities, and
makes investment decisions in an integrated manner. An indication of impairment has been identified in the
North and Central America Group, since the operating results have deteriorated in the North and Central America
Group as seen in continuous negative operating results due mainly to the impact of continued high prices of raw
materials and labor costs. As a result of considering whether the recoverable amount of the North and Central
America Group is less than the carrying amount, the recoverable amount fell below the carrying amount, and
therefore the Company recognized impairment losses of 3,481 million yen on property, plant and equipment,
including factories and production facilities, which were included in “Other expenses” in the consolidated
statement of income.
Carrying amount of property, plant and equipment and intangible assets in the North and Central America Group
Before impairment recognition: 73,073 million yen and 53,828 million yen as of March 31, 2025 and 2026,
respectively.
After impairment recognition: 44,731 million yen and 50,347 million yen as of March 31, 2025 and 2026,
respectively.
The recoverable amount is measured based on the fair value less costs of disposal. The fair value less costs of
disposal is estimated using the income approach by discounting estimated future cash flows at an after-tax
discount rate of 12.8% (discount rate in the previous fiscal year: 13.3%), based on the profit plan for the North
and Central America Group approved by management.
The future cash flows used in the income approach factor the assumptions including expected sales growth rates
in the market to which the North and Central America Group belongs and expected profit margin ratio referenced
from similar companies. The projection of the future cash flows involves uncertainty and is highly dependent on
management’s estimates and judgments.
The fair value measurement for the above is classified as Level 3 in the fair value hierarchy.
While these assumptions are determined based on management’s best estimates and judgments, they may be
affected by results of changes in uncertain economic conditions in the future, and could have significant effects
on amounts to be recognized in consolidated financial statements in the next fiscal year if they need to be
reviewed.
(3) Recoverability of deferred tax assets
The Company recognizes deferred tax assets for deductible temporary differences to the extent that it is probable
that they can be used against future taxable profit (The amounts recorded: 30,578 million yen for the fiscal year
ended March 31, 2026). When recognizing deferred tax assets, the Group reasonably estimates the timing and
amount of taxable profit that can be earned in the future and calculates the amount in judgment of the probability
that taxable profit will be available.
The timing and amount of taxable profit being available may be affected by changes in uncertain economic
conditions in the future, and could have significant effects on amounts to be recognized in consolidated financial
statements in the next fiscal year if the actual timing and amount differ from the estimates.
(4) Warranty provision
To provide for expenses arising from claims made within product warranty periods, the Company records
estimated claim expenses for the remaining warranty period based on historical experience. In addition, to
provide for expenses in connection with market actions such as recalls, the Company estimates and records the
amount reasonably expected to be borne by the Company, taking into account factors such as the number of
affected units, repair expenses per unit, expected completion rates, and the allocation of responsibility between
the Company and its customers (The amounts recorded: 29,107 million yen for the fiscal year ended March 31,
2026).
The Company believes that the assumptions used in estimating these expenses are reasonable. However, because
these estimates involve uncertainty, actual expenses may differ from the estimates due to unforeseeable changes
in underlying assumptions or other factors, and could have significant effects on amounts to be recognized in the
consolidated financial statements in the next fiscal year.
5. New Standards Not Yet Adopted
Establishments or amendments of accounting standards and interpretations that have been issued by the approval
date of the consolidated financial statements and which the Group has not adopted are as follows. The Group is
evaluating the impact of the adoption of IFRS 18 on its operations.
Mandatory
effective date Reporting period
Standards and Interpretations
(Fiscal year
beginning on
of adoption by
the Group
Description of establishments and amendments
or after)
IFRS 18
Presentation and
January 1,
Disclosure in Financial
2027
Statements
Improved comparability across income statements,
Fiscal year
increased transparency of management-defined
ending March 31,
performance measures, and more useful grouping of
2028
information in financial statements
- Segment Information
(1) Outline of reportable segments
The reportable segments are the segments of the Group for which discrete financial information is available and
for which operating profit (loss) amounts are evaluated regularly by the Company’s Board of Directors in
deciding resources to be allocated and in assessing performance.
The Group mainly engages in manufacture and sale of automotive components, and local companies
incorporated within each region formulate a comprehensive strategy and operate business activities.
The Company is responsible for Japan; TOYOTA BOSHOKU AMERICA, INC. is in charge of North, Central
and South America, which includes the U.S. and Canada as well as geographically close countries of Mexico,
Brazil and Argentina; TOYOTA BOSHOKU ASIA CO., LTD. covers Asia (mainly Thailand, India, Indonesia,
Malaysia, the Philippines and Vietnam, etc.) with a view to strengthening the community-based structure on both
fronts of optimum production and supply network; and TOYOTA BOSHOKU (CHINA) CO., LTD. is
responsible for China. TOYOTA BOSHOKU EUROPE N.V. is responsible for Europe and Africa (mainly France,
Poland, Slovakia, Turkey, South Africa, etc.), and these regions are managed as one management unit.
The accounting method of segment information is based on “3. Material Accounting Policies”.
Segment profit is based on operating profit in the consolidated statement of income. Finance income, finance
expenses, share of profit of investments accounted for using equity method, and income tax expense are excluded
from segment performance, because these items are not included in segment profit that is reviewed by the
Company’s Board of Directors.
(2) Revenue, profits or losses, and other material items for each reportable segment
FY2025 (From April 1, 2024 to March 31, 2025)
(Millions of yen)
Reportable segment
Eliminations Consolidated
(Notes 1, 2)
(Note 4)
Japan
North,
Central
and South
America
China
Asia
Europe
and Africa
Total
863,370
483,972
222,065
269,372
115,438
1,954,218
–
1,954,218
75,909
5,127
11,475
16,864
2,731
112,108
(112,108)
–
Total
939,280
489,099
233,540
286,236
118,169
2,066,327
(112,108)
1,954,218
Segment profit (loss)
10,170
(26,035)
16,560
36,184
5,465
42,345
54
42,399
Segment assets
680,200
189,639
142,708
174,366
67,196
1,254,110
(159,279)
1,094,831
Revenue
Revenue from external
customers
Inter-segment revenue
(Note 3)
Finance income
7,674
Finance expenses
5,153
Share of profit of
investments accounted
for using equity method
Profit before income
taxes
2,175
47,096
(Notes) 1. 54 million yen in eliminations for segment profit is mainly inter-segment transactions.
2. Eliminations for segment assets include corporate assets of 85,480 million yen and eliminations of
receivables and payables, etc. of (244,759) million yen. Corporate assets are mainly funds not
attributable to reportable segments.
3. Inter-segment revenue is based on transaction prices that are determined through price negotiation,
taking into account market prices and total costs incurred.
4. Segment profit (loss) reconciles to operating profit disclosed in the consolidated financial statements.
Other material items
(Millions of yen)
Reportable segment
Japan
North,
Central
and South
America
China
Asia
Europe
and Africa
Depreciation and
amortization
26,101
11,128
7,539
7,477
3,764
56,011
–
56,011
Impairment losses
3,035
28,342
831
–
–
32,208
–
32,208
–
–
–
–
–
–
–
–
5,285
3,005
1,255
2,581
1,874
14,002
–
14,002
30,316
21,593
7,540
10,839
10,435
80,724
–
80,724
Reversal of
impairment losses
Investments accounted
for using equity
method
Increase in non-current
assets
Eliminations Consolidated
Total
Non-current assets exclude financial assets, deferred tax assets, and retirement benefit asset.
FY2026 (From April 1, 2025 to March 31, 2026)
(Millions of yen)
Reportable segment
North,
Central
and South
America
Japan
China
Europe
and Africa
Asia
Eliminations Consolidated
(Note 1, 2)
(Note 4)
Total
Revenue
Revenue from external
customers
Inter-segment revenue
(Note 3)
Total
Segment profit (loss)
Segment assets
891,184 537,656 202,377 285,145 120,698
2,037,063
–
2,037,063
3,361
115,692
(115,692)
–
968,029 542,327 216,058 302,280 124,059
2,152,756
(115,692)
2,037,063
76,844
5,110
4,671
(9,898)
13,680
17,134
14,755
40,006
3,793
53,766
181
53,948
686,529 215,137 153,680 194,209
82,424
1,331,982
(149,596)
1,182,385
Finance income
8,451
Finance expenses
2,504
Share of profit of
investments accounted
for using equity method
Profit before income
taxes
2,022
61,918
(Notes) 1. 181 million yen in eliminations for segment profit is mainly inter-segment transactions.
2. Eliminations for segment assets include corporate assets of 118,804 million yen and eliminations of
receivables and payables, etc. of (268,400) million yen. Corporate assets are mainly funds not
attributable to reportable segments.
3. Inter-segment revenue is based on transaction prices that are determined through price negotiation,
taking into account market prices and total costs incurred.
4. Segment profit (loss) reconciles to operating profit disclosed in the consolidated financial statements.
Other material items
(Millions of yen)
Reportable segment
Japan
North,
Central
and South
America
China
Asia
Europe
and Africa
Depreciation and
amortization
26,743
6,527
6,714
7,920
5,061
52,967
–
52,967
Impairment losses
–
3,481
–
–
189
3,671
–
3,671
–
–
–
–
–
–
–
–
6,841
3,870
1,023
2,615
2,080
16,430
–
16,430
32,002
12,587
4,311
14,040
9,147
72,089
–
72,089
Reversal of
impairment losses
Investments accounted
for using equity
method
Increase in non-current
assets
Eliminations Consolidated
Total
Non-current assets exclude financial assets, deferred tax assets, and retirement benefit asset.
(3) Information about products and services
FY2025 (From April 1, 2024 to March 31, 2025)
Since revenue from external customers for products and services other than auto parts is insignificant, the
information is omitted.
FY2026 (From April 1, 2025 to March 31, 2026)
Since revenue from external customers for products and services other than auto parts is insignificant, the
information is omitted.
(4) Geographic information
Revenue from external customers
(Millions of yen)
FY2025
(From April 1, 2024
to March 31, 2025)
FY2026
(From April 1, 2025
to March 31, 2026)
Japan
838,885
869,497
U.S.A.
279,393
328,779
China
192,566
198,512
Other
643,373
640,273
1,954,218
2,037,063
Total
(Notes) 1. Countries which have significant impact on the consolidated financial statements are individually
presented.
2. Revenue is provided by location of customer.
Non-current assets
(Millions of yen)
FY2025
(As of March 31, 2025)
FY2026
(As of March 31, 2026)
Japan
176,442
179,426
U.S.A
42,323
42,627
China
38,410
44,263
Other
87,892
105,697
345,068
372,014
Total
(Notes) 1. Countries which have significant impact on the consolidated financial statements are individually
presented.
2. Non-current assets (excluding financial assets, deferred tax assets, and retirement benefit asset) are
provided by location of assets.
(5) Principal customer information
The principal customer is Toyota Motor Corporation and its subsidiaries. Revenue from the principal customer
is recorded in all segments (Japan; North, Central and South America; China; Asia; and Europe and Africa).
(Millions of yen)
FY2025
(From April 1, 2024
to March 31, 2025)
FY2026
(From April 1, 2025
to March 31, 2026)
1,422,366
1,489,792
- Cash and Cash Equivalents
Cash and cash equivalents consist of the following.
(Millions of yen)
FY2025
(As of March 31, 2025)
Cash and deposits
249,721
268,507
–
10,000
249,721
278,507
Negotiable certificate of deposits
Total
FY2026
(As of March 31, 2026)
- Trade and Other Receivables
Trade and other receivables consist of the following.
(Millions of yen)
FY2025
(As of March 31, 2025)
FY2026
(As of March 31, 2026)
Trade notes and accounts receivable
226,945
243,110
Electronically recorded monetary claims - trade
21,745
21,474
Lease receivables
33,061
26,124
Other
10,337
8,713
Allowance for doubtful accounts
(1,854)
(1,638)
290,236
297,783
Total
(Note) The amount net of allowance for doubtful accounts is shown in the consolidated statement of financial
position.
- Inventories
Inventories consist of the following.
(Millions of yen)
FY2025
(As of March 31, 2025)
FY2026
(As of March 31, 2026)
Merchandise and finished goods
10,050
10,441
Work in process
23,234
22,972
Raw materials and supplies
53,856
60,604
87,142
94,018
Total
(Note) The amount of inventory write-downs recorded in cost of sales in the fiscal year ended March 31, 2026 was
682 million yen (682 million yen in the fiscal year ended March 31, 2025).
In the fiscal years ended March 31, 2025 and 2026, there were no significant reversals of write-downs.
10. Other Assets
Other assets consist of the following.
(Millions of yen)
FY2025
(As of March 31, 2025)
FY2026
(As of March 31, 2026)
(Other current assets)
Prepaid expenses
2,937
3,124
Advance payments to suppliers
3,981
5,295
Consumption taxes receivable
3,045
3,679
Other
4,493
5,392
14,457
17,492
Long-term prepaid expenses
1,522
1,549
Other
2,196
1,845
3,719
3,394
Total
(Other non-current assets)
Total
- Property, Plant and Equipment
(1) Movements
Changes in acquisition cost, accumulated depreciation and accumulated impairment losses and the carrying
amounts of property, plant and equipment are as follows.
(Millions of yen)
Acquisition cost
Buildings Machinery
Tools,
and
Construction
and
equipment furniture and in progress
structures
fixtures
and vehicles
Land
Total
As of April 1, 2024
39,223
265,239
475,218
81,258
36,389
897,330
Acquisition
3,295
2,066
5,198
2,044
58,804
71,409
Disposal
(968)
(1,916)
(16,924)
(5,417)
(831)
(26,057)
Exchange differences on
translation of foreign operations
33
(1,685)
(3,617)
(213)
(577)
(6,060)
Hyperinflation adjustment
20
2,240
2,702
238
(537)
4,664
Other
(1)
24,748
19,161
8,551
(53,624)
(1,165)
41,603
290,693
481,739
86,461
39,622
940,120
2,102
2,727
5,782
2,216
51,119
63,948
–
(2,852)
(15,046)
(4,744)
(20)
(22,663)
Exchange differences on
translation of foreign operations
783
11,651
25,222
3,720
1,491
42,869
Hyperinflation adjustment
15
1,287
2,739
176
27
4,246
Other
29
13,204
41,910
6,199
(64,112)
(2,769)
44,534
316,711
542,348
94,030
28,128
1,025,752
As of March 31, 2025
Acquisition
Disposal
As of March 31, 2026
(Note) “Other” includes transfers from “Construction in progress” to each item.
(Millions of yen)
Accumulated depreciation and
accumulated impairment losses
Buildings Machinery
Tools,
and
Construction
and
furniture
and in progress
equipment
structures
fixtures
and vehicles
Land
Total
As of April 1, 2024
690
160,535
353,791
65,636
45
580,699
Depreciation
–
10,410
29,902
7,640
–
47,953
Impairment losses
–
4,143
15,244
879
11,429
31,696
Disposal
–
(1,756)
(15,206)
(5,206)
–
(22,169)
Exchange differences on
translation of foreign operations
–
(670)
(2,885)
(174)
(223)
(3,954)
Hyperinflation adjustment
–
502
1,935
226
–
2,664
Other
–
(436)
(1,073)
591
1
(915)
690
172,728
381,708
69,593
11,253
635,974
Depreciation
–
11,087
25,256
7,605
–
43,948
Impairment losses
–
–
299
6
3,365
3,671
Disposal
–
(2,170)
(14,018)
(4,521)
–
(20,710)
Exchange differences on
translation of foreign operations
–
6,898
20,432
2,897
372
30,600
Hyperinflation adjustment
–
477
1,555
173
–
2,205
Other
–
221
9,198
(296)
(9,813)
(689)
690
189,242
424,433
75,456
5,177
695,001
As of March 31, 2025
As of March 31, 2026
(Note) Depreciation of property, plant and equipment is included in “Cost of sales”, “Selling, general and
administrative expenses” and “Other expenses” in the consolidated statement of income.
“Other” includes transfers from “Construction in progress” to each item.
(Millions of yen)
Carrying amount
Land
Buildings Machinery
Tools,
and
Construction
and
furniture
and in progress
equipment
structures
fixtures
and vehicles
Total
As of April 1, 2024
38,533
104,703
121,426
15,622
36,344
316,630
As of March 31, 2025
40,913
117,964
100,030
16,868
28,368
304,145
As of March 31, 2026
43,843
127,468
117,915
18,573
22,950
330,751
(2) Carrying amount of property, plant and equipment pledged as collateral
Assets pledged as collateral and corresponding liabilities consist of the following.
(Millions of yen)
FY2025
(As of March 31, 2025)
FY2026
(As of March 31, 2026)
Assets pledged as collateral
Buildings and structures
0
0
Land
–
–
0
0
15
15
15
15
Total
Secured liabilities
Long-term guarantee deposits
Total
(3) Breakdown of property, plant and equipment
Property, plant and equipment consist of owned property, plant and equipment and right-of-use assets, and their
carrying amounts are as follows:
(Millions of yen)
Carrying amount
FY2025
(As of March 31, 2025)
FY2026
(As of March 31, 2026)
Property, plant and equipment
[see (1) Movements]
304,145
330,751
Right-of-use assets
13,075
14,636
Balance of property, plant and equipment recognized
in the consolidated statement of financial position
317,221
345,387
(4) Impairment losses
FY2025 (From April 1, 2024 to March 31, 2025)
Significant impairment losses are described in “4. Significant Accounting Estimates and Judgements.”
FY2026 (From April 1, 2025 to March 31, 2026)
Significant impairment losses are described in “4. Significant Accounting Estimates and Judgements.”
- Goodwill and Intangible Assets
(1) Movements
Changes in acquisition cost, accumulated amortization and accumulated impairment losses and the carrying
amounts of intangible assets are as follows:
(Millions of yen)
Software
Development cost
Goodwill
Patents
Customerrelated
intangible
assets
As of April 1, 2024
27,914
1,023
4,916
2,434
4,276
6,198
46,763
Acquisition
4,699
115
–
16
–
136
4,967
–
–
–
–
–
–
–
(4,477)
–
–
–
–
(36)
(4,514)
Exchange differences on
translation of foreign
operations
(89)
–
–
–
–
(159)
(249)
Hyperinflation adjustment
86
–
–
–
–
398
485
Other
97
(1)
22
–
–
(51)
66
28,231
1,137
4,938
2,451
4,276
6,486
47,520
3,753
368
–
2
80
133
4,337
–
–
–
–
–
–
–
(2,645)
–
–
–
–
(89)
(2,735)
Exchange differences on
translation of foreign
operations
544
–
–
–
–
353
897
Hyperinflation adjustment
70
–
–
–
–
293
363
Other
79
(150)
(1)
–
–
189
115
30,031
1,354
4,937
2,453
4,356
7,366
50,500
Acquisition cost
Internally generated
Disposal
As of March 31, 2025
Acquisition
Internally generated
Disposal
As of March 31, 2026
Other
Total
(Millions of yen)
Software
Development cost
Goodwill
Patents
Customerrelated
intangible
assets
15,281
726
–
625
554
5,193
22,380
3,299
70
–
190
855
153
4,569
150
–
–
–
–
233
384
(4,296)
–
–
–
–
(5)
(4,301)
Exchange differences on
translation of foreign
operations
(75)
–
–
–
–
(175)
(250)
Hyperinflation adjustment
83
–
–
–
–
410
494
(119)
–
–
–
–
(16)
(135)
14,324
797
–
815
1,409
5,795
23,141
3,979
61
–
164
903
269
5,378
–
–
–
–
–
–
–
(2,619)
–
–
–
–
(123)
(2,743)
Exchange differences on
translation of foreign
operations
420
–
–
–
–
310
731
Hyperinflation adjustment
69
–
–
–
–
325
395
Other
114
–
–
–
–
(23)
90
16,288
858
–
980
2,312
6,553
26,993
Accumulated amortization and
accumulated impairment losses
As of April 1, 2024
Amortization expenses
Impairment losses
Disposal
Other
As of March 31, 2025
Amortization expenses
Impairment losses
Disposal
As of March 31, 2026
Other
Total
(Note) Amortization expenses of intangible assets is included in “Cost of sales” and “Selling, general and
administrative expenses” in the consolidated statement of income.
(Millions of yen)
Customerrelated
intangible
assets
Software
Development cost
Goodwill
As of April 1, 2024
12,633
297
4,916
1,809
3,722
1,004
24,383
As of March 31, 2025
13,907
339
4,938
1,635
2,866
691
24,379
As of March 31, 2026
13,742
496
4,937
1,473
2,043
812
23,506
Carrying amount
Patents
Other
Total
Research and development expenditures recognized in profit or loss consist of the following. These are included
in “Cost of sales” and “Selling, general and administrative expenses” in the consolidated statement of income.
(Millions of yen)
FY2025
(From April 1, 2024
to March 31, 2025)
Research and development expenditures
recognized in profit or loss
FY2026
(From April 1, 2025
to March 31, 2026)
54,934
61,157
(2) Breakdown of intangible assets
Intangible assets consist of owned intangible assets and right-of-use assets, and their carrying amounts are as
follows.
(Millions of yen)
Carrying amount
FY2025
(As of March 31, 2025)
Intangible assets [see (1) Movements]
Right-of-use assets
Balance of intangible assets recognized in the
consolidated statement of financial position
FY2026
(As of March 31, 2026)
19,440
18,569
107
114
19,548
18,683
(3) Material intangible assets
There were no individually material intangible assets recorded in the consolidated statement of financial
position as of March 31, 2025 and March 31, 2026, respectively.
(4) Impairment losses
FY2025 (From April 1, 2024 to March 31, 2025)
There were no significant impairment losses.
FY2026 (From April 1, 2025 to March 31, 2026)
There were no significant impairment losses.
(5) Impairment test of goodwill
The aggregate carrying amounts of goodwill allocated to each cash-generating unit are as follows.
(Millions of yen)
Geographical area
Cash-generating unit
Japan
The Company
Europe and Africa
TOYOTA BOSHOKU
LEGNICA SP. Z O.O.
FY2025
(As of March 31, 2025)
Total
FY2026
(As of March 31, 2026)
4,747
4,747
190
189
4,938
4,937
For the recoverable value of cash-generating units to which goodwill is allocated, value in use is calculated by
discounting the estimated amount of cash flows, which is based on a business plan covering a maximum of five
years that was prepared by reflecting past experience and external information and has been approved by the
management, to present value using the pre-tax weighted average cost of capital (WACC) of the cash-generating
unit, which is approximately 10.8% (discount rate in the previous fiscal year: 11.1%).
There were no impairment losses on goodwill recognized in the fiscal years ended March 31, 2025 and 2026,
respectively.
The Group concluded that, even if there were reasonably possible changes in key assumptions used in the
impairment assessment, it is unlikely that a material impairment would arise.
- Involvement in Subsidiaries and Associates
Major subsidiaries for the fiscal year ended March 31, 2026 consist of the following.
Company name
Location
Principal business
Percentage of voting
rights of the
Company (%)
TOYOTA BOSHOKU TOHOKU
CORPORATION
Kitakami-shi, Iwate
Auto parts
100.0
COWERK CO., LTD.
Kariya-shi, Aichi
Auto parts
52.0
Kanzaki-shi, Saga
Auto parts
100.0
Takahama-shi, Aichi
Auto parts
66.4
SEAT METAL PARTS CHINA CO., LTD
Zhejiang, China
Auto parts
TB LOGISTICS CORPORATION
Toyota-shi, Aichi
Auto parts
TOYOTA BOSHOKU AMERICA, INC.
Kentucky, U.S.A.
Auto parts
Tennessee, U.S.A.
Auto parts
Tennessee, U.S.A.
Auto parts
TOYOTA BOSHOKU KENTUCKY, LLC
Kentucky, U.S.A.
Auto parts
TOYOTA BOSHOKU ARGENTINA
S.R.L.
Buenos Aires, Argentina
Auto parts
TOYOTA BOSHOKU CANADA, INC.
Ontario, Canada
Auto parts
Mississippi, U.S.A.
Auto parts
Sao Paulo, Brazil
Auto parts
TOYOTA BOSHOKU INDIANA, LLC
Indiana, U.S.A.
Auto parts
TOYOTA BOSHOKU ILLINOIS, LLC
Illinois, U.S.A.
Auto parts
Kentucky, U.S.A.
Auto parts
Shanghai, China
Auto parts
TOYOTA BOSHOKU KYUSHU
CORPORATION
TOYOTA BOSHOKU SEIKO
CORPORATION
TOYOTA BOSHOKU JACKSON
TENNESSEE, LLC
TOYOTA BOSHOKU TENNESSEE,
LLC
TOYOTA BOSHOKU MISSISSIPPI,
LLC
TOYOTA BOSHOKU DO BRASIL
LTDA.
TOYOTA BOSHOKU WESTERN
KENTUCKY, LLC.
TOYOTA BOSHOKU (CHINA) CO.,
LTD.
CHENGDU TOYOTA BOSHOKU
AUTOMOTIVE PARTS CO., LTD.
NINGBO TOYOTA BOSHOKU
AUTOMOTIVE PARTS CO., LTD.
TIANJIN INTEX AUTO PARTS CO.,
LTD.
TIANJIN TOYOTA BOSHOKU
AUTOMOTIVE PARTS CO., LTD.
GUANGZHOU INTEX AUTO PARTS
CO., LTD.
TOYOTA BOSHOKU (GUANGZHOU)
AUTOMOTIVE PARTS CO., LTD.
TOYOTA BOSHOKU FOSHAN CO.,
LTD.
Chengdu, Sichuan
Province, China
Ningbo, Zhejiang
Province, China
Auto parts
Auto parts
Tianjin, China
Auto parts
Tianjin, China
Auto parts
Guangzhou, Guangdong
Province, China
Guangzhou, Guangdong
Province, China
Foshan, Guangdong
Province, China
Auto parts
Auto parts
Auto parts
90.0
(90.0)
100.0
100.0
100.0
(100.0)
100.0
(100.0)
100.0
(100.0)
95.0
(95.0)
100.0
(100.0)
100.0
(100.0)
100.0
(0.1)
100.0
(100.0)
100.0
(100.0)
100.0
(100.0)
100.0
53.0
(53.0)
80.0
(40.0)
75.0
(75.0)
100.0
75.0
(75.0)
100.0
(100.0)
100.0
Company name
TOYOTA BOSHOKU (TIANJIN)
AUTOMOTIVE PARTS CO., LTD.
SHENYANG TOYOTA BOSHOKU
AUTOMOTIVE PARTS CO., LTD.
Location
Principal business
Percentage of voting
rights of the
Company (%)
Tianjin, China
Auto parts
100.0
(100.0)
Shenyang, Liaoning
Province, China
Auto parts
100.0
(100.0)
TOYOTA BOSHOKU ASIA CO., LTD.
Bangkok, Thailand
Auto parts
SHIN SAN SHING CO., LTD.
Hsinchu, Taiwan
Auto parts
PT. TOYOTA BOSHOKU INDONESIA
TOYOTA BOSHOKU PHILIPPINES
CORPORATION
TOYOTA BOSHOKU GATEWAY
(THAILAND) CO., LTD.
TOYOTA BOSHOKU AUTOMOTIVE
INDIA PRIVATE LIMITED
TOYOTA BOSHOKU FILTRATION
SYSTEM (THAILAND) CO., LTD.
TOYOTA BOSHOKU SIAM METAL
CO., LTD.
TOYOTA BOSHOKU HAIPHONG CO.,
LTD.
PT. TOYOTA BOSHOKU DEVICE
INDONESIA
BOSHOKU AUTOMOTIVE
(THAILAND) CO., LTD.
TOYOTA BOSHOKU DEVICE INDIA
PRIVATE LIMITED
TOYOTA BOSHOKU EUROPE N.V.
Jawa Barat, Indonesia
Auto parts
100.0
47.0
[3.8]
81.8
Laguna, the Philippines
Auto parts
95.0
Chachoengsao, Thailand
Auto parts
Karnataka, India
Auto parts
Rayong, Thailand
Auto parts
Chonburi, Thailand
Auto parts
Haiphong, Vietnam
Auto parts
Jawa Barat, Indonesia
Auto parts
Rayong, Thailand
Auto parts
Haryana, India
Auto parts
Zaventem, Belgium
Auto parts
Adapazari, Turkey
Auto parts
TOYOTA BOSHOKU TURKIYE
OTOMOTIV SANAYI VE TICARET
A.S.
TOYOTA BOSHOKU SOUTH AFRICA
(PTY) LTD.
TOYOTA BOSHOKU SOMAIN S.A.S.
TOYOTA BOSHOKU POLAND SP. Z
O.O.
Kwazulu-Natal, South
Africa
Zone Industrielle de la
Renaissance, France
Lower Silesian
Voivodeship, Poland
Auto parts
Auto parts
Auto parts
80.0
(30.0)
95.0
(25.0)
80.0
(80.0)
87.1
(87.1)
100.0
80.0
(80.0)
90.0
(90.0)
100.0
(100.0)
100.0
90.0
(90.0)
85.0
(85.0)
100.0
(100.0)
100.0
(100.0)
other 25 companies
(Notes) 1. The name of business division is shown in the “Principal business” field.
2. In the “Percentage of voting rights of the Company” field, the figures shown in parentheses, included in
the figures directly above, represent the indirect ownership ratio, and the figures shown in square
brackets, not included in the figures directly above, represent the ownership ratio of close persons, etc.
3. The Group only holds less than 50% stake in SHIN SAN SHING CO., LTD., and the percentage of its
voting rights at shareholders’ meetings is also less than 50%. However, because the Company
substantively controls the said company by a contract, this company is deemed as its subsidiary.
There were no subsidiaries or associates of individual significance for which the Company has noncontrolling interests for the fiscal years ended March 31, 2025 and 2026, respectively.
Impacts on capital surplus due to changes in ownership interests in consolidated subsidiaries that do not result
in a loss of control
(Millions of yen)
FY2025
(From April 1, 2024
to March 31, 2025)
FY2026
(From April 1, 2025
to March 31, 2026)
Consideration for acquisition
1,168
2,734
Decrease in non-controlling interests
(1,348)
(2,829)
179
94
Changes in capital surplus
Gains (losses) associated with a loss of control of subsidiaries for the fiscal years ended March 31, 2025 and
2026 were insignificant.
The carrying amounts of interests in individually insignificant associates attributable to the Group, which are
accounted for using the equity method, are as follows.
(Millions of yen)
FY2025
(As of March 31, 2025)
Carrying amount
14,002
FY2026
(As of March 31, 2026)
16,430
The amounts of equity in comprehensive income of individually insignificant associates accounted for using
the equity method consist of the following. These amounts are after adjusting for the Group’s ownership ratio.
(Millions of yen)
FY2025
(From April 1, 2024
to March 31, 2025)
FY2026
(From April 1, 2025
to March 31, 2026)
Amount of equity in profit
2,175
2,022
Amount of equity in other comprehensive income
(236)
843
Total comprehensive income
1,939
2,866
- Income Taxes
(1) Deferred tax assets and deferred tax liabilities
Increase (decrease) in deferred tax assets and deferred tax liabilities consist of the following.
FY2025 (From April 1, 2024 to March 31, 2025)
(Millions of yen)
Recognized
Balance at Recognized
in other
beginning of in profit or
comprehenperiod
loss (Note)
sive income
Balance at
end of period
Other
Deferred tax assets
Accrued expenses
1,231
1,445
–
–
2,677
Accrued paid
absences
4,686
259
–
–
4,946
Accrued bonuses
4,417
169
–
–
4,587
Impairment losses
–
3,004
–
–
3,004
Inventories
–
2,359
–
–
2,359
18,914
264
(1,045)
–
18,133
569
849
–
–
1,419
4,097
(3)
–
–
4,093
–
3
–
–
3
12,994
10,043
–
–
23,037
46,912
18,396
(1,045)
–
64,262
1,049
(844)
–
–
204
19,408
1,154
–
–
20,562
7,756
1
(1,028)
–
6,730
Other
10,182
(1,263)
–
–
8,919
Total deferred tax
liabilities
38,397
(951)
(1,028)
–
36,417
8,515
19,347
(17)
–
27,845
Retirement benefit
liability
Provisions
Net operating loss
carry-forwards for
tax purposes
Tax credits carryforwards
Other
Total deferred tax
assets
Deferred tax
liabilities
Depreciation
Undistributed
profits at
subsidiaries and
associates
Financial assets
measured at fair
value through
other
comprehensive
income
Net amount
(Note) Foreign currency translation differences are included in the amount recognized through profit or loss.
FY2026 (From April 1, 2025 to March 31, 2026)
(Millions of yen)
Balance at Recognized Recognized
in other
beginning of in profit or comprehenperiod
loss (Note)
sive income
Balance at
end of period
Other
Deferred tax assets
Accrued expenses
2,677
506
–
–
3,184
Accrued paid
absences
4,946
284
–
–
5,230
Accrued bonuses
4,587
675
–
–
5,262
Impairment losses
3,004
(54)
–
–
2,950
Inventories
2,359
920
–
–
3,279
Retirement benefit
liability
18,133
1,074
(749)
–
18,459
Provisions
1,419
4,823
–
–
6,242
4,093
7,095
–
–
11,189
3
(3)
–
–
–
23,037
(9,806)
–
–
13,231
64,262
5,516
(749)
–
69,030
204
916
–
–
1,120
20,562
3,916
–
–
24,479
6,730
(189)
2,088
–
8,629
Other
8,919
1,925
–
–
10,844
Total deferred tax
liabilities
36,417
6,568
2,088
–
45,074
27,845
(1,051)
(2,837)
–
23,955
Net operating loss
carry-forwards for
tax purposes
Tax credits carryforwards
Other
Total deferred tax
assets
Deferred tax
liabilities
Depreciation
Undistributed
profits at
subsidiaries and
associates
Financial assets
measured at fair
value through
other
comprehensive
income
Net amount
(Note) Foreign currency translation differences are included in the amount recognized through profit or loss.
Deferred tax assets and deferred tax liabilities on the consolidated statement of financial position consist of the
following.
(Millions of yen)
FY2025
FY2026
(As of March 31, 2025)
(As of March 31, 2026)
Deferred tax assets
32,846
30,578
Deferred tax liabilities
5,000
6,622
Net amount
27,845
23,955
Deductible temporary differences, net operating loss carry-forwards for tax purposes, and tax credits
carryforwards for which no deferred tax asset is recognized are as follows.
(Millions of yen)
FY2025
(As of March 31, 2025)
FY2026
(As of March 31, 2026)
Deductible temporary differences
42,905
41,060
Net operating loss carry-forwards for tax purposes
73,318
90,767
Tax credits carry-forwards
18,454
14,159
134,678
145,987
Total
Expiration of net operating loss carry-forwards for tax purposes for which deferred tax assets are not recognized
is expected as follows.
(Millions of yen)
FY2025
(As of March 31, 2025)
FY2026
(As of March 31, 2026)
First year
1,414
1,388
Second year
1,236
1,770
Third year
1,577
2,427
Fourth year
2,162
3,452
Fifth year and thereafter
66,926
81,728
73,318
90,767
Total
Expiration of tax credits carry-forwards for which deferred tax assets are not recognized is expected as follows.
(Millions of yen)
FY2025
(As of March 31, 2025)
FY2026
(As of March 31, 2026)
First year
1,234
–
Second year
2,479
–
Third year
645
–
Fourth year
–
–
14,094
14,159
18,454
14,159
Fifth year and thereafter
Total
(2) Income tax expenses
Income tax expenses consist of the following.
(Millions of yen)
FY2025
(From April 1, 2024
to March 31, 2025)
FY2026
(From April 1, 2025
to March 31, 2026)
Current tax expenses
30,307
29,575
Deferred tax expenses
(9,014)
878
Total income tax expenses
21,292
30,454
The reconciliation between the applicable tax rate and the average actual tax rate consists of the following.
FY2025
(From April 1, 2024
to March 31, 2025)
FY2026
(From April 1, 2025
to March 31, 2026)
Applicable tax rate
30.9%
30.9%
Difference in income tax rates of subsidiaries
(4.3)%
(6.7)%
Tax credit for R&D expenses
(3.0)%
–%
Undistributed profits at subsidiaries and associates
6.3%
10.9%
1.0%
2.0%
15.3%
7.6%
–%
5.0%
(1.0)%
(0.5)%
45.2%
49.2%
Permanent differences such as entertainment
expenses
Increase or decrease in temporary differences for
which deferred tax assets are not recognized
Adjustment for deductible foreign taxes
Other
Average actual tax rate
(Note) The increase or decrease in temporary differences for which deferred tax assets are not recognized in the
fiscal years ended March 31, 2025 and 2026 include the impact of impairment losses on property, plant and
equipment and intangible assets in the North, Central and South America segment.
The applicable tax rate was calculated as follows based on income, inhabitant and enterprise taxes in Japan.
(%)
FY2025
(As of March 31, 2025)
Applicable tax rate
30.9
FY2026
(As of March 31, 2026)
30.9
(3) Global minimum tax rules
In Japan, where the Company is domiciled, the Income Inclusion Rule (IIR), a component of the global
minimum tax rules, was implemented effective April 1, 2024. Under this rule, if the tax burden in the countries
where the subsidiaries are located falls below the minimum rate of 15%, the Company will be subject to topup taxation.
As there was no material impact on income tax expenses for the current fiscal year, no current tax expenses
attributable to Pillar Two were recognized.
In accordance with IAS 12 “Income Taxes,” the Company has applied a temporary exception under which
deferred tax assets and liabilities related to Pillar Two income taxes are not recognized or disclosed.
- Trade and Other Payables
Trade and other payables consist of the following.
(Millions of yen)
FY2025
(As of March 31, 2025)
Trade notes and accounts payable
FY2026
(As of March 31, 2026)
184,593
183,083
Electronically recorded obligations - trade
9,381
7,644
Lease liabilities
23,095
11,072
Other
17,798
22,269
234,869
224,070
Total
- Bonds and Borrowings
Bonds and borrowings consist of the following.
(Millions of yen)
Average Repayment
FY2026
interest rate
(As of March 31, 2026)
due
(%)
FY2025
(As of March 31, 2025)
Short-term borrowings
10,787
24,335
3.74
–
Current portion of long-term
borrowings
10,000
10,000
0.17
–
Corporate bonds
40,000
40,000
–
–
Long-term borrowings
March
2029 0.77
November
2035
106,531
115,000
167,319
189,335
–
–
Current liabilities
20,787
34,335
–
–
Non-current liabilities
146,531
155,000
–
–
Total
167,319
189,335
–
–
Total
(Note) The average interest rate reflects the weighted-average interest rate against the balance at the end of the
fiscal year ended March 31, 2026.
The repayment due is based on the balance at the end of the fiscal year ended March 31, 2026.
Rates, etc., for corporate bonds are indicated in the detailed schedule of corporate bonds.
Detailed schedule of corporate bonds
(Millions of yen)
Company
name
Name
Issuance
date
Toyota Boshoku
Corporation
5th unsecured
straight bonds
Toyota Boshoku
Corporation
Interest
rate
(%)
Collateral
Maturity
date
0.330
None
September 17,
2027
10,000
0.439
None
December 15,
2027
10,000
10,000
0.578
None
October 19,
2028
10,000
10,000
1.155
None
October 19,
2033
FY2025
(As of March 31, 2025)
FY2026
(As of March 31, 2026)
December 7,
2017
10,000
10,000
6th unsecured
straight bonds
December 15,
2022
10,000
Toyota Boshoku
Corporation
7th unsecured
straight bonds
October 19,
2023
Toyota Boshoku
Corporation
8th unsecured
straight bonds
October 19,
2023
- Leases
(1) Lease transactions as lessee
The Group leases land, buildings and structures, molds and others.
(i) Lease expenses
(Millions of yen)
FY2025
(As of March 31, 2025)
FY2026
(As of March 31, 2026)
Depreciation of right-of-use assets
Land
351
370
1,710
2,124
Machinery and equipment and vehicles
894
1,059
Tools, furniture and fixtures
40
83
Intangible assets
13
7
3,009
3,645
Interest expenses
57
49
Expenses for short-term leases
105
56
Expenses for leases of low-value assets
6
248
Variable lease payments
–
–
Buildings and structures
Total
(ii) Sublease income
(Millions of yen)
FY2025
(As of March 31, 2025)
Sublease income
FY2026
(As of March 31, 2026)
14,589
38,255
Cost of sales for subleases is included in “Cost of sales” in the consolidated statement of income.
(iii) Total cash outflow for leases
(Millions of yen)
FY2025
(As of March 31, 2025)
Total cash outflow for leases
FY2026
(As of March 31, 2026)
33,159
43,091
(iv) Gains or losses arising from sale and leaseback transactions
(Millions of yen)
FY2025
(As of March 31, 2025)
Gains or losses arising from sale and leaseback
transactions
FY2026
(As of March 31, 2026)
–
–
(v) Carrying amount of right-of-use assets
Land
Machinery and
Buildings and
Tools, furniture
structures equipment and and fixtures
vehicles
Intangible
assets
Total
As of April 1, 2024
6,884
4,573
1,553
140
130
13,283
As of March 31, 2025
6,540
4,297
2,104
133
107
13,181
As of March 31, 2026
7,012
5,453
2,043
126
114
14,748
Increase of right-of-use assets for the fiscal years ended March 31, 2025 and 2026 are 14,639 million yen and
30,026 million yen, respectively.
(vi) Lease liabilities
Maturity analysis of lease liabilities is provided in “30. Financial Instruments, (5) Liquidity risk management.”
The balance of lease liabilities is included in “Trade and other payables” and “Other financial liabilities” in
the consolidated statement of financial position. Lease liabilities included in “Trade and other payables” are
lease transactions for molds, and the payment period is mainly two years. For these mold transactions, sublease
contracts are implemented, and the amount of minimum sublease payments receivable under the sublease
contracts is equal to the balance of finance lease receivables in (2) Lease transactions as lessor.
(2) Lease transactions as lessor
Finance lease transactions
The Group leases molds and others.
(i) Lease income
(Millions of yen)
FY2025
(As of March 31, 2025)
Selling profit or loss
FY2026
(As of March 31, 2026)
2,638
6,416
Finance income
–
–
Variable lease payments
–
–
(ii) Finance lease receivables
Maturity analysis of lease receivables based on finance leases consists of the following.
(Millions of yen)
FY2025
(As of March 31, 2025)
FY2026
(As of March 31, 2026)
Within one year
25,374
18,803
 Cover
 Message from the President
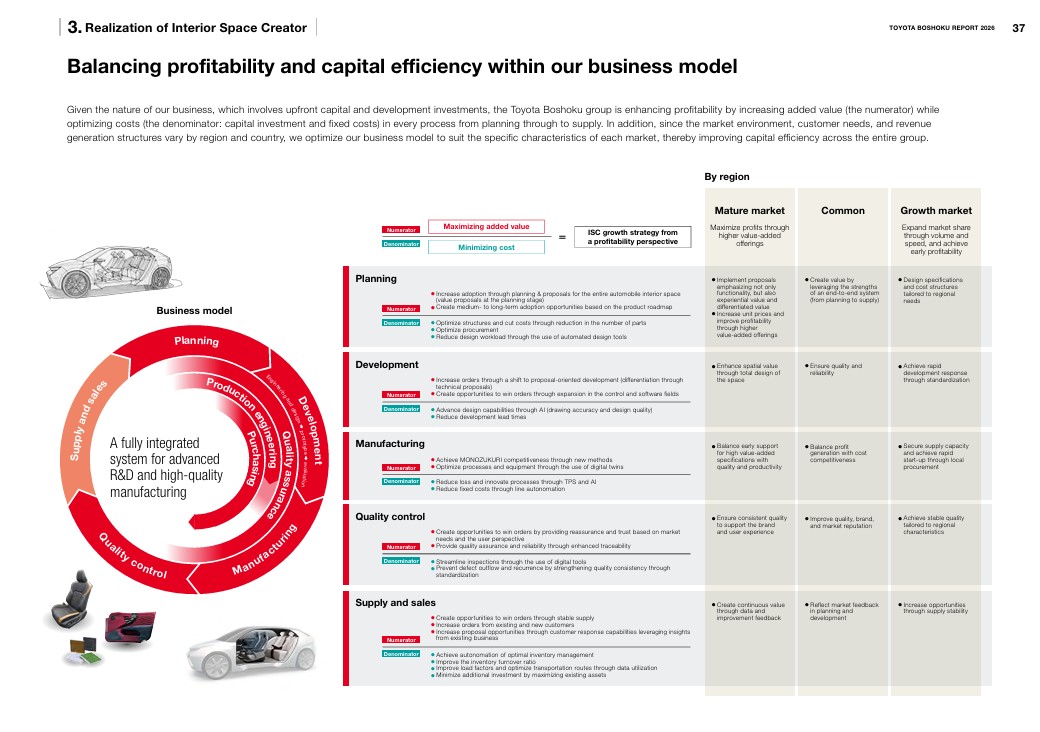 Balancing profitability and capital efficiency within our business model







 スタジアム用シート
 デスクチェア("CROWN SEAT" Desk Chair)


 Concept image of the new plant


