Corporate value TOYOBO REPORT 2026 Introduction Commitment to realizing our vision Economic value Social value Toyoboʼs earning power Management strategy to enhance earning power Value creation story Achieving sustainable growth Business strategy…
Corporate value
TOYOBO REPORT 2026
Introduction
Commitment to
realizing our vision
Economic value
Social value
Toyoboʼs earning power
Management strategy to
enhance earning power
Value creation story
Achieving sustainable growth
Business
strategy
Business development
strategy
Human resource
strategy
Green strategy
Sustainability strategy
Corporate
governance
Data
01
Corporate philosophy framework
Brand slogan
rinciple
ision
Principle
Statement
Jun-Ri-Soku-Yu
Adhering to reason leads to prosperity
alues
Vision
We will continue to create the solutions
needed by people and the earth with
our materials and science.
Values
We welcome change, enjoy change, and
create change.
Sustainable Vision 2030 (Announced in May 2022)
Jun-Ri-Soku-Yu
Innovation
Ideals we seek to realize
Social change and trends
in 2030
adhering to reason leads to prosperity
We aim to be a Group that continually creates materials and science that become solutions for people and the planet
Standardization in handling safety,
human rights, and social justice issues
Increased and diversified needs
concerning access to medical care/
health promotion
Demographic changes, human-centric
innovation, accelerated urbanization
People
Social issues to be solved
through commitment
Employee well-being
and human rights in the
supply chain
People First: employee safety, company
pride, and rewarding work
● Respecting human rights across the
entire supply chain
●
Goals for the future
Where weʼd like to be
by 2030
Planet
A healthy lifestyle
and healthcare
●
●
Contributing to the field of
epidemiology
Contributing to improving
quality of life
Decarbonization, resource circulation,
limited natural resources
Smart communities and
comfortable spaces
Contributing to the realization of a
human-centric digital society
● Creating comfortable spaces
●
Quality water areas,
air, and soil, and
the preservation of
biodiversity
A decarbonized
and circular society
●
●
Contributing to carbon neutrality
Establishing an ecosystem for
circulating resources
●
●
Improving the environment through
solutions
Reducing food loss
Prosperity
Ushering in both a prosperous society where people can live with peace of mind and the enhancement of corporate value
Corporate value
TOYOBO REPORT 2026
Commitment to
realizing our vision
Introduction
Economic value
Social value
Toyoboʼs earning power
Management strategy to
enhance earning power
Value creation story
Achieving sustainable growth
Business
strategy
Business development
strategy
Human resource
strategy
Green strategy
Sustainability strategy
Corporate
governance
02
Data
Net sales
Toyobo Group’s history
¥421.6 billion
Since its founding, Toyobo Group has continually
transformed its business in response to changing times
and societal needs, evolving from natural fibers to
chemical and synthetic fibers, films, and biomedical
fields. Building on this history, the Group contributes
to the realization of a sustainable society while
driving business growth through the creation
of products and solutions that meet societyʼs
expectations.
367.4 billion
Non-textiles
¥
business
¥54.2 billion
Textiles
business
erating rofit
6.6 %
argin
Note: Consolidated net sales and operating
rofit mar in from fi al
on ard
1880
1920
1960
ir t tran or ation
Acquisition and
advance ent o
ol er tec nolog
For more comfortable
clothing
Developed into a manufacturer
of hi h erforman e fi er from
otton and ool to ntheti fi er
1956
1882
ntered the ntheti fi er
u ine
e an ith a r li fi er
followed by the introduction of
ol e ter fi er te hnolo in
Osaka Boseki established. Began the
spinning business as Japan’ fir t
large-scale spinning mill operated by a
private-sector company.
Spinning
and weaving
of natural
fiber
e ical
fiber
1914
1970
Osaka Boseki and
Mie Boseki merged
to establish Toyobo.
Social challenges and market needs
Industrial development in Japan
Developed wastewater treatment
technology that uses yeast to
break down and remove sugars
Postwar reconstruction and
rapid economic growth
2000
2010
econd tran or ation
To a e e ective
use of seawater
rovide mem rane
u ed in ea ater
de alination
tem
1970
Entered the plastics
business, building on
technologies developed
throu h the ntheti fi er
business and polymer
chemistry.
1979
Began commercial sales of
seawater desalination modules
as part of the functional
membranes business. Later
expanded into membranes for
hemodialysis.
ro
1972
Period of stable growth
anu acturing to olution
Core
technologies
To i rove t e digital
environ ent
Business
domains
Value
proposition areas
il
Advanced
aterial
rovide hi hl tran arent film
ith e ellent adhe ion
ro ertie u ed in di la anel
To enhance the safety of
firefig ting o eration
rovide hi h tren th ame retardant fi er
that u ort ever da life a ro a ide ran e
of a li ation in ludin firefi htin ear
To reduce
food loss
el redu e food
a te
rovidin
film that e tend
the helf life of food
ol
er
2020
Developed and launched
aC
dete tion it
capable of extraction,
detection, and measurement
in a little a
minute
Develops and provides systems that
effi ientl ad or and de or volatile
organic compounds (VOCs), enabling
the recovered VOCs to be reused
Entered the diagnostic
pharmaceuticals and materials
business, building on yeast research
conducted as part of the pulp
business. Later expanded into the
diagnostic pharmaceuticals market.
2020
T ird tran or ation
To ensure cleaner air
ntered the film u ine
Subsequently established a
strong position as a
comprehensive manufacturer
of a a in film
To prevent
environmental pollution
1990
Tec nological advance ent
and bu ine diver ification
Synthetic
fiber
1963
Yeast and
cell culture
1980
To support healthcare
Provides membranes for
artifi ial idne u ed in
dialysis treatment
Advancing digitalization and
globalization
2020
Signed the United Nations
Global Compact (UNGC),
a global framework for
achieving sustainable
growth.
Life
Science
Healthcare
nviron ental and
Functional Materials
Biotechnology
Growing environmental awareness and
advances in digital technology
Fibers and
Textiles
nviron ent
and
energy
Corporate value
TOYOBO REPORT 2026
Introduction
Commitment to
realizing our vision
Economic value
Toyoboʼs earning power
Management strategy to
enhance earning power
Toyobo Group businesses
Fibers and Textiles
¥80.5 billion
19 %
Human resource
strategy
Green strategy
26%
8%
Life Science
SPACE CLEANTM
COSMOPEELTM, PUREXTM
FAD-GDH
- Image of a ceramic capacitor
Genetic diagnostic
reagents
Enzyme for blood
glucose monitoring
sensors
Environmental and
Functional Materials
F>M
Environmentally friendly Anti-fog film that helps
heat-shrink film
maintain freshness and
quality
Release film with excellent
release properties
With biotechnology and membrane formation as the two core technologies, we contribute to advances
in healthcare and improvements in quality of life by integrating a diverse range of technologies.
Crude antibody
pharmaceuticals solution
Hollow fiber
membrane
Virus
(approximately 20nm)
Antibody Protein
(approximately 10nm)
rtificial idne
ollo fiber
Supporting the diagnosis
of infectious diseases
Delivering outstanding
filtration performance
Virus removal
membranes for
manufacturing antibody
pharmaceuticals
n t e field o electronic
aterial environ ent and obilit
e globall
high-value-added functional materials that help address global challenges.
Resins and
chemicals
rovide
Environment
and fiber
Thermoplastic polyester
elastomer
Note: Beginning in fiscal 2027, the reporting segments have been changed as follows.
Figures are presented based on the revised reporting segments.
Figures for the revised segments have not been audited by the independent auditor.
Changed the name of the previous Functional Textiles and Trading to Fibers and Textiles.
Reclassified some businesses previously included in Functional Textiles and Trading into Others.
03
Data
Separation
membranes and
modules
PELPRENETM
Life Science
¥34.5 billion
Corporate
governance
Packaging
fil
A super retarder film
that eliminates tinting
(rainbow pattern)
42%
Sustainability strategy
everaging our integrated tec nologie anning ol eri ation fil or ation and coating e create
ne value b roviding advanced T aterial and contributing to reduced environ ental i act
Bio-related
products
¥
Environmental
and Functional Materials
¥110.1 billion
Business development
strategy
COSMOSHINE SRFTM
¥175.2
billion
421.6 billion
Achieving sustainable growth
Business
strategy
Industrial
fil
Films
FY2026
consolidated net sales
Value creation story
Films
Real Estate and Others
¥21.3 billion
5%
Social value
Fibers and Textiles
VYLONTM, HARDLENTM
K-FILTERTM VOC
recovery equipment
Resins for paints, coatings,
and adhesives
Efficiently adsorbs and
recovers VOCs from
exhaust gases
Comprising the airbag fabric and textiles businesses, we leverage the technologies cultivated
over an ear a a ig er or ance fiber anu acturer to u ort co ortable living
Industrial
materials/
Medical materials
Airbag fabric
and yarn
Airbag fabric
HOLLOSEPTM BC membrane
Membrane capable of highly
concentrating seawater,
wastewater, and other liquids
to recover valuable resources
Textiles
Medical materials
Safe and reliable functional
materials for use
in the medical field
Premium thobe fabrics
Highest-quality fabrics produced
using advanced spinning technologies
and other proprietary techniques
Corporate value
TOYOBO REPORT 2026
Introduction
Economic value
Toyoboʼs earning power
Commitment to
realizing our vision
Management strategy to
enhance earning power
Social value
Achieving sustainable growth
Business
strategy
Value creation story
Business development
strategy
Human resource
strategy
Green strategy
Sustainability strategy
Corporate
governance
04
Data
Management targets | 2030 Medium-Term Management Plan: Management focused not only on scale but also on efficiency
Financial indicators
erating rofit
T
Sustainability indicators
erating rofit
Operating profit
EBITDA
(¥bn)
80.0
argin
(%)
20.0
76.2
52.5
50.0
29.1
30.0
28.8
20.0
9.0
10.0
9.0
27.9
2.2
2023
2024
2025
2026
(¥bn)
20.0
2031 target
15.0
11.2
5.5
10.0
2.3
0.0
-0.3
1.3
0.0
(FY)
3.8
(%)
10.0
Target
Above
8%
2025
Results
Target
Less than
1.2x
2024
1.22
1.00
2025
2026
2031 target
0.0
(FY)
Results
GHG
(%)
100
20
FY2026
Results
-2.5
(FY)
0
Target
Above
50%
40
2026
2031 target
FY2026
Results
27%
2026 forecast*1
2031 target
52%
FY2031
Target
%
70
or higher
(Scope 1 and 2) (compared with FY2014)
2.0
2025
Zero
GHG emissions reduction
80
0.0
2030
Target
Employee engagement score*2
Priority business ratio (Capital employed ratio)
60
Zero
1.37
FY2026
2023
Target 5.0
Above
6%
1.0
-5.0
2024
1.26
213.3
0.0
-0.7
2023
1.21
261.0
195.3
197.0
ROIC
ROE
19.0
2.5 1.3
189.6
267.9
Priority business ratio
Net profit
1.7
229.4
249.2
50.0
et rofit
5.0
(Times)
2.00
100.0
3.9
2.5
150.0
Major incidents
D/E ratio
6.6
16.7
10.1
200.0
45.0
39.4
40.0
Total shareholders’ equity
(¥bn)
300.0
250.0
60.0
0.0
Interest-bearing debt
Operating profit margin
70.0
10.0
Interest-bearing debt/Total shareholders’ equity/D/E ratio
%
37
reduction
FY2031
Target
46%
or greater
reduction
reening rate o fil
roduct
18 %
60%
FY2031
Target
(FY)
*1 Forecast as of April 2026
*2 TOYOBO CO., LTD., TOYOBO MC Corporation, TOYOBO STC CO., LTD., and
TOYOBO TEXTILE CO., LTD.
Corporate value
TOYOBO REPORT 2026
Introduction
Commitment to
realizing our vision
Economic value
Social value
Toyoboʼs earning power
Management strategy to
enhance earning power
Value creation story
Achieving sustainable growth
Business
strategy
Business development
strategy
Human resource
strategy
Green strategy
Sustainability strategy
Corporate
governance
Data
05
Editorial policy
Toyobo Group s Integrated Report is published to deepen the understanding of shareholders,
investors, and other stakeholders as to the Group s commitment to continuing to create the solutions
needed by people and the earth through materials and science, as well as its medium- to long-term
value creation story. In the 2026 edition, we focus on presenting a coherent road map toward achieving
our management targets by highlighting the three measures set out in the 2030 Medium-Term
Management Plan, representing the second half of Sustainable Vision 2030: Business portfolio reforms,
Laying the groundwork for the future, and Foundation establishment and strengthening.
Editorial and production of this report drew on frameworks such as the International Integrated
Reporting Framework, recommended by the IFRS Foundation, and the Guidance for Collaborative
Value Creation issued by the Ministry of Economy, Trade and Industry. The report was produced
through cross-functional collaboration led by the Sustainability and Corporate Planning Division.
Cautionary statement regarding forward-looking information
This report contains forward-looking statements, including forecasts and targets, that are based on
information available at the time of its preparation. Actual results might differ materially from those
described in this report due to various factors.
Disclosure of information
TOYOBO REPORT 2026
Corporate value enhancement and report content
In this report, content is linked to each page under three categories, Corporate value, Economic value,
and Social value, based on the concept that corporate value is created through the combination of
economic and social value.
Economic value refers to the Group s earning power, or its ability to generate profits through
its businesses, while social value refers to the trust it earns from society and its stakeholders. By
explaining the specific initiatives that support each of these values, we clearly illustrate the Group s
road map for enhancing corporate value over the medium- to long-term.
TOYOBO REPORT
(Integrated Report)
Financial information
Corporate value
Main related
content
Economic value
Corporate value
Economic value
Social value
Report framework
Social value
Value creation story, CEO message, CTO message, Human resource strategy
Medium-term management plan, Business strategy, CFO message
Sustainability strategy, Corporate governance
Unless otherwise stated, this report refers to Toyobo Group.
Financial information is presented on a consolidated basis.
Reporting period
April 2025 March 2026 (Certain information from after April 2026 is also
included where relevant.)
Published
October 2026
In this report, each fiscal year (FY) refers to the period from April 1 of the
preceding year to March 31 of the current year.
Reference guidelines
GRI Standards (Japanese version)
IFRS Foundation s International Integrated Reporting Framework
Task Force on Climate-related Financial Disclosures (TCFD) recommendations
Ministry of the Environment s Environmental Reporting Guidelines 2018
Ministry of Economy, Trade and Industry s Guidance for Collaborative Value Creation 2.0
Sustainability information
Investor Relations section on our website
Sustainability section on our website
Here, we bring together investor relations (IR) materials
such as the Financial Report, the Annual Securities
Report, and business results presentations for the
benefit of shareholders and investors. We also present
an overview of the Group s current financial status
and business performance, stock information, an IR
calendar, and FAQs, among other relevant information.
Here, we present information concerning the
Group s sustainability-related initiatives, along
with relevant data.
Sustainability
ESG Performance Data
Annual Securities Reports
Sustainability Report
Prepared in accordance with the requirements of
Paragraph (1), Article 24, of the Financial Instruments
and Exchange Act, the Annual Securities Report
presents a summary of the Group s current situation,
details of its business areas, the current state of
its facilities, its operational status, and its financial
statements, among other relevant information.
Compiled in November each year, this is a PDF
version of the sustainability-related information
posted on the Group s website.
Fact Book
Corporate Governance Report
The Fact Book presents 11 years of key financial
data for the Group and individual segments, as well
as five years of non-financial data for the Company.
This report presents information about the
Group s approaches and systems, in accordance
with Japan s Corporate Governance Code.
Note: The names marked with TM throughout this report are trademarks registered or pending registration in Japan for the Group.
Corporate value
TOYOBO REPORT 2026
Introduction
Economic value
Social value
Toyoboʼs earning power
Commitment to
realizing our vision
Management strategy to
enhance earning power
Value creation story
Achieving sustainable growth
Business
strategy
Business development
strategy
Human resource
strategy
Green strategy
Sustainability strategy
Corporate
governance
06
Data
Contents
Introduction
Toyobo Group’s history
02
Toyobo Group businesses
03
05
Contents
06
07
CEO message
08
Determination of the leaders driving
One-team management
11
Management strategy to
enhance earning power
Economic value
28
Environmental and Functional Materials
29
Fibers and Textiles
30
Previous medium-term management
plans and ideal state
12
Review of 2025 Medium-Term Management Plan
13
2030 Medium-Term Management Plan
14
Business portfolio reforms
15
CFO message
16
Toyobo Group’s business model
20
Toyobo Group’s strengths
21
Toyobo Group’s value proposition areas
22
Materiality
23
Risks, opportunities, and
materiality in achieving the vision
24
Respect for human rights
46
Safety and disaster prevention
47
Quality
48
Compliance
49
Risk management
50
CEO
33
Management team
53
Directors’ attendance at meetings and skills
54
Corporate governance evolution
55
Independence and diversity of the Board
of Directors
56
Evaluation of Board effectiveness Board
of Directors’ involvement in formulating
the Medium-Term Management Plan
57
Election and dismissal of executive officers
and nomination of director candidates
58
Officer compensation system
59
Dialogue with shareholders and investors
Cross-shareholdings
60
34
Toyobo’s human capital management vision
35
Ideals we seek to realize (1)
Talent for co-creation and transformation
36
Ideals we seek to realize (2)
Agile and resilient organization
37
Ideals we seek to realize (3)
Well-being and fulfillment at work
38
Feature: A more inclusive workplace
inspired by frontline insights
39
Green strategy
Environmental management
40
Creation of environmental value through
our businesses
41
Environmental responsibility
Toyobo Group’s 2030 targets
Disclosure of financial information related
to climate change
(Disclosures based on the TCFD recommendations)
42
Outside Directors cross-talk session
51
31
Intellectual property strategy
Human resource strategy
Social value
19
45
CTO message
Toyobo-Transformation (TX):
Management transformation through
a DX-enabled Value creation revolution
Value creation story
Sustainability management
Corporate governance
Business development strategy
Corporate value
Corporate value
Toyobo’s ideal state
Toyobo’s earning power
Corporate value
Life Science
Achieving sustainable growth
Commitment to realizing our vision
Value creation cycle:
27
04
Editorial policy
Value creation process
Films
Social value
Management targets | 2030 Medium-Term
Management Plan: Management focused not
only on scale but also on efficiency
COVER STORY
Sustainability strategy
26
Social value
01
Economic value
Corporate philosophy framework
Sustainable Vision 2030
Business strategy
Business strategy
TOYOBO REPORT 2026
The cover design illustrates how Toyobo Group s
strengths in polymer and biotechnology come
together to connect its diverse businesses and
generate new innovation through an organic motif
inspired by molecular structures. By combining
visuals that symbolize the environment, people s
lives, and science, it conveys the Group s
commitment to continue to create the solutions
needed by people and the earth with materials and
science, as well as its aspiration to dedicate itself
to life and the planet.
Using this report (PDF)
Category tabs and navigation buttons at the top of every
page make it easy to navigate between pages. Clicking a
link button in the text will take you directly to the relevant
website or page within this report.
Navigation buttons
Data
Key 11-year financial data
61
Key sustainability data
63
Independent practitioner’s limited assurance report
64
Corporate data
65
Go to the
previous page
Return to the last
displayed page
Go to the
next page
Go to the Contents
page
Link buttons
43
Link to the relevant website
Jump
p.00
Link to the relevant page in
this report
Corporate value
TOYOBO REPORT 2026
Introduction
Commitment to
realizing our vision
Economic value
Social value
Toyoboʼs earning power
Management strategy to
enhance earning power
Achieving sustainable growth
Value creation story
Business
strategy
Business development
strategy
Human resource
strategy
Green strategy
Sustainability strategy
Corporate
governance
Data
07
Toyobo’s ideal state
Vision
Continue to create the solutions needed by people and the earth with our materials and science
Priority areas: Advanced materials, Healthcare, Environment and energy
Value creation story
Under the principle of Jun-Ri-Soku-Yu (Adhering to reason leads to prosperity),
e ill continue el ing to olve ocial i ue t roug a cor orate culture defined b our
o e ibilit and
transformation, perseverance, and sincerity, underpinned by our core technologies: Polymer and Biotechnology.
By optimizing a diverse range of materials to achieve target performance through co-creation with customers and
collaboration with partners, we create customer value and sustainable prosperity for people and the planet. In so
doing, we also continue to seek growth and development of our people and the Group.
Toyobo’s value creation story framework
Corporate philosophy framework TOYOBO PVVs
People and organizations
Strengths
Spirit: Challenge, Reliability, Collaboration
● DNA of Flexibility and Transformation
● Perseverance and Sincerity
●
Value proposition
Technologies
Polymer and Biotechnology
● Optimization of a diverse range of
materials to achieve target performance
●
Collaboration with
partners
Advanced materials
Healthcare
Create customer value
Co-creation
Co-creation with
customers
Developing core materials to enable social implementation
Leveraging external
technologies and talent
Solve social issues
Creating sustainable prosperity for people and the planet
Achieve sustainable growth
Sustainable improvement of Corporate value
● Employeesʼ pride, rewarding work, and self-growth
●
Environment and energy
Discussion process leading to the
development of the value creation story
Why does Toyobo Group exist, what are its strengths,
and how will it continue to create value? In conjunction
with the formulation of the 2030 Medium-Term
Management Plan, executive officers engaged in
extensive discussions through off-site workshops and
meetings. Examining the Group’s approach to value
creation and sources of competitive advantage from
seven perspectives, including strengths and resources,
the mechanism for generating earnings, and the value
it provides, they developed the Value creation story as
a structured framework illustrating how the Group will
continue to create value sustainably.
Corporate value
TOYOBO REPORT 2026
Introduction
Commitment to
realizing our vision
Economic value
Toyoboʼs earning power
Management strategy to
enhance earning power
Value creation story
Social value
Achieving sustainable growth
Business
strategy
Business development
strategy
Human resource
strategy
Green strategy
Sustainability strategy
Corporate
governance
Data
08
One-team management to
deliver on commitments and
achieve an ROE above 8%
CEO message
Creating a plan is only the beginning.
What I believe in is working as one team, following through on what needs to be
done, and delivering results.
Achieving our goals is what drives the team.
Realizing our corporate philosophy to enhance corporate value
Ikuo Takeuchi
President & Representative Director
CEO & Co-COO
The Toyobo Group corporate philosophy, Jun-Ri-Soku-Yu (Adhering to reason leads to prosperity),
means that by doing what society needs, we can contribute to greater prosperity in society while
achieving our own growth. As President, my mission is to put this philosophy into practice through our
businesses and, in doing so, enhance our corporate value.
I believe corporate value is created by combining economic and social value. Economic value is our
ability to generate profits through our businesses, while social value is the trust we earn from society
and our stakeholders. No matter how strong a company s earning power might be, it cannot survive if
it loses society s trust. Conversely, even a highly trusted company cannot sustain or grow without the
ability to generate profits. Only by enhancing both our earning power and the trust we have earned
can we achieve sustainable growth in corporate value.
In May 2022, we announced Sustainable Vision 2030, which outlined our road map for enhancing
corporate value through fiscal 2031 by dividing the nine-year period beginning in fiscal 2023 into two
stages. At the time, the Group s credibility as a manufacturer had been shaken by two major factory
fires and a series of quality misconduct incidents. Although our Industrial film business was performing
well, growth across the Group as a whole had stalled.
We therefore positioned the 2025 Medium-Term Management Plan from fiscal 2023 to fiscal 2026 (2025 MTP),
covering the first stage of Sustainable Vision 2030, as four years to remake and prepare the Group for future
growth. During this period, we pursued four key initiatives: thorough safety, disaster prevention, and quality
assurance; reorganization of the business portfolio; preparations for the future; and reestablishment of foundation.
Lessons from the 2025 Medium-Term Management Plan:
The starting point for One-team management
CEO ME SS AGE
Under 2025 MTP, our highest priority was to restore society s trust by thoroughly reinforcing safety,
disaster prevention, and quality assurance. We established a road map through fiscal 2031, clarified
Corporate value
TOYOBO REPORT 2026
Introduction
Commitment to
realizing our vision
Economic value
Toyoboʼs earning power
Management strategy to
enhance earning power
CEO message
the actions required to achieve our goals, strengthened the
systems and frameworks that form the foundation of lasting trust,
and advanced reforms to our organizational culture. As a result,
over the past four years, we have enhanced reliability in the
areas of safety, disaster prevention, and quality assurance.
In terms of reorganization of the business portfolio, we
classified each business into one of four categories based on
two dimensions growth potential and profitability: businesses
focusing expansion, stable earning businesses, new businesses
to be developed, and businesses requiring improvement, and
reallocated management resources accordingly.
This encouraged each business to focus not only on the absolute
amount of profit it generates but also on exceeding its hurdle
rate (cost of capital). As a result, profitability improved in the
businesses requiring improvement Textiles, Pharmaceuticals,
and Airbag fabrics. We also made growth investments in our
businesses focusing expansion: Films and Life Science. In our
stable earning businesses, Environmental and Functional Materials,
we established TOYOBO MC Corporation, a joint venture with
Mitsubishi Corporation, and advanced the development of the
business foundation needed for future growth.
However, in part due to changes in the business environment,
delays in reorganization of the business portfolio meant that we
fell short of our targets, including those for operating profit, return
on equity (ROE), and return on invested capital (ROIC). One of the
main reasons was our slow response to changes in the business
environment. In particular, during the first two years of 2025 MTP,
we were slow to pass on higher raw material and fuel costs to
customers, significantly reducing the profitability of Packaging
film and Nonwoven materials, which had traditionally been stable
sources of earnings. As a result, the proportion of capital employed
by businesses requiring improvement increased. In addition,
although we made aggressive growth investments, delays in
bringing new equipment online and expanding sales prevented us
from realizing the expected returns on those investments.
We must be candid in acknowledging this shortcoming. Looking
back, when the business environment changed and conditions
diverged significantly from our original assumptions, we responded
Value creation story
Social value
Achieving sustainable growth
Business
strategy
Business development
strategy
Human resource
strategy
Green strategy
Sustainability strategy
Corporate
governance
Data
09
CEO M E S S AGE
to those challenges primarily at the business division level rather
than as one unified team across the Company. Our management
team must be more than a gathering of representatives from
individual businesses and functions. We must make decisions from
the perspective of optimizing the Company as a whole and, even
when addressing issues specific to individual businesses, share
information and respond swiftly as one management team. This
experience has reinforced my conviction that such an approach is
essential.
Review of 2025 Medium-Term Management Plan
p.13
Focusing not only on scale but also on efficiency
2030 Medium-Term Management Plan (2030 MTP), announced
in April 2026, marks the second stage of Sustainable Vision 2030.
We are now entering the phase of realizing the benefits of the
growth investments and preparations made under 2025 MTP.
Although the business environment is becoming increasingly
uncertain, particularly in light of the situation in the Middle East,
we will draw on the lessons learned from 2025 MTP, respond
swiftly to unforeseen events and downside risks, and achieve
profit growth through One-team management.
A defining feature of 2030 MTP is that it was formulated with the
capital markets expectation that we achieve an ROE above 8% as its
starting point. In the past, our approach was to build operating profit
and improve ROE as a result. This time, however, we began by asking
what we must do to achieve the level of performance expected by
the capital markets. In other words, we are evolving our management
approach to focus not only on scale but also on efficiency by placing
equal emphasis on asset efficiency and profitability.
Over the four years of 2025 MTP, we completed most of the
capital investments needed to support future growth. Our
priority now is to make up for delays in bringing new equipment
online and realize the benefits of those investments. With
thorough safety and disaster prevention, quality, and compliance
as our basic premise, we will pursue three key initiatives: business
portfolio reforms; laying the groundwork for the future; and
foundation establishment and strengthening, to achieve both
profit growth and a stronger financial position.
Under our business portfolio reforms, we have set a hurdle rate of
a return on assets (ROA) above 8% by business as the threshold
for sustainable operations. Business leaders will continuously
monitor and manage asset efficiency within their respective
businesses. The key is to focus not only on the amount of
operating profit we generate but also on the asset base required
to generate those profits. Specifically, in addition to improving
the operating profit margin, we will increase asset turnover by
reducing working capital. By improving the performance of lowprofit businesses and reallocating management resources to
growth areas, we aim to have businesses representing 95% of
capital employed exceed the hurdle rate by fiscal 2029.
By business segment, Films and Life Science will focus on
fully realizing the benefits of the growth investments made to
date and translating them into sustained earnings expansion.
TOYOBO MC Corporation will likewise move from the
foundation-building stage to the growth stage. In Fibers and
Textiles, we will continue to advance structural reforms and
improve profitability while enhancing asset efficiency.
2030 Medium-Term Management Plan
p.14
Connecting the Company-wide Medium-Term
Management Plan to each division’s plan and policies
2030 MTP is built around the concept of One-team management.
Under this approach, responsibility for key issues does not rest
solely with the department in charge. Instead, progress is monitored
across the Company, and when delays arise, the entire organization
works together to implement recovery measures. To achieve this, we
will further strengthen information sharing within the management
team, ensuring that every executive officer understands the
Company-wide strategy and takes ownership of its key priorities.
Rather than drawing boundaries around individual responsibilities,
each of us must consider what the Group as a whole should do
when business conditions change or circumstances diverge from
our assumptions and speak up. By working together in this way,
we will enhance corporate value across the Group. This is the kind
of management we are committed to achieving.
Corporate value
TOYOBO REPORT 2026
Introduction
Commitment to
realizing our vision
Economic value
Toyoboʼs earning power
Management strategy to
enhance earning power
CEO message
Another initiative that has played a significant role in advancing
One-team management is the Executive Retreat, which we launched
in fiscal 2025. It provides an opportunity for the entire executive
team to share the Company s overall situation and challenges,
exchange perspectives, and discuss Company-wide issues as their
own. Through these discussions, we foster a stronger sense of
unity and shared ownership. In fiscal 2026, the executive officers
were divided into several teams to discuss Toyobo s value creation
process. One conclusion that emerged was that, in addition to our
technological capabilities, one of the Group s greatest strengths
is our sincere and attentive approach to serving our customers.
We have since incorporated that shared understanding into our
value creation story. We also held in-depth discussions among all
executive officers on how to achieve an ROE above 8% under 2030
MTP and reaffirmed that the key lies in business portfolio reforms.
In the past, the process of formulating our medium-term
management plans centered on each division developing its own
plan based on the Company s management policy. I would then
work with the corporate planning function to consolidate those
plans into a draft, which was circulated for comments. However,
this approach did not encourage each executive officer to view
the Company-wide plan as their own. During this Executive
Retreat, we discussed not only the final outputs, such as the
Company-wide earnings plan, but also the thinking and process
behind them. That process of understanding one another s
perspectives proved especially valuable. It also deepened our
shared understanding of what stakeholders, including the capital
markets and our employees, expect of us.
Daily dialogue drives execution
Taking ownership of the corporate goal
The key to enhancing corporate value lies in execution. No matter
how well a plan is conceived, it will not deliver results unless it is
translated into actions on the front lines and carried through to
completion. Execution becomes stronger when every employee
understands and embraces the role their work plays in the Company
as a whole and approaches it with a sense of personal ownership.
Value creation story
Social value
Achieving sustainable growth
Business
strategy
Business development
strategy
Human resource
strategy
Green strategy
Sustainability strategy
Corporate
governance
Data
10
CEO M E S S AGE
One initiative that helps strengthen execution is our 1 on ALL program.
In addition to the conventional 1 on 1 meeting, 1 on ALL asks employees
to declare their goals in front of their colleagues. Based on the Company s
management policy and their division head s policy, not only leaders but
also every team member presents their goals. This creates a stronger
sense of commitment and reinforces each individual s determination
to fulfill their role. At the same time, by gaining a better understanding
of one another s goals and challenges, team members deepen mutual
understanding, offer advice, and build a stronger sense of unity as a team.
I regularly take part in informal dialogue sessions in which the
President or other executives talk directly with small groups of
employees. These ongoing conversations provide opportunities
for mutual learning and can also bring important issues to light that
might otherwise go unnoticed. These conversations not only boost
participants motivation but also provide me with invaluable insights
and renewed energy by showing me how keenly aware our employees
are of the challenges they face in their work and how seriously they
approach them. During a visit to a manufacturing site where new
production facilities were being brought online, I heard employees
say that launching a new facility was difficult and challenging, but also
rewarding and enjoyable, and that after all the hard work, they were
moved to tears when the first shipment of the new product left the
plant. Their words left a lasting impression on me. They reflected the
pride and sense of responsibility of our people on the front lines and
reminded me that they are the true source of the Group s strength.
Confucius once said, Those who know it are not equal to those
who love it, and those who love it are not equal to those who
delight in it. The lesson is that true strength comes not simply
from knowledge or action, but from genuinely enjoying what you
do. Of course, work is not always enjoyable. Even so, there is great
satisfaction in thinking for yourself, embracing challenges, and
experiencing personal growth. I believe that the key to enjoying your
work is to think independently and take positive action.
Execution does not improve overnight. It is built through the
steady accumulation of daily dialogue and follow-up, as leaders
and team members review progress and refine or add actions as
needed. It is this ongoing cycle of communication and follow-up
that strengthens an organization s ability to execute.
Following through on what needs to be done to
achieve an ROE above 8%
Under 2030 MTP, we have clearly established achieving an ROE
above 8% as our target, based on the principle of shifting our
focus from scale to efficiency. We will steadily improve both
profitability and asset efficiency, ensuring that asset efficiency is a
central consideration in every business and investment decision,
both at the management level and on the front lines.
Business portfolio reforms are our highest priority. Under 2025 MTP,
the sharp deterioration in earnings made it difficult to take bold
action. Now that performance has begun to recover, however, we
have entered a stage where we can realistically consider a broader
range of strategic options. Through fiscal 2029, we will focus on fully
realizing the benefits of the investments we have already made.
Looking ahead to fiscal 2031, we will also strengthen our financial
position while ensuring that new growth investments generate
returns. By carrying our business portfolio reforms through to
completion, we will improve asset efficiency and achieve the level of
profitability expected by the capital markets, namely an ROE above
8% in fiscal 2031. Through sustained growth in corporate value, we
also aim to achieve a price-to-book (P/B) ratio above 1.0.
I repeatedly tell all of our executive officers that results are what
matter. To achieve those results, we must identify the right
priorities and see them through together as one team. I am
confident that the direction of the initiatives we are pursuing is
the right one. What remains is to execute them as one team and
deliver results. Through One-team management, we will achieve
an ROE above 8%, enhance both our economic and social value,
and thereby increase the corporate value of Toyobo Group.
Corporate value
TOYOBO REPORT 2026
Introduction
Commitment to
realizing our vision
Economic value
Social value
Toyoboʼs earning power
Management strategy to
enhance earning power
Value creation story
Achieving sustainable growth
Business
strategy
Business development
strategy
Human resource
strategy
Green strategy
Sustainability strategy
Corporate
governance
Data
11
Determination of the
leaders driving One-team
management
Achieving the ROE target above 8% set out
in the 2030 Medium-Term Management Plan
requires everyone̶from management to
frontline employees̶to work toward the same
goals, break down organizational silos, and follow
through on what needs to be done as One-team.
Here, the heads of each division share their
determination to advance One-team management
from their respective perspectives.
5
9
10
3
11
1
12
6
2
7
8
4
ONE TEAM
To pave the way for Toyobo’s future, I will lead
One-team management from the front and
achieve transformation and growth.
I will foster shared understanding, commitment, and
alignment around our vision and unite all employees
behind our goals through One-team management.
As one team, we will go beyond organizational
boundaries to create future value and advance
to our next stage of growth.
Representative Director and Senior Managing Executive Officer (Co-COO)
Controlling Supervisor of Safety and Production Technology Division and
Procurement and Logistics Department
Director and Managing Executive Officer
Head, Life Science Division
Senior Managing Executive Officer
Head, Films Division
Taichi Sakai 2
Kazuhito Ikeda 3
Masanao Kudo 4
I will break down organizational silos,
proactively provide data-driven input across
divisions, and steadily drive Toyobo’s growth.
As the driving force behind One-team management,
I will continue to foster open and candid discussion
while ensuring the execution and delivery of our plans.
Guided by the spirit of All for one, one for
all, I will work toward our shared purpose as
one team.
I will respond flexibly to changes in the business
environment, align the entire Company behind our
long-term vision, and move us forward together.
Managing Executive Officer
Head, Fibers and Textiles Division
Managing Executive Officer
Head, Sustainability and Corporate Planning Division
Managing Executive Officer
Controlling Supervisor of HR, Administration and Legal Division
Managing Executive Officer
Head, Environmental and Functional Materials Division
Tadao Kuroki 5
Norio Iizuka 6
Takehiko Inada 7
Naoki Fujii 8
By harnessing the strengths of every team
member, I will earn our customers’ satisfaction
and trust while enhancing corporate value.
Together with the entire management team, I
will drive TX (Toyobo-Transformation) to realize
a sustainable company.
Through cross-functional collaboration, I will
bring technologies together to create new
value and new businesses as one team.
Through ongoing dialogue with everyone, I will address
today’s challenges and support our frontline teams so
that future generations can thrive on a broader stage.
Executive Officer
Controlling Supervisor of Risk Management Department and
Head, Quality Assurance Division
Executive Officer, CDO and CISO
Controlling Supervisor of Toyobo Transformation and Business
Innovation Division
Executive Officer, CTO
Controlling Supervisor of Research and Business Development
Division
Executive Officer, CFO
Controlling Supervisor of Management and Administration Division
Getting the job done as one team and
delivering results.
President and Representative Director
(CEO and Co-COO)
Ikuo Takeuchi 1
Masakazu Iwasaki 9
Tetsuro Yabuki 10
Toshiyuki Oya 11
Hidekazu Takahashi 12
Corporate value
TOYOBO REPORT 2026
Commitment to
realizing our vision
Introduction
Economic value
Toyoboʼs earning power
Management strategy to
enhance earning power
Value creation story
Social value
Achieving sustainable growth
Business
strategy
Business development
strategy
Human resource
strategy
Green strategy
Medium-Term Management Plan
FY2019‒FY2022
Medium-Term Management Plan
Basic
policies
Focus management resources on growth
area e e ute harve tin trate ie
et and mana e u ine
e ifi
a e roa tive inve tment for future
ro th la in the round or for ro th
eform the or ani ational ulture aeru
Project)
Basic
policies
Build the foundation for sustainable
growth through four measures:
Measure 1 Thorough safety, disaster
prevention, and quality assurance
Measure 2 Reorganization of the business portfolio
Measure 3 Preparations for the future
Measure 4 Reestablishment of foundation
Review
m roved finan ial tru ture
ratio
below 1.0)
ithdra al from un rofita le
u ine e redu tion of over ea te tile
operations)
an ion of main ne
rodu t
COSMOSHINE SRFTM
m lementation of a et effi ien
initiatives and business layer strategies
elerated lo al e an ion
Occurrence of compliance violations
Frequent severe disasters
Review
an ion of the ilm u ine
an ion of the hollo fi er mem rane
u ine for artifi ial idne
Growing demand for PCR diagnostic enzymes for COVID-19
Establishment of a corporate philosophy
frame or
Formulation of Sustainable Vision 2030
Initiation of major renewal of aging facilities
Fires occurred (2018: Tsuruga Research and
Production Center; 2020: Inuyama Plant)
Discovery of quality-related misconduct incidents (2020:
n ineerin la ti
ertifi ation revo ed
Received U.S. Food and Drug Administration (FDA)
Warning Letter for the Pharmaceuticals business
Review
Zero major incidents
Quality responses (Pharmaceuticals Warning Letter
lifted, Engineering plastics ISO 9001 reacquired)
Promotion and implementation of
various sustainability initiatives
Launch of TOYOBO MC Corporation and
establishment of its business foundation
n rea e in fi ed o t and e en e
(defensive and growth measures)
i nifi ant de line in earnin o er
Delays in business portfolio reforms
Thorough implementation and
prioritization by business layer
Issue
Thorough safety, disaster prevention, and
quality assurance, restoration of trust
Issue
alan e finan ial oundne
growth
Targets
Net sales: ¥420.0 billion
eratin rofit
illion
Targets
Net sales: ¥375.0 billion
eratin rofit
illion
Targets
Net sales: ¥450.0 billion
eratin rofit
illion
eratin
rofit
ROE
ROIC
351.3
5.4%
20.6
4.2%
331.1
329.5
6.4%
5.8%
23.1
23.3
4.8%
4.8%
7.5%
23.9
4.9%
339.6
336.7
7.8%
0.0
(¥bn)
6.8%
28.4
5.0%
2017
2018
2019
2021
2022
20.0
16.7
-0.3%
2020
30.0
27.9
1.7%
-0.3%
2016
50.0
5.5%
5.1%
2.3%
2015
Net sales: ¥500.0 billion
eratin rofit
illion
C
fi al
40.0
10.1
100.0
Targets
421.6
22.8
4.5%
4.4%
and rofit
337.4
26.7
21.7
422.0
414.3
399.9
375.7
347.8
Financial targets:
tri e a alan e et een finan ial tru ture
improvement and earnings growth and attain an
ROE above 8% earlier
Basic premise:
Thorough safety and disaster prevention, quality,
and compliance
Three measures:
Measure 1 Business portfolio reforms
Measure 2
a in the round or for the future
Measure 3 Foundation establishment and
strengthening
ar e ale inve tment in ilm ha ea ed
m rove the finan ial tru ture
in rea in free
a h o and im rovin a et effi ien
Shareholder returns:
Continually provide a stable dividend with a target
total return ratio of 30%
Delays in launching large-scale growth investments
m roved the rofita ilit of the three
businesses requiring improvement
e linin rofita ilit in a a in film and
Nonwoven materials
Issue
Net sales
FY2027‒FY2031
Medium-Term Management Plan
Realizing the results of growth
investment and preparation
om an that enerate ta le rofit re ard
ta eholder and earn their tru t and ea e of mind
om an that envi ion the future
hare that vi ion and or to reali e it
om an that a a re on i le
mem er of o iet a ide
o ial
rule and meet o ietal e e tation
400.0
200.0
Change to sustainable growth
Four years to remake and prepare
Basic
policies
500.0
300.0
FY2023‒FY2026
Medium-Term Management Plan
Renewed challenge to achieve ¥30.0 billion
in o erating rofit t roug continuou
portfolio reform
Building a strong Toyobo through
continuous portfolio reform
12
Data
Sustainable Vision 2030
Previous medium-term management plans and ideal state
FY2015‒FY2018
Medium-Term Management Plan
Corporate
governance
Sustainability strategy
2023
9.0
1.3%
1.3%
2024
2.3%
3.8%
10.0
1.0%
2025
2026
2029
(Plan)
2031
(Plan)
0.0
(FY) (¥bn)
Corporate value
TOYOBO REPORT 2026
Commitment to
realizing our vision
Introduction
Economic value
Social value
Toyoboʼs earning power
Management strategy to
enhance earning power
Value creation story
Achieving sustainable growth
Business
strategy
Business development
strategy
Human resource
strategy
Green strategy
Sustainability strategy
Corporate
governance
Data
13
Medium-Term Management Plan
Review of 2025 Medium-Term Management Plan
2025 Medium-Term Management Plan (2025 MTP) (fiscal 2023–fiscal 2026) was positioned as four years to
remake and prepare aimed at achieving the goals of Sustainable Vision 2030. Accordingly, we established
four key initiatives. During the plan period, we strengthened our foundations in areas such as safety,
disaster prevention, and quality assurance while simultaneously executing proactive growth investments.
Over the first two years, we made steady progress on Measures 1, 3, and 4. However, Measure 2,
reorganization of the business portfolio, did not progress as planned due to delays in bringing certain
new equipment online and delays in responding to changes in the business environment, including
the sharp rise in raw material and fuel prices. During the latter half of the plan period, we focused
on implementing value-based pricing, reducing expenses through Company-wide projects, and
normalizing and carrying out structural reforms in the businesses requiring improvement. Although
these efforts helped recover and improve profitability, we fell short of our targets for financial indicators
such as operating profit, ROE, and ROIC. In addition, despite declining operating cash flow, we
continued to prioritize large-scale investments in growth businesses, including Films and Life Science.
As a result, our debt-to-equity (D/E) ratio and net debt/EBITDA ratio deteriorated.
Review of 2025 MTP and Reflecting the findings in the new plan
Review
Reflected in the new medium-term management plan
Foundation strengthened in areas such as safety,
disaster prevention, and quality assurance
Aggressively executed capital investment but delayed
the launch of growth investment
TOYOBO MC Corporation: Launch and development
of infrastructure
Improved profitability of three businesses requiring improvement
Deterioration of financial structure
Reorganization of business portfolio
Realizing the results of growth investment and preparation
TOYOBO MC Corporation: Outcomes of reforms and
growth strategies
Measures for challenged businesses
Improvement of asset efficiency and stringent
management of working capital
One-team management
Progress of four measures
Thorough safety, disaster prevention, and quality assurance
Financial indicators
Measure
1
2025 MTP (FY2023–FY2026)
FY2022
results
FY2023
results
FY2024
results
FY2025
results
FY2026
results
Initial FY2026
plan*5
Net sales (¥bn)
375.7
399.9
414.3
422.0
421.6
450.0
Operating profit (¥bn)
28.4
10.1
9.0
16.7
27.9
35.0
Operating profit margin (%)
7.6
2.5
2.2
3.9
6.6
7.8
1
EBITDA (¥bn)*
48.5
29.1
28.8
39.4
52.5
63.0
Net profit (¥bn)
12.9
-0.7
2.5
2.0
11.2
15.0
ROE (%)*2
6.8
1.3
1.0
5.5
≧7.0
ROIC (%)*
5.1
1.7
1.3
2.3
3.8
≧5.0
D/E ratio (times)
0.98
1.21
1.26
1.37
1.22
<1.20
Net debt/EBITDA ratio*4
3.4
5.8
7.5
6.1
4.4
<5.0
Capital investment (¥bn)
33.6
42.7
61.6
43.2
29.0
Reorganization of the business portfolio
Measure
3
*1 Operating profit + Depreciation (including goodwill) *2 Net profit average Total shareholders equity at the beginning and end of period
*4 (Interest-bearing debt Cash and cash equivalents) (Period-end) EBITDA
*3 NOPAT (Interest-bearing debt + Net assets)
*5 As of May 2022
Zero serious incidents since FY2022
Strengthening safety and disaster prevention systems and progress in acquiring ISO 45001 certification
at each site
Development of a quality assurance structure and mechanism. Regaining of ISO 9001 certification for
Engineering plastics and the lifting of the Warning Letter by the FDA for Pharmaceuticals
2
Businesses focusing expansion: Growth investment was executed as planned, but the launch of new
equipment was delayed in some areas
Stable earning businesses: Established TOYOBO MC Corporation; strengthened the management
base, revised systems and operations, and improved earnings
Businesses requiring improvement: Achieved profitability in Textiles, Airbag fabrics and Pharmaceuticals
narrowed their losses and were on track to return to profitability, and profitability deteriorated in
Packaging film and Nonwoven materials so these were shifted to businesses requiring improvement
Five businesses poised to achieve profitability in FY2026
Preparations for the future
Measure
3
Setting of three areas of innovation creation. Transition of the three priority themes to the
commercialization stage.
Legacy systems update in progress. Company-wide project to reform operations.
Renewal of telecommunications and information security infrastructure.
Acquisition of SBT approval, third-party verification of environmental data, and participation in the GX League.
Reestablishment of foundation
Measure
4
Selection of next-generation personnel and establishment of a training system. Development of
training for onsite leaders and other engineers.
Promotion of diversity and human rights due diligence
Development and renewal of business sites and plant infrastructure
Strengthening the Group governance and risk management structure
Development of compliance structure and training
Instillation of corporate philosophy framework, TOYOBO PVVs
As planned
Delayed
Corporate value
TOYOBO REPORT 2026
Introduction
Economic value
Toyoboʼs earning power
Commitment to
realizing our vision
Management strategy to
enhance earning power
Value creation story
Social value
Achieving sustainable growth
Business
strategy
Business development
strategy
Human resource
strategy
Green strategy
Sustainability strategy
Corporate
governance
14
Data
Medium-Term Management Plan
2030 Medium-Term Management Plan
2030 Medium-Term Management Plan (2030 MTP) (fiscal 2027–fiscal 2031) represents the second half of Sustainable Vision 2030. Based on the fundamental premise of
ensuring thorough safety and disaster prevention, quality, and compliance, we will pursue three key measures. By achieving both an improved financial structure and profit
growth, we aim to achieve an ROE above 8% and a P/B ratio above 1.0x by fiscal 2031 through the sustained enhancement of corporate value.
2030 MTP
2025 MTP
(FY2023–FY2026)
3/23
Measure 2
Laying the groundwork for the future
Measure 1
Business portfolio reforms
Measure 3
Foundation establishment and
strengthening
Basic premise
Thorough safety and disaster
prevention, quality, and compliance
3/27
4 years to remake and prepare
Measure 1
Business portfolio
reforms
Laying the groundwork
for the future
Measure 3
Foundation
establishment and
strengthening
Basic premise
Toyobo Group takes seriously the fact that its price-to-book (P/B) ratio remains below 1.0 and will
continue to pursue management with a focus on the cost of capital and share price. Under 2030
MTP, we have adopted a policy of Shifting from scale to efficiency. By placing greater emphasis on
efficiency, we will restore earning power, advance business portfolio reforms, and significantly enhance
our ability to generate operating cash flow. At the same time, we will continue to invest in growth areas
as well as in safety, disaster prevention, and the environment. While maintaining financial discipline, we
will work to improve the debt-to-equity (D/E) ratio and progressively enhance capital efficiency.
3/31
3/41
(FY)
Achieve growth
Concentrate resources on priority businesses
(toward a capital employed ratio above 50%)
Realizing the results of growth investment and
preparation
Measures for challenged businesses
Business portfolio reforms
Research and development:
Measure 2
Management targets: Shift from scale to efficiency
Realizing the results of
growth investment and
preparation
CTO message
Shift resources to three value proposition areas and
accelerate commercialization
Strengthen marketing functions (fusion of technology
development and customer development)
Environmental initiatives: GHG emissions reduction,
product development related to environmental responses
Human capital
Toyobo-Transformation (TX)
Safety and disaster prevention, and quality
Risk management and governance
Infrastructure development
Thorough safety and disaster prevention,
quality, and compliance
p.15
p.31
Green strategy
p.40
Human resource strategy
p.35
TX
p.34
FY2025 results
FY2026 results
Major incidents
Zero
Zero
Net sales (¥bn)
422.0
421.6
470.0
500.0
Operating profit (¥bn)
16.7
27.9
35.0
45.0
Operating profit margin (%)
3.9
6.6
7.4
9.0
EBITDA (¥bn)*1
39.4
52.5
64.0
76.2
Net profit (¥bn)
2.0
11.2
14.0
19.0
ROE (%)*2
1.0
5.5
6
8
ROIC (%)*3
2.3
3.8
4.5
6
D/E ratio (times)
FY2029 plan*4
FY2031 plan*4
Zero
1.37
1.22
< 1.2
Capital employed in priority
businesses (%)
–
27*5
50
Employee engagement score (%)
–
52
60
70
(¥bn)
By segment
Net sales
Operating profit
FY2026 results
FY2029 plan
FY2031 plan
FY2026 results
FY2029 plan*4
FY2031 plan*4
Films
175.2
210.0
220.0
16.6
18.0
20.0
p.47
Life Science
34.5
40.0
50.0
0.1
5.0
9.0
p.48
Environmental and
Functional Materials
110.1
130.0
150.0
9.7
13.0
15.0
Other
101.8
90.0
80.0
1.5
-1.0
1.0
Total
421.6
470.0
500.0
27.9
35.0
45.0
Safety and disaster prevention
Quality
Risk management
p.50
Corporate governance
p.55
Sustainability management
p.45
*1 Operating profit + Depreciation (including goodwill)
*3 NOPAT (Interest-bearing debt + Net assets)
*5 Forecast as of April 2026
*2 Net profit average Total shareholders equity at the beginning and end of the fiscal year
*4 Excluding inorganic initiatives and carve-outs
Corporate value
TOYOBO REPORT 2026
Commitment to
realizing our vision
Introduction
Economic value
Social value
Toyoboʼs earning power
Management strategy to
enhance earning power
Achieving sustainable growth
Business
strategy
Value creation story
Business development
strategy
Human resource
strategy
Green strategy
Corporate
governance
Sustainability strategy
15
Data
Business portfolio reforms
Under the 2030 Medium-Term Management Plan, we evaluated our principal businesses based on two dimensions: profitability (ROA by business) and growth potential (including projected market
growth and market share). Based on this assessment, we classified them into four categories: Priority, Improvement, Development, and Challenged. As we work toward our fiscal 2031 goals, we
will actively allocate resources to the Priority businesses to drive earnings growth. For the Improvement businesses, we will maximize profitability while restraining investment. For the Development
businesses, we will strengthen competitiveness and enhance profitability. Meanwhile, for the Challenged businesses, we will focus on improving profitability and asset efficiency. Through these
initiatives, we plan to increase the share of capital employed accounted for by the Priority businesses from 27% in fiscal 2026 to more than 50% in fiscal 2029.
FY2022 results
2030 Medium-Term Management Plan
Businesses evaluated and classified into four categories based on
profitability and growth potential
Profitability
Return on capital employed (ROCE) = Operating profit
Capital employed
Note:Target hurdle rate of approx. 6.5%
Growth potential Compound annual growth rate (CAGR)
Businesses classified into four categories: Priority, Improvement, Development, and Challenged
based on profitability and growth potential
Profitability
ROA by business = Operating profit
Growth potential Indicators include projected market growth, market size, and market share
FY2022 results (May 2022 announcement)
Low
New businesses to be developed
FY2026 forecast
Businesses focusing on expansion
・Industrial film
・Packaging film
・Biotechnology
・Medical materials
Businesses requiring improvement Stable earning businesses
・Pharmaceuticals
・Airbag fabrics
・Textiles
・Environmental and
Functional Materials
rofitabilit
Low
High
Allocation of capital employed (FY2022 results)
Business
portfolio
FY2022 results
Share of capital
employed
ROCE
Business
Industrial film
Businesses
focusing on
expansion
51%
16%
Packaging film
Biotechnology
Medical materials
Stable earning
businesses
New businesses
to be developed
Businesses
requiring
improvement
26%
10%
–
–
–
Development
・Biotechnology
・Medical materials
Development
Priority
・Industrial film
・Environmental and Functional
Materials (Electronics materials)
manufacturing process
・Biotechnology
・Medical materials
・Biomanufacturing
Improvement
・Packaging film
・Textiles
・Nonwoven materials
・Pharmaceuticals
・Airbag fabrics
Improvement
Challenged
・Environmental and
Functional Materials
rofitabilit
Low
・Solution casting
・Parts for pharmaceuticals
・Industrial film
Challenged
Low
FY2029 plan
Priority
High
・Environmental and Functional
・Pharmaceuticals
・Airbag fabrics
Materials (Environment, Mobility)
・Packaging film
・Textiles
rofitabilit
Low
High
Allocation of capital employed (Increasing the priority business ratio above 50%)
Business
portfolio
FY2026 forecast*
Share of capital
employed
ROA by
business
Business
Priority
27%
11%
Industrial film
Improvement
23%
12%
Environmental and Functional Materials
Development
15%
3%
Environmental and Functional Materials
Business
portfolio
FY2029 plan*
Share of capital
employed
ROA by
business
Business
Industrial film
55%
11%
Improvement
40%
10%
Development
–
–
・Solution casting
・Parts for pharmaceuticals manufacturing process
・Biomanufacturing
Challenged
5%
4%
Airbag fabrics
Pharmaceuticals
Biotechnology
Medical materials
Packaging film
Challenged
35%
2%
Textiles
Airbag fabrics
Airbag fabrics
Pharmaceuticals
Pharmaceuticals
*Forecast as of April 2026
Environmental and Functional Materials (Electronics materials)
Priority
Nonwoven materials
Textiles
22%
High
Growth potential
Growth potential
High
Capital employed by business
Note:Target hurdle rate of 8.0%
Biotechnology
Medical materials
Environmental and Functional Materials
Packaging film
Textiles
*Excluding inorganic initiatives and carve-outs
Corporate value
TOYOBO REPORT 2026
Introduction
Commitment to
realizing our vision
Economic value
Toyoboʼs earning power
Management strategy to
enhance earning power
Value creation story
Social value
Achieving sustainable growth
Business
strategy
Business development
strategy
Human resource
strategy
Green strategy
Sustainability strategy
Corporate
governance
Data
16
CFO message
Connecting the voice of the capital markets
to management and the front lines to
establish a clear path to an ROE above 8%
Hidekazu Takahashi
Executive Officer
Chief Financial Officer (CFO)
Controlling Supervisor of Management
and Administration Division
Using numbers as a common language to
support challenges on the front lines
Since joining the Company, I have built a career spanning a
wide range of fields, beginning with 11 years as a biotechnology
researcher before moving into intellectual property, accounting,
overseas assignments, and finance. I am not a CFO who has
followed a conventional career path in finance and accounting.
Looking back, however, I realize that those experiences have come
together to form a single thread that underpins who I am today.
When I joined the Company, textiles were still our core
business. Over the past 30 years, however, our business has
changed dramatically. Throughout that transformation, I had the
opportunity to witness firsthand, through my work in research and
intellectual property, the people who were determined to forge
new paths with unwavering conviction. I believe the businesses
that now underpin Toyobo Group, such as COSMOSHINE
SRFTM polarizer protective films for LCDs and enzyme materials
for blood glucose sensors, are the result of the dedication and
sustained efforts of individuals across the Group.
At the same time, I also experienced periods when our financial
position made it difficult to fully support the research and
development needed to secure our future. Those experiences
reinforced my belief that the role of the CFO extends beyond
managing numbers. By using numbers as a common language,
I want to engage with the challenges facing our businesses and front
lines, understand the aspirations of those with the conviction to drive
change, and stand alongside them as they take on those challenges.
Growth investments and signs of earnings recovery
The 2025 Medium-Term Management Plan (2025 MTP) was a
period in which we made a decisive shift from a survival mindset
to a sustainable growth mindset by investing for future growth. I
believe that strategic direction was the right one. During the first
half of the plan, however, we were slow to respond to changes
in the business environment, including the situation in Ukraine.
As operating cash flow declined, we continued to make capital
investments at levels exceeding operating cash flow, resulting in
a deterioration of our financial position. In addition, the returns
we had expected from those growth investments in the latter half
of the plan did not materialize as planned, making it a particularly
challenging period.
Even so, the initiatives we undertook during this time were highly
significant in laying the foundation for our next stage of growth.
In addition to renewing aging facilities and strengthening the
foundations of safety, disaster prevention, and quality, we
established TOYOBO MC Corporation, a joint venture with
Mitsubishi Corporation, and made growth investments centered
on Films and Life Science. These initiatives steadily laid the
groundwork for future growth.
We also focused on value-based pricing under the 2025 MTP.
Products that delivered clear customer value were priced
accordingly, while those that did not were reassessed. This
more disciplined approach to our products also contributed to
improved profitability, and in fiscal 2026 we achieved record
gross profit, EBITDA, and operating cash flow. Having overcome
a difficult period, I believe we have emerged stronger, with
enhanced earning power. As the saying goes, adversity reveals
true strength. The process of implementing price increases
reaffirmed the strength of the products and businesses that can
clearly demonstrate their value. Our cost reduction initiatives and
reforms of businesses requiring improvement have also delivered
steady results, leading to sustained improvements in profitability.
That said, record earnings in absolute terms are not enough. In
terms of profit margins, we have only just returned to the level
achieved in fiscal 2022. Ensuring that our growth investments
translate into sustainable earnings is therefore essential, making
the 2030 Medium-Term Management Plan (2030 MTP) a critically
important period for the Group.
Review of 2025 Medium-Term Management Plan
p.13
C FO MESSAGE
Corporate value
TOYOBO REPORT 2026
Introduction
Commitment to
realizing our vision
Economic value
Toyoboʼs earning power
Management strategy to
enhance earning power
Value creation story
Social value
Achieving sustainable growth
Business
strategy
Business development
strategy
Human resource
strategy
Green strategy
Corporate
governance
Sustainability strategy
17
Data
CFO message
The path to achieving an ROE above 8%
To achieve the ROE target of above 8% set out in the 2030 MTP,
we have organized our initiatives around three perspectives:
profitability, efficiency, and financial soundness.
Three drivers of ROE
ROE
Net profit margin
Profitability
Asset turnover
Efficiency
Corporate value
Financial leverage
Financial soundness
I believe the first challenge we must address is profitability.
Compared to our peers, we have yet to achieve satisfactory
profitability. The significant growth investments made under the
2025 MTP will increase the depreciation expense from fiscal 2027
onward, making the next few years particularly challenging. To
overcome this, we must steadily increase production volumes
through the operation of our new facilities, implement valuebased pricing, and shift toward a more profitable product
mix. At the same time, as fixed costs, including personnel
and depreciation expenses, continue to rise, we will optimize
operational workloads through management transformation
under TX (Toyobo-Transformation) and build an organization
capable of creating greater added value. It will also become
increasingly important to sharpen our business portfolio reforms
by allocating our limited management resources to the areas
where they can have the greatest impact.
Improving asset turnover is our primary focus when it comes
to efficiency. In the past, our priority was to return unprofitable
businesses to profitability, which led us to a profit and loss
statement (P/L)–driven mindset. Going forward, we will
establish the cash conversion cycle (CCC) as a key performance
indicator on the front lines, enabling each business to clearly
identify where improvements are needed. Specifically, we will
reduce working capital by shortening receivables collection
periods, reducing excess inventory, and optimizing inventory
levels through more accurate sales forecasting.
These initiatives, however, cannot be driven by numbers
alone. Simply telling people to reduce inventory or collect
receivables faster will not bring about meaningful change on
the front lines. That is why I visit our plants in person. While my
visits might initially put people on edge, they allow me to look
beyond the numbers, hear directly how employees think about
their work and the challenges they face, and gain a firsthand
understanding of the realities on the ground. Concepts such as
ROE and the CCC can easily seem remote to those working on
the front lines. That is why I believe it is essential for our finance
and accounting teams to work closely with each business,
translate these metrics into indicators that each department
can manage, and empower employees to take ownership of
improvement through their day-to-day work.
Under the 2025 MTP, we made substantial investments,
relying in part on external financing, which increased our
financial leverage. We must now steadily restore our financial
soundness. Maintaining a debt-to-equity (D/E) ratio below
1.2 is a financial discipline we are firmly committed to
upholding. Our immediate priority is to keep the ratio below
1.2, while setting our sights on reducing it to below 1.0 over
the longer term. By translating our growth investments into
earnings, improving asset efficiency, and maintaining financial
discipline, we will establish a clear path to achieving an ROE
above 8%.
Cash flow allocation/Capital expenditures
In light of the deterioration in our financial position following
the aggressive growth investments made under the 2025
MTP, our basic policy for the 2030 MTP is to keep investments
within operating cash flow. Within this framework, however,
we will continue to invest actively in priority areas that will
drive future growth, including Life Science and the electronic
materials business of TOYOBO MC Corporation.
As part of our efforts to improve asset efficiency, we will
focus on shortening the CCC. By reducing the CCC by 30
days by fiscal 2029, we expect to reduce working capital by
approximately ¥30.0 billion. The cash generated through
these improvements will be allocated to future growth
investments and strengthening our financial position.
Cash flow allocation
FY2023–FY2026 outlook*1
(annual average)
a
in o
a
out o
a
FY2027–FY2029 plan*2
(annual average)
in o
a
out o
Safety, disaster prevention, and
environmental investments:
¥4.2 billion ear
Operating
cash flow:
¥22.5
billion ear
Investments to
remake the
Company:
¥20.8
billion ear
External
financing:
¥25.0
billion ear
Operating
cash flow:
¥46.7
billion ear
Capital
expenditures:
¥35.0
billion ear
Growth
investments:
¥19.0
billion ear
Dividends:
¥3.5 billion ear
Financial position
improvement and
dividends:
¥11.7
billion ear
*1 Forecast as of April 2026 *2 Excludes inorganic initiatives and carve-outs
C FO MESSAGE
Corporate value
TOYOBO REPORT 2026
Introduction
Commitment to
realizing our vision
Economic value
Social value
Toyoboʼs earning power
Management strategy to
enhance earning power
Value creation story
Achieving sustainable growth
Business
strategy
Business development
strategy
Human resource
strategy
Green strategy
Sustainability strategy
Corporate
governance
Data
18
CFO message
Responding to the voice of the capital markets
and delivering growth through results
Capital expenditures
50.0
¥44.0 billion ear
u ulative total
40.0
30.0
20.0
10.0
0.0
(¥bn)
ro t inve t ent
billion ear
176.0 billion
il
ro t
inve t ent
nve t ent to
re a e
t e o
an
¥20.8 billion
a et di a ter revention and
environ ental inve t ent
¥4.3 billion
¥35.0 billion ear
u ulative total
Release film for MLCCs
Polarizer protective films for LCDs
OPP film
¥19.0 billion
Films
Life Science
Environmental and
Functional Materials
Others
Policy on shareholder returns
Our policy is to maintain a stable dividend, with a total return
ratio of approximately 30% as a guideline. While enhancing
shareholder returns remains an important priority, we believe
it is equally important, given our current financial position, to
maintain a sufficient level of total shareholders equity in order to
preserve our ability to fund sustainable growth. We will therefore
maintain an appropriate balance between shareholder returns
Medical membranes,
biotechnology
nviron ental and
unctional aterial
¥14.0 billion
Raw enzymes for
biochemical diagnosis
Raw materials for genetic
diagnostic reagents
Hollow fiber membranes
for artificial kidneys
We also need to improve the accuracy of our investment
decisions. Individual investments will be evaluated for
profitability based on the cost of equity and the weighted
average cost of capital (WACC). Because investments inherently
involve uncertainty, proposals will be examined from multiple
perspectives through several rounds of discussion at forums
of the Board of Management and others. We will also conduct
post-investment reviews and apply the issues identified and
lessons learned to future investment decisions.
i e cience
105.0 billion
ro t
inve t ent
i e cience
FY2023–FY2026 outlook*
(Four-year total)
ro t inve t ent
billion ear
Films
Life Science
Environmental and
Functional Materials
aintenance
inve t ent
¥21.0 billion
Others
Plastics, chemicals, etc.
t er
Digital transformation
(DX), etc.
FY2027–FY2029 plan
T ree ear total
- Forecast as of April 2026
and financial soundness. By steadily translating our growth
investments into earnings and enhancing corporate value, we
aim to deliver sustainable growth in shareholder value over the
medium- to long-term.
Shareholder returns (dividends + share repurchases)
6.0
5.0
4.0
3.0
2.0
1.0
0.0
(¥bn)
FY2025
result
FY2026
result
FY2029
FY2031
Total a out ratio
176.1%
31.6%
30% target 30% target
We have received feedback from the capital markets that we
need to move more quickly in advancing our business portfolio
reforms and achieving an ROE above 8%. We take that feedback
seriously and believe it is essential to achieve an ROE above 8%
as soon as possible and demonstrate tangible results. We also
recognize the significance of our price-to-book (P/B) ratio having
remained below 1.0 for an extended period. At the same time,
although our P/B ratio has yet to exceed 1.0, our fiscal 2026
performance suggests that the capital markets perception of
the Company is beginning to change. It is not enough simply to
articulate our strategy. We must deliver results and earn the trust
of the capital markets by consistently following through on the
commitments we have made.
Our current management team is, in a sense, a group of highly
accomplished individuals, each with a distinct personality and area
of expertise. To me, One-team management does not mean that
everyone thinks alike. Rather, it means engaging in open and candid
discussions from diverse perspectives, then coming together as one
team to make decisions and execute them. Through this approach,
we must ensure that, under the 2030 MTP, our business portfolio
reforms, improvements in capital efficiency, and other initiatives
deliver tangible results while incorporating the perspective of the
capital markets.
Under the 2025 MTP, our non-financial sustainability initiatives
became firmly embedded both within the Group and among our
stakeholders. Using President Takeuchi s equation of Corporate
value = Economic value Social value, I believe we have made
steady progress in enhancing our social value. The next challenge
is to translate the growth scenario presented in our value creation
story into tangible economic value that our stakeholders can
clearly recognize. As CFO, I will ensure that the expectations and
feedback we receive from our shareholders and investors are
communicated to both management and the front lines, helping
drive our next stage of growth and further enhance our corporate
value.
C FO MESSAGE
Corporate value
TOYOBO REPORT 2026
Introduction
Commitment to
realizing our vision
Economic value
Social value
Toyoboʼs earning power
Management strategy to
enhance earning power
Achieving sustainable growth
Business
strategy
Value creation story
Business development
strategy
Human resource
strategy
Green strategy
Sustainability strategy
Corporate
governance
19
Data
Sustainable Vision 2030
Value creation process
Toyobo Group will contribute to realizing a sustainable future for people and the planet by creating solutions that help address social issues while strengthening the management capital that supports its value creation cycle.
Corporate philosophy framework “TOYOBO PVVs”
Inputs
Business model
Outputs
p.20
Outcomes
Targets
FY2026 results
Financial capital
Manufacturing capital
Intellectual capital
Major research and development sites*1 3
R&D expenses
¥14.1 billion
Core technologies
Number of patents held
6,821
Phase 4
Creating the next solutions
Phase 3
Creating solutions through
commercialization
Phase 2
Examining solutions
Phase 1
Human capital
Strong trust-based relationships with
customers, suppliers, and local communities
Collaboration with universities and
other companies
Participation in various initiatives
Natural capital
Energy consumption
2,753 GWh
Water intake
79,912 thousand m3
Technologies contributing to
environmental impact reduction
p.27
Life Science
p.28
Number of Group employees 9,398
Number of R&D personnel*2
502
Number of employees transferred
through the internal job posting
system (cumulative)*3,*6
25
People who put the corporate
philosophy into practice
Social and relationship capital
Advanced
materials
Films
Healthcare
Understanding issues faced
by people and the planet
Environmental
and Functional
Materials
p.29
Co-creation
Cowith creation
custome
rs
Peop
le
and organi
zations
Spiri
t: Cha
DNA llenge, Reliability, Collaboration
of
Pers Flexibility and Transforma
tion
evera
nce and S
incerit y
Strengths
developed over
more than 140
years of history
Materiality
Domain contributing to solving
social issues through business
ter n a l
Leveraging ex d talent
technologies an
Collaboration
with partners
Human capital
domain
ie s
Technolog
ology
Biotechn
Polymer and
ge of
erse ran nce
v
i
d
a
f
o
n
o
rma
Optimizati
o
f
r
e
p
t
eve targe
materials to achi
Fibers and
Textiles
Increased and diversified
needs concerning access to
medical care/health promotion
Environment
and energy
p.23
Environmental and
manufacturing domain
Business foundation
domain
Societal demands and challenges
Standardization in handling
safety, human rights, and
social justice issues
p.30
Creating customer value and solving social issues
Innovation
Consolidated total assets ¥627.7 billion
Shareholders’ equity ¥159.7 billion
Production sites
35
Capital investment
¥29.0 billion
Production technology capabilities
that meet customer needs
A network linking development
and production
Sustainable Vision 2030
Demographic changes,
human-centric innovation,
accelerated urbanization
Decarbonization,
resource circulation,
limited natural resources
*1 TOYOBO CO., LTD.
*2 TOYOBO CO., LTD., and TOYOBO MC Corporation
*3 TOYOBO CO., LTD., TOYOBO MC Corporation, TOYOBO STC CO., LTD.,
and TOYOBO TEXTILE CO., LTD.
*4 TOYOBO CO., LTD., TOYOBO MC Corporation, and TOYOBO STC CO., LTD.
*5 Reporting period: January 1, 2025, to December 31, 2025.
*6 Cumulative number of employee transfers since the introduction of the
internal job posting system in fiscal 2023.
Greening rate of film products
60%
Employee
engagement score
70% or higher
Major incidents
0
Reduction in GHG emissions
Scope 1 and 2 (vs. FY2014) 46% or more
2030 Medium-Term Management Plan
ROE Above 8%
ROIC Above 6%
FY2026 results
Financial indicators
ROE ROIC Net sales
eratin
rofit
5.5% 3.8% ¥421.6 billion ¥27.9 billion
Sustainability indicators
Contribution through business
Greening rate of film products 18%
Ratio of sales from ECO-PARTNER
SYSTEMTM products*2
31%
Human capital
Employee engagement score3 52%
Ratio of female employees in
management positions4
5.6%
Environment and manufacturing
Number of major incidents*5
Reduction in GHG emissions
Scope 1 and 2 (vs. FY2014)
Business foundation
0
37%
CSR procurement survey results*2
Response rate
99%
Corporate value
TOYOBO REPORT 2026
Introduction
Commitment to
realizing our vision
Economic value
Toyoboʼs earning power
Management strategy to
enhance earning power
Social value
Achieving sustainable growth
Business
strategy
Value creation story
Business development
strategy
Human resource
strategy
Green strategy
Sustainability strategy
Value creation cycle: Toyobo Group’s business model
Based on the Value creation story presented in the 2030 Medium-Term Management Plan, we discuss our raw enzymes for
biochemical diagnosis as an example of our value creation cycle in action. Driven by our core technologies and the strengths of
our people and organizations, we create both economic and social value. By further enhancing the reproducibility of this value
creation cycle, we will continue to create the solutions needed by people and the planet.
Corporate
governance
Corporate philosophy framework TOYOBO PVVs
Strengths
People and organizations
Phase 4
Phase 3
Understanding issues
faced by people and
the planet
Co-creation
At the Inuyama Plant, responsible for the rayon business, Toyobo began exploring ways to address water
pollution in the Kiso River caused by pulp wastewater.
2 The Company established a technology that uses yeast to break down sugars in wastewater, helping to
prevent water pollution.
3 While working with partners to commercialize technologies based on yeast and the enzymes derived from it, the Company
recognized the growing societal need for the early detection of disease and more advanced preventive healthcare.
4 The Company took on the challenge of developing enzyme-based diagnostic technology capable of
delivering more accurate and faster results than conventional chemical testing methods.
1
The launch of URICOLOR 400, a reagent for measuring uric acid, in 1972 was prompted by a proposal
from a sales partner. As Japan’s only enzyme-based reagent of its kind, it was recommended for use in the
referen e method and the u ine re i nifi antl a the en me method e ame more idel u ed
2 Since then, the Company has continued to launch products aligned with technological advances, including the
automation of testing and the wider adoption of simpler, faster, and more accurate enzymatic colorimetric methods.
3 Researchers with extensive expertise in diagnostic reagents accompanied sales partners as
te hni al ale
e iali t ena lin them to identif hallen e in the field fir thand and drive
the development of new diagnostic reagents and enzymes while expanding the product lineup.
4 n
the Com an laun hed it fir t eneration ra en me for lood lu o e monitorin
sensors, a product that would later become a major growth driver.
1
Phase 2
Phase 1
Phase 2
Examining
solutions
As its enzyme portfolio expanded, the Company began developing overseas markets. Drawing on the
support of research institutions with which it had built long-standing relationships, the development and
sales teams worked together to cultivate new customers.
2 To meet evolving market needs, the Company subsequently advanced technologies to improve enzyme
rodu tivit and modif en me fun tion
levera in it ene anal i and eneti modifi ation
technologies, developed through its gene research reagent business, which it entered in 1982.
3 Through joint research with research institutions, the Company developed a second-generation raw
enzyme for blood glucose monitoring sensors with improved measurement accuracy. Following its launch,
the product quickly gained widespread adoption in global markets and grew into a major business.
4 Amid intensifying competition, the manufacturing, sales, and development teams worked together to
overcome the challenge of establishing a new proprietary manufacturing process through continuous
product improvements, leading to the commercialization of the third-generation enzyme in 2008.
5 While continuously expanding production capacity, the Company worked with major overseas pharmaceutical
companies to broaden its product lineup and strengthen sales promotion, increasing its share of the global market.
1
Phase 3
Toyobo Groupʼs value creation in action
Raw enzymes
for biochemical diagnosis
Biochemical testing uses enzyme reactions to
analyze components such as proteins, lipids, and
carbohydrates in blood and urine to support disease
diagnosis and assess health conditions. Toyobo
Group has established the worldʼs second-largest
market share* in the manufacture and sale of raw
enzymes for biochemical diagnosis. Our product
lineup includes enzymes used in tests for blood
glucose (diabetes indicator), cholesterol
(lipid-related indicator), creatinine (kidney function
indicator), and GOT/GPT (liver function indicator). In
raw enzymes for blood glucose monitoring sensors,
we hold the worldʼs largest market share at 35%.*
Creating solutions
through
commercialization
Technologies
Co-creation Collaboration Leveraging external
with customers with partners technologies and
talent
Value creation story of raw enzymes for biochemical diagnosis
Phase 1
20
Data
a ore te hnolo the Com an ha refined it mi ro ial fermentation and en me urifi ation te hnolo ie
ena lin the effi ient de i n and rodu tion of en me tailored to e ifi a li ation
a re ult the Com an
has established the world’s second-largest market share* in raw enzymes for biochemical diagnosis and the
world’s largest market share* of approximately 35% in raw enzymes for blood glucose monitoring sensors.
2 Driven by global population growth and rising standards of healthcare, the number of biochemical tests
performed is expected to increase, particularly in emerging markets. New production equipment commenced
o eration in fi al
and the Com an ill ontinue to tren then it u l a a it to meet ro in
demand hile develo in ontinuou en me ultivation te hnolo to further im rove rodu tion effi ien
3 Although continuous cultivation technology requires highly advanced technological innovation, it offers
i nifi ant im rovement in o t om etitivene
e ta li hin thi te hnolo enhan in oth ri e
competitiveness and supply capacity, and providing enzymes that meet customers’ quality requirements, the
Company will continue to expand globally with products that contribute to improving people’s quality of life.
Value proposition
Developing core materials to enable social implementation
Advanced
materials
Healthcare
Create customer value
Environment
and energy
Solve social issues
Creating sustainable prosperity for people and the planet
Achieve sustainable growth
Value creation highlights
People and organizations
Addressing the social challenge of water
pollution
Taking on the challenge of both addressing
social challenges and creating economic value
through commercialization
Collaboration with partners
Understanding needs in biochemical testing
Collaboration with partners
Launch of Japan s first diagnostic reagent
based on a proposal from a sales partner
Sales promotion through the secondment of
researchers to sales partner companies
Co-creation with customers
Technologies
Development and product line expansion
based on firsthand understanding of
challenges in the field
Leveraging external technologies and talent
Collaboration with partners
Overseas marketing leveraging long-standing
relationships with research institutions around the world
Technologies
Advancing functional modification technologies by leveraging
technologies developed for gene research reagents
People and organizations
Technologies
People and organizations
Technologies
Taking on and overcoming the challenge of
establishing a highly advanced production technology
Co-creation with customers
Establishing a strong global position for next-generation
enzymes through the integrated efforts of
manufacturing, sales, development, and customers
1
Phase 4
Creating the
next solutions
People and organizations
Technologies
Taking on the challenge of highly advanced
technological innovation
People and organizations
Co-creation with customers
A commitment to bringing prosperity to
people s lives through the global expansion
of products that contribute to improving
quality of life, while we also continue to seek
the growth and development of our people
and the Group
Corporate value
TOYOBO REPORT 2026
Commitment to
realizing our vision
Introduction
Economic value
Toyoboʼs earning power
Management strategy to
enhance earning power
Value creation story
Social value
Achieving sustainable growth
Business
strategy
Business development
strategy
Human resource
strategy
Green strategy
Sustainability strategy
Toyobo Group’s strengths
Corporate
governance
21
Data
Corporate philosophy framework TOYOBO PVVs
Strengths
People and organizations
Leveraging the strengths of our people and organizations and our core technologies, cultivated over more
than 140 years of history, Toyobo Group creates the solutions that people and the planet need.
Co-creation
Technologies
Co-creation Collaboration Leveraging external
with customers with partners technologies and
talent
Value proposition
Developing core materials to enable social implementation
Advanced
materials
Healthcare
Create customer value
Environment
and energy
Solve social issues
Creating sustainable prosperity for people and the planet
Achieve sustainable growth
People and organizations
Technologies
The strength of our people and organizations lies in the TOYOBO Spirit of Challenge, Reliability, and
Collaboration, together with the DNA of flexibility and transformation cultivated over more than 140
years of history, as well as the perseverance and sincerity that define Toyobo Group. Together, these
strengths underpin Toyobo’s distinctive approach to value creation.
The strength of our technologies lies in our ability to optimize a diverse range of materials to
achieve target performance, based on our core Polymer and Biotechnology technologies. By
further advancing the technologies we have cultivated since our founding, we will continue to
create new value.
TOYOBO Spirit
9 Commitments
Challenge
Think Ahead
Create
Challenge
Two core technologies
Since our founding, we have taken on the
challenge of entering new business domains
to help solve social issues, creating the new
that society needs. Going forward, we will
continue to leverage the technologies we
have cultivated and our spirit of challenge
to create solutions that contribute to solving
social issues.
Accomplish
Reliability
Reliability
Safety First
Customer
Satisfaction
Factual Basis
Collaboration
Mutual
Communication
Diversity
Providing
Opportunities
For more than 140 years, Toyobo Group has
built trust through its commitment to safety,
disaster prevention, quality assurance, and
compliance. Going forward, we will continue
to be a company trusted by all stakeholders,
including our customers and suppliers.
Collaboration
We have fostered a culture that emphasizes
mutual respect, co-creation, and
collaboration with a diverse range of internal
and external stakeholders. A culture that
welcomes change, enjoys change, and
continues to create change is what defines
Toyobo Group today.
Polymer
Biotechnology
Polymer is one of Toyobo Group s core technologies,
cultivated through its synthetic fiber business. We
possess an integrated technological foundation spanning
polymer design, synthesis, polymerization, modification,
and processing. Through molecular orientation control
and advanced processing technologies, we optimize a
diverse range of materials to achieve target performance.
Leveraging these strengths, we develop products such
as high-performance resins, films, membranes, and highperformance fibers, creating value across a broad range
of industries.
Biotechnology is one of Toyobo Group s core
technologies, originating from the cultivation of yeast used
to treat pulp wastewater. Leveraging gene and protein
design technologies, together with microbial and cellular
metabolic control technologies, we have the capability
to develop and manufacture research and diagnostic
reagents in an integrated manner, from raw materials to
final products. By combining these capabilities with our
polymer technologies, we also develop medical products,
including highly biocompatible medical materials and
medical membranes, creating value in the healthcare field.
Corporate value
TOYOBO REPORT 2026
Commitment to
realizing our vision
Introduction
Economic value
Social value
Toyoboʼs earning power
Management strategy to
enhance earning power
Toyobo Group’s
value proposition areas
Value creation story
Achieving sustainable growth
Business
strategy
Business development
strategy
Human resource
strategy
Green strategy
Corporate
governance
Sustainability strategy
Creating sustainable prosperity
for people and the planet
22
Data
Corporate philosophy framework TOYOBO PVVs
Strengths
People and organizations
Technologies
Co-creation
Co-creation Collaboration Leveraging external
with customers with partners technologies and
talent
Leveraging the strengths of our people and organizations
and our technologies, Toyobo Group creates core materials
that enable social implementation across three value
proposition areas through co-creation with customers and
collaboration with partners. Through creating customer
value and solving social issues, we contribute to creating
sustainable prosperity for people and the planet.
Value proposition
Developing core materials to enable social implementation
Advanced
materials
Healthcare
Create customer value
Environment
and energy
Solve social issues
Creating sustainable prosperity for people and the planet
Achieve sustainable growth
Aerospace
and satellites
XENOMAXTM
Quantum
materials
p.27
Biomanufacturing
Vitrimer*
Materials related
to new energy
p.31
Physical AI
and robotics
Semiconductors and
electronics materials
Semiconductor business
p.32
Advanced diagnostics
Films
Coating and
adhesion materials
Functional
membranes
Advanced mobility
Adsorbents
Environmental
solutions equipment
Resource circulation (GX)
K-FILTERTM
p.29
Highperformance fiber
Engineering
plastics
Longevity
Chemical
materials
Life Science business
Medical materials
Enzyme and
diagnostic reagents
Medical membrane
Pharmaceuticals
p.28
Advanced therapeutics
CATAROSEVTM
p.31
Materials for pharmaceutical
manufacturing processes
(enzymes, membranes)
- Vitrimer is a registered trademark of FONDS ESPCI PARIS.
Corporate value
TOYOBO REPORT 2026
Introduction
Commitment to
realizing our vision
Economic value
Toyoboʼs earning power
Management strategy to
enhance earning power
Value creation story
Social value
Achieving sustainable growth
Business
strategy
Business development
strategy
Human resource
strategy
Green strategy
Sustainability strategy
Corporate
governance
Data
23
Materiality
Toyobo Group, in response to stakeholder demands and expectations, identifies material issues and drives various initiatives through its business activities to achieve its vision of
“a Group that continues to create the solutions needed by people and the planet.”
Toyobo Group’s materiality
Process of identifying material issues
The Group s materiality was initially identified in May 2020 and
has since been reviewed in light of our Sustainable Vision 2030,
leading to the current framework.
By assessing both the impact on stakeholders and the Group, we
have clarified our high-priority goals and organized them into four
key areas: contributing to solving social issues through business,
human capital, environment and manufacturing, and business
foundations (see diagram below).
We reviewed external initiatives and 12 international guidelines,
including the GRI Standards, to identify candidate material
issues. The positive and negative impacts of these issues were
assessed through internal questionnaires and interviews. After
also considering feedback from external stakeholders, including
institutional investors, our material issues were finalized with the
approval of the Board of Directors.
We will continue to review our material issues in line with changes
in the external environment and our management policies.
Materiality map
To ensure steady progress on our materiality initiatives, we
have assigned an officer to each materiality and established
corresponding targets and indicators. Progress is reported and
shared at each meeting of the Sustainability Committee, which is
held every two months, to support the continuous improvement
of our initiatives. When necessary, the results of deliberations by
the Sustainability Committee are reported and submitted to the
Board of Directors through the Board of Management.
Specific process
Domain contributing to solving social issues through business
Very
large
Impact on stakeholders (present)
Management of materiality indicators (PDCA)
A decarbonized and circular society
A healthy lifestyle and healthcare
Smart communities and comfortable spaces
Quality water areas, air, and soil, and the preservation of biodiversity
Materiality
Human capital domain
Employee well-being
(diversity, equity, and inclusion; health
and productivity management;
occupational health and safety)
Human capital
Human rights (including in the supply chain)
Environmental and
manufacturing domain
Safety and disaster prevention
Quality
A decarbonized and circular society
(reduction of environmental impact)
Chemical substances
management
Business foundation domain
Large
Impact on Toyobo Group
(present to 2030)
Very
large
Innovation
Partnerships (supply chain, stakeholder engagement, and social contribution)
Digital transformation
Risk management and compliance
Identify and list global
social issues
United Nations Global
Compact, GRI Standards,
SASB, etc.
Internal survey and
impact assessment
Target: Directors, officers,
and employees
Gather external
feedback and revise the
content
Discussed by the Board
of Management and
approved by the Board
of Directors
TOPICS
Review of materiality indicators
in line with the Medium-Term
Management Plan
Following the formulation of the 2030
Medium-Term Management Plan, Toyobo
Group reviewed its materiality indicators for
fiscal 2027 onward. To strengthen alignment
with its management strategy and enhance
the effectiveness of progress management,
the Group optimized these indicators and
redesigned them using a backcasting
approach based on its desired future state to
achieve Sustainable Vision 2030. The Group
will use these indicators to visualize progress
on its strategy and steadily advance toward
realizing its desired future state.
View the revised materiality indicators.
Corporate value
TOYOBO REPORT 2026
Introduction
Commitment to
realizing our vision
Economic value
Social value
Toyoboʼs earning power
Management strategy to
enhance earning power
Value creation story
Achieving sustainable growth
Business
strategy
Business development
strategy
Human resource
strategy
Green strategy
Sustainability strategy
Corporate
governance
Data
24
Materiality
Risks, opportunities, and materiality in achieving the vision
Materiality indicators
Human capital domain
Domain contributing
to solving social issues
through business
Category
Major items
A decarbonized and
circular society
A healthy lifestyle and
healthcare
April 1, 2026
Risks
Short, medium, and long term
Greenhouse gas (GHG) reduction
efforts
Increase in environmental impact costs
Losses due to environmental pollution
Opportunities
Short, medium, and long term
Growth and expansion of products and
businesses contributing to the following:
A decarbonized society
A resource-circulating society
People s well-being
Comfortable living
Smart communities and
comfortable spaces
Employee well-being
(diversity, equity,
and inclusion; health
and productivity
management;
occupational health
and safety)
Short and medium term
Human rights violations in the supply
chain
Absences due to mental health issues
and reduced productivity due to lower
job satisfaction
Losses and business impact from
occupational accidents
Medium and long term
Work-style reforms emphasizing diversity
Talent development and creating a supportive
workplace
Retaining top talent through health and
productivity management
Human capital
Environmental and manufacturing domain
Human rights
(Toyobo Group)
Safety and disaster
prevention
Quality
Chemical substances
management
A decarbonized
and circular
society (reducing
environmental impact)
Indicators
Themes
FY2026 indicators
- Expansion of ECO-PARTNER SYSTEMTM products and 1. Sales ratio of 40%*1
services that contribute to the environment
- 60%*1
- Greening of the film business
FY2026 results
Officer in charge
-
31%
-
18%
-
Taichi Sakai
-
Masanao Kudo
-
Number of tests through the provision of infectious
disease diagnostic reagents
-
Number of dialysis patients provided with dialysis
membranes
-
10 million times*1
-
250,000 patients*1
-
6.7 million times
-
220,000 patients
Kazuhito Ikeda
-
Expansion of sales volume for products supporting
DX
-
1.5 times FY2021*1
-
1.4 times
Masanao Kudo
-
Training investment per employee and training time
-
Ratio of female employees in management positions
-
Ratio of eligible male employees taking childcare leave
-
Employment ratio of people with disabilities
-
Ratio of overworked employees
-
Ratio of annual paid leave taken per year
-
Certification as a 2025 Health & Productivity
Management Outstanding Organization (Large
Enterprise Category)
-
Employee engagement score
-
Positive response rate of employee engagement score
Items related to daily work execution
Items related to respect for diverse opinions and
perspectives
-
Number of key overseas personnel attending
training in Japan
-
¥50,000, 21 hours
-
5.0% or more
-
At least 80% of eligible employees
(Average number of days taken:
14 days or more)
-
2.5%
-
Year-on-year improvement
-
75% or more
-
Acquire or maintain
-
At least 70%*1
-
Improvement in score (year on year)
-
15 people
-
¥30,000, 12.21 hours
-
5.6%
-
116.2% (average of 35.7 days)
-
2.46%*2
-
0.13%
-
80.8%
-
Maintained
-
52%
-
47%
50%
-
17 people
Takehiko Inada
-
Implementation of human rights education and
training
-
Holding human rights study sessions
and training for Group employees 10
times or more
-
12 times
Number of participants: 1,877
Norio Iizuka
Short and medium term
Recurrence of similar disasters or
troubles
Loss of social credibility due to
accidents or scandals
Short, medium, and long term
Cultivating a safety culture
Accumulating know-how in preventive
maintenance
- Number of major accidents*
- Frequency rate of workplace accidents resulting in
lost workdays
- Number of fires or explosions
- Number of environmental and spill accidents
- Set internal standards based on definitions stipulated
by the Ministry of Health, Labour and Welfare
Note: Items 1–4 are aggregated from January to
December.
-
0 incidents
-
0.25 or less
-
0 incidents
-
0 incidents
-
0 incidents
-
0.62
-
0 incidents
-
1 incident
Taichi Sakai
Short, medium, and long term
Loss of social credibility due
to inaccurate data handling or
inappropriate product shipments
Short, medium, and long term
Improving customer satisfaction and social
credibility
- Number of incidents related to products*
- Implementation of product safety and quality
assurance training
- Set internal standards based on definitions stipulated
by the Ministry of Economy, Trade and Industry
-
0 incidents
-
100%
-
0 incidents
-
100%
Masakazu Iwasaki
Short, medium, and long term
Loss of business opportunities due
to non-compliance with chemical
substance regulations
Short, medium, and long term
Strengthening business profitability through
compliance with laws and regulations
Improving customer satisfaction and social
credibility
-
Major disasters (Level IV)
-
Number of environmental and spill accidents (Level III)
-
Environmental law violations (Level III): Pollution
control laws, Poisonous and Deleterious Substances
Control Act, Act on Waste Management and Public
Cleansing
Note: Items 1–3 are aggregated from January to
December.
-
0 incidents
-
0 incidents
-
0 incidents
-
0 incidents
-
1 incident
-
0 incidents
Taichi Sakai
Short, medium, and long term
Increased risk of extreme weather and
natural disasters due to climate change
Environmental impact from waste and
emissions
Water resource shortages or depletion
Short, medium, and long term
Expanding demand for products contributing
to climate change mitigation (resource
conservation, energy saving, low carbon)
Reducing energy costs through improved
production efficiency
Lowering environmental conservation costs
-
GHG emissions Scope 1 and 2 (consolidated)
-
VOC emissions (domestic total)
-
Discharge of hazardous substances into water bodies
(domestic total)
-
Amount of waste emissions (consolidated)
-
Final disposal (landfill disposal) rate (domestic total)
-
At least 46% reduction compared with FY2014*1
-
60% reduction compared with FY2015*1
-
80% reduction compared with FY2024*1
-
15% reduction compared with FY2016*1
-
Less than 1%
-
37% reduction (771 thousand
t-CO )
-
83% reduction
-
39% reduction
-
7% reduction
-
0.88%
Taichi Sakai
Some indicators do not cover all Group companies.
*1 Fiscal 2031 indicators *2 As of June 1, 2025
Corporate value
TOYOBO REPORT 2026
Introduction
Commitment to
realizing our vision
Economic value
Toyoboʼs earning power
Management strategy to
enhance earning power
Value creation story
Social value
Achieving sustainable growth
Business
strategy
Business development
strategy
Human resource
strategy
Green strategy
Sustainability strategy
Corporate
governance
Data
25
Materiality
Risks, opportunities, and materiality in achieving the vision
Materiality indicators
Category
Major items
Risks
Opportunities
Themes
FY2026 indicators
FY2026 results
Officer in charge
Medium and long term
Compliance with laws and
regulations, and responding to
system changes
Social demands for strengthening
corporate governance
Medium and long term
Practicing sustainability
management aimed at
enhancing corporate value
-
Number of meetings of the Board of Directors/
Nomination and Compensation Advisory Committee
-
Attendance rate of officers at meetings in 1. above
-
Content disclosure on effectiveness evaluation of the
Board of Directors
-
Disclosure of results
-
Disclosure of results
-
Disclosure of contents of effectiveness
evaluation
-
23 meetings (17/6)
-
Attendance by directors at meetings
-
Evaluation of the effectiveness of the
Board of Directors
Takehiko Inada
Medium and long term
Delays in creating new products
and new businesses due to
decreased competitiveness in
R&D
Decline in product demand due
to changes in customer needs
Medium and long term
Creating new markets by
developing new products and
businesses that address social
issues
Early response to changes
in customer needs and
strengthened regulations
-
Promotion of development in the three key themes
-
Number of new inventors
-
Number of intellectual property education sessions for
Toyobo and Group companies
-
At least 75%
-
At least 30 people
-
20 times
-
83% (10 out of 12 organizational tasks
achieved)
-
46 people
-
23 times
Toshiyuki Oya
Partnerships
(supply chain)
Short, medium, and long term
Negative impact on business
activities due to illegal actions or
compliance violations by suppliers
Short, medium, and long term
Securing social sustainability
and long-term competitive
advantage
-
Ratio of CSR procurement surveys returned (conducted
every other year)
-
Ratio of reduction in CO2 emissions (intensity) related to
logistics (sales)
-
90% or more
-
Reduction of 0.5% year
on year
-
99% (As of July 2026)
-
Increase of 1.6% year on year
Taichi Sakai
Partnerships
(stakeholder
engagement)
Short, medium, and long term
Short, medium, and long term
Failure to fulfill accountability
Building strong trust
leading to unestablished trust with relationships with diverse
stakeholders
stakeholders
Reputational risk
-
Number of press releases
-
Number of dialogue sessions with investors
-
Frequency of engagement with stakeholders
-
Number of meetings with employees and labor unions
-
At least 75
-
At least 150
-
At least 3 times
-
60 times
-
84 cases
-
127 cases
-
4 times
-
72 times
Norio Iizuka
4. Takehiko Inada
Short, medium, and long term
Gaining customer trust,
maintaining good relationships
with business partners, and
improving competitiveness
-
Promotion of information security measures
Renewal of network security infrastructure
Renewal of computer security infrastructure
-
Number of information security training sessions
-
Number of incidents (e.g., information leaks, service
outages)
-
100% completion of renewal
-
15 sessions
-
0 incidents
-
Renewal completion 100%
-
26 times
-
0 incidents
Tetsuro Yabuki
Data security, privacy
Short, medium, and long term
Information leaks, system failures,
or stoppages due to cyberattacks
Loss of customer trust,
deterioration of relationships with
business partners, and decreased
competitiveness
Short, medium, and long term
Business activity stagnation, loss
of social credibility, and damage
to corporate value
Short, medium, and long term
Establishing a stable
management foundation
Strengthening risk management
systems
Fostering a culture of compliance
awareness
-
(1) Positive survey responses:
-
Improvement of compliance awareness
80% or higher
(1) Sufficient dissemination of top management messages
(2) Positive survey responses:
(2) Actions mindful of compliance
80% or higher
(3) Enhancement of compliance study sessions and
(3) 100% attendance by mandatory
various training programs
participants; at least 12 awareness
-
Awareness and use of the compliance consultation desk
materials issued
(1) Awareness of the compliance consultation desk
-
(1) Positive survey responses:
(2) Existence of a desk where employees can consult or
95% or higher
report with confidence and trust
(2) Positive survey responses:
(3) Disclosure of the number of cases handled by the
70% or higher
compliance consultation desk
(3) Disclosure of actual results
-
Number of serious violations of laws and regulations
-
Disclosure of actual results
-
(1) 90%
(2) 96%
(3) Compliance study sessions
Attendance rate of mandatory
participants: 100%
Distribution of key awareness-raising
materials: 27 times
-
(1) 96%
(2) 76%
(3) 100 cases
-
0 cases
Takehiko Inada
- 100%
- 100%
Toshiyuki Oya
Governance
Innovation
Business foundation domain
April 1, 2026
Indicators
Compliance
Compliance (R&D,
intellectual property)
-
Achievement rate of education and anti-fraud activities
related to R&D
-
Implementation of audits related to compliance with
intellectual property regulations
-
100%
-
100%
Some indicators do not cover all Group companies.
Corporate value
TOYOBO REPORT 2026
Introduction
Commitment to
realizing our vision
Economic value
Social value
Toyoboʼs earning power
Management strategy to
enhance earning power
Value creation story
Achieving sustainable growth
Business
strategy
Business development
strategy
Human resource
strategy
Green strategy
Sustainability strategy
Corporate
governance
Data
26
Contribution through business
Business portfolio reforms
Business strategy
p.15
Main business directions
(¥bn)
250.0
Fibers and Textiles
¥80.5 billion
Real Estate
and Others
¥21.3 billion
p.30
Films
¥175.2
billion
Films
p.27
5%
421.6 billion
¥
Life
Science
26%
8%
Environmental
and Functional
Materials
¥110.1 billion
Life Science
¥34.5 billion
p.28
Note: Figures are presented based on the revised reporting segments.
Figures for the revised segments have not been audited by the
independent auditor.
Changed the name of the previous Functional Textiles and Trading to
Fibers and Textiles.
Reclassified some businesses previously included in Functional Textiles
and Trading into Others.
25.0
15.0
15.0
100.0
10.0
10.0
50.0
5.0
5.0
2023 2024 2025 2026
2029
2031
0.0
(FY)
2023 2024 2025 2026
2029
2031
25.0
0.0
(%)
eratin
eratin
rofit
rofit mar in
25.0
20.0
150.0
15.0
15.0
100.0
10.0
10.0
50.0
5.0
5.0
2023 2024 2025 2026
2029
2031
2023 2024 2025 2026
2029
2031
25.0
Net sales
20.0
0.0
(FY)
(¥bn)
(¥bn)
250.0
0.0
(FY)
(%)
eratin
eratin
rofit
rofit mar in
25.0
20.0
200.0
20.0
150.0
15.0
15.0
100.0
10.0
10.0
50.0
5.0
5.0
0.0
2023 2024 2025 2026
2029
2031
(FY)
0.0
2023 2024 2025 2026
2029
2030 Medium-Term Management Plan direction
This segment will shift its strategy from profit growth driven by volume
expansion to value creation with a stronger focus on capital efficiency.
Under an integrated divisional management structure, we will elevate
our business foundation by optimizing our portfolio and appropriately
allocating management resources. Specifically, we will improve the
productivity of our production equipment, implement value-based
pricing, and improve our cash conversion cycle (CCC). Through these
initiatives, we will build a resilient business foundation capable of
generating stable earnings even amid rapid changes in the business
environment. We will also reinvest the funds generated in growth
initiatives, creating a virtuous cycle of sustainable value creation.
(FY)
(¥bn)
Net sales
20.0
200.0
0.0
Environmental
and Functional
Materials
rofit
rofit mar in
150.0
250.0
42%
(%)
eratin
eratin
20.0
(¥bn)
FY2026
consolidated net sales
p.29
25.0
200.0
0.0
19 %
(¥bn)
Net sales
2031
(FY)
0.0
2030 Medium-Term Management Plan direction
This segment will steadily ramp up production at its new equipment and
plants to achieve an early return on investment. We will also expand the
business by bolstering our supply capacity in line with market growth. In the
Biotechnology business, we will strengthen our global sales capabilities
by clarifying the roles of our overseas sites and establishing continuous
cultivation technology for raw enzymes for biochemical diagnosis. In the
Medical business, we will expand sales of hollow fiber membranes for
artificial kidneys through our collaboration with NIPRO CORPORATION. In
the Pharmaceuticals business, we will secure new contract manufacturing
projects and improve profitability. In addition, we will promote technological
integration across businesses and expand into new fields, building a
foundation for sustainable growth through co-creation with partners.
2030 Medium-Term Management Plan direction
This segment will continue its business portfolio reforms in response to
changing market conditions, focusing on the priority areas of electronics
materials, environment, and mobility. We will concentrate management
resources in these areas and actively leverage external resources to advance
our overseas expansion, new business development, and intellectual property
strategy. In the electronics materials field, we will leverage our adhesive and
organic synthesis technologies to expand our presence in the semiconductor
and electronic materials markets. In the environmental field, we will transform our
business from supplying materials to providing integrated solutions, including
after-sales support. In the mobility field, we will respond to growing demand for
lightweight materials and other evolving needs. We will pursue these initiatives
with a sense of urgency and remain firmly committed to achieving our targets.
Corporate value
TOYOBO REPORT 2026
Introduction
Commitment to
realizing our vision
Economic value
Toyoboʼs earning power
Management strategy to
enhance earning power
Business strategy
Films
Value creation story
Social value
Achieving sustainable growth
Business
strategy
Business development
strategy
Human resource
strategy
Green strategy
Sustainability strategy
Corporate
governance
Data
27
Creating value through materials technologies as one
Films Division, driving sustainable growth and shaping
the future of society and everyday life
Masanao Kudo
Senior Managing Executive Officer
Head, Films Division
Division operating policy
“Harnessing our expertise in materials, together
with fresh ideas and innovation, to create a
sustainable living environment and bring smiles and
inspiration around the world”
In the past, the overall films market continued to expand, allowing
each business to pursue its own optimization and still achieve solid
earnings growth. In recent years, however, the business environment
has become far more volatile, driven by rising raw material and
fuel costs, the rapid depreciation of the yen, inflation, and shifts in
demand. Against this backdrop of increasing uncertainty, we believe
it is essential for the entire Films Division to work as one, allocating
management resources from the perspective of overall optimization to
build a robust business foundation capable of withstanding changes in
the business environment and generating stable earnings.
Business environment and strengths
The strength of this segment lies in its integrated technologies
spanning polymerization, film formation, and coating, together with
the broad product portfolio built on those technologies. Built on the
technological expertise Toyobo has cultivated over many years, we
deliver high levels of functionality, environmental performance, and
cost competitiveness. These strengths enable us to provide solutions
for a wide range of market needs, from cutting-edge fields such as
space and semiconductors to everyday applications including food
packaging, creating new business opportunities.
Review of the 2025 Medium-Term Management Plan
Under 2025 MTP, we made significant capital investments in growth
areas. However, delays in bringing new production equipment online,
coupled with delays in passing on higher raw material, fuel, and
other costs, meant that the recovery in earnings took longer than
anticipated. As a result, performance fell significantly short of our
original plan.
By business, Packaging film struggled with delays in ramping up
new production equipment and deteriorating market conditions.
However, structural reforms and a review of our pricing strategy have
led to improved profitability. Industrial film was initially affected by
the slowdown in the semiconductor market, but demand has recently
begun to recover, and the utilization of new production equipment
has steadily increased. Meanwhile, our display-related business, where
Toyobo holds a strong market position, remained solid.
2030 Medium-Term Management Plan strategy
Under 2030 MTP, we are shifting from a strategy focused on profit
growth through volume expansion to one that emphasizes capital
efficiency, centered on how we utilize capital employed to create
sustainable value. By optimizing the portfolio across the entire Films
Division and appropriately allocating management resources, we will
reinforce our business foundation.
Specifically, we are focusing first on maximizing the productivity of
our capital investments. We will optimize our portfolio by increasing
production capacity for strategic products such as release film for
MLCC, COSMOSHINE SRFTM polarizer protective film for LCDs, and
PYLEN EXTOPTM, our ultra-high rigid oriented polypropylene (OPP)
film, and shifting our focus toward higher-profit businesses. In addition,
we will enhance profitability through disciplined value-based pricing.
To further improve capital efficiency, we will optimize inventory levels,
shorten lead times, review payment terms, and improve our cash
conversion cycle (CCC). By working as one Films Division, we aim to
improve ROA by business and contribute to enhancing the Company s
overall ROE.
Through these initiatives, we will build a resilient business foundation
capable of generating stable earnings even amid rapid changes in the
business environment. At the same time, we will reinvest the funds
generated in growth initiatives, creating a virtuous cycle of sustainable
value creation.
Under 2030 MTP, our strategy for Packaging film is to build a stable
earnings base by securing healthy spreads, ensuring a stable supply of
packaging materials that are essential to everyday life, and improving
our portfolio through the expansion of environmentally friendly and
functional products. In Industrial film, we have identified the display
and semiconductor fields, where our technological strengths can
be fully leveraged, as priority areas. We will strengthen our supply
capabilities and further enhance the value of our products.
We will also lay the foundation for expansion into growth fields such
as energy, semiconductors, and the space industry by leveraging
our proprietary materials and technologies, including PEN film and
XENOMAXTM, a high heat-resistant polyimide film, while keeping an
eye on medium- to long-term market trends. By doing so, we will
create the next generation of earnings drivers, solidify our position as
a category leader in the high-performance films market, and achieve
sustainable growth.
Strengthening execution on the ground
In managing the Films Division, we have consistently emphasized
operating as one division with a focus on overall optimization. Previous
medium-term management plans were developed by building
strategies for each business individually before integrating them at
the divisional level. As uncertainty in the business environment has
increased, however, the limitations of this approach have become
increasingly apparent.
2030 MTP marks a shift in direction. We have reassessed our business
structure as one Films Division and rebuilt our strategy from an overall
optimization perspective. Decision-making is now being guided
by a division-wide view rather than individual business priorities.
Organizational reforms are also helping us optimize the allocation
of human resources and encourage greater personnel exchange
across departments, promoting knowledge sharing and enhancing
organizational capabilities.
Looking ahead, we will continue developing the next generation
of leaders and expand our marketing capabilities through training
programs that foster talent capable of creating value from a marketdriven perspective. We are also advancing digital transformation (DX)
across the division by making better use of data and information to
improve operational efficiency and accelerate higher-quality decisionmaking. Together, these efforts will build the organization and develop
the talent needed to support sustainable growth.
Corporate value
TOYOBO REPORT 2026
Introduction
Commitment to
realizing our vision
Economic value
Toyoboʼs earning power
Management strategy to
enhance earning power
Business strategy
Life Science
Value creation story
Social value
Achieving sustainable growth
Business
strategy
Business development
strategy
Human resource
strategy
Green strategy
Sustainability strategy
Corporate
governance
28
Data
Achieving stable, sustainable growth
through business expansion and improved
capital efficiency
Kazuhito Ikeda
Director and Managing Executive Officer
Head, Life Science Division
Business environment and strengths
In the Biotechnology business, the market for enzymes used as raw
materials for biochemical diagnostic reagents is expected to continue
growing steadily, particularly in emerging economies, while demand
for enzymes used in genetic testing research reagents is becoming
increasingly diverse. We will meet these market needs by leveraging
our strong global brand and advanced production technologies in
genetic engineering, cultivation, and purification.
In the Medical materials business, meanwhile, the number of
patients requiring dialysis membrane modules continues to grow,
particularly in emerging markets. In collaboration with our partner,
NIPRO CORPORATION, we will expand sales of our naturally derived
hollow fiber membranes for artificial kidneys, which offer excellent
biocompatibility and stable filtration performance.
Review of the 2025 Medium-Term Management Plan
Under 2025 MTP, we made significant capital investments. In the
Biotechnology business, however, contributions from our new
production equipment took longer than expected to materialize.
This was compounded by declining demand for infectious disease–
related products and sluggish sales at our overseas operations. In the
Medical materials business, establishing new technologies to increase
production and reduce costs at our integrated manufacturing plant
for hollow fiber membranes for artificial kidneys also required more
time than anticipated. As a result, earnings came under pressure
as investments outpaced returns. We are now ramping up our new
equipment and plant and working to improve productivity.
Under 2030 MTP, our first priority is to stabilize production at our new
equipment and plant and accelerate investment recovery. We will improve
asset efficiency, strengthen the production technologies that underpin
future growth, and enhance our supply capabilities to meet growing
market demand, thereby expanding the scale of our business. Reflecting
on the lessons learned from the previous medium-term management
plan, we will also sharpen our framework for assessing investment risks.
In the Biotechnology business, we will bolster our global sales capabilities
by redefining the roles of our overseas operations and establishing
continuous cultivation technology for enzymes used as raw materials
for biochemical diagnostic reagents. Although this technology requires
highly sophisticated innovation, it offers a significant improvement in cost
competitiveness over conventional production methods.
In the Medical materials business, we will work with NIPRO
CORPORATION to expand global sales of our hollow fiber membranes
for artificial kidneys. In the Pharmaceuticals business, we will leverage
our upgraded production plant to secure new contract manufacturing
projects, delivering stable and sustainable earnings growth.
In the future, we will also promote the integration of technologies
across our businesses and expand into new fields from the perspective
of delivering value throughout the patient journey. Although the three
businesses offer different products, they are united and integrated
around biotechnology as a common core technology and share a
culture of continually taking on new challenges that has been passed
down since the business was founded. We are already combining
our biotechnology and membrane technologies to expand sales of
exosome purification membranes while developing new applications,
including membranes for pharmaceutical manufacturing processes.
We will also deepen the collaborative relationships established by my
predecessor by building stronger ties at the executive level, further
increasing the momentum of our business. Through these efforts, we
are ensuring that ROA by business exceeds 8% and contributing to
higher overall ROE for the Company.
(Prevention)
(Testing)
Established Future expansion
Integration
(Prognosis)
2030 MTP
initiatives
Enhance cost
competitiveness
Enzymes used as raw materials for
biochemical diagnostic reagents
Biotechnology
2030 Medium-Term Management Plan strategy
Value proposition areas across the patient journey*
- The process through which people interact with healthcare
Awareness and
Consultation
Support and
Treatment
information gathering and diagnosis
follow-up
Research reagents and diagnostic Enzymes used as raw materials for nucleic
reagents for genetic testing
acid pharmaceutical manufacturing
Diagnostic systems
(Establish continuous
cultivation technology)
Expand into
high-value-added fields
(Therapeutic applications)
Integration of biotechnology and membrane technologies (e.g., exosome testing and treatment)
Medical materials
“Enriching everyday lives through engaged
employees and the advancement and integration of
distinctive technologies”
In the Pharmaceuticals business, the U.S. Food and Drug Administration
(FDA) lifted its Warning Letter, and earnings improved as we
implemented product price revisions and secured high-value projects.
Integration of biotechnology
and membrane technologies
Artificial kidney hollow fiber
Accelerate
application
Acute blood purification membranes development
Membranes for pharmaceutical
manufacturing processes
Medical devices and
coating materials
Pharmaceuticals
Division operating policy
Pharmaceutical CMO
(Blood purification
and pharmaceutical
manufacturing
processes)
Synergies in therapeutic
applications (Biotechnology)
Strengthening execution on the ground
Having spent much of my career at manufacturing sites, I have witnessed
many businesses being forced to withdraw from the market. Those
experiences have shaped my belief that our people should never be put in
a position where they are fighting a losing battle. Only when our employees
thrive can we create value for our stakeholders. My role is to provide clear
direction and support so that our people can work with enthusiasm, find
purpose in their work, and pursue a common goal together.
To achieve this, I will combine the business management foundation
established by my predecessor with the management practices
I helped develop at TOYOBO MC Corporation. We are linking
everything from divisional policies to individual goals through a unified
management system and using it as the basis for dialogue during visits
to our workplaces. When people truly understand and embrace our
direction, it shapes their actions. As those actions spread and resonate
throughout the organization, they become a driving force for change.
Because execution always begins on the ground, ensuring everyone is
moving in the same direction is our highest priority. Through ongoing
dialogue and greater visibility, I will continue to communicate policies
that reflect the realities of our workplaces. As one example, I have
spent more than a decade sending employees birthday messages by
email. It is a small gesture, but one that I find deeply rewarding.
Corporate value
TOYOBO REPORT 2026
Introduction
Commitment to
realizing our vision
Economic value
Toyoboʼs earning power
Management strategy to
enhance earning power
Business strategy
Environmental and
Functional Materials
Value creation story
Social value
Achieving sustainable growth
Business
strategy
Business development
strategy
Human resource
strategy
“A solutions company delivering materials plus value
in three priority fields”
Overall strategy
Globally, businesses are being called upon to respond to geopolitical
risks and tightening environmental regulations. In Japan, meanwhile,
inflation and accelerating industry consolidation are rapidly reshaping
the business environment surrounding TOYOBO MC Corporation.
Against this backdrop of significant change, we believe that
maintaining the status quo itself is a risk.
We bring together TOYOBO CO., LTD. s technological expertise and
development capabilities with Mitsubishi Corporation s market insight
and intelligence. This combination makes us a unique company. By
leveraging our ability to anticipate market needs, we aim to maximize
the value of our products through initiatives such as joint development
with customers. The value created by combining the strengths of both
companies defines our identity.
Review of the first three years
We operate more than 10 businesses. Since our establishment, we
have boosted collaboration across them by introducing a functional
division system encompassing sales, production, and R&D. We have
also classified each business into one of three strategic categories
Growth, Cash cow, and Transformation to strengthen our revenue
base from the perspective of overall optimization.
In the Nonwoven materials business, we reviewed our domestic
production structure, including the divestiture of two domestic
subsidiaries. We have also made progress on initiatives with
the potential to become future earnings drivers, including joint
development projects with OEMs led by the Mobility Business Strategy
Unit and the creation of new products expected to find applications in
the semiconductor and electronic materials fields.
Sustainability strategy
Corporate
governance
29
Data
Executing business portfolio reforms and
boldly allocating resources to growth areas
Naoki Fujii
Managing Executive Officer
Head, Environmental and Functional Materials Division
President & Representative Director, CEO TOYOBO MC Corporation
(primarily TOYOBO MC Corporation)
Division operating policy
Green strategy
2030 Medium-Term Management Plan and
fiscal 2027 business strategy
We believe ours is a company destined for growth. Continuing to reform
our business portfolio in response to changing market conditions is
essential to achieving sustainable growth. Indeed, our establishment was
itself a transformation undertaken to ensure our businesses continue to
grow over the next 10 to 20 years.
Our medium-term management plan established in fiscal 2027 marks a
fundamental shift in the way we manage our business, building on the
culture of embracing change that we have fostered since the business
was launched. We will concentrate management resources on our
three priority fields Electronics materials, Environment, and Mobility
where strong market growth is expected. Rather than relying solely on
organic growth, we will actively pursue acquisitions and other external
growth opportunities while steadily expanding overseas and advancing
new business development. We will also enhance our intellectual
property strategy to build a framework that ensures we win through
technology and succeed in business. Looking further ahead, we will
establish development themes for different time horizons and allocate
management resources accordingly.
In the electronics materials field, we will expand our presence in the
semiconductor and electronic materials markets by leveraging our core
adhesive and organic synthesis technologies. We will also deploy financial
leverage, including through inorganic initiatives, to invest in M&A and
business infrastructure.
In the environmental field, we will build on our core technologies, including
spinning, to transform our business from selling materials to delivering
integrated solutions that combine materials, equipment, and after-sales
support. Examples include lithium concentration and recovery applications
using HOLLOSEPTM hollow-fiber BC membrane and the use of K-FILTERTM
activated carbon fiber as an adsorbent for volatile organic compound
(VOC) recovery and per- and polyfluoroalkyl substances (PFAS) removal.
In the mobility field, we will accelerate the commercialization of products
that draw on our technological strengths to meet growing demand for
lightweight solutions driven by vehicle electrification. We will also bolster
our cost competitiveness by leveraging local partners overseas.
By pursuing these initiatives with urgency and an unwavering commitment
to achieving our goals, we will improve ROA by business and realize our
vision of Solving global issues with high-performance materials.
Current portfolio
Concentrate resources in priority fields
Growth
Engineering plastics
VYLONTM and HARDLENTM
Environmental solutions
Electronics materials
High-speed communications
Advanced packaging miniaturization
Low-dielectric materials
Cash cow
Photo-functional materials
Fine chemicals
High-performance fibers
Environment
Resource recycling (e.g., lithium)
Emissions reduction (e.g., PFAS)
Decarbonization
Transformation
Nonwoven materials
Mobility
Lightweighting
Electrification
Recycled materials
Strengthening execution on the ground
Execution begins with a strong determination to succeed. We aim to
build a strong organization in which every employee takes ownership,
thinks independently, and acts accordingly. To achieve this, we believe
it is essential to share as much information as possible. We therefore
communicate openly and continuously about our position within the
industry, the challenges we face, and the direction we are taking.
Since our first year of operations, members of senior management
have visited our sites in Japan and overseas each year to engage
directly with employees. In fiscal 2027, I plan to visit every domestic
and overseas site myself and speak with all our employees. By
tailoring my message to each audience, I will repeatedly communicate
the purpose behind the establishment of our Company and the
strategy of our medium-term management plan, helping employees
see how it relates to their own work and fostering a stronger sense of
unity across the organization.
I was especially encouraged when an employee working on the front
line of a business that had been underperforming told me that, for the
first time, they understood where their business fit within the company
and wanted to think more deeply about how they could contribute.
Moments like that reaffirm the importance of open dialogue.
The knowledge and expertise we have accumulated at TOYOBO MC
will also be shared across Toyobo. As President of TOYOBO MC, I will
actively contribute to discussions within Toyobo and further expand
personnel exchanges at the operational level.
Corporate value
TOYOBO REPORT 2026
Introduction
Commitment to
realizing our vision
Economic value
Toyoboʼs earning power
Management strategy to
enhance earning power
Value creation story
Achieving sustainable growth
Business
strategy
Business strategy
“Trading and manufacturing businesses that
challenge one another and grow together”
Overall strategy
The Fibers and Textiles Division comprises both manufacturing
businesses, which generate earnings through a fixed-cost model,
and trading businesses, which generate earnings through a
variable-cost model.
To improve ROA by business, our manufacturing businesses need
to focus on maximizing earnings by steadily reducing production
costs and improving capacity utilization. Our trading businesses,
meanwhile, must focus on optimizing the asset base by reducing
working capital and improving capital efficiency. As a trading
company with manufacturing capabilities, we must also increase
earnings by planning and developing highly differentiated products.
To achieve this, the Division has established four guiding principles:
- formulating business strategies based on objective data rather
than assumptions or preconceived ideas; 2) working with integrity
alongside all stakeholders; 3) promoting products and businesses
capable of generating appropriate returns; and 4) trusting our
colleagues and continuing to grow together. As someone with a
technical background, I regard the first principle as the foundation
of everything we do, and it will be a particular focus going forward.
Textiles
In the Textiles business, we have prioritized improving the operating
profit margin over pursuing sales growth. We have also withdrawn
from unprofitable businesses and worked to reduce capital
employed by consolidating operations at the Toyama Production
Business development
strategy
Human resource
strategy
Green strategy
Sustainability strategy
Corporate
governance
Data
30
Let the data speak and earn trust
through objective decision-making
Fibers
and Textiles
Division operating policy
Social value
Tadao Kuroki
Managing Executive Officer
Head, Fibers and Textiles Division
Center into the Shogawa Plant and carrying out structural reforms
at affiliated companies. As a result, the business returned to
profitability in fiscal 2024.
Textiles business draws on a number of strengths, including
advanced composite spinning technologies developed over many
years, integrated planning capabilities spanning everything from
spun yarn to finished products, and a strong brand presence in
specialty fabrics for the Middle East. In addition, TOYOBO STC Co.,
Ltd., combines trading and manufacturing capabilities, giving it a
unique competitive advantage.
Going forward, we will expand applications for knitted materials,
particularly in high-comfort uniforms and other apparel. We will
also boost our industrial materials business, including infrastructure
applications such as waterproofing materials. At the same time,
we will further enhance our planning and sales capabilities while
working with partner companies on product planning, development,
and manufacturing, rather than relying solely on our own production
capabilities, creating mutually beneficial relationships.
We will continue to focus our resources on areas where we have
a competitive advantage, reduce working capital, and improve
capital efficiency. Through these efforts, we aim to improve ROA by
business and achieve our hurdle rate.
Airbag fabrics
We have been engaged in the Airbag fabrics business for more than
30 years, building a strong foundation of accumulated technologies
and expertise. Our original plan was to expand the business through
our operations in Japan, Thailand, the United States, and China,
achieving greater scale, reducing costs, and improving profitability.
We have since revised our strategy, consolidating our operations in
Thailand to streamline the business and elevate its competitiveness.
Specifically, in February 2026, we transferred our equity interest
in our Chinese airbag fabric manufacturing and sales subsidiary
to another company. In March 2026, we dissolved our Thai airbag
fabric sales subsidiary and transferred its sales functions to our
airbag fabric manufacturing subsidiary in Thailand. We also plan to
dissolve our U.S. airbag fabric sales subsidiary and begin liquidation
proceedings in September 2026.
Going forward, we will consolidate our operations in Thailand to
establish an integrated production system spanning everything
from yarn to airbag fabric. We will also improve production
efficiency by consolidating nylon fabric product lines and expand
sales of polyester airbag fabrics. In addition, we will strengthen our
partnerships to meet customers global demand for a stable supply
while improving profitability and achieving the hurdle rate for ROA
by business. We expect the business to return to profitability in the
second half of fiscal 2027 as the benefits of this consolidation begin
to materialize.
Strengthening execution on the ground
Metrics such as ROE and ROA by business are primarily
management metrics. To be meaningful on the front lines,
however, they must be translated into practical actions tailored
to each role. For example, in our manufacturing operations, the
focus is on maximizing earnings by reducing costs to improve
marginal profit margins. In sales, the emphasis is not only on
increasing earnings through pricing initiatives but also on
improving the asset base by accelerating cash collection and
reducing inventories to shorten the cash conversion cycle (CCC).
To reinforce the principle that safety always comes first, I also
make a point of visiting our operations regularly to ensure this
mindset is firmly embedded throughout the organization. In
the Airbag fabrics business, I have long made regular visits to
our overseas sites. Going forward, I will also regularly visit our
Textiles plants and affiliated companies, both in Japan and
overseas.
Every visit brings new insights. Beyond confirming that safety
standards are being upheld, I can see firsthand whether our
operations are running smoothly. Visits to our overseas sites
also give me a deeper understanding of local cultures. One of
the greatest rewards is seeing our employees greet me with a
smile.
Corporate value
TOYOBO REPORT 2026
Introduction
Commitment to
realizing our vision
Economic value
Toyoboʼs earning power
Management strategy to
enhance earning power
Value creation story
Social value
Achieving sustainable growth
Business
strategy
Business development
strategy
Human resource
strategy
Green strategy
CTO message
Toshiyuki Oya
Executive Officer
Chief Technology Officer (CTO)
Controlling Supervisor, Research
and Business Development Division
Bridging technology and the market
Since joining the Company, I have built my career around research
and development (R&D), gaining experience across a wide range
of roles, including corporate research, product development
within our business divisions, overseas assignments, and business
development. Along the way, I have been involved in every stage of
the process, from creating new businesses to working directly with
customers. Much of my career has been spent in technical fields
closely aligned with our business divisions, working directly with
our operations and customers. Those experiences have provided
a strong foundation for translating technology into business.
In April 2026, I was appointed Chief Technology Officer (CTO).
I take the responsibility that comes with this role seriously and
approach it with both a strong sense of purpose and healthy
determination. Until now, I have viewed technology and our
businesses primarily from the perspective of R&D within individual
business divisions. Going forward, however, I believe it is my
responsibility to take a Company-wide view of the technologies
and R&D activities across all our businesses and provide
leadership in these areas.
During the development of the 2030 Medium-Term Management
Plan (2030MTP), we repeatedly discussed what truly distinguishes
Toyobo Group. We consistently came back to two fundamental
strengths: our people and our technology. The challenge now is
Transforming the power
of people and technology
into market value to create
new growth businesses
how to leverage those strengths to create new businesses. It is not
enough simply to advance technology; we must also turn it into
commercially viable businesses. I believe that serving as the bridge
between technology and business is the fundamental role of the
CTO.
The Group has long fostered a culture of steadily building on its
technological expertise and continuously creating high-quality
products, rooted in its long history in the Textile business. This
culture underpins the strengths in our people and technology that I
mentioned earlier and forms the foundation of our businesses today.
At the same time, there have been occasions when our pursuit
of technological excellence has made it more difficult to connect
our innovations with what customers truly need and the value they
can create for society. We must incorporate a stronger marketing
perspective and more closely align the strengths we have cultivated
with market needs and social challenges. It is no longer enough
simply to create outstanding products. We must turn the value
sought by customers and society into reality.
Advancing R&D themes toward commercialization
and creating the next generation of growth businesses
Looking back on the period of the 2025 Medium-Term
Management Plan, we made significant progress in
advancing several priority R&D themes to the point where
Sustainability strategy
Corporate
governance
Data
31
commercialization is now within reach. One of the most
important milestones was the transfer of our environmentally
friendly, high heat-resistant adhesive film for bonding dissimilar
materials, developed using a new cross-linked resin known as a
Vitrimer,* from the research laboratory to the business division.
We also completed the transfer of CATAROSEVTM, our exosome
purification filtration membrane, to the Life Science business
division and have now begun commercial sales.
It is immensely rewarding to see technologies we have
developed through R&D reach the market and receive positive
feedback from customers. I believe that the steady progress of
these priority themes reflects the results of our efforts to select
and focus our R&D themes.
Looking ahead to the period of the 2030MTP, our priority is to
grow these technologies into major businesses. CATAROSEVTM is
currently used primarily for research applications, but we believe
it has the potential to significantly expand the business through
industrial applications, including drug discovery. We are also
preparing a second and third wave of products following the
basic Vitrimer* formulation. Rather than positioning Vitrimer* as
a single product, we aim to develop it into a family of products
that will form the foundation of a new business. By translating
the results of our R&D into sustained business growth, we will
accelerate the creation of new value that is uniquely the Group.
- Vitrimer is a registered trademark of FONDS ESPCI PARIS.
Creating new value in growth areas by
leveraging our core Polymer and Biotechnology
Until now, the Group has identified four core technologies
synthesis, polymerization, and modification; biotechnology; molding
and processing; and analysis and simulation and has leveraged
them to develop high-performance materials and products that
address social challenges. To provide a clearer and more accessible
framework for all stakeholders, however, we have redefined our
core technologies under the 2030MTP as two core technologies:
Polymer and Biotechnology.
These two core technologies have each evolved and expanded
independently over many years in distinct technological fields
and business domains. Going forward, however, we will focus
on creating new value by integrating these technologies and
exploring the areas where they intersect.
C TO MESSAGE
Corporate value
TOYOBO REPORT 2026
Economic value
Toyoboʼs earning power
Commitment to
realizing our vision
Introduction
Social value
Management strategy to
enhance earning power
Value creation story
Achieving sustainable growth
Business
strategy
Business development
strategy
Human resource
strategy
Green strategy
CTO message
Semiconductor value chain and Toyobo Group product portfolio
ront end roce
Wafer fabrication
Patterning
Back grinding and dicing
Polishing corrosion-inhibiting agents
Wafer carriers
(engineering plastics)
Probe materials
Wastewater treatment membranes and exhaust gas
treatment systems (front-end to back-end processes)
a
le
u erior eat
re i tance co
to T
fil
O
O
C
O
O
Cover tape
elea e fil
il
or inter o er
a
PET[Polyethylene Terephthalate]
C
CH2
O
CH2
n
Packaging
ub trate and relea e fil
u ed or relea e fil
PEN[Polyethylene 2,6-Naphthalate]
ared
roduct
ac end roce
C
C
O
O
O
CH2
CH2
n
Furthermore, under the 2030MTP, we established strategic value
proposition areas based on our core technologies for the first time.
In defining these areas, we carefully assessed long-term market and
technology trends, as well as changes in the business environment.
We also conducted a comprehensive evaluation of the strategic fit
and competitive advantages of our core capabilities in combination
with our broader management resources, including our supply
chain, manufacturing and R&D infrastructure, human capital, and
customer base. Based on this assessment, we identified three
growth areas: Environment and energy, Advanced materials, and
Healthcare.
Toyobo Groupʼs value proposition areas
p.22
Creating new growth opportunities in the
semiconductor market
The semiconductor market is one of the key growth areas within
our Advanced materials value proposition area. Although the
Group is not widely recognized as a semiconductor company, a
closer look at our businesses and technologies reveals areas where
we can leverage our strengths. For example, derivative products
based on our release film technology for multilayer ceramic
capacitors (MLCCs) have already established a strong presence in
certain back-end semiconductor manufacturing processes. Rather
than entering the market from scratch, we are repositioning the
le
ig
Substrates and assembly
Films for printed circuit boards
Solder resist, FPCs
ondin heet re in and film
eat re i tant ol i ide fil
i en ional tabilit co arable to
gla and ilicon a er
o bined it t e oot ur ace
and better roce abilit o fil
T
inter o er
Semiconductor chip
nter o er
Semiconductor package substrate
Motherboard
technologies and customer base we have built over many years
within the context of the semiconductor industry. We believe this
approach will open up new opportunities for growth.
The semiconductor industry is characterized by distinct dynamics
in its front-end and back-end processes, and it is the back-end
process where the Group is focusing its efforts. In the backend process, development toward higher levels of integration is
accelerating, and the pace of change is extremely rapid. Success
therefore depends on working closely with lead users, earning
their trust, and rapidly deploying our development resources
where they can have the greatest impact.
The foundation for this approach lies in the technological
capabilities we have built through our unwavering commitment
to manufacturing excellence, as well as in the trust we have
earned from our customers. Our sales teams work closely with
customers to gain a deep understanding of their underlying
needs and connect those insights with our R&D teams in a
timely manner. By working alongside our customers throughout
the evaluation process, we refine our development direction as
we move forward. This close customer engagement, combined
with the speed of our decision-making, is one of the Group s
key strengths in creating value in the semiconductor market. By
making the most of our existing infrastructure, technologies, and
customer base, we will turn our speed of development and close
customer relationships into lasting competitive advantages. I
Sustainability strategy
Corporate
governance
Data
32
believe this approach best reflects the Group s strengths.
Going forward, we will refine our core technologies and enhance
our proposal capabilities for the semiconductor market. We see
particularly strong potential in expanding XENOMAXTM, our high
heat-resistant polyimide film, for interposer applications, as well
as into substrate and release films for semiconductor packaging
materials. We also plan to expand the use of TEONEXTM PEN
film in applications requiring higher heat resistance than PET.
Our approach is to start with a vision of where the market is
heading and work backward to identify the technologies and
customer needs that will shape its future. We will bring partners
and customers together in a spirit of co-creation, advancing
development as one team. In doing so, we will help drive innovation
in the semiconductor market through the Group s technologies.
Enhancing the replicability and sustainability
of research and business development
To translate the core technologies we redefined as Polymer
and Biotechnology under the 2030MTP into new businesses, it
is not enough simply to define them at a high level. We must
break them down further according to their applications and
functions, then refine them into strengths that are unique to
the Group. COSMOSHINE SRFTM, our super retarder film, is a
good example. It was developed by building on the material
design, film-forming, and processing technologies we have
cultivated over many years through PET film development and
demonstrates how deepening our technological expertise can
create new value.
To date, the Group has grown its businesses much like a tree,
with textiles serving as the trunk and businesses such as Films
and Life Science branching out from it. Going forward, we need
to bring together the technologies and expertise cultivated
across those branches to create new core technology domains
that will form the next trunk of our business.
To achieve this, we must enhance both the replicability needed
to continuously generate new themes rather than treating
each success as a one-time achievement and the sustainability
needed to keep that cycle of innovation moving forward.
Biomanufacturing, which uses genetic technologies to harness
the capabilities of microorganisms and cells to produce
environmentally friendly materials and chemicals, is a prime
C TO MESSAGE
Corporate value
TOYOBO REPORT 2026
Introduction
Commitment to
realizing our vision
Economic value
Social value
Toyoboʼs earning power
Management strategy to
enhance earning power
Value creation story
Achieving sustainable growth
Business
strategy
Business development
strategy
Human resource
strategy
Green strategy
Sustainability strategy
Corporate
governance
33
Data
Intellectual property
Business development strategy
Materiality indicators
CTO message
Intellectual property
strategy
example of this approach. By combining our Polymer and Biotechnology capabilities, we will
create new technological domains that go beyond the boundaries of our existing technologies.
Above all, however, the most important factor in supporting this R&D is our people. Systems and
processes can be designed in many ways, but it is the curiosity and initiative of each individual
that brings them to life and leads to new ideas. I encourage everyone involved in R&D to
cultivate not only deep technical expertise but also broad perspectives and an insatiable curiosity
about the world beyond our Company. Curiosity cannot simply be taught, but interacting with
diverse people and gaining experience outside the Company can fundamentally change the way
we think and generate new ideas.
Cross-functional collaboration within the Company is equally essential to fostering curiosity and
generating new ideas. To ensure that these connections endure beyond the tenure of any individual
CTO, we will codify our approach to research and business development as a management
policy and embed it throughout the organization. By transforming technologies and talent that
have traditionally been optimized within individual organizations into Company-wide innovation
capabilities, and by connecting technology with the market as well as internal and external expertise,
we will build a sustainable cycle of new business creation that is unique to the Group.
To promote commercialization supported by Toyobo Group s technological expertise and R&D
capabilities, we have worked to strengthen our intellectual property foundation. In particular, in
priority areas, we seek to enhance business competitiveness by securing not only fundamental
patents covering the relevant technologies but also surrounding patents.
The 2030 Medium-Term Management Plan builds on our strength in patent filings while sharpening
our focus through greater selectivity and concentration. Rather than using intellectual property solely
for protection, we will promote Intellectual Property (IP) activities that create value. Specifically, we will
monetize underutilized patents through licensing and outright transfers, and advance open innovation
by securing foundational patents before pursuing external collaboration. Through these initiatives, we
will maximize the value of our intellectual property by carefully balancing risk and return.
We are also reviewing our patent portfolio based on profitability and market growth potential and
further concentrating our resources on priority areas. In addition, we are improving the efficiency of
our intellectual property investments by optimizing our country-specific filing strategy and making
greater use of licensing. Although both our patent holdings and the number of patent applications
declined in fiscal 2026 as a result of our more selective approach to intellectual property, we continued
to file patent applications in priority areas and further strengthened our high-quality patent portfolio.
To monitor outcomes, we will introduce the concept of IP ROIC as a new performance indicator to
improve the visibility of the efficiency of our intellectual property investments. At the same time,
we will strengthen dialogue among our intellectual property, R&D, and business teams to maximize
the value of our intellectual property by both enhancing the quality of our patent portfolio and
promoting its strategic utilization.
Solving social challenges through technology to create future value
Social value and economic value are often described as the two wheels that drive a business
forward. I see them differently. To me, there is only one wheel. Rather than two separate wheels
turning in parallel, social and economic value must be integrated into a single wheel that
drives the business forward. By solving society s challenges and creating value that benefits
our customers, we earn their trust and their business. Economic value is the natural result of
delivering that value.
I believe this way of thinking is also reflected in the Group s corporate philosophy, Jun-Ri-SokuYu (Adhering to reason leads to prosperity). By identifying the value society needs and applying
the technologies and expertise the Group has cultivated to solving
those challenges, we deepen the trust we build with our customers.
I believe that, in turn, this leads to new research themes and new
business opportunities.
As CTO, I will continue to ask how we can best leverage the Group s
technologies, people, and organizational strengths to address the
challenges facing our customers and society, and translate those
efforts into the realization of our value creation story.
Patent portfolio map
Indicators and fiscal 2026 results for Innovation and
Compliance (R&D, Intellectual Property) p.25
Number of patent applications
Display
1,500
1,481
1,350
1,480
1,356
1,200
Semiconductors
Films
1,030
900
600
300
Recording/
Printing
0
Batteries
(FY)
Fibers/
Environment
Number of patents held
8,000
6,000
Toyobo/TOYOBO MC
Toyobo/TOYOBO MC domains
Customer domains
2022 2023 2024 2025 2026
Note: Each point in the diagram represents a patent. The
patents are positioned based on technological
similarity to provide an overview of the distribution
of and relationships among technology domains.
Semiconductor-related materials are an important theme within the advanced
materials value proposition area and one of our core growth areas. We are expanding
the film and resin technologies cultivated in the display field into semiconductor
applications, where we believe Toyobo Group can leverage its strengths.
6,389 6,511
6,862 6,996 6,821
4,000
2,000
0
2022 2023 2024 2025 2026
(FY)
Japan
Overseas
Corporate value
TOYOBO REPORT 2026
Introduction
Commitment to
realizing our vision
Economic value
Toyoboʼs earning power
Management strategy to
enhance earning power
Value creation story
Social value
Achieving sustainable growth
Business
strategy
Business development
strategy
Human resource
strategy
Green strategy
Sustainability strategy
Corporate
governance
Data
34
Business development strategy
Toyobo-Transformation (TX): Management transformation through a DX-enabled Value creation revolution
Toyobo-Transformation (TX), an initiative promoted by Toyobo Group, is a broader concept than digital transformation (DX). Rather than focusing solely on digital technologies,
it represents a comprehensive management transformation̶a “revolution” to add value̶that integrates changes across our organization, people, business processes,
and corporate culture. Led by senior management, TX is a core initiative supporting the “Foundation establishment and strengthening” pillar of the 2030 Medium-Term
Management Plan. It also serves as the common foundation that enhances the effectiveness of our business, green, and human capital strategies.
Through TX, we will integrate the technologies the Group has cultivated with data and digital technologies to accelerate value creation and drive our evolution into a stronger
company.
From developing infrastructure to achieving growth
The evolution of TX and the acceleration of
value creation
To date, TX has focused on developing the infrastructure needed to drive
productivity reforms by strengthening our IT infrastructure and transforming
head office operations. Over the past two years, we have invested approximately
¥2.8 billion and generated benefits of approximately ¥2.0 billion. Beginning in
fiscal 2027, as we enter the second half of Sustainable Vision 2030, TX will shift
its focus from developing infrastructure to achieving growth. In response to the
growing labor shortage and changes in the business environment, we will build
on the data and systems infrastructure and the operational reforms established
to date, expanding our initiatives beyond productivity improvements to create
added value through manufacturing transformation and business co-creation.
As a result, we expect these initiatives to generate benefits of at least ¥13.0
billion from fiscal 2027 onward. Going forward, we will continue to deepen
our productivity reforms while accelerating investment in manufacturing
transformation. By integrating data utilization and AI implementation across
everything from shop floor operations to management decision-making, we will
maximize the impact of our investments and accelerate business growth.
Transformation of manufacturing
Improvement of cash flow
through a radical review of SCM
Tetsuro Yabuki
Executive Officer, CDO and CISO
Controlling Supervisor, Toyobo
Transformation and Business
Innovation Division
TX steps to accelerate and drive business innovation
In fiscal 2026, TX advanced the reallocation of management
resources by building on the results achieved through business
process reforms. Using the Films business as a model, we accelerated
the transformation of manufacturing and business co-creation while
beginning to create new added value. At the same time, as part of
our long-term initiative to transform our organizational culture, we
further clarified the competencies required of TX personnel and
strengthened our implementation framework. The first phase of
our core systems renewal was completed as planned, establishing
the IT infrastructure for Company-wide deployment in fiscal 2027.
We also expanded the use of Agentic AI, primarily across head
office functions such as human resources, accounting, and legal, to
automate staff operations while accelerating the Company-wide
use of data and AI. These initiatives are also enabling us to make
better use of the technologies and expertise accumulated across
the Group. By leveraging our accumulated knowledge to improve
productivity in R&D activities, we are further strengthening our
competitive advantage.
Work closely with operations
(Deepen understanding)
Engage in discussions from a
business perspective
(Execute the basics)
Co-create new businesses and
contribute to business expansion
(Build lasting trust)
Infrastructure and security
Infrastructure and security
Infrastructure and security
FY2024
FY2026
FY2031
●
Achieve
Sustainable
Vision 2030
●
●
Create added value
Launch of
TX initiatives Develop infrastructure
and improve productivity
2025 2026 2027 2028 2029 2030 2031 (FY)
¥
2.8 billion
2.0 billion
¥
¥
¥
5.4 billion
6.0 billion
●
●
0.3 billion
7.2 billion
Reduction of issues and shortening
of response time through the
utilization of internal knowledge
Transformation of productivity
and creation of added value
Automation of accounting and
other staff tasks through the
use of Agentic AI
¥
¥
Exploration of automation
through robotics and physical AI
●
Faster decision-making and
increased productivity through
data-driven management
Increased productivity in R&D activities
through utilization of past knowledge
COLUMN
TX in practice: Working alongside those on the shop floor to solve problems
As TX has progressed, the Group has expanded its efforts beyond improving operational efficiency to working directly
with those on the shop floor to identify challenges and support their resolution. At the Inuyama Plant, we made previously
dispersed reports on issues and operational know-how visible and accessible, promoting data-driven improvements. As a
result, some operations have reduced workload by approximately 40 hours per month. The shop floor has also shifted from
processing data to using data to inform decision-making. In practical terms, discussions have evolved from identifying
the causes of problems to focusing on action plans, fostering a culture of proactive continuous improvement. Through
these initiatives, a movement is taking hold on the shop floor, transforming work from tasks employees simply have to
do into activities they undertake proactively because they recognize their value and benefits. This has led to steady and
meaningful changes in behavior. By embedding TX personnel on the shop floor to provide end-to-end support from
identifying issues through implementation we are strengthening both commitment and execution.
Going forward, we will continue to put TX into practice by expanding shop floor–driven transformation to improve
business processes and enhance our corporate value.
Hiroya
Sakakura
Toyobo
Transformation and
Business Innovation
Department
Corporate value
TOYOBO REPORT 2026
Introduction
Commitment to
realizing our vision
Economic value
Toyoboʼs earning power
Management strategy to
enhance earning power
Value creation story
Social value
Achieving sustainable growth
Business
strategy
Business development
strategy
Human resource
strategy
Green strategy
Sustainability strategy
Corporate
governance
Data
35
Human resource strategy
Toyobo’s human capital management vision
In formulating the 2030 Medium-Term Management Plan (2030 MTP), we engaged in extensive discussions among our executive officers about Toyoboʼs value creation process. Through
these discussions, we reaffirmed that our greatest strength lies in our people and organization. To realize our value creation story, we established three aspirations from the perspectives
of people, organization, and culture: developing “Talent for co-creation and transformation,” building an “Agile and resilient organization,” and fostering a culture that provides “Well-being
and fulfillment at work.” Through these initiatives, we aim to accelerate value creation for society while creating a virtuous cycle of growth for both our company and our employees.
Corporate philosophy framework TOYOBO PVVs
People
Ideals we seek to realize
Talent for co-creation and
transformation
Talent who thrive and create new value across
organizational and company boundaries
Inputs (initiatives)
Outputs (progress indicators)
Developing people, creating opportunities, and fostering
dialogue so that employees embrace change and achieve
transformation
Improvement in internal
collaboration score
Promotion of collaboration and job rotations across divisions
1 on ALL
Provision of opportunities for co-creation with external partners and active
support of such initiatives
Improvement in co-creation
contribution score
Culture
Organization
Human capital management aligned with the business strategy
Agile and
resilient organization
An organization that adapts to change and
leverages talent through optimal deployment
Identification of talent requirements necessary to implement the business
strategy
Strategic deployment of talent across divisions and businesses
Management policy
Implementation of development programs for next-generation leaders and
on-site leaders
Recruitment producing diversity
Encouraging self-directed learning and growth, simultaneously
enabling individual and corporate growth
Well-being and fulfillment at work
A workplace where diverse talent grow
together and experience a sense of security
and fulfillment at work
Initiatives that promote self-directed learning and enhance both fulfillment
at work and a tangible sense of growth
Fostering an organizational culture that embraces diversity
Ensuring a safe workplace environment that supports employee well-being
2030 Medium-Term Management Plan
Value creation story
Improvement in rate of successor
readiness for key positions
Improvement in human capital
ROI
Improvement in employee
engagement score
Improvement in workplace environment
score for harnessing employee potential
Corporate value
TOYOBO REPORT 2026
Introduction
Commitment to
realizing our vision
Economic value
Toyoboʼs earning power
Management strategy to
enhance earning power
Value creation story
Social value
Achieving sustainable growth
Business
strategy
Business development
strategy
Human resource
strategy
Green strategy
Sustainability strategy
Corporate
governance
Data
36
Human resource strategy
Ideals we seek to realize (1)
Talent for co-creation and transformation
Talent who thrive and create new value across organizational and company boundaries
To enhance the reproducibility of our value creation story, we aspire to foster the active engagement of “Talent for co-creation and transformation” who create new value across organizational
and company boundaries. Through initiatives that promote collaboration within the Company and co-creation with external partners, we will cultivate human capital that can respond flexibly to
changes in the business environment and drive transformation to completion.
Developing people, creating opportunities,
and fostering dialogue so that employees
embrace change and achieve transformation
We believe that the starting point for the human capital needed
to realize our business strategy lies in the transformation of each
employee s mindset and behavior. In formulating the 2030 MTP, we
also revisited our core strengths and recognized that co-creation with
customers and external partners has been a key factor underpinning
our value creation. We concluded that one of our strengths is a culture
in which individuals with a strong commitment to driving change and
those who support them respect one another and collaborate closely,
and that this strength should be further reinforced.
Accordingly, we define co-creation and transformation as the core
human capital that will drive our future growth by combining the cocreation capability to create value together with diverse stakeholders
and the change capability to pioneer new value and businesses beyond
conventional boundaries. To cultivate such people, we will strengthen
collaboration in the workplace through systems and dialogue that
support employees proactive challenges and efforts to drive change,
while promoting initiatives that lead to a more vibrant organization.
Visualizing our aspirations
The internal collaboration score reflects the qualities of talent who
achieve business results and create value through collaboration
across organizational and professional boundaries. In addition,
recognizing that co-creation with customers and partners lies
at the heart of Toyobo s value creation story and competitive
advantage, we have established the co-creation contribution score
as an indicator to measure the extent to which initiatives that
create new value have become embedded in our organization.
We are currently refining the approach to measuring the specific
indicators and aim to begin full-scale implementation in fiscal
2028 after confirming their effectiveness and practical applicability
in the workplace. Beyond establishing the indicators themselves,
realizing our aspirations will require developing human capital
that can drive transformation through internal and external
collaboration and creating opportunities for dialogue. We will
therefore promote the following initiatives.
Initiatives
Promotion of collaboration, job rotations, and dialogue
across divisions
● Career challenge system (in-house recruitment)
This system is designed to support employees in proactively
expanding their careers and provide opportunities to take
on new roles. It is also positioned as an initiative to optimize
the deployment and development of talent while enhancing
employee engagement.
● Improvement and development proposal program
We invite employees to submit proposals for improving operations
and enhancing technology, and recognize outstanding proposals
through an awards program. This initiative helps foster a sense of
participation in management, create a more vibrant workplace, and
drive operational improvements and greater efficiency.
Creating opportunities for dialogue that strengthen
organizational capabilities
We implement the 1 on ALL program, in which all members of
each workplace share their individual goals regardless of position
or grade. Through dialogue that deepens mutual understanding,
the program fosters a stronger sense of individual roles and
responsibility for work, encourages employees to take ownership
of workplace goals, and promotes proactive action.
COLUMN
Advancing environmentally
friendly packaging
through three-company
collaboration
Comments from a representative
of Fuji Baking Group Co., Ltd.
Adding environmental value to Neo Butter RollsTM was a major
challenge for us. Although we sought to reduce plastic usage,
we also needed to maintain product freshness and print quality,
presenting significant technical challenges.
A turning point came when Toho Packaging, Inc., with which we
had worked for many years, introduced us to TOYOBO CO.,
LTD. Toyobo s PYLEN EXTOPTM offers excellent printability and
processability in bread packaging applications. Compared to
conventional OPP film, it enables the film to be approximately
20% thinner, reducing environmental impact while maintaining
product quality. We were able to add the new value of
environmental sustainability to the long-loved Neo Butter RollsTM
through the collaboration of our three companies.
(From left)
(From left)
Ms. Shinoda and Ms. Oikawa
Marketing Department,
Fuji Baking Group Co., Ltd.
Mr. Hongo and Mr. Tsuruya
Sales Department, Head Office
Toho Packaging, Inc.
Corporate value
TOYOBO REPORT 2026
Introduction
Commitment to
realizing our vision
Economic value
Social value
Toyoboʼs earning power
Management strategy to
enhance earning power
Value creation story
Achieving sustainable growth
Business
strategy
Business development
strategy
Human resource
strategy
Green strategy
Sustainability strategy
Corporate
governance
Diversity, Equity, & Inclusion (DE&I)
Data
37
Human Resource Management
Human resource strategy
Ideals we seek to realize (2)
Agile and resilient organization
An organization that adapts to change and leverages talent through an optimized talent portfolio
We aim not only to enhance the capabilities of individual employees but also to strengthen the organizationʼs overall capacity to create value. Through talent management aligned with the
business strategy, we optimally deploy talent in response to changes in the business environment and business strategy. In doing so, we are strengthening the depth and flexibility of our human
capital and building an organization capable of sustaining long-term growth.
Human capital management aligned with
the business strategy
We define human capital management aligned with the business
strategy as ensuring that people with the right capabilities are
placed in the right positions at the right time, in numbers that
meet business needs. Based on this approach, we identify the
roles and skills required to support our priority areas in line with
our business portfolio, clarify the talent profiles we need, and
promote talent acquisition and optimal deployment.
We are also promoting the deployment of talent across divisions
and businesses in line with the business strategy. In addition, we
are developing management policies for our major divisions that
define how they are managed and operated, together with the
values and guiding principles that underpin decision-making and
employee behavior.
Visualizing our aspirations
We have established the rate of successor readiness for key
positions as an indicator to visualize the agility and resilience of
our organization. This indicator measures whether we have the
organizational capabilities needed to execute our strategy over
the medium- to long-term. By ensuring that multiple successors
are prepared for each key position, we are strengthening the
human capital foundation needed to sustain strategy execution
and drive ongoing transformation.
We have also established human capital return on investment (ROI)
as an indicator to demonstrate the outcomes of initiatives that
promote internal collaboration, co-creation with external partners,
and the self-directed growth of diverse talent, while monitoring
the relationship between investment in human capital and the
value created.
placing employees in roles that leverage their expertise and strengths
while strengthening collaboration across divisions, we maximize
individual capabilities and optimize the organization as a whole.
Initiatives
Developing the next generation of management and
successors for key positions
We operate the Company-Wide Human Resource Meeting, which primarily
discusses successors for Company-wide management positions, and the
Departmental Human Resource Meeting, which discusses successors for
departmental management positions and positions requiring a high level
of professional expertise. By linking these two forums, we promote talent
deployment across departments and businesses, while systematically
developing and continuously cultivating management talent to support
the sustainable growth of the organization as a whole.
To develop the next generation of management, we provide selected
employees with structured internal and external training programs. We
also offer opportunities to gain experience in business management
and corporate management functions, helping to develop the
management perspective needed for future leadership roles.
Human capital management framework linking CompanyWide and Departmental Human Resource Meetings
Company-Wide
Human Resource Meeting
Departmental
Human Resource Meeting
Attended by
Attended by
President, Controlling
Supervisors*1, etc.
Controlling Supervisors,
Operating Department Heads*2, etc.
For
All management personnel
Alignment
For
Business and Corporate
Division*3 personnel
Agenda
Agenda
Selection, training, and rotation of talent
Selection, training, and rotation of talent
*1 Oversees each business division and administration division *2 Oversees specific fields across multiple business divisions
*3 Corporate departments including corporate planning, management and administration, and human resources
Strategic deployment of talent across divisions and businesses
We use career development sheets to identify employees career
aspirations and preferred job functions, and reflect this information,
together with the needs of each division, in personnel assignments. By
Recruitment producing diversity and talent development
We promote a range of initiatives, including advancing women s
participation in the workplace, recruiting professionals with experience
at other companies, achieving and maintaining the legally prescribed
employment rate for persons with disabilities, and supporting the
active participation of middle-aged and senior employees.
COLUMN
Promoting diversity through the employment of
persons with disabilities
We view the employment of persons with disabilities not only as part of
our corporate social responsibility but also as a practical opportunity for
employees to deepen their understanding of diversity, and we actively
promote these efforts. We believe that creating employment opportunities
for persons with disabilities in local communities and supporting their active
participation also contributes to the development of those communities.
In recruiting persons with disabilities, we provide reasonable accommodations,
including designing roles that take individual disabilities into account and carefully
selecting appropriate workplaces. We also support long-term employment by
assigning workplace mentors and providing onboarding and workplace adaptation
support through the department responsible for human resources and labor relations.
We will continue to promote the employment of persons with disabilities
in light of the increase in Japan s legally prescribed employment rate for
persons with disabilities to 2.7% in July 2026.
As leader of the Administrative Support Team, comprising
employees with disabilities, I provide day-to-day guidance
and support to help create a workplace where every team
member can work with confidence.
Working together, both employees with and without
disabilities sometimes face moments of uncertainty. Even
so, I feel that awareness of diversity is steadily growing
across the Company, as more people recognize that
everyone, not just people with disabilities, has their own
individual characteristics.
Yoshimasa Nakao
Human Resources and Labor
Relations Department
Corporate value
TOYOBO REPORT 2026
Introduction
Commitment to
realizing our vision
Economic value
Social value
Toyoboʼs earning power
Management strategy to
enhance earning power
Value creation story
Achieving sustainable growth
Business
strategy
Business development
strategy
Human resource
strategy
Green strategy
Sustainability strategy
Corporate
governance
Diversity, Equity, & Inclusion (DE&I)
Human resource strategy
Materiality indicators
Data
38
Human Resource Management
Items under “Human capital,” indicators, and fiscal 2026 results
p.24
Ideals we seek to realize (3)
Well-being and fulfillment at work
A workplace where diverse talent support one another and experience well-being and fulfillment at work
To develop “Talent for co-creation and transformation” and build an “Agile and resilient organization,” it is essential to foster a culture in which diverse talent can perform to their full potential
and experience fulfillment at work and a tangible sense of growth. Through such a culture, we seek to deepen mutual trust between the Company and its employees and build relationships in
which both contribute to value creation.
Encouraging self-directed learning and
growth, simultaneously enabling individual
and corporate growth
Toyobo is promoting initiatives that encourage self-directed learning
and growth to foster a culture in which diverse talent can maximize
their potential and experience fulfillment at work and a tangible sense of
growth. These initiatives are designed to enhance employees sense of
ownership and willingness to contribute, while deepening the mutually
supportive relationship between the Company and its employees. By
enhancing motivation and skills, we also aim to improve employee
engagement and organizational performance, creating a virtuous cycle
that drives higher corporate value and sustainable growth.
Initiatives to enhance fulfillment at work
and a tangible sense of growth
Review of the performance evaluation forms
Beginning in fiscal 2026, we strengthened the operation of our
personnel evaluation forms by clarifying the process for setting
individual goals aligned with higher-level policies and enhancing
feedback on final evaluations, with the aim of increasing
employees sense of accomplishment and motivation.
Providing opportunities for self-directed learning
We provide a wide range of learning opportunities, including applicationbased training programs and e-learning courses for self-development,
enabling employees to acquire the knowledge and skills they need
based on the expectations of their roles and their own career aspirations.
Employee-led improvement activities
We promote S-UP activities, in which teams proactively identify,
share, and address workplace issues. The following page
highlights an example of an improvement activity led primarily by
a female employee working on the front lines.
Visualizing our aspirations
To understand the state of our organizational culture, which forms
the foundation for sustainable growth, and identify opportunities for
improvement, we have conducted employee engagement surveys
on a regular basis since fiscal 2021 (annually since fiscal 2025). In fiscal
2026, the results were 52% for Employee engagement (unchanged
from the previous year) and 57% for Environment that empowers
employees (+2 percentage points year on year).
Employee
engagement
Environment that
empowers employees
Positive
responses
Positive
responses
52%
57%
Positive responses
Neutral responses
Negative responses
Scope : TOYOBO CO., LTD.,
TOYOBO MC Corporation,
TOYOBO STC CO., LTD.,
and TOYOBO TEXTILE
CO., LTD.
Survey period: July 2025
Response rate : 96%*
Specifically, we are developing management policies based on the
Company s management strategy, with a focus on our major divisions.
We are also promoting initiatives such as 1 on ALL, under which
employees share their individual goals within the workplace to encourage
each person to take ownership of those goals. We will continue to foster
dialogue at every level, from the workplace to management, to deepen
understanding of the Company s management strategy.
Sustainable Vision 2030 sets out our commitment to putting People
First at the center of our efforts. We aim to create a safe workplace
that supports employee well-being and foster a culture in which
each individual takes pride in their work, finds it rewarding, and
experiences personal growth. To achieve this, it is essential to connect
the Company s management strategy with workplace and individual
roles and goals, while enabling each employee to recognize how
their work contributes to creating value for customers and addressing
social issues. By creating a virtuous cycle in which these efforts
lead to customer recognition and improved business performance,
which in turn support employee growth and new challenges through
appropriate evaluation and rewards, we will further strengthen each
employee s sense of fulfillment and ownership.
*+6 percentage points from the previous survey
Until last year, communicating management policies was identified as
a key area requiring improvement. The latest survey showed a marked
improvement in this area. We believe this reflects the impact of
various initiatives, including more frequent communication from senior
management, direct briefings at business sites and plants, Casual
discussion on serious issues between senior management and small
groups of employees, and the introduction of personnel evaluation
forms that align individual goals with management strategy.
At the same time, we recognize that further efforts are needed to
ensure that management policies are fully reflected in day-to-day
actions across the workplace.
1 on ALL session at the Toyobo Transformation and Business Innovation Department
Corporate value
TOYOBO REPORT 2026
Introduction
Commitment to
realizing our vision
Economic value
Social value
Toyoboʼs earning power
Management strategy to
enhance earning power
Value creation story
Achieving sustainable growth
Business
strategy
Business development
strategy
Human resource
strategy
Green strategy
Sustainability strategy
Corporate
governance
Diversity, Equity, & Inclusion (DE&I)
Data
39
Human Resource Management
Human resource strategy
Feature
A more inclusive workplace inspired by frontline insights
We promote S-UP activities, in which teams proactively identify, share, and address workplace issues. Through operational improvements, these activities enhance productivity and safety,
support employee development, and foster a more vibrant workplace. This feature highlights an initiative led by Ms. Kanazawa, the first female employee to work rotating shifts on the
production floor, to improve the work environment and facilities.
Improvement activities inspired
by frontline insights and dialogue
and help foster both the mechanisms and culture
needed to sustain continuous improvement.
The initiative began when team members
recognized the need to reduce the physically
demanding tasks performed by Ms. Kanazawa.
Led by Ms. Kanazawa, the team worked together
to identify tasks that placed a physical burden
on employees, assess the level of strain involved,
and gain a clear understanding of the challenges
they faced. They found that these issues
extended beyond Ms. Kanazawa. Some tasks
were physically demanding regardless of gender,
with age and physical strength also affecting the
level of difficulty. In addition, work performed in
hot conditions was found to place a significant
burden on male employees as well.
Based on these insights, the team continued its
discussions and implemented improvements
such as reducing the weight of heavy items and
redesigning work tools. As a result, the physical
demands of the work were reduced, creating an
environment where people of all ages and genders
can perform their work safely and comfortably.
The initiative demonstrates how drawing on
the perspectives and experiences of individual
employees can drive frontline-led improvements
Promotion of mutual
understanding and collaboration
through diversity
Ms. Kanazawa
checking the
quality of
industrial film
Traditionally, the production floor has been
a male-dominated workplace, and the work
environment was not fully designed with female
employees in mind. Although this initiative
was sparked by Ms. Kanazawa s experiences
on the production floor, it also brought to light
challenges shared by employees regardless of
gender, including those arising from differences
in age and experience. The process of identifying
areas for improvement and evaluating potential
solutions also encouraged greater communication
among team members. By challenging longheld assumptions, the initiative has fostered
a workplace culture of mutual understanding
and collaboration that transcends individual
differences, contributing to organizational growth
built on respect for diversity.
Creating a safe and comfortable
workplace by reducing physical
workloads
This initiative has delivered tangible improvements,
including reduced physical workloads and
enhanced workplace safety. Efforts like these
directly contribute to creating a workplace where
every employee can embrace change, apply their
ingenuity, and perform to their full potential.
Personal growth and mutual
understanding gained through
the initiative
Ruka Kanazawa
Production Department
Utsunomiya Plant
I appreciated the support of my colleagues with
physically demanding tasks, but I also wanted to
be able to work alongside them as an equal. As we
improved our work tools, I explained the proposed
changes to the team members who shared the
equipment and worked to gain their understanding
and support. The initiative created more
opportunities for communication on the production
floor and deepened our mutual understanding.
As a result, I came to appreciate my colleagues
support even more and have become even more
positive in my approach to my daily work.
Shinji Asano
Section Chief
Production Department
Utsunomiya Plant
As someone who serves as a link between the
production floor and management, I approach
my work each day with a strong awareness of
the role I play in bridging the challenges faced
by both. Going forward, I hope to further reduce
imbalances in workloads among operators and
optimize operations across the organization.
We are also establishing a women s working
group to further improve the workplace for
female employees. By encouraging women to
proactively share their perspectives and drive
improvements, we aim to create an even better
working environment across the entire plant.
Runa Nemoto
Production Department
Utsunomiya Plant
The labor-saving tools have not only reduced the
physical demands of my work but also created
more opportunities to interact with my colleagues,
making communication much easier. Building on
these stronger relationships and the improvements
we have achieved together, I hope to continue
enhancing our work processes through initiatives
such as the women s working group.
Corporate value
TOYOBO REPORT 2026
Social value
Toyoboʼs earning power
Commitment to
realizing our vision
Introduction
Economic value
Management strategy to
enhance earning power
Value creation story
Achieving sustainable growth
Business
strategy
Business development
strategy
Human resource
strategy
Green strategy
Sustainability strategy
Corporate
governance
40
Data
Climate Change
Sustainable Vision 2030
Green strategy
Environmental management
Representative Director
Senior Managing Executive Officer
(Co-COO),
Controlling Supervisor of Safety
and Production Technology Division
and Procurement and Logistics
Department
Taichi Sakai
Under our corporate philosophy of "Jun-Ri-Soku-Yu",
Toyobo Group is advancing initiatives to realize a
sustainable society based on Sustainable Vision 2030.
Environmental issues, including climate change, are
critical challenges that have a significant impact on the
foundation of our business. Through my experience at
manufacturing sites, I have come to appreciate their
significance firsthand. Even in the face of uncertainty, I
believe it is essential to tackle these challenges with the
determination and perseverance I have developed on
the front lines and to keep moving steadily forward.
The Group is working toward the realization of
a decarbonized and circular society by reducing
greenhouse gas emissions, making effective use of
resources, and minimizing waste, while also promoting
the proper management of chemical substances and
the conservation of water, air, soil, and biodiversity. We
are also strengthening the value we provide to society
by focusing on the development of products and
technologies that help reduce environmental impact,
including membranes that contribute to the recovery of
reusable materials and pollutants, as well as alternative
materials to replace petroleum-derived resources.
Going forward, we will continue striving to achieve both
growth and a reduction in the environmental impact of
our business activities. At the same time, we will further
strengthen initiatives grounded in our capabilities on
the front lines as we aim to remain a company that
future generations can be proud of.
Highest rating in both the Climate Change and Water Security
categories in CDP’s 2025 assessment
CDP is an international nonprofit organization that surveys and evaluates the environmental
initiatives of companies and local governments. It is widely recognized as one of the world s
leading environmental rating organizations, with its assessments influencing the decisionmaking of investors and businesses alike.
In CDP s 2025 survey, Toyobo was selected for the highest rating, the A List, in both the
Climate Change and Water Security categories. Among more than 20,000 companies
assessed worldwide, Toyobo was recognized as one of the top 4%.
This recognition reflects our efforts to reduce greenhouse gas emissions across our
manufacturing sites, including the fuel conversion of the captive thermal power plant at the
Iwakuni Production Center, as well as our strong water resource management initiatives and
transparent environmental disclosure.
Sustainable Vision 2030 Planet: Contributing to solving social issues with a global perspective
Decarbonized society
Addressing climate change as a top priority
for the planet
What society
expects
Reduce GHG emissions across our business activities and the
entire value chain
Provide solutions that contribute to achieving a decarbonized
society
Accelerate the reduction of GHG emissions from our business
activities and achieve net zero by fiscal 2051
Our targets and
initiatives
Details
p.42
Reduce by more than 46%
by fiscal 2031 (compared with fiscal 2014)
Achieve net zero by fiscal 2051
Contribute to reductions exceeding total GHG emissions across the
value chain by fiscal 2051
GHG
Scope 1 and 2
Avoided GHG emissions
GHG emissions across the value chain
Circular society
Responsibility as a plastics manufacturer
Reduce waste generated from manufacturing processes,
promote recycling, and minimize final disposal
Promote the use of biomass and recycled raw materials and
initiatives that contribute to a circular society
Clean water, air, and soil,
and biodiversity
Enhancing environmental quality, in addition to
reducing environmental impact
Reduce the environmental impact of our business activities
Provide solutions that help ensure clean water, air, and soil
Initiatives to conserve biodiversity
Contribute to a nature-positive future by halting and reversing
the loss of nature and biodiversity
Reduce the use of virgin materials in manufacturing processes
while pursuing greater use of recycled raw materials
Waste generation
15
% reduction (2015 to 2030)
Properly manage chemical substances used in manufacturing
processes and prevent their release into the environment
Environmental impact reduction
60
VOC emissions
% reduction (2014 to 2030)
Hazardous substances discharged to water
bodies
% reduction (2023 to 2030)
80
Corporate value
TOYOBO REPORT 2026
Introduction
Commitment to
realizing our vision
Economic value
Toyoboʼs earning power
Management strategy to
enhance earning power
Social value
Achieving sustainable growth
Business
strategy
Value creation story
Business development
strategy
Human resource
strategy
Green strategy
Sustainability strategy
Corporate
governance
41
Data
Green strategy
Creation of environmental value through our businesses
Based on the Value creation story presented in the 2030 Medium-Term Management Plan, we discuss reverse osmosis (RO)
membranes for seawater desalination as an example of how we create environmental value. Driven by our core technologies and the
capabilities of our people and organization, we create both economic and social value. By strengthening the reproducibility of this
value creation cycle, Toyobo Group will continue to create the solutions needed by people and the planet.
Corporate philosophy framework TOYOBO PVVs
Strengths
People and organizations
Co-creation
Co-creation Collaboration Leveraging external
with customers with partners technologies and
talent
RO membranes value creation story
Phase 4
Phase 3
Phase 1
Identifying the
challenges facing
people and the planet
Phase 2
n the earl
o ulation ro th and indu triali ation led to in rea in l evere ater horta e and
worsening water pollution.
avin evolved from it ori in in otton innin into man made and ntheti fi er the rou ou ht
2
to e and into ne u ine e
levera in the advan ed te hnolo ie it had develo ed in the fi er
field
3
ain t thi a dro the rou e an develo in hollo fi er
mem rane module made from
C
ith the hlorine re i tan e needed for hlorination he module levera e hollo fi er innin
te hnolo develo ed throu h the rou ’ ra on u ine to meet the need for a ta le u l of
hi h ualit ater
1
In 1980, the Group began producing RO membrane modules at its Iwakuni Production Center (at the time). However,
e au e rodu tion a fo u ed rimaril on mall module ro th otential roved limited he rou therefore
turned its attention to large-scale seawater desalination projects in the Gulf countries of the Middle East, where market
demand was substantial.
2 Through outreach to engineering companies, as well as participation in exhibitions and academic conferences, the Group
e ta li hed the relia ilit and re utation of it C mem rane in over ea mar et hi hli htin their e advanta e
in ludin ea e of leanin throu h hlorination a lar e mem rane urfa e area er unit volume and om a t tem de i n
3 In 1981, the Group conducted a seawater desalination demonstration in Saudi Arabia, a promising market, proving that
it te hnolo ould on i tentl rodu e drin in ater meetin orld ealth r ani ation
tandard even
from the hi h tem erature hi h alinit ea ater hara teri ti of the re ion n
the rou ’s membranes were
selected for what was then the world’s largest RO seawater desalination plant in Saudi Arabia, which was being built
under a ontra t a arded to a ma or a ane e en ineerin om an
1
Phase 1
Phase 2
Developing the
solution
Toyobo Groupʼs value creation in action
Reverse osmosis (RO) membranes
for seawater desalination
RO membranes are ultrafine separation membranes that
allow water molecules to pass through while filtering out
impurities such as ions, organic matter, bacteria, and
viruses. They use reverse osmosis, in which pressure is
applied to force water from a more concentrated solution
to a less concentrated one.
Toyobo Group (TOYOBO MC Corporation) is a supplier
of hollow-fiber RO membranes made from cellulose
triacetate (CTA). CTA membranes offer excellent
chlorine resistance, allowing chlorination to reduce
microbial contamination. They are used in seawater
desalination plants in the Gulf countries of the Middle
East, where seawater is characterized by high
temperatures, high salinity, and enclosed waters, helping
to supply high-quality drinking water. Their market share
in Saudi Arabia is approximately 20% (Toyobo estimate).
Technologies
ar e ale over ea ro e t re uired hi hl te hni al ne otiation ith en ineerin
companies. The Group’ re ear her and en ineer traveled to ro e t ite to or lo el ith
their counterparts and address their requirements.
2 In 2010, the Group established Saudi Arabia’ fir t manufa turer and di tri utor of hollo fi er
membranes for seawater desalination through a joint venture with ITOCHU Corporation and a local partner.*
urin it e ta li hment the om an re eived u ort in ludin inve tment environment tudie from the
Japan Cooperation Center for the Middle East (JCCME), an economic cooperation organization. Since then, it
has supplied RO membranes from its local plant to seawater desalination facilities across the Middle East,
helping secure the region’ ater re our e t mem rane a ount for a ro imatel
of the audi
ra ian mar et and rovide ater for the dail need of around
million eo le annuall
Value proposition
Developing core materials to enable social implementation
Advanced
materials
Healthcare
Create customer value
Environment
and energy
Solve social issues
Creating sustainable prosperity for people and the planet
Achieve sustainable growth
Key elements of value creation
Technology advantage
While most competing membranes are made from polyamide
and use a flat-sheet design, the Group differentiates itself with
hollow-fiber membranes made from CTA
Collaboration with partners and integration
of external technologies and talent
To maximize membrane performance, the Group
developed an integrated production process spanning
everything from fiber spinning to module design
Following the adoption of its technology for
demonstration testing at the Water Reuse Promotion
Center, a seawater desalination testing facility, the
Group accelerated its commercialization efforts
People and organizational strengths,
technology advantage
Through a persistent, long-term approach, the
Group established the reliability and
reputation of its technology in overseas
markets
Co-creation with customers, collaboration with partners
By building a trusted relationship with the
Saudi Arabian government and demonstrating
the lower total water production costs enabled
by features such as easy membrane cleaning
through chlorination, the Group steadily
expanded the adoption of its membranes at
the country s seawater desalination plants
1
Phase 3
Creating solutions
through
commercialization
- Established as ARABIAN JAPANESE MEMBRANE COMPANY, LLC, and renamed TOYOBO MC Middle East
ndu trie Com an
C in
Phase 4
Next-generation
solutions
Building on its track record in seawater desalination RO membranes, the Group has expanded into
applications for brine concentration (BC) membranes. These membranes help improve salt
rodu tion effi ien at alt manufa turin lant and horten the lithium re over ro e from
end of life lithium ion atterie
at re lin fa ilitie he rou i al o e andin their u e in
wastewater volume reduction applications aimed at achieving zero liquid discharge (ZLD).
Going forward, the Group will leverage Mitsubishi Corporation’s network to expand local
partnerships and strategic alliances, overcome challenges such as scaling up equipment and
tren thenin en a ement ith end u er and ontinue to re li ate it value reation tor
People and organizational strengths
Researchers and engineers commitment to
working closely with customers to solve
technical challenges
Collaboration with partners and integration
of external expertise and talent
Helping solve challenges facing people and
the planet through the establishment of a joint
venture with ITOCHU Corporation and a local
partner
●
Resource circularity: Contributes to lithium
recovery and reuse at LIB recycling facilities
●
Shorter valuable material recovery process:
Membrane concentration shortens the
downstream evaporation process
●
Reduced energy consumption: Shortening
the evaporation process helps reduce energy
consumption
Corporate value
TOYOBO REPORT 2026
Commitment to
realizing our vision
Introduction
Economic value
Toyoboʼs earning power
Management strategy to
enhance earning power
Value creation story
Social value
Achieving sustainable growth
Business
strategy
Business development
strategy
Human resource
strategy
Green strategy
Sustainability strategy
Corporate
governance
Other environmental initiatives
Green strategy
Materiality indicators
Environmental responsibility Toyobo Group’s 2030 targets
42
Data
For information on other initiatives, including water
resources, please refer to our website.
Indicators and fiscal 2026 results
for a decarbonized and circular society
p.24
Decarbonized society
Toyobo Group recognizes climate change as one of the most critical social issues and acknowledges its impact on our business activities.
We support international climate initiatives, including the Paris Agreement and the Glasgow Climate Pact, and have established a carbon
neutrality road map to reduce our Scope 1 and 2 greenhouse gas (GHG) emissions. Guided by this road map, we are steadily implementing
concrete initiatives, including improving energy efficiency, transitioning away from coal, and expanding the use of renewable energy.
At the Iwakuni Production Center, which accounts for a large share of the
Group s GHG emissions, we completed the planned upgrade of the onsite power plant in October 2023, achieving a substantial reduction in
Scope 1 emissions.
Toyobo Group aims to reduce GHG emissions by at least 46% compared
with the fiscal 2014 level by fiscal 2031 and achieve net zero by fiscal 2051.
These initiatives not only create environmental value but also provide the
foundation for sustainable growth.
Carbon neutrality road map
Transition (low carbon)
26
reduction
Increased
production
Carbon neutrality (decarbonization)
46
Energy
e ficienc
reduction
(energy reduction)
27
Fuel switching
1.21
million t
900,000
t
FY2014
Renewable
electricity, etc.
Key GHG reduction measures
Reduce energy consumption
m rove rodu tion effi ien
Introduce and procure renewable
energy (e.g., solar power,
rene a le ener
ertifi ate
Switch fuels (phase out coal)
Evaluate the introduction of
carbon-free fuels
Decarbonize purchased
electricity
FY2021
GHG emissions
Scope 1 and 2
reduction
Net zero
FY2031
target
Carbon-neutral measures
Switch to carbon-free fuels (e.g., hydrogen and ammonia)
Electrify production processes
Procure carbon-free electricity
Introduce carbon offsets (e.g., CCUS, forest carbon
sequestration)
655,000
t
FY2031
FY2026
result
Reduce by
at least 46 %
(compared with FY2014)
37% reduction
Offsets
GHG emissions
Scope 1
(thousand t-CO )
1,000
800
183
183
182
718
718
712
172
600
400
200
0
659
Scope 2
169
150
615
621
2021 2022 2023 2024 2025 2026
(FY)
FY2051
High-quality water, air, and soil, and biodiversity conservation
Circular economy
Toyobo handles a wide range of plastic products, including its core
film products, and recognizes the transition to a circular economy
as presenting not only business risks but also significant business
opportunities.
As a plastics manufacturer, we are committed to reducing waste
generated in our manufacturing processes, promoting recycling, and
minimizing the volume of waste sent for final disposal.
Waste emissions
Greening rate of film products*
FY2031 target
15% reduction
(compared with FY2016)
60%
FY2026 result
7% reduction
18%
- Technologies and initiatives that reduce the use of petroleum-derived resources
Plastic life cycle and Toyobo Group’s initiatives
to promote resource circulation
Biomass raw
materials
Crude
materials
Chemical
recycling
Material
recycling
Manufacturing
Raw
materials
Used
plastics
Minimize
Reuse
(promoting the use of biomass
and recycled materials, and
volume reduction)
Reduce
Recycling in
manufacturing processes Manufacturing
Environmentally conscious design
Plastic
materials
Consumption
Waste
Through these initiatives,
we are making plastic
products greener
Plastic
products
FY2031 target
Reduce
Manufacturing
We properly manage chemical substances generated in our manufacturing processes
and work to prevent their release into the environment, thereby helping protect the
environment. We also set voluntary standards and reduction targets stricter than
regulatory requirements for chemical substances released into the air and water and
rigorously manage and reduce these emissions.
In addition, based on the recommendations of the Taskforce on Nature-related
Financial Disclosures (TNFD), we are identifying the interfaces between our business
activities and nature, and analyzing the related risks and opportunities.
Environmentally conscious design
FY2026 result
VOC emissions
Discharges of hazardous
substances into water
60% reduction (compared with FY2015)
83% reduction
80% reduction (compared with FY2024)
39% reduction
Scope: TOYOBO CO., LTD., and its domestic consolidated subsidiaries
Corporate value
TOYOBO REPORT 2026
Introduction
Commitment to
realizing our vision
Economic value
Toyoboʼs earning power
Management strategy to
enhance earning power
Value creation story
Social value
Achieving sustainable growth
Business
strategy
Business development
strategy
Human resource
strategy
Green strategy
Sustainability strategy
Corporate
governance
Climate Change
Green strategy
Materiality indicators
Data
ESG Performance Data (Environment)
Indicators and fiscal 2026 results
for a decarbonized and circular society
Disclosure of financial information related to climate change (Disclosures based on the TCFD recommendations)
Toyobo Group endorsed the recommendations of the Task Force
on Climate-related Financial Disclosures (TCFD) in January 2020
and has since advanced initiatives and disclosures aligned with
those recommendations. For details, please refer to the Annual
Securities Report.
Social changes and their
impact
Category
Risks and opportunities
Period
Details
Short
term
Introduction of carbon pricing
Increases in raw material and fuel prices
(e.g., carbon price pass-through)
Governance
Strategy
Transition
risks
Increased costs associated with energy
Medium efficiency initiatives and introduction of
to long high-efficiency equipment, etc.
term
Increased costs due to low-carbon/
decarbonization requirements in
product manufacturing
Increasing calls for reduction or
substitution of petroleum-based resources
Impacts of transitioning
to a decarbonized
society
Increasing demand for low-carbon and
decarbonized materials and products
Changes in policies,
regulations, technologies,
and markets on a broad
scale, etc.
In Sustainable Vision 2030, the Group has identified contributing to the
realization of a decarbonized and circular society as one of the social
issues to be solved through our commitment. In line with the TCFD
recommendations, we analyzed future risks and business opportunities
based on climate change scenarios aligned with the Paris Agreement. After
identifying the impacts of those risks and opportunities and their financial
implications, we established targets and indicators and implemented
countermeasures to enhance the resilience of our business strategy.
Transition
Medium Contribution to greenhouse gas (GHG)
opportunities term
emissions reduction through increased
demand for products
Expansion of renewable energy and
battery storage-related markets
Scenario analysis
Recognizing that climate change impacts and the progress of mitigation
efforts could give rise to a range of possible scenarios, we used the
following representative scenarios as references. For the purposes
of this analysis, short term is defined as approximately three years,
medium term as through 2030, and long term as through 2050.
Decarbonized society transition (1.5 C) scenario: NZE (IEA WEO2025) and others
Severe climate change (4 C) scenario: SSP5-8.5 (IPCC AR6) and others
Risk management
Based on the results of a Company-wide risk assessment, we manage
natural disaster risks-including severe flooding, storm surges, and other
hazards exacerbated by climate change-as key risks for the Group.
p.24
Risks, opportunities, and mitigation measures by scenario
Annual Securities Report
We have established the Sustainability Committee, chaired by the
President and Chief Executive Officer, who has ultimate responsibility
for climate change-related issues. The Committee deliberates on
overarching policies and targets for addressing climate changerelated issues. The Board of Directors receives regular reports from
the Committee, approves important matters such as overarching
policies and targets, and monitors the progress of related initiatives.
43
Reduced productivity due to extreme
heat
Physical risks
Impacts of climate
change progression
Direct damage to assets,
indirect effects from supply
chain disruptions, and
changes in technology and
markets, etc.
Present
to
Disruption of raw material supply due
medium to natural disasters
term
Instability in raw material procurement
Damage to equipment and operational
shutdowns caused by flooding and
storm surges
Increasing demand for civil
engineering projects
Increasing demand for seawater
Medium desalination due to water shortages
term
and droughts
Physical
Increasing demand for Zero Liquid
opportunities
Discharge (ZLD) systems for industrial
wastewater due to freshwater scarcity
Long
term
Increasing demand for infectious
disease prevention and treatment in
response to rising temperatures
Measures taken by Toyobo Group
Promotion of GHG emission-reduction plans (including energy conservation, production efficiency
enhancements, fuel conversion, and adoption of renewable energy)
Use of internal carbon pricing systems
Shift to non-petroleum-based resources
Engagement and collaboration with suppliers such as development of low-carbon raw materials
Diversification of raw material procurement methods (expanding multiple sourcing and local procurement)
Innovation and pursuit of ultra-high efficiency in production processes
Utilization of sustainable finance and transition finance
Enhancement of production efficiency across the value chain such as integration and collaboration
with affiliates, and M&A
Expansion of renewable energy adoption and procurement
Enhancement of production process efficiency and promotion of energy conservation
Cost pass-through to product prices
Acceleration of the shift to recycled and biomass-derived raw materials
Review of general-purpose material businesses reliant on petroleum-based resources
Acceleration of the shift to recycled and biomass-derived raw materials
Innovation in production processes for biotechnology businesses using microorganisms such as
yeast for biomanufacturing
Addressing procurement challenges related to raw materials (recycled and biomass-derived) due
to material scarcity
Promotion of product development and planning with low-carbon and decarbonized materials,
and expansion of sales
Acceleration of the development of innovative low-carbon and decarbonized materials
Strengthening of production and quality management systems for low-carbon and decarbonized products
Collaboration across the supply chain, including with customers, from the perspective of GHG
emissions reduction contributions
Acceleration of product development and planning, and expansion of sales, for products that
contribute to GHG emissions reduction by replacing conventional technologies*
- Including energy-efficient seawater desalination membranes; VOC recovery equipment that eliminates the need for
solvent incineration and enables solvent reuse; water-washable flexo plates and their wastewater treatment systems,
which contribute to reducing GHG emissions from wastewater treatment; materials for fuel cells; and paint replacement
films that eliminate the need for painting, a process associated with high GHG emissions.
Strengthening of product development and planning, and expansion of sales, for renewable
energy and battery storage-related businesses*
Through TOYOBO MC Corporation, a joint venture between Toyobo and Mitsubishi Corporation, anticipation
of megatrends, expansion into overseas markets, and enhancement of solution-providing capabilities
- Including materials for perovskite solar cells; membranes for osmotic power generation; super fibers and films for floating
offshore wind power generation; VOC recovery equipment for lithium-ion rechargeable battery manufacturing plants;
membranes and systems for concentrating valuable materials such as lithium; materials for hydrogen generation systems;
materials for hydrogen carriers; and donor materials for organic thin-film solar cells.
Clarification of the basic policy on heat illness prevention
Appropriate management of the work environment and operations such as installation of shade, air
conditioning, and ventilation equipment, and reduction of continuous work hours in hot and humid workplaces
Expansion of automation of factory operations
Heat illness management for on-site workers using IoT devices
Review of inventory levels and expansion of multiple sourcing
Diversification of logistics routes
Evaluation of alternative raw materials that are less susceptible to the impacts of climate change
Diversification and relocation
Clarification of the basic policy on flood countermeasures
of production bases
Enhancement of the durability of production and utility equipment,
BCP training
and relocation or elevation of facilities to higher ground
Expansion of geotextiles for disaster mitigation and recovery projects*
- Including embankment slope reinforcement sheets, stormwater runoff control layer protection sheets, and weak subgrade reinforcement sheets.
Expansion of production capacity and sales of seawater desalination membranes such as RO and FO membranes1
Development of more energy-efficient and durable RO and FO membranes
Development of systems using high-efficiency BC membranes2
Strengthening of production and quality management systems for RO, FO, and BC membranes
Strengthening the sales capabilities of TOYOBO MC Corporation by leveraging Mitsubishi
Corporation s overseas network
*1 RO: Reverse Osmosis, FO: Forward Osmosis *2 BC: Brine Concentration
Enhancement of the functionality of food packaging-related products and expansion of sales in
response to growing demand for food hygiene
Promotion of research and development of infectious disease-related products and technologies
Corporate value
TOYOBO REPORT 2026
Introduction
Commitment to
realizing our vision
Economic value
Social value
Toyoboʼs earning power
Management strategy to
enhance earning power
Value creation story
Achieving sustainable growth
Business
strategy
Business development
strategy
Human resource
strategy
Green strategy
Corporate
governance
Sustainability strategy
Climate Change
Green strategy
Materiality indicators
44
Data
ESG Performance Data (Environment)
Indicators and fiscal 2026 results
for a decarbonized and circular society
Disclosure of financial information related to climate change (Disclosures based on the TCFD recommendations)
p.24
Indicators and targets
Toyobo Group has set targets for climate change and is advancing various initiatives to achieve them.
Key risks and
opportunities
Key risk 1
Risk of damage
to buildings and
equipment due
to water-related
disasters (e.g., floods,
storm surges)
Key risk 2
Introduction of
carbon pricing
Impact amount
Our main facilities (Tsuruga,
Iwakuni, and Inuyama) are exposed
to water-related risks, which are
expected to increase due to
climate change. An estimate has
been made of the potential loss
of assets at these facilities due to
water damage.
Time frame: 2030s
Estimated asset losses: Up
to approximately
¥68.0 billion*
A carbon price (i.e., carbon tax) of
¥15,000 per tonne of CO is assumed
for fiscal 2031. The estimated carbon
tax burden is compared between
a scenario in which no particular
measures are taken to reduce GHG
emissions (the BAU* scenario) and a
scenario in which such measures are
implemented (the transition scenario).
Time frame: FY2031
Estimated cost savings:
Approximately ¥10.0 billion*
Key risk 3
Increasing calls for
reduction or substitution
of petroleum-based
resources
Key opportunity 1
Increasing demand
for low-carbon and
decarbonized materials
and products
Key opportunity 2
Increasing demand
for advanced water
treatment driven by
freshwater scarcity
Key opportunity 3
Increasing demand
for products that
contribute to
greenhouse gas
(GHG) emissions
reduction
Category
Financial impact
Summary
As society moves toward
decarbonization, demand from
customers and society as a whole is
expected to increase for reductions in
the use of petroleum-based resources
and their substitution with alternative
materials. An estimate has been made
of revenue from low-carbon and
decarbonized materials and products
in the Films business for fiscal 2031.
As climate change progresses
and society transitions toward
decarbonization, demand is expected
to increase for water treatment
membranes and products and
services that help customers reduce
GHG emissions.* An estimate has
been made of fiscal 2031 revenue for
the Environmental and Functional
Materials segment, where many of
these materials and products are
positioned as core businesses.
-
Including energy-efficient seawater desalination
membranes; VOC recovery equipment that
eliminates the need for solvent incineration
and enables solvent reuse; membranes and
systems for concentrating valuable materials
such as lithium; and water-washable flexo plates
and their wastewater treatment systems, which
contribute to reducing GHG emissions from
wastewater treatment.
-
Estimated based on the book
value of the facilities and damage
rates from water-related disasters
(published by the Ministry of Land,
Infrastructure, Transport and
Tourism).
-
Difference in estimated carbon tax
burden between the BAU scenario
and the transition scenario.
• BAU scenario: ¥20.0 billion (carbon
price based on GHG emissions of
approximately 1.3 million tonnes of CO )
• Transition scenario: ¥10.0 billion
(carbon price based on GHG
emissions of 655,000 tonnes of CO )
Time frame: FY2031
Estimated Films segment
revenue from capturing this
opportunity: Approximately
¥130.0 billion*
- Estimated on the assumption that
60% of the fiscal 2031 target revenue
of ¥220.0 billion will be generated
by low-carbon and decarbonized
materials and products.
Time frame: FY2031
Environmental and
Functional Materials
segment revenue:
Approximately
¥150.0 billion*
- Including water treatment
membranes and VOC recovery
equipment, as well as mooring lines
for floating offshore wind power
generation; engineering plastics for
electric vehicles (EVs); battery-related
materials; hydrogen carrier-related
materials; and donor materials for
organic thin-film solar cells.
Indicator
Mitigation costs
Scope 1, 2
Cumulative
FY2023–FY2026
result:
¥17.4 billion
(Partially included
in safety, disaster
prevention, and
environmental
investments)
Partially included
in the Films
segment s FY2026
research and
development
expenses of
¥4.3 billion
A portion of the
¥4.0 billion in R&D
expenditure for
the Environmental
and Functional
Materials segment
in FY2026 falls
under this
category
GHG
Target
FY2051: Net zero
GHG
emissions
Scope 3
(Categories
1 and 11)
Main initiatives
FY2031: 27% reduction* (SBT) Improved energy conservation, enhanced
(Base year: FY2021)
production efficiency, fuel conversion, and adoption
- Equivalent to a 46% reduction
of renewable energy, among others
from the fiscal 2014 level.
FY2031: 12.5%
reduction (SBT)
(Base year: FY2021)
Adoption of carbon-free fuels, renewable energy
procurement, and production process innovation,
among others
Category 1*: Accelerate the shift to recycled
raw materials and biomass-derived materials
- Emissions from activities (e.g., manufacturing) associated with
purchased raw materials and services
Category 11*: Improve the energy efficiency of
VOC recovery equipment, among others
FY2026 performance
14% reduction from
the FY2021 level
(771 thousand t-CO )
Renewable energy
generation in FY2026:
approximately 2.4 GWh
0.2% increase
(2,322 thousand
t-CO )
- Emissions from the use of sold products
Environmental
investments
¥17.4 billion cumulative for FY2023-FY2026 (total investment in safety, disaster prevention, and environmental measures)
Initiatives: Low carbonization of in-house power generation facilities, introduction of renewable energy equipment, and water
damage countermeasures for production and utility facilities (such as relocation to higher ground, elevation, among others)
FY2023–FY2026 performance: Fuel conversion (coal phase-out) at the in-house thermal power plant at the Iwakuni Production
Center, improved energy efficiency across the Inuyama Plant through the expansion of the gas cogeneration system,
installation of solar power generation facilities at the Inuyama Plant, the Utsunomiya Plant, the Research Center, and overseas
subsidiaries, and energy conservation measures for power and utility facilities at each plant, among others.
Internal carbon
pricing
Ongoing since its introduction in FY2023: Internal carbon price set at ¥10,000/t-CO
Used to assess investments in capital equipment and development facilities that increase or decrease CO emissions
Remuneration
Added GHG emissions reduction as a climate change-related metric to the sustainability indicators reflected in executive
remuneration (incentives) (applicable to remuneration paid from July 2025 onward based on fiscal 2025 performance).
Greening rate of film
products
FY2031: 60%
(also established as an indicator
for reducing transition risks)
Desalination
by membrane
technology
FY2031:
Equivalent to the
volume of drinking
water for 10 million
people
Climate-related
opportunities
Air treatment
capacity of VOC
recovery equipment
FY2031: 7 billion Nm³
for lithium-ion battery
per year
separator plants*
- Air treatment capacity of
systems sold and currently
in operation to date
Promotion of mechanical and chemical recycling,
development and increased use of biomassderived raw materials, and reduction in film
volume, among others
18%
Expansion of production capacity and promotion of sales of
seawater desalination membranes (e.g., RO/FO membranes)
Development of more energy-efficient and
5.2 million people
durable RO/FO membranes, among others
Strengthening of production and quality control
systems for RO/FO membranes, among others
Strengthening of sales activities focused on
contributions to customers GHG reductions
(replacement of combustion-based methods)
Enhancement of the sales structure through
TOYOBO MC Corporation
Expansion of sales beyond the storage battery
sector, targeting processing industries such as
printing, films, and seals
Adoption of new technologies, including
further miniaturization and improved energy
efficiency of the equipment
6.2 billion Nm³ per
year
Corporate value
TOYOBO REPORT 2026
Commitment to
realizing our vision
Introduction
Economic value
Social value
Toyoboʼs earning power
Management strategy to
enhance earning power
Value creation story
Achieving sustainable growth
Business
strategy
Business development
strategy
Human resource
strategy
Green strategy
Sustainability strategy
Corporate
governance
Safety, Disaster Prevention
Materiality indicators
Sustainability management
By placing Innovation and the three Ps People, Planet, and
Prosperity at the core, we aim to help solve social issues through
our businesses, creating a virtuous cycle that enhances corporate
value while realizing the prosperous society envisioned in our
corporate philosophy. For Toyobo Group, sustainability means first
ensuring that we ourselves are a sustainable organization and then
continuing to contribute to society s sustainability.
Since fiscal 2026, sustainability strategy planning and the oversight
and promotion of sustainability initiatives have been integrated into
the Corporate Planning Department. By positioning sustainability as
a core management strategy, we develop and promote strategies
aligned with our desired future state and medium- to long-term
management plans.
We incorporate insights gained through engagement with external
stakeholders into our strategic discussions and the development
of initiatives, reflecting them in the review and management of
our materiality indicators. Executive Officers also take an active
role in these efforts to enhance their effectiveness. Through
these initiatives, we will continue strengthening the integration
of sustainability with our management strategy while enhancing
corporate value by simultaneously creating economic and
social value.
Managing Executive Officer
Controlling Supervisor of Sustainability
and Corporate Planning Division
Norio Iizuka
Approach and policy
Contributing to the realization of a sustainable society is integral to
achieving the Toyobo Group s vision: We will continue to create
the solutions needed by people and the earth with
our materials and science. Guided by this belief, the Group
formulated Sustainable Vision 2030 in May 2022, reflecting our
strong commitment to making sustainability the foundation of
our management.
ESG Performance Data (Social)
Indicators and fiscal 2026 results for safety and disaster prevention
1 Management that takes the sustainability of society into
consideration, and thus management that enhances the
sustainability of Toyobo Group
2 Sustainability that builds a solid management foundation:
The axis of our management foundation (ESG)
3 Sustainability that strengthens our competitiveness and drives growth:
The axis of our business (CSV*)
- CSV: Creating Shared Value
Conceptual clarification: Sustainability/CSV/ESG
CSV
Creating social value
through our businesses
(Solving social issues)
Audit and Supervisory Committee
Responding to
society’s needs
ESG
Reducing greenhouse gas emissions, respecting
human rights, and promoting social and
environmental considerations throughout the
supply chain, among others
Controlling
negative
impacts
Avoiding negative
(–) impacts on
society
Board of Management
FY2026 Sustainability Committee
Sustainability Committee
Number of meetings: 6
Risk Management Committee
Compliance Committee
Climate Change and Biodiversity Committee
Business divisions
Themes
Materiality and progress on indicators
Value creation process
Review of the committee structure
and related regulations
BCM and BCP initiatives
Climate change initiatives
Human capital management
Social contribution activities
External ESG evaluations
April
May
Awarded the EcoVadis Bronze Medal (subsequently awarded the EcoVadis Silver Medal in June 2026)
June
Signed a joint development agreement with a U.S. biotech start-up to develop sustainable platform
chemicals for plastic raw materials
Resource Recycling Project received a Special Award at the WorldStar Global Packaging Awards 2025
July
Norio Iizuka, Controlling Supervisor of Sustainability and Corporate Planning Division, spoke at a
symposium hosted by Nikkei Inc. and Nikkei Research
Selected for the third consecutive year as a constituent of all six ESG investment indices adopted by
the Government Pension Investment Fund (GPIF)
2025
2026
Key initiatives
SC836-20, the industry s thinnest 20 m PET film for shrink labels, received plastic recyclability
recognition for APR DesignTM for Recyclability
Published the GHG emission intensity of our films on our website
President
Corporate departments
Having a positive
(+) impact on
society
Key initiatives in fiscal 2026
Month
Board of Directors
Promoting
positive impacts
Business divisions
Business divisions, Corporate departments
Sustainability promotion structure (As of April 1, 2026)
p.24
Policy
Sustainability
Sustainability strategy
45
Data
November
Earned a Bronze rating in the PRIDE Index 2025, an index evaluating initiatives related to LGBTQ+ inclusion
December
For the 2025 assessment by the international environmental nonprofit CDP, Toyobo was selected for
the first time for the prestigious A List in both the Climate Change and Water Security categories
March
Certified as a 2026 Certified Health & Productivity Management Outstanding Organization
(Large Enterprise Category)
Corporate value
TOYOBO REPORT 2026
Introduction
Commitment to
realizing our vision
Economic value
Social value
Toyoboʼs earning power
Management strategy to
enhance earning power
Value creation story
Achieving sustainable growth
Business
strategy
Business development
strategy
Human resource
strategy
Green strategy
Respect for Human Rights
Sustainability strategy
Materiality indicators
Respect for human rights
Approach and policy
Toyobo Group recognizes that respecting human rights is
essential to fulfilling its responsibilities as a member of society
and remaining a trusted company. Under the TOYOBO Group
Human Rights Policy, we actively and systematically promote
initiatives to uphold human rights. We also support and respect
internationally recognized human rights standards, including the
International Bill of Human Rights and the ILO Declaration on
Fundamental Principles and Rights at Work.
The executive responsible for overseeing human rights is the
controlling supervisor of Sustainability and Corporate Planning
Division (Managing Executive Officer).
Initiatives
Human rights due diligence and assessments in
Japan and overseas
In fiscal 2024, Toyobo conducted a labor and human rights
assessment covering its domestic business sites and Group
companies, confirming that there were no violations of laws and
regulations related to human rights, including those concerning
child labor, equal employment, and occupational health and
safety. In fiscal 2025, we conducted a Business and Human Rights
Questionnaire covering all overseas Group companies and
confirmed that there were no serious human rights violations,
such as child labor or forced labor. In addition, for technical intern
trainees, we confirmed that the program was being appropriately
administered, labor-related laws and regulations were being
observed, and human rights were being properly protected
through surveys of host business sites and Group companies,
interviews with the trainees themselves, and on-site inspections.
We also interviewed supervising organizations to verify the
appropriateness of recruitment practices and the costs borne
by trainees. Since March 2025, we have further strengthened
our ongoing monitoring by introducing regular assessments for
technical intern trainees and workers under the Specified Skilled
Worker program.
Internal training
Since fiscal 2024, we have conducted annual business and
human rights training for all employees. By raising awareness
Complaint handling and internal whistleblowing system
We accept human rights–related consultations and reports
through the Grievance Committee and our internal whistleblowing
system, the Compliance Consultation Desks. In addition, we strive
for the early detection and resolution of human rights issues
through compliance surveys.
CSR procurement initiatives of Toyobo Group
To contribute to the realization of a sustainable society throughout
the supply chain, Toyobo Group has established its Basic Policy
on Transactions in Procurement and Logistics and promotes
responsible procurement and logistics. We have also established
the CSR Procurement Guidelines and Green Procurement
Guidelines, through which we ask our business partners for their
understanding, cooperation, and proactive efforts with respect to
human rights and environmental considerations. Most recently,
we revised the CSR Procurement Guidelines in January 2026.
Toyobo Group CSR procurement briefing
In November 2025, we held a Toyobo Group CSR procurement
briefing as part of our training program for approximately 360
major business partners worldwide. The briefing covered our
initiatives related to climate change, respect for human rights,
resource circulation, and our CSR procurement policy, as well
as our Declaration of Partnership Building and our response to
the whistleblower protection system. We also expressed our
commitment to working with our business partners to contribute
to the development of a sustainable society throughout the
supply chain.
We inform our major business partners worldwide about the
CSR Procurement Guidelines, conduct surveys based on these
guidelines, and engage in dialogue based on the survey results,
completing a supplier engagement cycle every two years. The
most recent survey was conducted in fiscal 2026. The evaluation
results are shown on the right.
Supply Chain Management
Data
46
ESG Performance Data (Social)
Items, indicators, and fiscal 2026 results for human rights (Toyobo Group)
of the TOYOBO Group Human Rights Policy and deepening
employees understanding of human rights due diligence, we
promote greater awareness and strengthen sensitivity to human
rights risks. In fiscal 2026, the training was made mandatory for all
managers at Toyobo, ensuring that it is effectively communicated
and embedded throughout the organization, from management
to frontline employees. We also provide opportunities for selfdirected learning through e-learning.
CSR procurement survey
Corporate
governance
Sustainability strategy
p.24
1 Survey overview
Scope: Suppliers representing 90% of total procurement spending
Number of suppliers surveyed: 363
Survey: Adopted the Nikkei Sustainable Link questionnaire
developed by Nikkei Research Inc., which incorporates international
guidelines and external expert insights and covers areas including
human rights, labor, the environment, and fair business practices
Survey categories: Sustainability management, environment, human
rights and labor, fair business practices, supply chain management,
and access to remedy
2 Survey results
Response rate: 99% (as of July 2026)
CSR procurement survey results
D:10%
C:11%
A:25%
B:55%
Risk
No. of
Share
Points band (400-point scale)
assessment
companies of total
A
300 points or
89
25%
78higher
76 points
75
B
101–299
198
55%
87no
67
100 points
or below, with
C
significant human rights risk
39
11%
items
86 identified75
100 points or below,
with
low
88 79 human
D
scores for significant
35
10%
rights risk items
–
–
Total
361
3 Evaluation results
The risk assessment based on the results of this survey uses Toyobo s
own evaluation criteria to assess responses to the Nikkei Sustainable
Link questionnaire. We engaged with business partners that were
assigned a D rating in the previous survey, and as a result, their efforts
to address human rights issues progressed, with many improving
to a C rating or higher. On the other hand, some business partners
were newly assigned a D rating due to revisions to the evaluation
criteria following changes to the questionnaire and changes in the
composition of our business relationships.
4 Future actions
For business partners assigned a D rating, we will request that they
implement improvement measures during fiscal 2027 and engage
with them to promote understanding of and alignment with the
CSR Procurement Guidelines and our human rights initiatives. We
will also designate these business partners as priority follow-up
partners and provide ongoing support to help them make continuous
improvements.
Corporate value
TOYOBO REPORT 2026
Introduction
Commitment to
realizing our vision
Economic value
Toyoboʼs earning power
Management strategy to
enhance earning power
Value creation story
Social value
Achieving sustainable growth
Business
strategy
Business development
strategy
Human resource
strategy
Green strategy
Sustainability strategy
Corporate
governance
Safety, Disaster Prevention
Sustainability strategy
Materiality indicators
Safety and disaster prevention
Toyobo Group regards safety and disaster prevention as the foundation of its corporate activities and
has established the TOYOBO Group Basic Policy on Health & Safety, which applies to employees and
contractors alike, to promote a safe working environment.
We are also firmly committed to ensuring that the lessons and memories of the fire at the No. 2 Plant
of the Tsuruga Research and Production Center on September 6, 2018, and the fatal fire accident at the
Inuyama Plant on September 27, 2020, are never forgotten. To this end, we have designated September
as Disaster Preparedness Month and September 6 as Toyobo Group Disaster Preparedness Day and
continue to carry out awareness-raising activities related to disaster prevention, including fire prevention.
Organizational structure
To ensure the steady implementation of its safety and disaster prevention initiatives, Toyobo Group has
established the Safety and Production Technology Division with broad authority. The executive responsible
for overseeing the division (Representative Director and Senior Managing Executive Officer) formulates
policies and priority activities, which are approved by the Board of Management and the Sustainability
Committee, and reports on progress. In addition, the Environment, Safety and Disaster Management
Conference shares policies and activities and evaluates the effectiveness of safety and disaster prevention
initiatives across the divisions, while the Safety and Disaster Management Promotion Conference
deliberates and decides on specific matters and monitors their implementation.
Indicators and fiscal 2026 results for safety and disaster prevention
p.24
Board of Management *1
Sustainability Committee
Head of the Environment, Safety and Disaster Management Department
Business sites/factories
*4
Toyobo Group
Environment, Safety and
Disaster
Management
Chemical Substances
Conference
Management Subcommittee
Environment, Safety and Disaster Management Department
*1 Evaluates the effectiveness of, and manages, policies for safety, disaster prevention, and environmental activities.
*2 Deliberates and decides on specific matters and monitors their progress.
*3 Supports activities, provides information, and coordinates between divisions.
*4 Explains policies and reports on the progress of activities.
Group companies
Health and
Safety
Committee
Environment and
safety department
*3
Activity planning, implementation,
and management
Head of Business Division
*2
Safety and disaster prevention road map
FY2026
FY2027
FY2028
FY2029–2031
Safety culture
level
Challenging the independent stage*
Fostering a
safety
culture
Leveraging the results of the safety awareness survey, expanding opportunities to participate in safety activities,
and promoting safety dialogue
Enhancing role-based training (including workshops for senior management, business site managers, and
supervisors, as well as new employee training)
Strengthening
the safety
foundation
Reducing risk by embedding occupational safety and disaster prevention
management systems (including ISO standards)
Independent stage*
Eliminating recurring incidents by leveraging data from past incidents in safety and
disaster prevention training
Challenging the
interdependent stage*
Reassessing
workplace risks
Following up on
implementation status
- These terms are based on the dss+ Bradley Curve, which describes the stages of safety culture development.
Fostering a safety culture
Strengthening the safety foundation
Head of the Safety and Production Technology Division
Global Environmental
Promotion Conference
Based on the TOYOBO Group Basic Policy on Health & Safety, we are advancing initiatives from two
perspectives: fostering a safety culture (including embedding a safety-first mindset and reviewing our
education and training framework) and strengthening the safety foundation (including enhancing safety
management through the establishment of management systems). We have also developed a road map
through fiscal 2031 to systematically enhance our level of safety culture.
Established the Safety Declaration to foster a safety-first culture.
Leveraging the results of the safety awareness survey to enhance the organization s level of safety culture.
Conducting management workshops for newly appointed executives and presidents of
Group companies, as well as management training, with support from external organizations.
Toyobo Group structure for safety, disaster prevention, and the environment (FY2027)
Safety and Disaster
Management
Promotion Conference
ESG Performance Data (Social)
Initiatives
Approach and policy
*2
47
Data
Conducting risk assessments, work studies, and developing operating procedures to prevent incidents
before they occur; studying incidents that have occurred at other companies and workplaces; and
maintaining facilities and equipment through statutory inspections and voluntary inspections.
Establishing a system for the prompt reporting and sharing of information in the event of an incident,
based on the Operational Incident Response Guidelines.
Conducting preliminary occupational health and safety reviews and risk assessments for new
businesses and projects.
Strengthening the seismic resilience of buildings in preparation for natural disasters, conducting
emergency response drills, and preparing risk maps.
Occupational health and safety management system (ISO45001) certification
To reduce risks in the workplace, we are working to obtain certification for the occupational health and safety
management system (ISO 45001). As of March 2026, certification had been obtained at four sites: the Tsuruga
Research and Production Center, the Iwakuni Production Center, the Utsunomiya Plant, and the Inuyama Plant.
Corporate value
TOYOBO REPORT 2026
Introduction
Commitment to
realizing our vision
Economic value
Social value
Toyoboʼs earning power
Management strategy to
enhance earning power
Value creation story
Achieving sustainable growth
Business
strategy
Business development
strategy
Human resource
strategy
Green strategy
Sustainability strategy
Materiality indicators
Quality
FY2026
In addition to complying with applicable laws and regulations,
Toyobo Group has established the TOYOBO Group s Basic Policy
on Product Safety and Quality Assurance to ensure the safety of its
products and services, protect the environment, and earn customer
satisfaction and trust by delivering high-quality products and services.
To ensure the quality and safety of the products and services
we provide, we have established an appropriate management
system, conduct quality inspections in accordance with established
procedures, and strive to ensure the appropriate handling of data
and other information. We have also developed a road map through
fiscal 2031 to achieve our vision for that year and are advancing
initiatives in two areas: strengthening our management foundation
and fostering a culture of product safety and quality.
Organizational structure
Data
Quality
ESG Performance Data (Social)
Items, indicators, and fiscal 2026 results for quality
Compliance
FY2027
FY2028
Strengthening
Ensuring
Conduct assessments to strengthen oversight and drive improvement
the quality product safety
Minimize quality compliance risks
foundation
Separate and clarify first- and second-line
Establish rules and procedures for the new
Establishing a
responsibilities
framework
product safety
Improve process visibility through an informationQuantify the maturity of quality assurance
promotion
sharing system
processes
framework
Information
Centralize the management of information for dissemination and
protection and
Fostering
confidential information
dissemination
a quality
Implement strategic job rotations
Expand quality education programs
culture
Education and
Enhance the application of technical expertise
awareness
Develop specialist talent and enhance motivation
and establish quality career paths
p.24
Second line
Third line
Risk management by
business divisions
Checks
Daily
and
business
separation
execution
of duties
Risk management
by administrative divisions
Risk identification,
countermeasure creation,
and monitoring
Audit by the Internal Audit
Department
Internal audits
Internal Audit Department
Vision for FY2031
Information required for legal compliance is comprehensively
collected, addressed, and communicated.
Quality assurance processes are fully established, and data
integrity is ensured.
A product safety and quality assurance framework is established across
the entire product life cycle̶from development, design, manufacturing,
sales, and use through disposal̶and throughout the supply chain.
Information required for product safety and quality assurance
activities is thoroughly disseminated, with appropriate
safeguards for confidential information.
Management and employees share a unified commitment
to quality, possess the knowledge needed to carry out their
responsibilities, and continuously drive improvement as one team.
Initiatives
Product safety promotion activities
The Quality Assurance Manual, which outlines the fundamental principles and
behavioral guidelines for employees when carrying out the Group s development,
production, and sales activities, is shared with all sites and serves as the
foundation of the Group s manufacturing philosophy. We are strengthening
our quality and product safety framework through the development of our QA
system. Furthermore, we have established the Quality Assurance Guidelines
and are working to further strengthen this framework. In addition, the Head
of the Quality Assurance Division conducts reviews and interim reviews to
continuously monitor the issues facing each business division and the progress
of improvement efforts. November is designated as Quality Month each year.
During this period, we promote greater quality awareness and foster
a culture of quality through messages from senior management, seminars, and
workplace dialogue (see the figure below).
The Quality Assurance Division, independent from the business
divisions, and QA personnel from other departments conduct
PS/QA assessments to review the initiatives undertaken by each
business division and Group company and reduce quality risks.
In addition, criteria have been established to assess product safety
(PS) and product liability (PL) risks, and based on these criteria,
reviews are carried out at every stage from product development
to sales to minimize risk. Although every effort is made to ensure
product safety, each business division regularly conducts training
drills based on scenarios involving PL incidents.
Overview of quality assurance activities
PS response system
System development
First line
FY2029
Strengthen Company-wide governance for legal compliance
Establish a Company-wide chemical substance management framework
Quality assurance initiatives
Toyobo Group has established the Quality Assurance Division
Conference to oversee Product Safety (PS) and Quality Assurance
(QA). This body meets monthly and consists of executives
responsible for quality, the General Manager of the Quality
Assurance Department in charge of business divisions, and
the General Manager of the Quality Assurance Management
Department. The PS/QA Promotion Committee, comprising General
Managers from various business divisions, is scheduled to meet six
times a year. In fiscal 2026, it met six times as planned.
Since fiscal 2022, Toyobo Group has adopted a three lines of
defense framework, consisting of the first line (business divisions/
production sites), the second line (Quality Assurance Management
Department), and the third line (Internal Audit Department),
establishing a multilayered system to detect and prevent misconduct.
Quality Assurance
Management Department
48
Corporate
governance
Quality assurance road map
Approach and policy
Business divisions/
Production sites
Sustainability strategy
Market
Customer
needs
Competitor
trends
Social
conditions
Planning
Execution and
performance verification
Required quality Target
quality
Quality
building
Quality
information
Quality
verification
Sales and services
Purchase
Follow-up
Use
Improvement of management and technical capabilities
Verification of quality evaluation
Customer
Quality
evaluation
Policy approval
TOYOBO Groupʼs Basic Policy on Product Safety and Quality Assurance
Sustainability Committee (Chair: President)
Deliberation and determination
Quality Assurance Division Conference (Chair: Head of Quality Assurance Division)
of PS response measures
Deliberation and determination Reporting
PS/QA Promotion Committee (Chair: Head of Quality Assurance Division)
of PS response measures
Confirmation and evaluation of the
PS/QA Assessment
implementation of PS response measures
Implementation of PS review
Implementation of PL incident
response training
Bioethics Review Committee (Chair: General Manager of Quality Assurance Management Department)
PS Review Committee (Chair: General Manager of Quality Assurance Management Department)
PL Incident Response Training
Corporate value
TOYOBO REPORT 2026
Introduction
Commitment to
realizing our vision
Economic value
Social value
Toyoboʼs earning power
Management strategy to
enhance earning power
Achieving sustainable growth
Business
strategy
Value creation story
Business development
strategy
Human resource
strategy
Green strategy
Sustainability strategy
Corporate
governance
Compliance
Sustainability strategy
Materiality indicators
Compliance
Approach and policy
Toyobo Group places its corporate philosophy of Jun-Ri-Soku-Yu
(adhering to reason leads to prosperity) at the core of its compliance
efforts.
In addition, based on the principles declared in the TOYOBO Group
Charter of Corporate Behavior, we have established the TOYOBO
Group Employee Conduct Standards, which define the rules that
employees are expected to follow. We also distribute the TOYOBO
Group Compliance Manual, which summarizes these rules in a
clear and practical manner. Through reading sessions, we promote
understanding and ensure thorough awareness of the rules among
Group employees.
Organizational structure
The Compliance Committee, composed of members of the Board
of Management, promotes compliance across the Group from a
management perspective. Under this committee, the Compliance
Promotion Committee examines specific initiatives, while the Legal
and Compliance Department, which serves as the secretariat for both
committees, promotes legal compliance and overall compliance
throughout the Group.
Initiatives
corrective action, and prevention of such issues.
Following fiscal 2025, we continued to enhance our global internal
whistleblowing system to support overseas and multilingual
reporting. To ensure that employees can use these consultation desks
with confidence, we guarantee the confidentiality of all consultations,
ensure that no employee will face any disadvantage as a result of
consulting or reporting, and accept anonymous consultations.
Types of Compliance Consultation Desks
1 Internal consultation desk
2 External service provider desk
(Corporate Ethics Hotline, including the global internal whistleblowing system)
Compliance Consultation Desks
Toyobo Group has established Compliance Consultation Desks
(internal reporting desks) for officers and employees. These desks
receive reports and consultations regarding legal or rule violations
in the workplace, misconduct, and unethical conduct (including
corruption, bribery, embezzlement and other corrupt practices,
violations of competition law such as bid-rigging and cartels, and
bullying or harassment). The desks aim to enable early detection,
49
ESG Performance Data (Governance)
Items, indicators, and fiscal 2026 results for compliance
p.25
Education and awareness-raising activities
In addition to compliance manual training sessions (manual reading
sessions) conducted in each workplace, we promote practical
awareness through Compliance Mini Study case studies and the
distribution of Compliance Reports based on cases from within the
Group and misconduct at other companies.
We also conduct video-based training sessions for employees across
the Group (attended by a total of 5,328 participants in fiscal 2026),
as well as role- and function-specific training for managers, new
employees, sales personnel, employees assigned overseas, and other
employee groups (27 sessions conducted in fiscal 2026).
3 External lawyer desk
4 Audit and Supervisory Committee desk
Compliance risk assessment
In fiscal 2026, a total of 100 consultations were received, two of
which were made through the external consultation desk. The most
common topics were communication, interpersonal relationships,
and harassment, followed by human resources and labor matters,
including attendance and treatment. In addition to providing
advice and responding to inquiries from employees who raised
consultations, we conducted fact-finding and investigations while
respecting the wishes of the employees concerned. Where issues
were identified, corrective measures and measures to prevent
recurrence were implemented.
Number of consultations at Compliance
Consultation Desks (internal reporting desks)
Compliance promotion activities
In fiscal 2026, the Compliance Committee met twice and the
Compliance Promotion Committee met four times. Under the theme
of small things matter, we carried out awareness-raising activities
to enhance compliance awareness, as well as education and training
programs and compliance consultation services.
Data
FY2022
FY2023
FY2024
FY2025
FY2026
62
78
102
116
100
Process for handling compliance consultations
1
Receive a consultation or report and review its contents.
2
Conduct fact-finding investigations by the consultation desk and the
relevant departments or companies, including reviewing evidence and
interviewing the persons involved and third parties.
3
Based on the investigation results, assess whether any violation or
misconduct has occurred and evaluate its severity.
4
If a violation, misconduct, or related risk is identified, the relevant department
or company implements corrective measures and measures to prevent
recurrence, and takes appropriate actions such as guidance or disciplinary
measures for the persons involved. Measures to prevent recurrence are also
implemented across the Group.
5
Feedback is provided to the employee who submitted the consultation
or report through the consultation desk, and follow-up on the status of
corrective measures occurs as necessary.
Every year, we conduct a compliance awareness survey to identify
Group-wide issues and signs of potential problems. In fiscal 2026,
we received responses from 7,534 employees. The survey results are
shared with all employees and used to correct and prevent identified
issues and improve compliance activities.
Initiatives to prevent corruption
Toyobo Group positions the prevention of corruption, including
bribery and other corrupt practices, bid-rigging and cartels, unfair
competition, and fraudulent accounting, as a key compliance priority.
To prevent corruption, we have established relevant regulations and
guidelines that set standards for gifts and entertainment, and we
seek to ensure transparency by declining gifts and entertainment
that exceed socially accepted norms and requiring reports when
such gifts or entertainment are received. In fiscal 2026, in response
to increasingly stringent regulations in various countries, we revised
the relevant regulations and clarified the standards, while promoting
thorough awareness through training and other initiatives.
Operational corruption risks are assessed and managed under the
Group-wide risk management framework. In addition, the status of
compliance activities, including initiatives to prevent corruption, is
overseen through regular reporting to the Board of Directors and
audits conducted by Audit and Supervisory Committee members,
thereby ensuring their effectiveness.
Corporate value
TOYOBO REPORT 2026
Introduction
Commitment to
realizing our vision
Economic value
Toyoboʼs earning power
Management strategy to
enhance earning power
Value creation story
Social value
Achieving sustainable growth
Business
strategy
Business development
strategy
Human resource
strategy
Green strategy
Sustainability strategy
Corporate
governance
Risk Management
Sustainability strategy
Materiality indicators
Risk management
Approach and policy
Based on the Basic Policy on Business Risk, Toyobo Group aims for
sustainable growth and contribution to society by appropriately
managing risks in its business activities.
In the Group s risk management activities, risk owners the
departments with inherent risks (operational sites) identify and
evaluate risks, while risk management measures are developed
and implemented in collaboration with the risk management
departments (staff departments). The planning and promotion of
these activities are undertaken by the Risk Management Department,
which serves as the Group s central risk oversight unit.
Each year, we review the major risks facing the Group and carry
out appropriate risk assessment and management to earn the trust
of our stakeholders, including customers, local communities, and
shareholders.
Organizational structure and activities
The Risk Management Department, which serves as the Group s
central risk oversight unit, has been positioned as an organization
reporting directly to the President since fiscal 2027 in order to
clarify its role as the department responsible for overseeing risk
management across the Group.
In addition, the Company has established the Risk Management
Committee, chaired by the President, to centrally manage risks across
the Group. The Committee is composed of members of the Board of
Management (Business Division Heads and the officers responsible
for the Corporate and Staff Divisions) and meets twice a year to
promote Group-wide risk management activities.
Within the Committee, major risks affecting the Group as a whole
are addressed through enterprise risk management (ERM) activities.
Management structure and processes
Sustainability Committee
Risk Management Committee
Compliance Committee
Climate Change and
Biodiversity Committee
Risk Management
Department
Departments managing risks
Departments with intrinsic risks
The Committee monitors the status of risk mitigation initiatives led
by the relevant risk management departments and deliberates on
related matters.
In fiscal 2026, we conducted risk assessments at all Group sites to
comprehensively visualize risks, identified new Group-wide risks
requiring enterprise-wide action, and designated them as key issues.
In addition, we promoted business risk management (BRM) activities
by identifying priority issues at each site and working with the
relevant risk management departments to mitigate those risks.
Business Continuity Management (BCM) and
Business Continuity Plan (BCP)
Under the Risk Management Committee, we have established the
BCM Subcommittee, composed of members selected from each
department, to promote BCM across the Group. This subcommittee
leads the formulation, training, and education of BCPs in each
department and serves as the point of contact for information
gathering, dissemination, and actions necessary to maintain business
continuity in the event of emergencies, such as major earthquakes.
When an emergency occurs or is anticipated, a Company-wide BCP
Task Force is established to ensure a rapid response and the swift
resolution of the crisis.
BCP initiatives
In fiscal 2025, we established the TOYOBO Group Business
Continuity Plan (BCP) Guidelines for large-scale earthquakes
anticipated in the Nankai Trough region (seismic intensity upper 5 or
higher). The Guidelines specify procedures for confirming disaster
situations, communication systems, the overall commanding officer,
the structure and roles for recovery operations, and priorities. In fiscal
2026, based on the BCPs developed by each business division, we
conducted large-scale earthquake response drills at major sites. We
are applying the lessons learned from these drills to strengthen our
day-to-day preparedness.
In addition, we strive to identify and manage supply chain risks
arising from geopolitical risks, the importance of which has increased
from an economic security perspective. We are also promoting
multiple sourcing and the establishment of alternative transportation
methods and routes.
Data
50
ESG Performance Data (Social)
Items, indicators, and fiscal 2026 results for data security and privacy
p.25
Information security
Policy and approach
As stated in the TOYOBO Group Charter of Corporate Behavior,
each employee must recognize the importance of information
security, handle information appropriately, and prevent information
security incidents in order for the Group to contribute to society and
remain a trusted company. Our Basic Information Security Policy sets
out five key elements: management system, legal compliance and
in-house regulations, education and training, information systems
operation, and incident response.
Organizational structure
We have established the Information Security Sub-committee
(TOYOBO-CSIRT*), led by the Chief Information Security Officer
(CISO) appointed by top management, to promote information
security measures and activities. TOYOBO-CSIRT assesses the
Group-wide information security landscape, formulates basic
policies, maintains the management system, and implements and
oversees specific measures.
- Computer Security Incident Response Team
Information security measures
We promote information security measures across the Group,
including domestic and overseas Group companies, at the same
level as those implemented at the head office. Under a 24-hour AIpowered security monitoring system, containment measures are
automatically implemented when serious incidents are detected
to minimize potential damage. We also conduct incident response
drills on an ongoing basis to strengthen our response capabilities.
In addition, we have established a framework for the seamless
escalation of major incidents to the Group s risk management
structure. Furthermore, in light of supply chain risks, we are
strengthening our IT Business Continuity Plan (IT-BCP)* initiatives to
further enhance our business continuity framework in the event of an
emergency.
- IT-BCP: A plan to support business continuity by enabling the prompt recovery
of critical systems in the event of a disaster or system failure.
Corporate value
TOYOBO REPORT 2026
Introduction
Commitment to
realizing our vision
Economic value
Toyoboʼs earning power
Management strategy to
enhance earning power
Value creation story
Social value
Achieving sustainable growth
Business
strategy
Business development
strategy
Human resource
strategy
Green strategy
Sustainability strategy
Corporate
governance
Data
51
CEO Outside Directors
cross-talk session
Toyobo Group is advancing its transition to One-team
management. In this cross-talk session, the CEO and
outside directors discuss the evolution of the Board of
Directors, as well as the expectations and challenges
surrounding the execution of the 2030 Medium-Term
Management Plan.
Looking back on management
Fukushi When I joined the Board four years ago, my first
impression was that Toyobo was managed very much as a
collection of individual business divisions, with a somewhat limited
Company-wide perspective. There was still insufficient Companywide discussion of capital efficiency, profitability, and the effective
use of cross-functional capabilities, and business divisions largely
made decisions independently. Even when discussing investments
and the business portfolio, it was difficult to build a shared
understanding of the direction the Company should take.
Against this backdrop, one of the Board s key priorities has been
to move beyond a management structure centered on individual
business divisions and transition to One-team management capable
of making decisions as a unified organization. With this awareness
of the challenges we faced, we also began reviewing the role and
operation of the Board.
Transition to a company with an
Audit and Supervisory Committee
Takase One of the most significant changes to the Board was the
transition to a company with an Audit and Supervisory Committee
in June 2025. Even before the transition, I felt that the Audit and
Supervisory Committee members had a strong interest in Toyobo
Group and consistently expressed their views candidly from a wide
range of perspectives. Now that they serve as directors with voting
rights on the Board, they have strengthened not only the quality
of our discussions but also the Board s ability to provide ongoing
oversight from a long-term perspective.
By taking on greater responsibility as directors, the Audit and
Supervisory Committee members perspectives and advice carry
Ikuo Takeuchi
Shoko Takase
Hiroshi Fukushi
President & Representative Director
CEO and Co-COO
Outside Director
Outside Director
greater weight. I believe their contributions have added further
depth to the Board s discussions.
Takeuchi The purpose of this governance structure is not for
the Board to become overly involved in the details of execution.
Rather, it is to delegate responsibility to the executive team,
enabling faster decision-making while allowing the Board to focus
more fully on its monitoring role. At this stage, however, I believe
there is still room to strengthen the relationship of trust between
the Board and the executive team, and I believe we are still in a
period of transition.
As that relationship of trust continues to deepen, the Board will
be better positioned to strengthen its monitoring function as
originally intended and devote more attention to discussions on
enhancing corporate value over the medium- to long-term.
Fukushi My sense is that the Board is still operating more like
an advisory board. Rather than simply monitoring management
and judging its performance, the Board s role at this stage is to
provide advice to the executive team. As that relationship of trust
develops, I believe we can gradually move closer to fulfilling the
Board s intended monitoring role. That is why I believe we are still
in a transitional phase.
Takeuchi Our first priority is to build that relationship of trust. By
strengthening a framework in which the executive team can make
decisions and execute them autonomously as one team, the Board
can move closer to fulfilling its intended monitoring role.
Transition to One-team management
Fukushi One of the most significant changes over the past
year has been the clear expectation under President Takeuchi s
leadership that executive officers make decisions not as
representatives of their individual businesses, but on behalf of
the Company as a whole. Business portfolio reform, ROE, and
other key concepts have become part of our shared management
language, and executive officers are now engaging in candid,
Company-wide discussions based on their genuine views. As a
result, I believe the quality of the proposals brought before the
Board has improved significantly.
A key initiative supporting this transformation is the Management
Policy. Rather than relying on unspoken understanding, it
establishes a shared set of management principles and decisionmaking criteria across the organization. It provides clear guidance
on how we manage our people; approach R&D; integrate
technology, production, and sales; and reshape our business
portfolio. By articulating these principles and sharing them across
both management and the organization, the Management Policy
extends governance to the middle management level while also
improving transparency.
For Toyobo Group, where management has traditionally been
driven largely by individual business divisions, I believe this
Corporate value
TOYOBO REPORT 2026
Introduction
Commitment to
realizing our vision
Economic value
Toyoboʼs earning power
Management strategy to
enhance earning power
framework is particularly effective. After many discussions with
President Takeuchi, the Management Policy was introduced on a
trial basis in the second half of last year and has been rolled out
Company-wide this year.
Takeuchi Creating the Management Policy is only the first step.
What matters is ensuring that our management principles are
understood throughout the organization and translated into
action at every level. To achieve this, we need to communicate
clearly where the Company is headed and what it expects of
each organization. Bridging differences in
understanding across organizational levels and
turning our policies into concrete actions are
essential to making the policy truly effective.
At the same time, I believe One-team
management is steadily taking root within the
executive team. Rather than making decisions
based on what is best for individual businesses,
there is a growing commitment to making
decisions from a Company-wide perspective.
This spring, in response to rising geopolitical
risks, executive officers met frequently to
coordinate the procurement and allocation of raw materials and
fuel. They also coordinated resources across plants as needed,
taking a Company-wide approach to addressing these challenges.
By continuing to make decisions and take action in this way, we
will translate One-team management into tangible results.
Takase President Takeuchi spoke about the importance
of taking a Company-wide perspective and working across
organizational boundaries. As an outside director, I have had
opportunities to visit our plants and speak directly with employees
on the shop floor. One experience that left a particularly strong
impression on me was hearing them openly explain the challenges
they faced in bringing new equipment online. More importantly,
they described in their own words how leaders and team members
from across the organization were working together
as one team to overcome those challenges.
What impressed me most was that, rather than trying
to solve problems on their own, people on the shop
floor were willing to seek help and draw on expertise
from across the Company. That mindset has clearly
taken root throughout the organization. I believe it
leads to faster problem-solving, higher productivity,
and ultimately greater capital efficiency. To me, it
was clear evidence that One-team management is
beginning to take hold on the shop floor as well.
In fact, One-team management is a much broader
Value creation story
Social value
Achieving sustainable growth
Business
strategy
Business development
strategy
Human resource
strategy
Green strategy
concept than simply helping one another across teams and
departments. It also means sharing individual expertise across
teams and departments, as well as connecting processes and data
across organizational boundaries. These cumulative efforts will
ultimately help accelerate improvements in ROE.
Expectations and challenges
for the 2030 Medium-Term Management Plan
Takase In our discussions on the revised 2030 Medium-Term
Management Plan, I particularly appreciated how President
Takeuchi s focus on restoring earning power has evolved into
enhancing both earning power and capital efficiency. The thinking
behind management s priorities has been brought together
into a clear and consistent narrative. We have also had more
opportunities, as outside directors, to discuss each business
division s medium-term plan, and my visits to operational sites
have further deepened my understanding.
That said, there is still room to improve both the consistency of the
business divisions plans and the way their progress is managed.
As a company, we need a simple set of management indicators
that enables us to monitor execution on an ongoing basis. At the
Board, we discussed not only the assumptions behind the targets
in the Medium-Term Management Plan but also the potential
downside risks and opportunities for outperformance.
A medium-term management plan is not something that is
completed once it is published. It must be reviewed continuously
on both a quarterly and monthly basis, with progress shared across
the Company and translated into results. Based on my previous
experience, I believe that strengthening execution as one team
requires more than the cross-organizational information sharing
promoted through Toyobo-Transformation (TX). It also depends
on people moving across business divisions and functions,
maintaining a genuine interest in one another s
work, and working as one team across organizational
boundaries at every level.
It is equally important to tailor the way we
communicate to the level of understanding of our
audience. These ongoing efforts strengthen both
the quality and speed of execution by enabling
people to share challenges across organizational and
hierarchical boundaries.
The new Medium-Term Management Plan represents
an important first step by giving us a shared sense of
direction. The real challenge now is to ensure that it
Sustainability strategy
Corporate
governance
Data
52
becomes an effective management system. While we have already
seen encouraging progress, I do not believe we should be satisfied yet.
Instead, I am genuinely excited by how much further we can still go.
Fukushi I also believe this Medium-Term Management Plan marks
a significant step toward the Company-wide management approach
we have long recognized as necessary. In the past, investment
decisions and business plans tended to be driven by individual
business divisions, and we did not always assess capital efficiency
and risk from a Company-wide perspective.
Establishing ROE as a clear management target
and shifting discussions of the business portfolio
and investment decisions to a Company-wide
perspective represent important progress.
That is why the next challenge is ensuring that
the plan is executed effectively. It is essential that
we continuously assess risks during the planning
stage, monitor execution, and review resource
allocation as needed while leveraging our crossfunctional capabilities. As the Board, we also
intend to further strengthen our monitoring so
that the executive team can execute the plan from a Companywide perspective and drive improvements in ROE.
Takeuchi We will take both of your comments to heart as we put
the Medium-Term Management Plan into action. Our efforts to
date have laid the groundwork for Company-wide discussions
with everyone moving in the same direction. The important thing
now is to ensure that this new way of working does not remain
a one-time initiative but rather becomes embedded in our daily
decision-making and actions across the organization.
The Medium-Term Management Plan clearly defines the role
each business is expected to play and how it will improve both
profitability and capital efficiency. At this year s Executive Retreat,
under the theme of Executing as One Team and Delivering
Results, we will revisit the Company-wide Medium-Term
Management Plan and encourage discussions that extend beyond
individual functional responsibilities to identify challenges and put
forward recommendations.
When gaps emerge between the plan and actual performance, it is
essential that we do not leave individual businesses to address them
in isolation. Instead, management must quickly identify the underlying
issues from a Company-wide perspective and take the necessary
action. We will also treat the Board s candid feedback as valuable
input that helps deepen discussions among the executive team. By
having each executive officer step beyond his or her own area of
responsibility and by working together across Toyobo Group to solve
challenges, we will deliver results that enhance corporate value.
Note: This cross-talk session has been edited and condensed based on the actual interview, discussions, and related materials.
Corporate value
TOYOBO REPORT 2026
Commitment to
realizing our vision
Introduction
Economic value
Toyoboʼs earning power
Management strategy to
enhance earning power
Value creation story
Social value
Achieving sustainable growth
Business
strategy
Business development
strategy
Human resource
strategy
Green strategy
Sustainability strategy
Corporate
governance
Data
Management team
53
(As of June 30, 2026)
Directors who are Audit and
Supervisory Committee Members
Directors
Seiji Narahara
Ikuo Takeuchi
Taichi Sakai
Kazuhito Ikeda
Takayuki Tabo
Chair of the Board and
Director
President and Representative
Director(CEO and Co-COO)
Controlling Supervisor of the
Internal Audit Department
Representative Director and Senior
Managing Executive Officer (Co-COO)
Controlling Supervisor of Safety and
Production Technology Division and
Procurement and Logistics Department
Director and Managing
Executive Officer
Head, Life Science Division
Director (Full-time Audit
and Supervisory Committee
Member)
January 1988 Joined the Company
April 2010 Executive Officer
June 2011 Director and Executive Officer
April 2014 President and Representative Director (CEO and
Co-COO)
April 2021 Chair of the Board and Director (to present)
June 2023 Outside Director, SCREEN Holdings Co., Ltd.
(to present)
May
2025 Representative Director and Chairman, Sen-i
Kaikan Co., Ltd. (to present)
April 1985 Joined the Company
October 2015 Deputy Director, General Manager, Corporate
Planning Office
April 2018 Executive Officer
April 2020 Managing Executive Officer
June 2020 Director and Managing Executive Officer
April 2021 President and Representative Director
(CEO and Co-COO) (to present)
April
April
1986 Joined the Company
2016 Deputy Director, Production Technology
Supervisory Division Head, and Member, Global
Promotion Department
December 2020 Executive Officer
April 2023 Managing Executive Officer
June 2023 Director and Managing Executive Officer
April 2024 Representative Director and Senior Managing
Executive Officer (to present)
April
1990 Joined the Company
October 2019 Deputy Director, General Manager of AC Equipment
Department, AC & SB Operating Department
April
2021 Deputy Director, General Manager of Environmental
Solutions Operating Department, General Manager
of Environmental Solutions Equipment Department,
and General Manager of Environmental Solutions
Business Development Department
April
2023 Executive Officer
April
2026 Managing Executive Officer
June
2026 Director and Managing Executive Officer (to present)
April
1983 Joined the Company
October 2013 Deputy Director, General Manager of Accounting
Department
April
2017 Executive Officer
April
2020 President and Representative Director (CEO and
Co-COO) of TOYOBO STC CO., LTD.
June
2021 Full-time Corporate Auditor of the Company
June
2025 Director of the Company (Full-time Audit and
Supervisory Committee member) (to present)
Akihiko Irie
Masaaki Harima
Hiroshi Fukushi
Shoko Takase
Yuki Kanzaki
Outside Director
Outside Director
Outside Director
Outside Director
April
May
1977 Assistant Judge, Osaka District Court
1981 Registered as attorney at law (Osaka Bar
Association)
September 1987 Established Harima Law Offices (now Fushimicho
Law Offices)
April 2010 Chairperson, Osaka Fairness Review Board
June 2011 Outside Corporate Auditor, Ishihara Sangyo
Kaisha, Ltd.
June 2014 Member, Independent Committee of the
Company
June 2020 Outside Director of the Company (to present)
April 2021 Chairperson, Pollution Control Board, Osaka
Prefecture
April
June
June
June
June
June
June
June
June
1984 Joined Ajinomoto Co., Inc.
2011 Executive Officer
2013 Director and Managing Executive Officer, and
General Manager, Bio-Fine Business Division
2015 Director, Corporate Senior Vice President
2019 Director, Vice President and Executive Officer, and
Chief Digital Officer
2021 Director, Representative Director and Vice
President
2022 Special Advisor (to present)
2022 Outside Director of the Company (to present),
and Outside Director, MEGMILK SNOW BRAND
Co., Ltd. (to present)
2025 Outside Director (Audit and Supervisory
Committee Member), Members Co., Ltd.
(to present)
April 1987 Joined IBM Japan Ltd.
January 2005 Seconded to IBM Corporation (IBM U.S. head
office)
July
2015 Manager, Growth Strategy, Mobile Strategy, IBM
Japan Ltd.
July
2016 General Manager, Global Technology Services
Business, and General Manager, Resiliency
Services Division
July
2018 Director, General Manager, Cloud Solution
Center
April 2019 Senior Managing Executive Officer and Head,
Enterprise Business, Cisco Systems G.K.
July
2021 Consultant, TechnoPro Holdings, Inc.
September 2021 Outside Director of TechnoPro Holdings, Inc.
(to present)
June 2023 Outside Director of the Company (to present)
and Outside Director, GLOBERID, Inc.
(to present)
March 1992 Joined Kirin Brewery Co., Ltd. (now Kirin
Holdings Company, Limited)
March 2016 Executive Officer, General Manager of Kobe Plant
of Production Division at Kirin Brewery Co., Ltd.
March 2017 Executive Officer, General Manager of Yokohama
Plant of Production Division
March 2019 Managing Executive Officer, General Manager
of Yokohama Plant of Production Division
March 2020 Managing Executive Officer and General
Manager of Corporate Strategy Department at
Kyowa Hakko Bio Co., Ltd.
January 2022 President and CEO of Kyowa Hakko Bio Co., Ltd.
March 2022 Managing Executive Officer of Kirin Holdings
Company, Limited, and President and CEO of
Kyowa Hakko Bio Co., Ltd.
March 2025 Outside Director of Daifuku Co., Ltd. (to present)
June 2025 Outside Director of the Company (to present)
June 2026 Outside Director, UBE Corporation (to present)
Outside Director (Audit and
Supervisory Committee
Member)
April
June
April
April
June
June
June
June
Senior Managing
Executive Officers
Ikuo Takeuchi
Managing Executive Officers
Executive Officers
Hidekazu Takahashi
Toshiyuki Oya
Masakazu Iwasaki
Shingo Ito
Hideyuki Kagi
Runa Nakamura
Takehiko Inada
Naoki Fujii
Taichi Sakai
Tadao Kuroki
Kazuhito Ikeda
Outside Director (Audit and
Supervisory Committee
Member)
Masanao Kudo
Norio Iizuka
1982 Joined Tohmatsu Awoki & Co. (now Deloitte Touche
Tohmatsu LLC)
1983 Registered as certified public accountant
1997 Appointed as a Designated Engagement Partner
(currently Partner) at Deloitte Touche Tohmatsu LLC
October 2013 General Manager of Kansai Business Department,
Audit Business Division at Deloitte Touche
Tohmatsu LLC
September 2022 Representative of Shinmen Certified Public
Accountant Office (to present)
June
2023 Outside Corporate Auditor of Sekisui Chemical Co.,
Ltd. (to present)
June
2023 Outside Corporate Auditor of the Company
June
2025 Outside Director of the Company (Audit and
Supervisory Committee member) (to present)
March
August
Tetsuro Yabuki
Atsushi Sogabe
Katsuya Toita
Takayasu Nagao
Masafumi Koseki
Joined Osaka Gas Co., Ltd.
Corporate Officer
Executive Officer
Deputy Director
Corporate Auditor
Outside Corporate Auditor of Osaka Gas Urban
Development Co., Ltd.
2021 Outside Corporate Auditor of the Company
2025 Outside Director of the Company (Audit and
Supervisory Committee member) (to present)
Wakyu Shinmen
October
CEO and Co-COO
1980
2009
2012
2015
2015
2019
Corporate value
TOYOBO REPORT 2026
Introduction
Commitment to
realizing our vision
Economic value
Toyoboʼs earning power
Management strategy to
enhance earning power
Value creation story
Social value
Achieving sustainable growth
Business
strategy
Business development
strategy
Human resource
strategy
Green strategy
Sustainability strategy
Corporate
governance
Corporate Governance
Materiality indicators
Directors’ attendance at meetings and skills
Attendance status (rate)
Board of
Directors
Governance, risk
Audit and Nomination and
Production,
Corporate
Finance and Environment
management, and
Supervisory Compensation
technology, and Marketing and sales
management
accounting and society
compliance
Committee Advisory Committee
development
63
Male
Board of
Management
17/17
sessions
(100%)
6
Taichi
Sakai
63
Male
17/17
sessions
(100%)
3
Kazuhito
Ikeda
(New
appointment)
58
Male
Masaaki
Harima
75
Male
16/17
sessions
(94%)
Hiroshi
Fukushi
68
Male
16/17
sessions
(94%)
6/6
sessions
(100%)
4
Shoko
Takase
61
Female
17/17
sessions
(100%)
4/4
sessions
(100%)
3
Yuki
Kanzaki
63
Female
13/13
sessions
(100%)
Takayuki
Tabo
65
Male
17/17
sessions
(100%)
11/11
sessions
(100%)
5
Akihiko
Irie
69
Male
17/17
sessions
(100%)
11/11
sessions
(100%)
5
Wakyu
Shinmen
69
Male
17/17
sessions
(100%)
11/11
sessions
(100%)
Ikuo
Takeuchi
ESG Performance Data (Governance)
Items, targets, and fiscal 2026 results for governance
Years
in
office
Male
69
6/6
sessions
(100%)
IT/DX
17/17
sessions
(100%)
Seiji
Narahara
54
p.25
Attendance rate based on fiscal 2026 results as of June 30, 2026
Expertise and skills expected of directors
Board of
Directors
Director serving as an
Audit and Supervisory
Committee Member
Director
Nomination and
Compensation Committee
Outside Independent Age Gender
chairperson
Advisory
Committee
Data
15
0
6
1
6/6
sessions*
(100%)
3
Reasons for election
Based on his deep knowledge of finance, accounting, and other areas, Mr. Narahara has supported the longterm reform of the Company s business portfolio, and, acting as President and Representative Director since
April 2014, has led the management of the Group, including the reworking of our corporate philosophy
structure and the expansion of the Films business, committed to the improvement of corporate value. He
assumed the post of Chairman of the Board and Director in April 2021, and in that position, plays an appropriate
role in decision-making on key matters and in the oversight of business execution.
After serving in key positions in corporate planning and overseas business sites of the Company, Mr. Takeuchi
was appointed as Head of the Functional Membranes and Environment Division, a position from which he set
a concrete path toward growth of the business. Since April 2021, he has undertaken formulation of the 2025
Medium-Term Management Plan as President and Representative Director, demonstrating strong leadership and
steering the sustainable growth of the Group.
Mr. Sakai has held key positions in the Company s Production Technology Division and core manufacturing
sites and, drawing on his abundant experience and expertise in the field of production technology, has been
contributing to initiatives aimed at technological innovation, safety, and disaster prevention as Director since
June 2023.
After holding key positions across the Company s Life Science Division, Mr. Ikeda went on to lead the Environmental
Solutions business and, at a major subsidiary, spearheaded structural reforms as General Manager of Production.
Drawing on his extensive experience in business operations as well as his expertise in production technology and
development, he has made significant contributions to improving the performance of the Group as a whole.
Leveraging specialized knowledge and wide-ranging insights gained as an attorney, Mr. Harima made proactive
statements from an independent standpoint at meetings of the Board of Directors. He appropriately fulfills roles
expected of him by the Company, including those of supervising management through vital decision-making and
providing counsel to management, advising with the aim of strengthening risk management and governance.
Leveraging his abundant experience and wide-ranging insights gained as a business manager, Mr. Fukushi made
proactive statements from an independent standpoint at meetings of the Board of Directors. He appropriately
fulfills roles expected of him by the Company, including those of supervising management through vital
decision-making, providing counsel, and advising management in the areas of digital, production technology,
and finance.
Leveraging her extensive experience and broad knowledge as a manager, Ms. Takase made proactive statements
from an independent standpoint at Board of Directors meetings. She appropriately fulfills the roles expected of
her by the Company, including supervising management through critical decision-making, providing counsel,
and advising management in the areas of IT and digital technologies.
Leveraging her extensive experience and broad insight as a business manager, as well as her deep expertise
in production and research and development, Ms. Kanzaki is appropriately fulfilling the roles expected by the
Company, including providing advice to management and supervising management through important decisionmaking.
Having held key positions in the Company s staff divisions, including accounting and finance, and serving as
a full-time Audit and Supervisory Committee Member since June 2021, Mr. Tabo has leveraged his extensive
knowledge and experience in finance and accounting to contribute to highly effective oversight of the Company s
management.
Having extensive experience in audits, including serving as an Audit and Supervisory Committee Member at
listed companies, Mr. Irie leverages his insights and broad knowledge to appropriately fulfill the roles expected
by the Company, including auditing management and supervising management through important decisionmaking.
Leveraging his expertise as a certified public accountant and his broad knowledge, Mr. Shinmen appropriately
fulfills the roles expected by the Company, including auditing management and supervising management
through important decision-making.
- Includes participation as an observer on two occasions.
Expertise and skills expected of Directors
Skill area
Description
Corporate management
Supervise and promote strategies for sustainable growth, such as reorganization of the business portfolio, with an overall perspective of the Group, considering domestic and international business opportunities and risks.
Production, technology, and development
Supervise and promote strategies related to strengthening manufacturing capabilities, exploring new businesses and technologies, and commercializing strategic themes for the future.
Marketing and sales
Supervise and promote sales strategies for deepening existing businesses and creating business opportunities in growth areas.
Finance and accounting
Based on advanced expertise in finance and accounting, supervise and promote financial strategies and capital policies to achieve management plans.
Environment and society
Supervise and promote strategies to contribute to solving social issues outlined in Sustainable Vision 2030 and to realize a sustainable society through business activities.
Governance, risk management, and compliance
Supervise and promote initiatives to reinforce safety, disaster prevention, quality, and compliance, which form the foundation of business activities, as well as the ongoing enhancement of risk management.
IT/DX
Supervise and promote digital strategies to transform the business model and establish a competitive advantage through information technology and digital transformation.
Corporate value
TOYOBO REPORT 2026
Introduction
Economic value
Social value
Toyoboʼs earning power
Commitment to
realizing our vision
Management strategy to
enhance earning power
Achieving sustainable growth
Value creation story
Business
strategy
Business development
strategy
Human resource
strategy
Green strategy
Sustainability strategy
Corporate
governance
55
Data
Corporate governance evolution
The Company has strengthened the separation of execution and oversight by introducing the executive officer system and establishing committees on nominations and
compensation, among other initiatives. Through these efforts, we have enhanced our business execution and oversight functions, improved management transparency, and
strengthened our corporate governance. Pursuant to a resolution adopted at the 167th Annual General Meeting of Shareholders held on June 25, 2025, the Company transitioned
from a company with a Board of Corporate Auditors to a company with an Audit and Supervisory Committee. Through this transition, we aim to achieve both faster, more efficient
business execution and more robust management oversight, thereby supporting sustainable growth and enhancing corporate value over the medium- to long-term.
FY2013
Governance
structure
FY2014
FY2015
FY2016
FY2017
FY2018
FY2019
FY2020
FY2022
FY2023
FY2024
FY2025
FY2026
Company with an
Audit and Supervisory
Committee
Company with a Board of Corporate Auditors
FY1999 Established the Ethics Committee (renamed the CSR Committee in FY2008)
Corporate
governance
structure
FY2021
FY2021 Renamed the Sustainability Committee
FY2006 Introduced the executive officer system
Established the Liaison Meetings of Outside Officers
Established the Nomination Committee
Conducted the first Board of Directors’ effectiveness
evaluation (questionnaire-based)
Established the Nomination and Compensation Advisory
Committee (voluntary)
FY2005 Established the Advisory Council on Officer Compensation and Related Regulations
Officer
compensation
system
Introduced the Restricted Stock Compensation Plan
Revised the officer compensation structure and key
performance indicators (KPIs)
Adopted sustainability indicators
as evaluation criteria for officer
compensation
FY2014–FY2015
FY2016–FY2018
1
Board
composition
FY2019
2
FY2020–FY2021
3
FY2022
3
FY2023
FY2024–FY2025
4
3
FY2026
4
3
Total number of Directors
Total number of Directors
Total number of Directors
Total number of Directors
Total number of Directors
Total number of Directors
Total number of Directors
Total number of Directors
Ratio of Outside Directors
%
Ratio of Outside Directors
%
Ratio of Outside Directors
%
Ratio of Outside Directors
%
Ratio of Outside Directors
%
Ratio of Outside Directors
%
Ratio of Outside Directors
%
Ratio of Outside Directors
%
9
11.1
8
Outside Directors (Male)
9
7
22.2
Outside Directors (Female)
Internal Directors
9
6
33.3
10
6
40.0
1
11
7
36.4
1
10
5
50.0
1
10
5
50.0
2
11
5
54.5
2
Corporate value
TOYOBO REPORT 2026
Commitment to
realizing our vision
Introduction
Economic value
Social value
Toyoboʼs earning power
Management strategy to
enhance earning power
Achieving sustainable growth
Business
strategy
Value creation story
Business development
strategy
Human resource
strategy
Green strategy
Sustainability strategy
Corporate
governance
Corporate Governance
Data
56
ESG Performance Data (Governance)
Independence and diversity of the Board of Directors
Basic approach
an advisory body to the Board of Directors. A majority of the committee
members are outside directors, and its chairperson is an outside director,
thereby promoting greater transparency and fairness in these processes.
Organizational structure
Under our corporate philosophy of Jun-Ri-Soku-Yu (adhering to
reason leads to prosperity), Toyobo believes that identifying social
challenges from a long-term perspective and contributing to their
resolution through our unique technologies constitutes the Company s
very reason for being.
To respond to changing times and sustainably enhance corporate value,
we will strive to engage appropriately with all stakeholders, beginning
with shareholders, guided by the principles of ensuring prompt and
accurate decision-making, maintaining management transparency,
and upholding fairness. By fulfilling our fiduciary and accountability
responsibilities to shareholders, we will ensure the effectiveness of
corporate governance and continue efforts to further improve it.
At the Annual General Meeting of Shareholders held in June 2025,
Toyobo transitioned to a company with an Audit and Supervisory
Committee. To respond promptly to a rapidly changing business
environment, certain decision-making authority over business execution
may be delegated, as necessary, to the President and Chief Executive
Officer and others.
At the Board of Directors, the proportion of outside directors has been
increased, placing greater emphasis on deliberation and decisionmaking regarding fundamental management policies and the oversight
of business execution. In addition, officers responsible for audits serve
as members of the Board with voting rights, further strengthening the
Board s supervisory function. These measures establish a structure that
enables both prompt and efficient business execution and high-level
management oversight.
With respect to nominations and remuneration, the Company has
established the Nomination and Compensation Advisory Committee as
Corporate governance structure
(As of June 30, 2026)
External
Election and dismissal
Nomination and Compensation
Advisory Committee
Consultation
Election and
dismissal
Accounting
Auditor
Accounting audit
Board of Directors
Audit
Audit and Supervisory Committee
Ratio of
outside directors
54.5%
Independent outside directors: 6
Internal directors: 5
(55%), including two females (18%)
Decision-making and oversight, and the
appointment and dismissal of executive officers
President
Members: 11, including 6 independent outside directors. The Articles of
Incorporation stipulate that the Board shall consist of no more than 15
members (of which no more than 5 may be directors serving on the Audit and
Supervisory Committee) and that outside directors shall constitute a majority.
Board of
Directors
Submission
and reporting
Reporting
Board of Management
Board of Executive Officers
Sustainability Committee
Reporting
1 internal Audit and Supervisory
Committee member / 2 outside Audit and
Supervisory Committee members (67%)
Audit and
Supervisory
Committee
Nomination
and
Compensation
Advisory
Committee
Risk Management Committee
4.6
Cooperation
Cooperation
Internal Audit
Department
Diversity
Internal audit
Group companies
Audit
Audit
Each Group company’s
corporate auditors
No. of meetings in FY2026: 6
Main agenda items included: president succession planning; proposals
for director nominations; setting Company-wide performance targets
used to calculate short-term incentive compensation; and reviewing the
executive remuneration system.
Members: 11, including those who concurrently serve as directors.
The Chairman and Audit and Supervisory Committee members also
No. of meetings in FY2026: 32
Main agenda items: Same as those of the Board of Directors
Sustainability
Committee
0 3 years: 5 4 9 years: 5
10 years or more: 1
Climate Change and Biodiversity Committee
Functional Internal audit
organization
Members: 4, comprising 3 independent outside directors and the
Chairman, with an outside director serving as chairperson
Members: 12, primarily drawn from the Board of Management, with the
President serving as chairperson.
Average years
of service
Compliance Committee
No. of meetings FY2026: 16*
Main agenda items included: determining audit policies and plans;
conducting operational and accounting audits and sharing the results of visits
to Group companies; reviewing the minutes of important meetings such as
the Board of Directors; sharing discussions with officers; reviewing important
documents; and confirming matters related to the Accounting Auditor.
Board of
participate and may express their opinions.
Management
Assessing
appropriateness
Corporate Planning
Committee
Financial Control
Committee
No. of meetings FY2026: 17
Main agenda items included: review of the 2025 Medium-Term
Management Plan; discussion of the next Medium-Term Management Plan;
management policies for fiscal 2027; business strategies and management
issues; initiatives related to safety, disaster prevention, and quality;
significant investment projects; respect for human rights, promotion of
diversity, and human resource development; research and development,
GX promotion, and TX-related initiatives; and risk management.
Members: 3, including 2 independent outside Audit and Supervisory
Committee members
Reporting
Recommendation 5 internal directors / 6 outside directors
3 outside directors (75%),
including the chair
Business execution
Election and
dismissal
Note: As of the end of June 2026, with respect to members and their respective roles.
Directors’ composition
General Meeting of Shareholders
Internal
Conference and committee overview
18.2%
Male directors: 9
Female directors: 2
Corporate
Planning
Committee
Financial
Control
Committee
No. of meetings in FY2026: 6
Main agenda items included: progress on materiality initiatives and
related indicators; the value creation process; review of the committee
structure and regulations; business continuity management (BCM) and
business continuity planning (BCP); climate change initiatives; human
capital management; social contribution activities; and external ESG
ratings and evaluations.
Members: 20, selected from each specialized field and business division.
The officer in charge of planning serves as chairperson.
No. of meetings in FY2026: 3 (including written resolutions)
Main agenda items included: significant capital investment projects; and
matters related to new businesses.
Members: 6, consisting of a chairperson and 5 standing members
No. of meetings in FY2026: 14
Main agenda items included: investment and financing; debt guarantees and
guarantee commitments (including management guidance letters); provision
of collateral for third parties; and financial and accounting regulations.
- Of the 16 meetings held in fiscal 2026, five were meetings of the Board of Corporate Auditors
held before the transition to a company with an Audit and Supervisory Committee, and 11 were
meetings of the Audit and Supervisory Committee held after the transition.
Corporate value
TOYOBO REPORT 2026
Introduction
Commitment to
realizing our vision
Economic value
Social value
Toyoboʼs earning power
Management strategy to
enhance earning power
Value creation story
Achieving sustainable growth
Business
strategy
Business development
strategy
Human resource
strategy
Green strategy
Sustainability strategy
Corporate
governance
57
Data
Corporate Governance
A survey consisting of 39 questions was conducted, with responses
submitted directly to an external organization commissioned for the task.
3
Analysis and evaluation Based on the aggregated results reported by the external
organization, the evaluation was carried out by the Board of Directors.
1 The Board s composition and the support systems in place for directors continued to receive
Outline of
analysis and
evaluation
results
high marks, consistent with the previous year s results. Multiple responses also noted that the
Board provides an open environment that encourages free discussion and debate, and that its
effectiveness is fully ensured. However, differences in evaluations among respondent groups
indicate that further efforts are needed to continue enhancing the Board s effectiveness.
2 Of the four issues identified in the previous year
(i) understanding capital cost and
profitability, and developing improvement policies; (ii) reviewing the business portfolio; (iii)
CEO succession planning and appointment procedures; and (iv) reviewing Board of Directors
operations following the transition to a company with an Audit and Supervisory Committee
improvements were recognized in items (i) and (ii), resulting in higher evaluations. However,
respondents noted that these initiatives remain a work in progress and require continued
monitoring. In light of the relatively lower evaluations received for items (iii) and (iv) compared
to the other questions, all four items were identified as continuing priorities.
The Board of Directors will strive to improve its overall effectiveness through the following
initiatives.
1
Initiatives to reduce capital costs and improve capital profitability
The Board of Directors will receive reports on this important topic and oversee progress.
2
Issues
and future
initiatives
Initiatives to reform the business portfolio
The Board of Directors will receive reports on this important topic, regularly review progress, and
provide the necessary advice and oversight.
3
Initiatives for CEO succession planning and appointment procedures
The Board of Directors will receive regular reports on the deliberations of the Nomination and
Compensation Advisory Committee to further enhance transparency and fairness.
4
Improving Board of Directors operations
With the aim of transitioning to a monitoring board, the Board of Directors will continue to
improve the efficiency of its operations while further enhancing discussions on medium- to longterm growth.
Formulation process for the 2030 Medium-Term Management Plan
July 2025
November–December 2025
December 2025
February 2026
March 2026
Board of
Directors approval
All directors (including Audit and Supervisory Committee members)
Method
Briefing sessions on the
2030 Medium-Term
Management Plan by
each business division
Participants
2
Executive officer retreat
(Outside directors
participated as observers)
Implementation
method
1
As executive officers took the lead in formulating the 2030 Medium-Term Management Plan, the Board
of Directors engaged in ongoing dialogue and provided advice from the perspective of enhancing
corporate value over the medium- to long-term. It also repeatedly supervised and deliberated on
key issues throughout the process. By participating as observers in executive officer retreats, visiting
production sites, and attending interim progress briefings and business presentations, the Board
deepened its understanding of the Company s desired future state and each business. Through these
activities, it engaged in extensive discussions on the effectiveness of the Medium-Term Management
Plan and the path toward enhancing corporate value.
Interim reports to the
Board of Directors
(Multiple sessions)
To further enhance the effectiveness of the Board of Directors, the Company conducted an overall
analysis and evaluation of the Board s effectiveness in fiscal 2026, with input from an external
organization. The key points of the evaluation are summarized below.
Board of Directors’ involvement in formulating the Medium-Term Management Plan
Executive officer retreat
(Outside directors
participated as observers)
Evaluation of Board effectiveness
Key topics discussed by the Board of Directors
1 Toyoboʼs desired future state
Toyobo s distinctive competitive advantages (value creation story)
Selection of value proposition areas based on core technologies
2 Direction and appropriateness of the growth strategy
Direction of management targets (shift from scale to efficiency)
Appropriateness of Group-wide resource allocation and enhancement measures
(portfolio management) from a long-term perspective
3 Organization and human capital
Organizational and human resource strategies aligned with the management strategy
Direction for strengthening human capital and developing the next generation of leaders
Corporate value
TOYOBO REPORT 2026
Introduction
Commitment to
realizing our vision
Economic value
Toyoboʼs earning power
Management strategy to
enhance earning power
Value creation story
Social value
Achieving sustainable growth
Business
strategy
Business development
strategy
Human resource
strategy
Green strategy
Sustainability strategy
Corporate
governance
Data
58
Corporate Governance
Election and dismissal of executive officers and nomination of director candidates
Policy
In selecting and dismissing senior management (executive
officers who concurrently serve as directors) and nominating
director candidates, consideration is given primarily to whether
candidates possess the character and insight appropriate to their
respective responsibilities, while also considering the Company s
officer nomination criteria. Final decisions are made by the
Board of Directors following deliberation by the Nomination and
Compensation Advisory Committee.
2 Summary of criteria for nomination, etc.
1 Director candidates (excluding directors serving on the Audit
and Supervisory Committee)
Candidates must possess knowledge, achievements,
experience, and skills as executives, along with a Companywide perspective.
Outside directors must have extensive experience and broad
insight that contribute to enhancing corporate value and
meet the Company s independence criteria.
2 Director candidates serving on the Audit and Supervisory
Committee
1 Approach to the composition of the Board of
Directors and the Audit and Supervisory Committee
1 Board of Directors
The Board of Directors is required to possess the expertise and
skills necessary to appropriately carry out strategic direction and
key business decisions, as well as the independence required
to strengthen oversight of the management team. In addition,
to ensure a balanced structure overall while securing diversity
in professional background, gender, age, and other aspects,
the Board is composed of the Chair of the Board, outside
directors, and directors who concurrently serve as executive
officers. Regarding the number of Board members, based on
the principles of (1) ensuring timeliness and accuracy in decisionmaking, (2) securing transparency in management, and (3)
emphasizing fairness, the Articles of Incorporation stipulate that
the Board of Directors must have no more than 15 members,
including up to five who serve as members of the Audit and
Supervisory Committee. The Articles also require that outside
directors constitute a majority of the Board of Directors.
2 Audit and Supervisory Committee
The Audit and Supervisory Committee is composed not only of
members with expertise and skills in finance and accounting but also
includes individuals with knowledge of the Group s business to ensure
the effectiveness of auditing and supervision.
Candidates must be able to make appropriate judgments
from an independent and objective standpoint in auditing
the execution of duties.
Outside directors must, in addition to the above, meet the
Company s independence criteria.
Nomination and other procedures
To ensure fairness and transparency, the Nomination and
Compensation Advisory Committee has been established as an
advisory body to the Board of Directors, with outside directors
making up a majority of its members. The Committee is chaired
by an outside director.
The Nomination and Compensation Advisory Committee reports
to the Board of Directors upon deliberating basic policies and
criteria such as officer nominations, succession planning, and
other matters based on proposals from the president.
Policy and procedures for dismissal
In the event of any conduct suspected of being unfair, unjust, or
constituting a breach of trust, or any other cause of unfitness for
service as an officer, the Board of Directors will make a decision
regarding dismissal upon deliberation by the Nomination and
Compensation Advisory Committee.
CEO succession plan
The Company regards human resource strategy, including
the succession of the CEO and Co-COO, as one of its top
management priorities. With respect to the CEO succession plan,
the Nomination and Compensation Advisory Committee identifies
the qualities required of future leaders based on the anticipated
management environment and discusses the knowledge and
experience that potential successors should further develop.
Potential successors begin developing the knowledge and
perspective required for management from an early stage through
their work assignments and external training programs. They are
also provided with opportunities to cultivate the leadership skills
needed to bring out the best in others and lead organizations, as
well as the personal qualities and high integrity required to earn
the trust of others through a diverse range of experiences.
Training for officers
Newly appointed directors receive explanations regarding
their roles and responsibilities and are sent to external training
programs upon their appointment as executive officers or
directors to support the acquisition of necessary knowledge.
After their appointment, they are also encouraged to continue
participating in external training programs and seminars by
invited lecturers to continuously build on their managerial literacy.
In addition, newly appointed outside directors are provided
with briefings on the Company s operations, finances, and
organizational structure, and are given opportunities to visit
business sites.
Corporate value
TOYOBO REPORT 2026
Introduction
Commitment to
realizing our vision
Economic value
Toyoboʼs earning power
Management strategy to
enhance earning power
Value creation story
Social value
Achieving sustainable growth
Business
strategy
Business development
strategy
Human resource
strategy
Green strategy
Sustainability strategy
Corporate
governance
59
Data
Corporate Governance
Officer compensation system
4 Specific target values are submitted to the Nomination and Compensation
Policy
We have designed our system for officer compensation in accordance
with the following policy items, within the scope of the compensation
amounts approved by the General Meeting of Shareholders.
1 It must provide incentives for the sustainable growth of the Group and the
enhancement of corporate value over the medium- to long-term.
2 It must contribute to securing outstanding management talent.
3 It must have a highly objective, transparent decision-making procedure.
We will review the composition and levels of compensation with
reference to our management environment, employee salary levels,
and current compensation levels at other companies, according to
surveys conducted by external expert organizations.
Monetary compensation
(including a performance-linked component)
1 Composition of monetary compensation
Monetary compensation for directors (excluding outside directors
and directors serving on the Audit and Supervisory Committee)
and executive officers consists of monthly monetary compensation
comprising the following two components.
1 Base compensation
2 Short-term incentive compensation
2 Short-term incentive compensation
1 Short-term incentive compensation reflects both Company-wide and
individual performance, in accordance with the executive s position.
Chair of the Board and Director: Company-wide performance only
Representative Director:
Company-wide performance : individual performance = 2:1
Director (concurrently serving as executive officer):
Company-wide performance : individual performance = 1:1
Executive Officer (not concurrently serving as a director):
Company-wide performance : individual performance = 1:2
2 Individual compensation is calculated by reflecting both Company-wide and
individual performance.
3 Company-wide performance is measured using EBITDA and ROE, key
management indicators, as KPIs, and the payout varies from 0% to
200% depending on the degree of achievement against the targets.
The weighting is EBITDA : ROE = 2:1. Notwithstanding the foregoing,
executive officers (not concurrently serving as directors) are evaluated
solely on EBITDA. These provisions were partially revised in June 2026
and will apply to compensation paid in July 2027 based on performance
in fiscal 2026.
Advisory Committee for review, and based on its recommendations, they
are decided by the Board of Directors.
5 Individual performance is evaluated by setting targets for both the relevant
division and the individual, assessing overall achievement on a 5-point
scale, and adjusting compensation within a 0% to 200% range.
6 Sustainability indicators are included in the evaluation criteria, and
achievement of these indicators results in additional compensation. These
sustainability indicators, based on the annual management policy, serve as
common goals for all executive officers.
Sustainability indicators
The Company has incorporated sustainability indicators into its officer
compensation system. Each year, it establishes KPIs related to safety
and disaster prevention, human capital, and climate change response as
evaluation metrics for short-term incentive compensation and assesses the
degree to which those KPIs have been achieved.
Sustainability
indicators
Safety and
disaster
prevention–
related
indicators
KPIs
FY2026
targets*1
Method of reflection in
compensation
Number of major
accidents:
Zero per
year
Work-related injury
absenteeism rate:
Number of fires and
explosions:
0.25 or An additional 5% of the
below total short-term incentive
compensation base
Zero per amount*2 will be added
year if all items are achieved.
Number of accidents
(leaks):
Zero per
year
Human capital– Results of engagement
related indicator surveys
+5%
An additional 5% of the
compared
total short-term incentive
with the
compensation base
previous
amount*2
survey
Climate change
Reduction in GHG
response–
emissions (Scope 1 and 2)
related indicator
2.7%
reduction
year on
year
An additional 5% of the
total short-term incentive
compensation base
amount*2
*1 As of the end of June 2026, the fiscal 2027 targets had not yet been determined.
*2 The base amount is set at 100% of the short-term incentive compensation.
Stock compensation
To strengthen incentives for a sustained increase in corporate value and to
promote even greater value-sharing with shareholders, we offer a certain
percentage of compensation in the non-monetary form of restricted stock
compensation (non-performance-linked) once a year.
Ratio of compensation
To ensure that incentives function effectively toward enhancing corporate
value, the ratio of base compensation, short-term incentive compensation,
and long-term incentive compensation for directors (excluding outside
directors and directors serving as Audit and Supervisory Committee
members) and executive officers is set at approximately 6:3:1, assuming
100% achievement of KPIs.
Other
1 Compensation for outside directors consists only of a fixed amount of
monetary compensation, given their role and independence.
2 Compensation for directors serving as Audit and Supervisory Committee
members consists solely of fixed monetary compensation, determined in
accordance with their duties and responsibilities. The amount is decided
through discussions among the directors serving as Audit and Supervisory
Committee members, considering their roles and independence.
3 To ensure transparency and objectivity in the determination of compensation,
the Nomination and Compensation Advisory Committee has been established
as an advisory body for the Board of Directors, with outside directors making
up a majority of its members. The committee is consulted by the Board of
Directors and deliberates on the structure, levels, and methods of calculation
of officer compensation, as well as the target amounts for Company-wide
performance evaluations that are a component of the compensation for
each position. The Board of Directors makes final decisions on individual
compensation amounts based on the recommendations of the Nomination
and Compensation Advisory Committee.
Details of officer compensation (FY2026)
Total compensation, etc., by type
Category
Total
compensation
Base
compensation
Non-monetary
Performancecompensation
linked
(restricted stock
compensation
compensation)
Number
of eligible
officers*
Millions of yen Millions of yen Millions of yen Millions of yen
Directors (excluding
Audit and Supervisory
Committee Members)
(of whom, Outside Directors)
305 46
208 46
Directors who are
Audit and Supervisory
Committee Members
(of whom, Outside Directors)
37 14
37 14
3 2
Corporate Auditors
(of whom, Outside
Corporate Auditors)
12 5
12 5
3 2
353 64
256 64
Total
(of whom, Outside Directors)
72
72
26
26
11 6
14 8
- Including officers newly appointed and retired during the term
Corporate value
TOYOBO REPORT 2026
Introduction
Commitment to
realizing our vision
Economic value
Toyoboʼs earning power
Management strategy to
enhance earning power
Value creation story
Social value
Achieving sustainable growth
Business
strategy
Business development
strategy
Human resource
strategy
Green strategy
Sustainability strategy
Dialogue with shareholders and investors
Cross-shareholdings
Approach and policy
Status of cross-shareholdings
The Company s basic policy for corporate communication with stakeholders is to ensure fairness
and equity, strive to provide timely and appropriate disclosure, and promote active communication.
Within this framework, we are committed to
a. information disclosure as a social responsibility (accountability), and
b. communication that protects corporate value.
In particular, we engage in active, two-way communication with our shareholders and investors to
help enhance corporate value.
Example of events held in fiscal 2026
Small meeting with sell-side analysts
In July 2025, the Company held a small meeting at its Tokyo Branch with six sell-side analysts,
including coverage analysts, together with President Takeuchi and then CFO Ono. Participants
exchanged views on the progress of the 2025 Medium-Term Management Plan and the key
elements to be incorporated into the next medium-term management plan. Based on the feedback
received, we developed Toyobo s unique value creation story and formulated the policy for the 2030
Medium-Term Management Plan, which shifts the focus from scale to efficiency. We will continue to
provide similar opportunities in fiscal 2027 to deepen dialogue and provide feedback.
Investor presentation
In October 2025, Minoru Matsubara, Chief Sustainable Officer of Resona Asset Management
Co., Ltd., visited the Company s Head Office to deliver a presentation on enhancing corporate
value through sustainability management. Norio Iizuka and Sonoko Ishimaru, who was an
Executive Officer at the time, together with representatives from the Sustainability and Corporate
Planning Division, participated in the session and exchanged views on the Company s strengths
and challenges from an investor s perspective. The insights gained have been reflected in
enhancements to information disclosure on the Company s website and in its Integrated Report.
Other initiatives
Tour of the Tsuruga Research and Production Center (December 2025)
Dialogue with proxy voting representatives
Company participants: President, Outside Director, and CFO (11 sessions in April 2026)
Dialogue with institutional investors on the Integrated Report
Company participants: Members of the Sustainability and Corporate Planning Division
(five sessions from October to December 2025)
Dialogue with Shareholders and Investors
Corporate
governance
Data
60
Toyobo periodically reviews its cross-shareholdings from various perspectives, including their
contribution to enhancing medium- to long-term corporate value and their economic rationale, and has
a policy of selling shares that are deemed no longer meaningful, as appropriate.
At the same time, the Company may hold shares in key business partners when it determines that
maintaining and strengthening stable business relationships with them will support sustainable growth
and enhance medium- to long-term corporate value. The Board of Directors reviews cross-shareholdings
annually, considering future business strategies, business relationships, and other relevant factors, and
decides whether to continue holding the shares.
When exercising voting rights on cross-shareholdings, we carefully evaluate the status of the business partner
and the content of proposals, and, where necessary, engage in dialogue with the partner. Through this process,
we ensure that such holdings contribute to the sustainable growth and the medium- to long-term enhancement
of corporate value for both the business partner and the Company before making voting decisions accordingly.
As of the end of fiscal 2026, the Company held cross-shareholdings in 48 companies with a fair value of
¥2.0 billion, representing 1% of consolidated net assets.
Trends in cross-shareholdings
(Number of companies)
100
80
Market value
10.0
8.5
82
65
60
3.7
40
3.0
2021
2022
2023
54
2.5
2024
50
2.4
2025
48
2.0
2026
Percentage of consolidated
net assets
March 31, 2021
4%
March 31, 2022
2%
6.0
March 31, 2023
1%
4.0
March 31, 2024
1%
2.0
March 31, 2025
1%
March 31, 2026
1%
8.0
62
20
0
Number of companies held (¥bn)
0.0
(FY)
Note: Total of listed and unlisted shares on a nonconsolidated basis
Corporate value
TOYOBO REPORT 2026
Introduction
Commitment to
realizing our vision
Economic value
Social value
Toyoboʼs earning power
Management strategy to
enhance earning power
Value creation story
Achieving sustainable growth
Business
strategy
Business development
strategy
Key 11-year financial data
Green strategy
Sustainability strategy
Corporate
governance
Data
61
*1 Since fiscal 2019, Toyobo has applied the Partial Amendments to Accounting Standard for Tax Effect Accounting.
The figures for fiscal 2018 have been adjusted to reflect this change retroactively.
2016
2017
2018
2019
2020
Total assets
444,587
450,790
445,495
461,047
488,874
Interest-bearing debt
165,358
169,230
145,594
164,769
175,139
20,101
32,179
25,857
22,167
25,084
17,336
18,360
21,259
25,512
36,445
Fiscal year
Human resource
strategy
2021
2022
2023
2024
2025
2026
491,188
517,774
588,906
606,990
617,799
627,667
186,958
191,249
229,405
249,244
267,869
261,005
34,526
26,433
60,204
33,310
27,427
30,128
23,253
33,640
42,734
61,569
43,158
29,041
Items of consolidated statements of income (millions of yen)
Ordinary profit
Extraordinary income
Extraordinary losses
Profit (loss) attributable to owners of parent
Comprehensive income
Items of consolidated balance sheet (millions of yen)*
Non-current assets
Current liabilities
Non-current liabilities
Cash flows (millions of yen)
Cash flows from financing activities
Free cash flow
Cash and cash equivalents at end of period
Capital expenditure, depreciation and amortization,
and R&D expenses (millions of yen)
Capital expenditure
Corporate value
TOYOBO REPORT 2026
Introduction
Commitment to
realizing our vision
Economic value
Toyoboʼs earning power
Management strategy to
enhance earning power
Value creation story
Social value
Achieving sustainable growth
Business
strategy
Business development
strategy
Human resource
strategy
Green strategy
Corporate
governance
Sustainability strategy
62
Data
*2 As of October 1, 2017, Toyobo consolidated every 10 shares of its common stock into one share. In addition, the number of shares comprising one unit of stock changed from 1,000 to 100
on the same date. *3 ROE: Profit attributable to owners of parent average fiscal year-end/year-initial total shareholders equity *4 ROA: Operating profit total assets *5 ROIC: NOPAT
average fiscal year-end/year-initial invested capital (invested capital: Net assets + interest-bearing debt) *6 Calculated using fiscal 2015 as the base year *7 EBITDA: Operating profit +
depreciation and amortization (including goodwill) *8 From fiscal 2016 to fiscal 2022, the D/E ratio is shown after adjusting for the capital-like treatment of subordinated loans. From fiscal
2025, the D/E ratio is shown after adjusting for the capital-like treatment of both subordinated loans and subordinated bonds. *9 In fiscal 2017, we changed the activated carbon fiber (AC)
business from Industrial Materials to Healthcare, and the acrylate-based fiber (AP) business from Industrial Materials to Textiles and Trading. *10 Business segments were changed in fiscal
2021. Accordingly, figures for fiscal 2020 have been reclassified under the altered categories to facilitate comparison. *11 Business segments were changed in fiscal 2024. Accordingly, figures
for fiscal 2023 have been reclassified under the altered categories to facilitate comparison.
Key 11-year financial data
2016
2017
2018
2019
2020
2021
2022
2023
2024
2025
Book value per share (BPS)
176.75
188.98
2,034.04
1,989.29
2,003.01
2,090.47
2,192.17
2,146.46
2,236.50
2,215.11
Earnings (loss) per share (EPS)
11.43
10.64
146.93
(6.80)
155.12
47.30
144.75
(7.37)
27.87
22.73
Dividend per share
3.50
3.50
40.00
40.00
40.00
40.00
40.00
40.00
40.00
40.00
40.00
Overseas sales ratio (%)
29.5
29.2
29.0
30.5
32.3
33.0
34.3
36.8
39.9
39.9
39.1
Operating profit margin (%)
6.6
7.1
7.2
6.5
6.7
7.9
7.6
2.5
2.2
3.9
Fiscal year
2026
Per-share information (yen)*2
Financial indicators
Return on equity (ROE)*3 (%)
6.4
5.8
7.5
(0.3)
7.8
2.3
6.8
(0.3)
1.3
1.0
Return on assets (ROA)*4 (%)
5.2
5.2
5.4
4.7
4.7
5.4
5.5
1.7
1.5
2.7
4.4
1.7
4.8
4.8
4.9
14.78
18.14
14.29
Price-to-book (P/B) ratio
0.96
1.02
1.03
Total return ratio (%)
30.6
32.9
27.2
Return on invested capital (ROIC)*5 (%)
Price-to-earnings (P/E) ratio
Dividend on equity (DOE) (%)
Total shareholder return (TSR)6 (%)
Equity ratio (%)
EBITDA7 (millions of yen)
0.71
4.5
5.0
5.1
7.37
30.11
7.55
0.57
0.68
0.50
25.8
84.6
27.6
0.48
1.3
2.3
40.44
41.45
0.50
0.43
156.5
176.1
2.0
1.9
2.0
2.0
2.0
2.0
1.9
1.8
1.8
1.8
106.5
123.5
136.4
96.6
82.3
102.1
84.1
83.3
91.2
82.2
35.3
37.2
40.5
38.3
36.4
37.8
37.6
32.2
32.5
31.6
37,557
38,272
39,589
37,550
39,799
45,752
48,509
29,113
28,802
39,351
1.21
1.26
1.37
5.8
7.5
6.1
166,842
D/E ratio
1.05
1.01
0.81
0.93
0.98
1.01
0.98
Adjusted D/E*8
0.92
0.88
0.70
0.82
0.87
0.89
0.87
Net debt/EBITDA ratio
3.9
3.6
3.0
3.8
3.8
3.3
3.4
1.15
Results by business segment (millions of yen)*9,*10,*11
Net sales
Operating
profit
Films and Functional Polymers
143,398
138,574
148,667
156,241
Films and Functional
Materials
127,127
152,842
170,326
Films
146,064
156,531
Industrial Materials
70,522
59,925
63,454
66,540
Mobility
43,905
36,573
44,721
Life Science
38,134
34,564
34,341
Healthcare
27,723
36,423
35,723
34,675
Lifestyle and Environment
128,409
109,148
114,295
110,796
115,327
110,807
92,361
95,665
98,062
12,567
12,178
11,980
Textiles and Trading
85,486
77,552
68,317
64,585
Life Science
25,538
27,087
35,003
Real Estate and Other Business
20,634
17,013
14,987
14,657
14,629
11,757
11,375
Films and Functional Polymers
9,920
12,747
13,713
13,727
Real Estate and Other
Business
Films and Functional
Materials
Environmental and
Functional Materials
Functional Textiles
and Trading
Real Estate and
Other Business
14,582
20,028
19,897
Films
1,623
2,688
6,920
Industrial Materials
6,288
3,875
4,262
2,620
Mobility
(701)
(1,572)
(1,753)
Life Science
9,212
4,438
2,010
Healthcare
4,726
5,242
5,179
5,170
Lifestyle and Environment
5,936
4,376
3,453
4,048
4,668
7,961
Textiles and Trading
2,500
1,066
645
914
Life Science
3,798
4,517
8,655
(2,514)
(1,044)
539
Real Estate and Other Business
2,841
3,344
2,819
2,233
Real Estate and Other
Business
2,623
2,302
2,218
Environmental and
Functional Materials
Functional Textiles
and Trading
Real Estate and
Other Business
2,187
3,014
2,554
Adjustment
(3,152)
(2,941)
(2,694)
(2,936)
Adjustment
(3,444)
(2,993)
(4,041)
Adjustment
(4,492)
(4,768)
(3,331)
Corporate value
TOYOBO REPORT 2026
Introduction
Commitment to
realizing our vision
Economic value
Toyoboʼs earning power
Management strategy to
enhance earning power
Social value
Achieving sustainable growth
Business
strategy
Value creation story
Business development
strategy
Human resource
strategy
Green strategy
Sustainability strategy
Corporate
governance
External Assurance
63
Data
ESG Performance Data
Key sustainability data
FY2026 results
Planet
Data aggregation period: (Domestic) April 1, 2025, to March 31, 2026 (Overseas) January 1, 2025, to December 31, 2025
FY2026 results
Scope 1
621 thousand t-CO
Scope 2
150 thousand t-CO
GHG emissions per unit of sales
Energy consumption
Category 1 Purchased goods and services
Scope: Toyobo Group
Calculation methods
1.83 t-CO per million yen
2,753 GWh
2,118 thousand t-CO
(1) The calculations are based on the following standards and guidelines. In reference to the GHG Protocol, energy-related CO emissions include emissions calculated by
converting the energy required to produce electricity or steam sold to other companies. The reporting scope covers the Toyobo Group and also includes Hokuriku Air
Chemicals Corporation, an affiliated company located within the Tsuruga Research and Production Center that supplies utilities.
GHG Protocol: A Corporate Accounting and Reporting Standard and Scope 2 Guidance
Ministry of the Environment and Ministry of Economy, Trade and Industry: Greenhouse Gas Emissions Accounting and Reporting Manual (Ver. 6.1) (2026)
(2) The following emission factors are used in the calculations.
CO emission factors for purchased gas:
(Domestic) Alternative values (ministerial ordinance emission factors) as listed in the Ministry of the Environment s Emission Factors by Gas Supplier (for Calculating
Greenhouse Gas Emissions of Specified Emitters) FY2025 Supply Data.
CO emission factors for purchased electricity:
(Domestic) Basic emission factors by electricity supplier as listed in the Ministry of the Environment s Emission Factors by Electricity Supplier (for Calculating Greenhouse Gas
Emissions of Specified Emitters) FY2024 Results
(Overseas) International Energy Agency (IEA) s country-specific emission factors for 2023 as published in Emissions Factors 2025 (2025)
CO emission factors other than those for purchased gas and purchased electricity: (Domestic and overseas) Ministry of the Environment and Ministry of Economy, Trade and
Industry s Greenhouse Gas Emissions Accounting and Reporting Manual (Ver. 6.1) (2026)
Total Scope 1 and Scope 2 emissions
consolidated net sales
In reference to the GHG Protocol, the energy required to produce electricity or steam sold to other companies is not deducted.
The unit calorific values of fuels are based on the Energy Conservation Act and are expressed as higher heating values.
Calculated by multiplying the amount spent on purchased goods and services during the fiscal year by the applicable emission factors and aggregating the results.
Category 3 Fuel- and energy-related activities not included in
Scope 1 or Scope 2
116 thousand t-CO
Calculated by multiplying the quantity of fuel and electricity purchased during the fiscal year by the applicable emission factors for each type of fuel and electricity, and
aggregating the results.
Category 11 Use of sold products
204 thousand t-CO
Calculated for VOC recovery equipment, urinary sediment analyzers, and the fully automated gene analysis systems.
Calculated by multiplying the amount of utilities (e.g., electricity, steam, and chilled water) consumed during the use of final products sold during the fiscal year (activity data) by
the applicable emission factors, useful life, and operating rate, and aggregating the results.
Proprietary emission factors are calculated based on the emission factors listed in (2) below and the specifications of the equipment used to generate each utility.
Total Scope 3 (including categories other than those listed above)
3,013 thousand t-CO
For certain categories, emissions for subsidiaries are calculated using weighted averages based on factors such as the ratio of net sales and the ratio of the number of employees.
Scope 3
People
FY2026 results
Ratio of female employees in management positions1, 2
5.6%
Ratio of female directors*3
18.2%
Training investment per employee (and training time)*1
¥30,0 0 0 (12.21 hours)
Ratio of annual paid leave taken*1
80.8%
Ratio of eligible male employees taking childcare leave*1
116.2%
Employment ratio of people with disabilities*3,*4
2.46%
0.62
Frequency rate of workplace accidents resulting in lost workdays5
Frequency of meetings with employees and labor unions3
72
Implementation of human rights education and training*1,*6
55.6%
Number of employees transferred through the internal job posting system (cumulative)*7,*8
25
Innovation
FY2026 results
R&D expenses
Number of patents held
¥14.1 billion
6,821
(1) The calculations are based on the following standards and guidelines.
GHG Protocol: Corporate Value Chain (Scope 3) Accounting and Reporting Standard and Scope 3 Calculation Guidance
World Business Council for Sustainable Development (WBCSD) and World Resources Institute (WRI): Technical Guidance for Calculating Scope 3 Emissions:
Supplement to the Corporate Value Chain (Scope 3) Accounting & Reporting Standard
Ministry of the Environment and Ministry of Economy, Trade and Industry s Basic Guidelines on Accounting for Greenhouse Gas Emissions Throughout the Supply
Chain (Ver. 2.8) (2026)
(2) The following emission factor databases are used in the Scope 3 calculations.
Ministry of the Environment s Emission Factor Database for Calculating Greenhouse Gas Emissions Throughout the Supply Chain (Ver. 3.6) (2026)
National Institute of Advanced Industrial Science and Technology (AIST) s AIST-IDEA Ver. 3.5.1 (Climate Change IPCC 2021 GWP 100a without LULUCF) (2025)
International Energy Agency (IEA) s country-specific emission factors for 2023 as published in Emissions Factors 2025 (2025)
*1 Scope: TOYOBO CO., LTD., TOYOBO MC Corporation, and TOYOBO STC CO., LTD.
*2 Calculation method: Calculated based on the provisions of the Act on Promotion of Women s Participation and Advancement in the Workplace (including employees
on secondment whose primary employer is one of the three companies mentioned above).
*3 Scope: TOYOBO CO., LTD.
*4 Data as of June 1, 2025.
*5 Scope: TOYOBO CO., LTD., and domestic consolidated subsidiaries. Reporting period: January 1, 2025, to December 31, 2025.
*6 Beginning in fiscal 2026, the criteria for counting participants in human rights education and training were revised.
*7 Scope: TOYOBO CO., LTD., TOYOBO MC Corporation, TOYOBO STC CO., LTD., and TOYOBO TEXTILE CO., LTD.
*8 Cumulative number of employee transfers since the introduction of the internal job posting system in fiscal 2023.
Indicators for fiscal 2026 marked with this icon are externally assured by KPMG AZSA Sustainability Co., Ltd. See page 64 of this
Integrated Report for the independent practitioner s limited assurance report. Details p.64
GHG emissions quantification is subject to uncertainty in measuring activity data, determining emission factors, and the scientific
uncertainty associated with global warming potentials.
Relevant laws are abbreviated as follows: the Act on the Rational Use of Energy and Shift to Non-Fossil Energy (Energy Conservation Act)
and the Act on Promotion of Women s Participation and Advancement in the Workplace (Act on Promotion of Women s Participation).
Corporate value
TOYOBO REPORT 2026
Introduction
Commitment to
realizing our vision
Economic value
Toyoboʼs earning power
Management strategy to
enhance earning power
Value creation story
Social value
Achieving sustainable growth
Business
strategy
Business development
strategy
Human resource
strategy
Green strategy
Sustainability strategy
Corporate
governance
Data
64
Key sustainability data
p.63
Please refer here for items covered by third-party assurance.
Independent practitioner’s limited assurance report
Independent practitioner’s limited assurance report
Independent Practitioner’s Limited Assurance Report
To the President & Representative Director, CEO & Co-COO of TOYOBO CO., LTD.
Conclusion
We have performed a limited assurance engagement on whether selected environmental performance indicators (the subject
matter information or the SMI ) presented in TOYOBO CO., LTD. s (the Company ) TOYOBO REPORT 2026 (the Report )
for the year ended March 31, 2026 have been prepared in accordance with the criteria (the Criteria ), which are established
by the Company and are explained in the Report. The SMI subject to the assurance engagement is indicated in the Report
.
with the symbol
Based on the procedures performed and evidence obtained, nothing has come to our attention to cause us to believe that
the Company s SMI for the year ended March 31, 2026 is not prepared, in all material respects, in accordance with the Criteria.
Basis for Conclusion
We conducted our engagement in accordance with International Standard on Assurance Engagements (ISAE) 3000 (Revised),
Assurance Engagements Other Than Audits or Reviews of Historical Financial Information, and International Standard on
Assurance Engagements (ISAE) 3410, Assurance Engagements on Greenhouse Gas Statements, issued by the International
Auditing and Assurance Standards Board (IAASB). Our responsibilities under those standards are further described in the Our
responsibilities section of our report.
We have complied with the independence and other ethical requirements of the International Code of Ethics for Professional
Accountants (including International Independence Standards) issued by the International Ethics Standards Board for
Accountants (IESBA).
Our firm applies International Standard on Quality Management (ISQM) 1, Quality Management for Firms that Perform Audits
or Reviews of Financial Statements, or Other Assurance or Related Services Engagements, issued by the IAASB. This standard
requires the firm to design, implement and operate a system of quality management, including policies or procedures
regarding compliance with ethical requirements, professional standards and applicable legal and regulatory requirements.
We believe that the evidence we have obtained is sufficient and appropriate to provide a basis for our conclusion.
Other information
Our conclusion on the SMI does not extend to any other information that accompanies or contains the SMI (hereafter
referred to as other information ). We have read the other information but have not performed any procedures with respect
to the other information.
Responsibilities for the SMI
Management of the Company are responsible for:
designing, implementing and maintaining internal controls relevant to the preparation of the SMI that is free from
material misstatement, whether due to fraud or error;
selecting or developing suitable criteria for preparing the SMI and appropriately referring to or describing the criteria used; and
preparing the SMI in accordance with the Criteria.
management of a different but acceptable measurement method, activity data, emission factors, and relevant assumptions
or parameters could have resulted in materially different amounts being reported.
Our responsibilities
We are responsible for:
planning and performing the engagement to obtain limited assurance about whether the SMI is free from material
misstatement, whether due to fraud or error;
forming an independent conclusion, based on the procedures we have performed and the evidence we have obtained; and
reporting our conclusion to the Company s management.
Summary of the work we performed as the basis for our conclusion
We exercised professional judgment and maintained professional skepticism throughout the engagement. We designed
and performed our procedures to obtain evidence about the SMI that is sufficient and appropriate to provide a basis for our
conclusion. Our procedures selected depended on our understanding of the SMI and other engagement circumstances, and
our consideration of areas where material misstatements are likely to arise. In carrying out our engagement, the procedures
we performed primarily consisted of:
assessing the suitability of the criteria applied to prepare the SMI;
conducting interviews with the relevant personnel of the Company to obtain an understanding of the key processes,
relevant systems and controls in place over the preparation of the SMI;
performing analytical procedures including trend analysis;
identifying and assessing the risks of material misstatements;
evaluating whether the Company s process for developing estimates as well as its use of data, selection of the methods
and assumptions were appropriate;
performing site visits at one of the Company s factories and one of the Company s subsidiaries which were determined
through our risk assessment procedures;
performing, on a sample basis, recalculation of amounts presented as part of the SMI;
performing other evidence gathering procedures for selected samples; and
evaluating whether the SMI was presented in accordance with the Criteria.
The procedures performed in a limited assurance engagement vary in nature and timing from, and are less in extent than
for, a reasonable assurance engagement. Consequently, the level of assurance obtained in a limited assurance engagement
is substantially lower than the assurance that would have been obtained had a reasonable assurance engagement been
performed.
/s/ Shinnosuke Kayumi
Shinnosuke Kayumi, Engagement Partner
KPMG AZSA Sustainability Co., Ltd.
Osaka Office, Japan
October 7, 2026
Inherent limitations in preparing the SMI
As described in the Report, GHG emissions quantification is subject to uncertainty when measuring activity data, determining
emission factors, and considering scientific uncertainty inherent in the Global Warming Potentials. Hence, the selection by
Notes to the Reader of Assurance Report:
This is a copy of the Assurance Report and the original copies are kept separately by the Company and KPMG AZSA Sustainability Co., Ltd.
Corporate value
TOYOBO REPORT 2026
Introduction
Commitment to
realizing our vision
Economic value
Social value
Toyoboʼs earning power
Management strategy to
enhance earning power
Achieving sustainable growth
Value creation story
Business
strategy
Business development
strategy
Human resource
strategy
Green strategy
Sustainability strategy
Corporate
governance
65
Data
Corporate data (As of March 31, 2026)
Corporate data
Stock information
Company name
TOYOBO CO., LTD
Established
May 3, 1882
Head office
Osaka Umeda Twin Towers South, 1-13-1 Umeda, Kita-ku,
Osaka 530-0001, Japan
Main TEL: +81-6-6348-3111
Number of employees 9,398 (consolidated) / 2,885 (non-consolidated)
External recognition
Stock exchange
listing
Tokyo Stock Exchange Prime Market
Securities code
3101
Administrator
of shareholder
register
Sumitomo Mitsui Trust Bank, Limited
Accounting
Auditor
KPMG AZSA LLC
Number of shares
Total number of authorized shares:
200,000,000
Total number of shares issued:
89,048,792 shares
Paid-in capital
¥51,730 million
Number of
shareholders
68,089
Annual general
meeting of
shareholders
Held annually in June
Number of shares
per unit
100
Inclusion in ESG indices
In June 2021, the Company was selected for inclusion in the FTSE JPX Blossom Japan Index,
a globally recognized ESG (Environmental, Social, and Governance) investment index. It was
subsequently selected for inclusion in the MSCI Nihonkabu ESG Select Leaders Index in
December 2021 and the FTSE JPX Blossom Japan Sector Relative Index in March 2022.
We are also included as a constituent stock in the MSCI Japan Empowering Women Index
(WIN) and the S&P/JPX Carbon Efficient Index. We have been selected as a constituent
security in ESG indices targeting Japanese stocks referenced by Japan s Government
Pension Investment Fund (GPIF) (as of June 2026; continuously selected).
FTSE Russell confirms that TOYOBO CO., LTD. has been
independently assessed according to the index criteria and
has satisfied the requirements to become a constituent of the
FTSE JPX Blossom Japan Index. Created by the global index
and data provider FTSE Russell, the FTSE JPX Blossom Japan
Index is designed to measure the performance of companies
demonstrating strong Environmental, Social and Governance (ESG)
practices. The FTSE Blossom Japan Index is used by a wide variety
of market participants to create and assess responsible investment
funds and other products.
FTSE Russell confirms that TOYOBO CO., LTD. has been
independently assessed according to the index criteria and has
satisfied the requirements to become a constituent of the FTSE
JPX Blossom Japan Sector Relative Index. The FTSE JPX Blossom
Japan Sector Relative Index is used by a wide variety of market
participants to create and assess responsible investment funds and
other products.
FTSE Blossom Index Series
THE INCLUSION OF TOYOBO CO., LTD. IN ANY MSCI
INDEX, AND THE USE OF MSCI LOGOS, TRADEMARKS,
SERVICE MARKS OR INDEX NAMES HEREIN, DO NOT
CONSTITUTE A SPONSORSHIP, ENDORSEMENT OR
PROMOTION OF TOYOBO CO., LTD. BY MSCI OR ANY OF
ITS AFFILIATES. THE MSCI INDEXES ARE THE EXCLUSIVE
PROPERTY OF MSCI. MSCI AND THE MSCI INDEX NAMES
AND LOGOS ARE TRADEMARKS OR SERVICE MARKS OF
MSCI OR ITS AFFILIATES.
Other ratings
Securities companies
3.91%
Individuals
and others
Foreign
companies Number of
and others shareholders
24.33%
68,089
Financial institutions
27.56%
EcoVadis Sustainability Rating
Number of
shares held
(thousands)
Shareholding
ratio (%)
The Master Trust Bank of Japan, Ltd.
(Trust Account)
11,827
13.40
Custody Bank of Japan, Ltd.
(Trust Account)
7,064
8.01
Toyobo Employees Stockholders Association
2,282
2.59
Toyukai
2,175
2.47
STATE STREET BANK AND TRUST COMPANY
505223
2,138
2.42
GOVERNMENT OF NORWAY
2,017
2.29
JPMorgan Securities Japan Co., Ltd.
1,921
2.18
NIPPON LIFE INSURANCE COMPANY
1,750
1.98
Meiji Yasuda Life Insurance Company
1,402
1.59
JP MORGAN CHASE BANK 38578
1,267
1.44
Shareholder name
Distribution of shares by shareholder
(according to number of shares owned)
Other domestic
companies
4.51%
Major shareholders
39.69%
Note: Treasury stock (804,024 shares) is excluded from shareholding ratio calculations.
Share price
Five-year highest/lowest by fiscal year
Fiscal year
2022
2023
2024
2025
2026
Highest price (yen)
1,505
1,134
1,182
1,163
1,857
Lowest price (yen)
1,046
979
980
885
808
Note: The highest and lowest share prices are those quoted on the Tokyo Stock Exchange First Section
for fiscal 2022 and on the Prime Market for fiscal 2023 through fiscal 2026.
TOYOBO CO., LTD.
Sustainability and Corporate Planning Division
URL: https://www.toyobo-global.com/
Inquiries: https://krs.bz/toyobo/m/en_inquiry
Disclaimer
This report contains forward-looking statements that reflect the plans, outlook, strategies, and performance of Toyobo Group. These
forward-looking statements are based on judgments made with currently available information. Please be aware that actual performance
might differ significantly from these forward-looking statements due to various factors, including risks and uncertainties. Factors
influencing our future outlook include, but are not limited to, the economic environments in which we conduct business operations,
competitive pressures, related laws and regulations, changes in the status of product development, and exchange rate fluctuations.












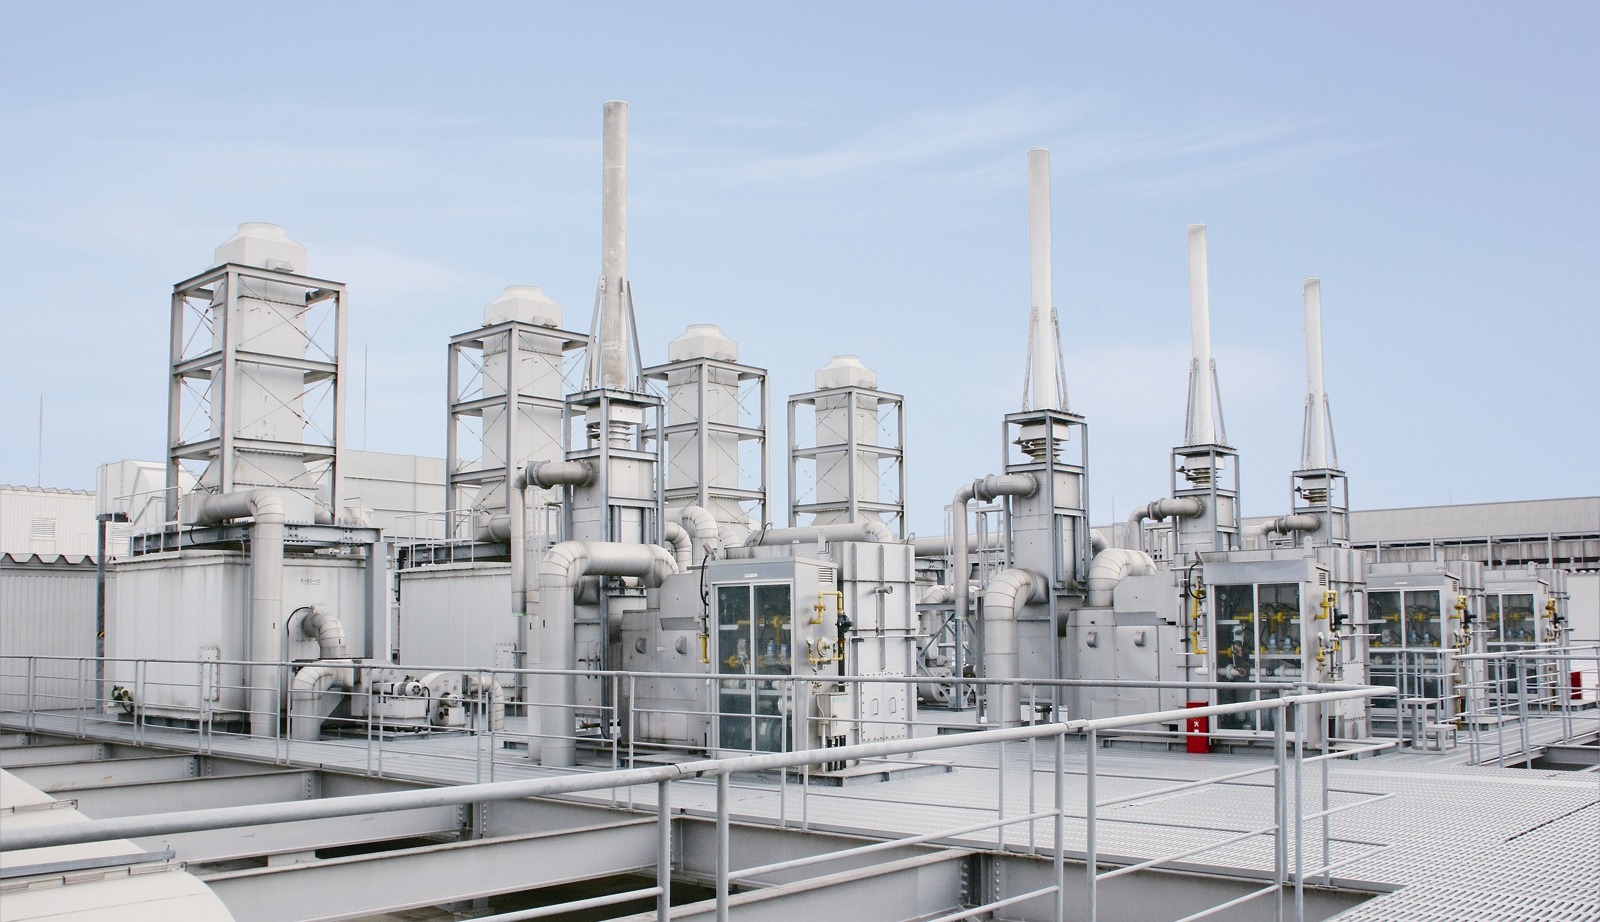

 鮮度保持フィルム「オリエステル®」
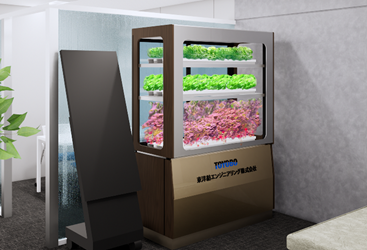 植物工場のミニプラント(イメージ)
 三次元網状繊維構造体「ブレスエアー®」