2026/08/31 10:27:39 / 26335504̲株式会社物語コーポレーション̲招集通知̲電子提供措置用 57期 第 定時株主総会 招集ご通知 日時 2026年9月25日(金曜日) 午前10時 受付開始予定時刻:午前9時15分 場所 愛知県豊橋市花田町西宿 ホテルアソシア豊橋 5階 「ザ…
2026/08/31 10:27:39 / 26335504̲株式会社物語コーポレーション̲招集通知̲電子提供措置用
57期
第
定時株主総会
招集ご通知
日時
2026年9月25日(金曜日) 午前10時
受付開始予定時刻:午前9時15分
場所
愛知県豊橋市花田町西宿
ホテルアソシア豊橋 5階
「ザ ボールルーム」
※末尾の株主総会会場ご案内図をご参照ください。
書面またはインターネットなどによる議決権行使期限
2026年9月24日(木曜日)午後6時まで
※詳細につきまして、8頁をご確認ください。
表紙
議案
第1号議案
第2号議案
第3号議案
第4号議案
第5号議案
目次
剰余金の処分の件
定款一部変更の件
取締役7名選任の件
監査役1名選任の件
取締役(社外取締役を除く。)に対する業績条件
付譲渡制限付株式付与のための報酬決定の件
ごあいさつ……………………………………… 1
第57期定時株主総会招集ご通知 …………… 6
株主総会参考書類………………………………10
事業報告…………………………………………29
連結計算書類……………………………………49
計算書類…………………………………………51
監査報告…………………………………………53
2026/08/31 10:27:39 / 26335504̲株式会社物語コーポレーション̲招集通知̲電子提供措置用
Smile & Sexy
私たちは
“Smile & Sexy”
すなわち
素敵に自由に
正々堂々、人間味豊かに
それぞれの『自分物語』
みんなの『会社物語』
を語る
Storyteller : 語り部
でありつづけます
私たちの経営理念
「Smile & Sexy」
代表取締役社長
「Smile & Sexy」
(スマイル アンド セクシー)を端的に表現すると「自立し
た人間は素敵であり、自ら意思決定ができる」というものです。この体現こ
そ当社の強みである「人財力」の源泉であり、物語コーポレーションが厳し
い環境変化に対応し、勝ち抜くための底力であると考えています。
ごあいさつ
株主の皆様には平素より格別のご高配を賜り、厚く御礼申し上げます。「第57期定時株主総会招集ご通
知」をお届けするにあたり、謹んでご挨拶申し上げます。
2026年6月期の外食業界は堅調に推移したものの、原材料価格・光熱費等の上昇や物価高による消費者
の節約志向の高まりなど、依然として厳しい事業環境でありました。こうした中、当社グループの売上向
上施策として既存店舗の内外装の積極的な改装、看板商品の磨きこみやグランドメニューの変更、サービ
ス力の強化等、他社とのさらなる差別化を図るとともに顧客体験価値の向上に注力し、6期連続の増収増
益となりました。
これもひとえに、株主の皆様の温かいご支援の賜物と深く御礼申し上げます。
-1-
Top Interview*01*
2026/08/31 10:27:39 / 26335504̲株式会社物語コーポレーション̲招集通知̲電子提供措置用
Top Interview
心に、事業を推進してまいりました。
2026年6月期を振り返って
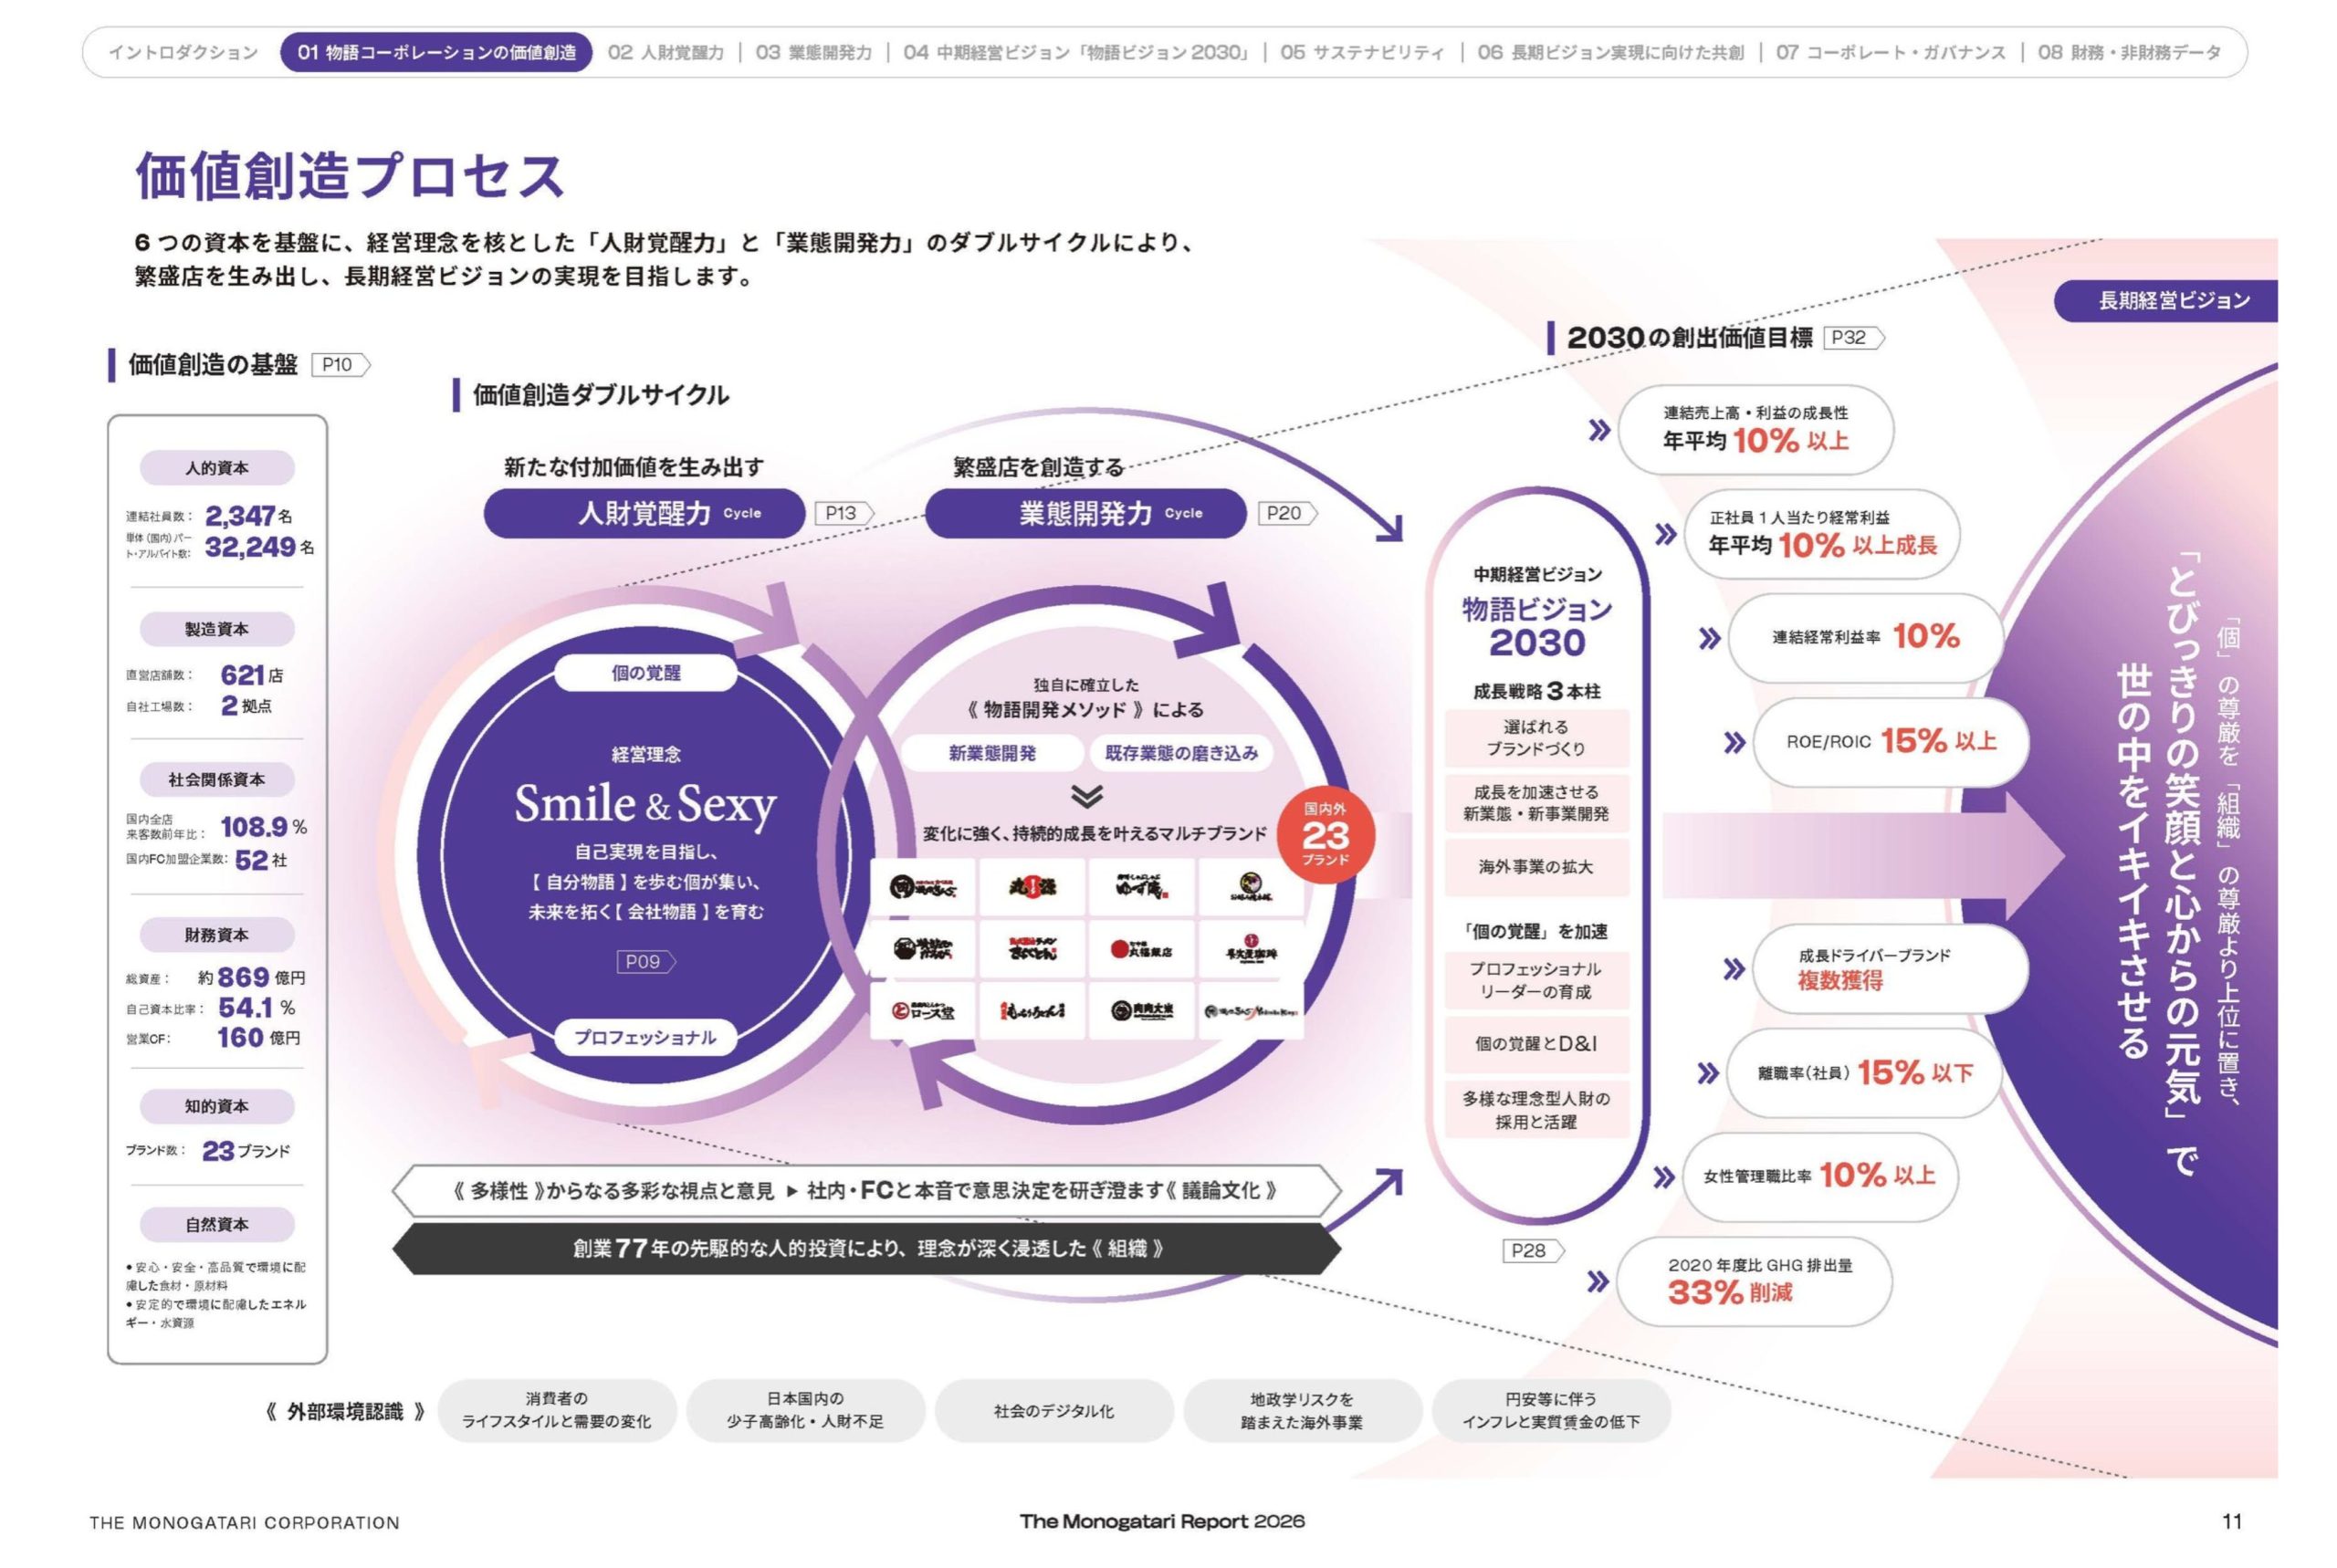
中期経営ビジョン「物語ビジョン2030」の
初年度として好調なスタートを
人口減少と競争激化が進む国内の外食市場で成
長を持続させるためには、新たな市場への拡大の
切ることができました
みならず、各市場におけるシェア拡大が不可欠で
当社グループは、グループ店舗売上高3,000億
す。このシェアを上げるための取り組みが「選ば
円、連結売上高2,200億円の達成を目指す中期経
れるブランドづくり」です。魅力的な商品やサー
営ビジョン「物語ビジョン2030」および2028
ビス、接客によってお客様に価値を感じていただ
年6月期までの中期3カ年経営計画を策定してい
けるお店をつくり、愛され選ばれるブランドにな
ます。本ビジョンでは、「業態開発型リーディン
ることが重要です。『焼肉きんぐ』
『丸源ラーメン』
グカンパニー実現に向けた全方位成長戦略」を基
『寿司・しゃぶしゃぶ ゆず庵』は、原材料価格の
本方針とし、重点戦略として「業態開発力×人財
高騰等に伴う価格改定を行いながらも商品力・
力」を掲げています。業態開発力においては、
「選
サービス力の磨きこみや認知度の向上により、客
ばれるブランドづくり」「成長を加速させる新業
数を維持・拡大いたしました。これによりお客様
態・新事業開発」「海外事業の拡大」の3本柱を中
の期待を超える顧客体験価値を提供することがで
中期経営ビジョン「物語ビジョン2030」
テーマ
業態開発型リーディングカンパニー実現に向けた全方位成長戦略
主要経営目標
既存店売上高・来客数
プラス成長
グループ店舗売上高
連結売上高
3,000億円
2,200億円
-2-
Top Interview*01*
連結売上高利益の成長性
年平均10%以上
2026/08/31 10:27:39 / 26335504̲株式会社物語コーポレーション̲招集通知̲電子提供措置用
Top Interview
きたと考えております。
以上の結果により、当期は6期連続で増収増益
こうした主力ブランドが伸長しているうちに、
を達成し、2030年6月期に掲げるグループ店舗
次の成長エンジンとなる新業態開発を行う必要が
売上高3,000億円の実現に向けた確かな手ごたえ
あります。当期は、ラーメンを名物とした町中華
を得る1年となりました。
業態『町中華丸福飯店』や高いコストパフォー
マンスを誇るうどんレストラン業態『肉讃岐 もっ
そして、この成長を支えているのは当社の「人
ちりうどん源次郎』の1号店を新たにオープンし
財力」です。当社では、一人ひとりがもつ力を最
ました。いずれも郊外ロードサイドでファミリー
大限に出しきって天井を突き抜け、ブレイクス
層をターゲットに展開し、今後の多店舗展開を見
ルーすることを「個の覚醒」と定義しています。
据えたフォーマット改善を重ねてまいります。
個が覚醒しながら経営理念「Smile & Sexy」を
体現するには、一人ひとりが自分らしく、自らの
海外事業においては、ハンバーグ専門店『肉肉
意見を自由に発信できる環境づくりが必要不可欠
大米』が新たにシンガポール、台湾、タイに進出
です。自らの意思や考えを率直に述べ、自由闊達
し、現在7カ国・地域で86店舗に拡大しました。
な議論が交わされることで、議論の質が高まり、
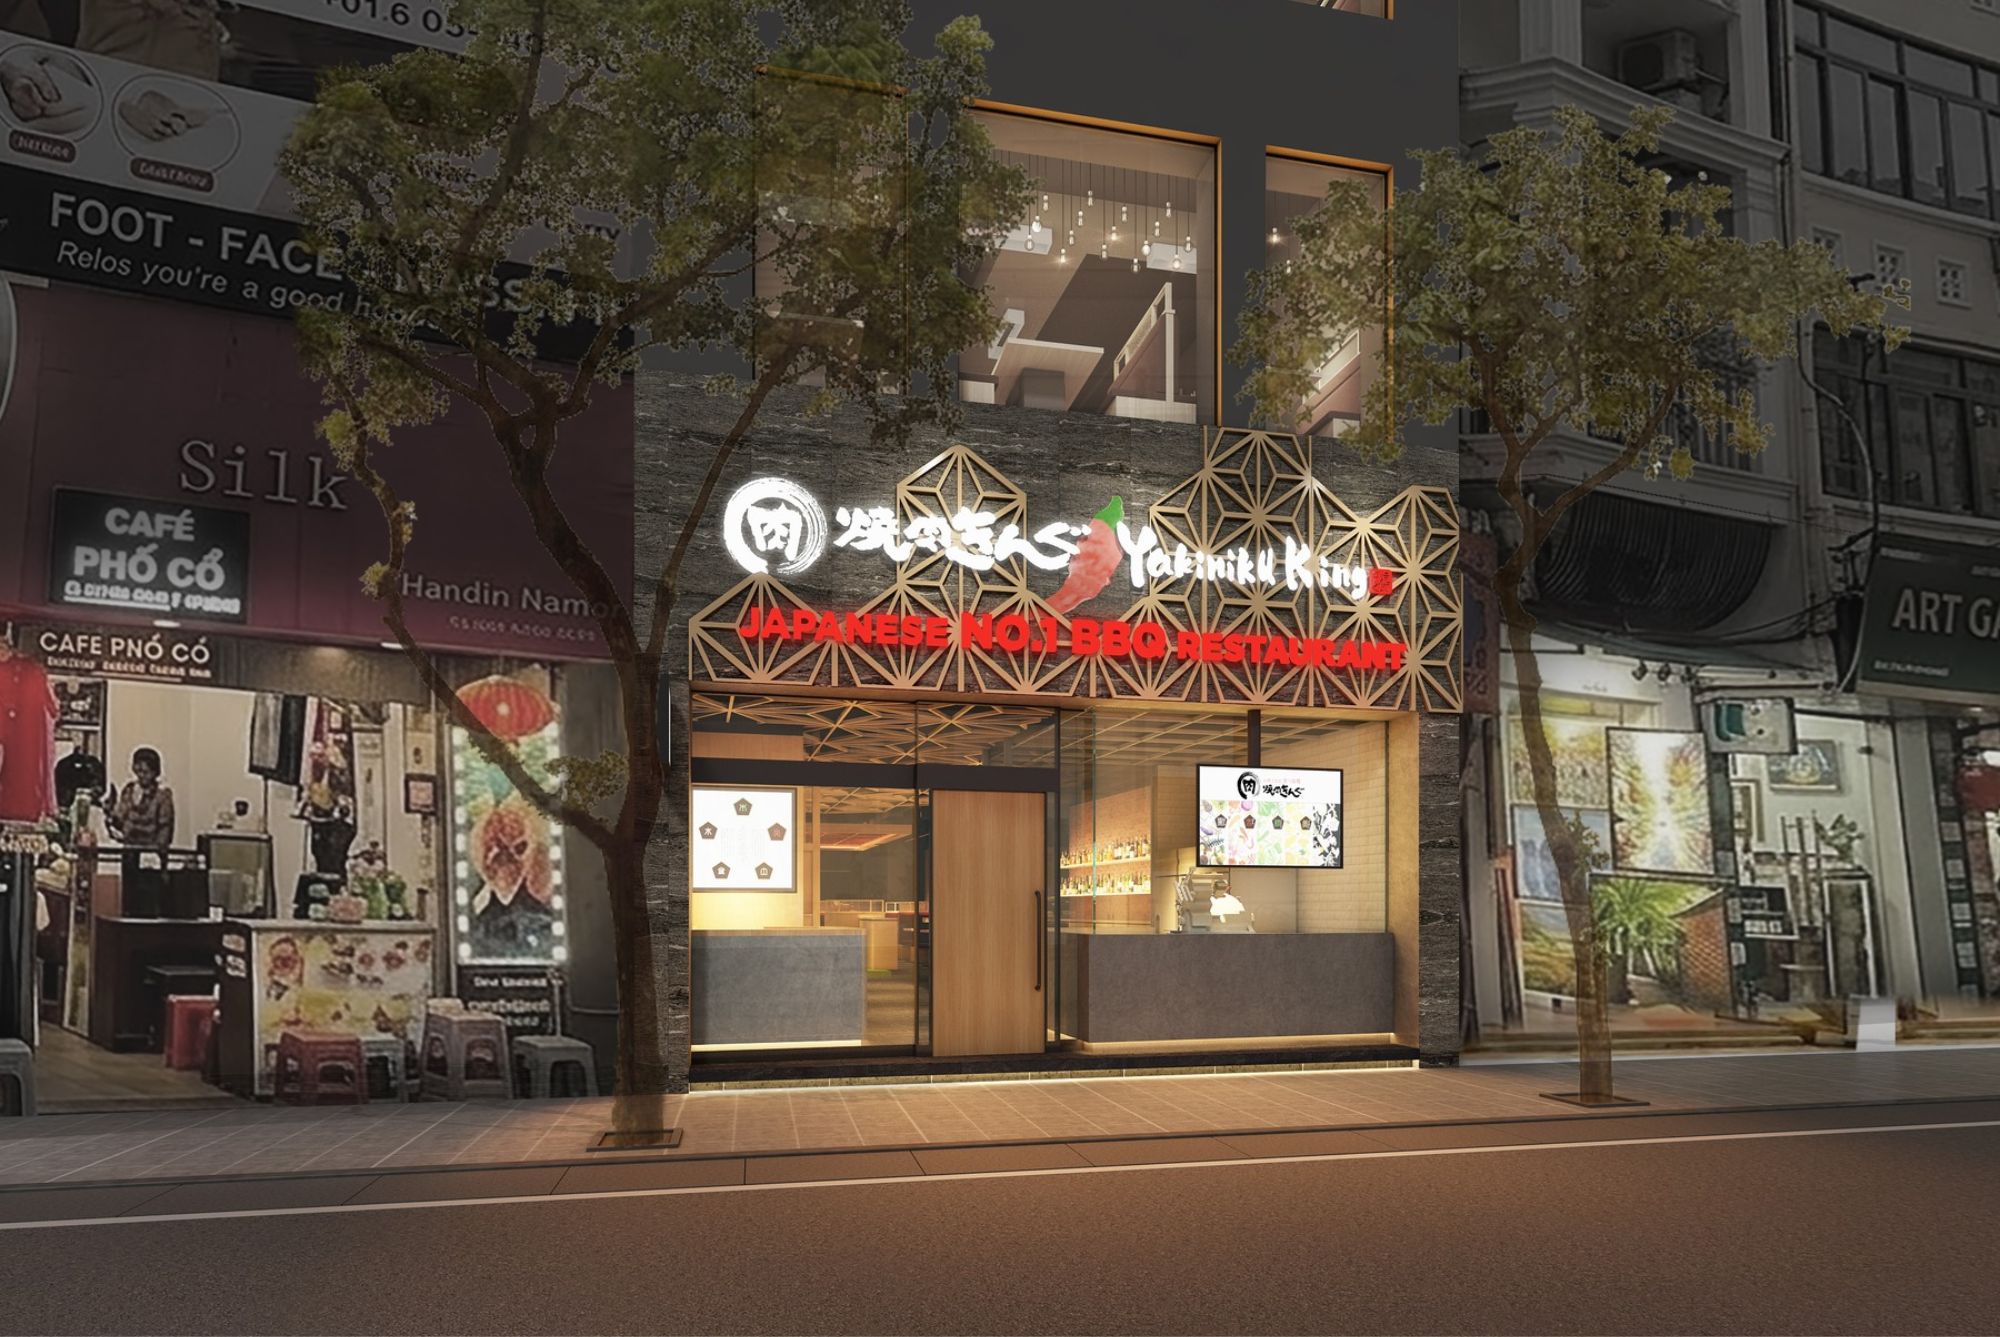
また、フィリピンでは『焼肉きんぐ』の海外1号
意思決定の精度が向上します。さらに、説明責任
店をオープンし、海外市場における新たな成長の
を果たす経験を積むことでリーダーが育ち、新た
足がかりを築くことができました。さらに、米国
なイノベーションを創出しやすい組織風土を育ん
の 鉄板焼 き レ ス ト ラ ン『HIBACHI STEAK
でいきます。これらを着実に実行することで他社
HOUSE』をグループ化いたしました。25年4月
が真似できない差別化要因を生み出すとともに、
にグループ入りした『SHOGUN』に続き、北米
成熟・自立した個が集まる理念型企業への進化を
エリアでの多店舗展開に向けた体制づくりを推進
加速させてまいります。
しております。これらのブランドをヒットフォー
マットに育て上げるため、今後も改善を進めてま
いります。
-3-
Top Interview*02*
2026/08/31 10:27:39 / 26335504̲株式会社物語コーポレーション̲招集通知̲電子提供措置用
株主の皆様へ
サステナビリティ経営戦略で
「お客様に必要とされるブランド・会社」を両立
させてまいります。
さらなる成長を目指します
2026年6月には、ESGの対応に優れた日本企
昨今、外食産業を取り巻く環境は依然として厳
業のパフォーマンスを示すインデックス「FTSE
しい状況が続き、競争は一段と激化しています。
JPX Blossom Japan Index」の構成銘柄に初め
こうした環境下においても、当社は長期経営ビ
て選定されました。環境(E)については、環境
ジョンの実現と中期経営ビジョン「物語ビジョン
法令・条例を遵守した企業活動を行うとともに、
2030」の達成に向け、今後も「業態開発力×人
環境目標の設定および目標に対する進捗を積極的
財力」で力強い成長を続けてまいります。また、
に開示し、透明性のある環境保全活動に努めてま
サステナビリティへの取り組みを重要な経営戦略
いります。社会(S)については、人権と個の尊
と位置づけ、事業活動を通じて「豊かな社会」と
厳が尊重される持続可能な社会を共創します。特
-4-
Top Interview*02*
2026/08/31 10:27:39 / 26335504̲株式会社物語コーポレーション̲招集通知̲電子提供措置用
Top Interview
にダイバーシティ&インクルージョンは、当社に
当社グループにおける成長の源泉は「人」であ
おけるサステナビリティ経営の中心にあると考え、
り、その人財力の根底にある「個」の力を最大限
多様な価値観と個性を尊重する企業文化の形成に
に引き出すのは理念経営と企業文化にほかなりま
注力してまいります。ガバナンス(G)について
せん。今後も「個」を尊重し、その力を最大限に
は、サステナビリティ経営を支える経営体制の確
引き出す経営を通じて、当社グループの競争優位
立をテーマに、機動的な統治体制の構築や取締役
性を一層高めてまいります。株主の皆様には、引
会の実効性向上など、経営基盤の充実に向けて取
き続き変わらぬご支援とご指導を賜りますよう、
り組んでまいります。役員・社員を問わず、全て
心よりお願い申し上げます。
の従業員が正々堂々・率直に意見を表明できる企
業文化を創造し、企業の健全性を高めてまいりま
す。
-5-
Top Interview*02*
2026/08/31 10:27:39 / 26335504̲株式会社物語コーポレーション̲招集通知̲電子提供措置用
株主各位
証券コード 3097
(発送日)2026年9月4日
(電子提供措置の開始日)2026年9月3日
愛知県豊橋市西岩田五丁目7番地の11
代表取締役社長
第57期
加藤
央之
定時株主総会招集ご通知
拝啓平素は格別のご高配を賜り、厚く御礼申し上げます。
さて、当社第57期定時株主総会を下記のとおり開催いたしますので、ご通知申し上げます。
なお、当日ご出席願えない場合は、書面またはインターネット等により議決権を行使することができますの
で、お手数ながら株主総会参考書類をご検討のうえ、8頁の「議決権行使のご案内」に従って、2026年9月24
日(木曜日)午後6時までに議決権を行使いただきますようお願い申し上げます。
敬具
記
日
時
2026年9月25日(金曜日)午前10時
※なお、受付開始は、午前9時15分を予定しております。
場
所
愛知県豊橋市花田町西宿
ホテルアソシア豊橋 5階「ザ ボールルーム」
※末尾の株主総会会場ご案内図をご参照ください。
目的事項
報告事項
決議事項
招
集
ご
通
知
1. 第57期(2025年7月1日から2026年6月30日まで)事業報告、連結計
算書類並びに会計監査人及び監査役会の連結計算書類監査結果報告の件
2. 第57期(2025年7月1日から2026年6月30日まで)計算書類報告の件
第1号議案剰余金の処分の件
第2号議案定款一部変更の件
第3号議案取締役7名選任の件
第4号議案監査役1名選任の件
第5号議案取締役(社外取締役を除く。)に対する業績条件付譲渡制限付
株式付与のための報酬決定の件
以
上
株
主
総
会
参
考
書
類
事
業
報
告
計
算
書
類
◎当日ご出席の際は、お手数ながら議決権行使書用紙を会場受付にご提出くださいますようお願い申し上げます。
◎当日ご出席される株主様へのお土産の配布を取り止めさせていただいております。何卒ご理解くださいますようお願い申し上げます。
◎本株主総会はインターネットによるライブ配信を行いますので、インターネットでの視聴もご検討くださいますようお願い申し上げま
す。ただし、インターネットによるライブ配信のご視聴からは議決権行使および質問などはできません。また、インターネットによるラ
イブ配信のご視聴方法は、別紙をご参照ください。
監
査
報
告
-6-
株主各位
2026/08/31 10:27:39 / 26335504̲株式会社物語コーポレーション̲招集通知̲電子提供措置用
電子提供措置に関するお知らせ
当社第57期定時株主総会の招集に際しては、株主総会参考書類などの内容である情報(電子提供
措置事項)について電子提供措置をとっており、インターネット上の当社ウェブサイトに掲載してい
ますので、当社ウェブサイトにアクセスのうえ、ご確認ください。
【当社ウェブサイト】
https://www.monogatari.co.jp/ir/library/lib05/
また、株主総会参考書類などの内容である情報(電子提供措置事項)は、東京証券取引所ウェブサ
イト(東証上場会社情報サービス)にも掲載しています。当社ウェブサイトにおいて電子提供措置事
項を閲覧できない場合には、東京証券取引所ウェブサイトにアクセスいただき、銘柄名「物語コーポ
レーション」または証券コード「3097」を入力・検索し、「基本情報」、「縦覧書類/PR情報」を
選択のうえ、「縦覧書類」にある「株主総会招集通知/株主総会資料」の情報をご確認ください。
【東京証券取引所ウェブサイト】
https://www2.jpx.co.jp/tseHpFront/JJK010010Action.do?Show=Show
電子提供措置事項に修正が生じた場合は、上掲の当社ウェブサイトおよび東京証券取引所ウェブサ
イトにその旨、修正前の事項および修正後の事項を掲載させていただきます。
当社は、法令および当社定款第14条の規定に基づき、次に掲げる事項を書面交付請求をいただい
た株主様に対して交付する書面(電子提供措置事項記載書面)への記載を省略しております。なお、
監査役および会計監査人が下記の事項を含む監査対象書類を監査しております。また、監査した事業
報告の内容および連結計算書類、計算書類は、当社ウェブサイトおよび東京証券取引所ウェブサイト
に掲載しております。
①企業集団の現況に関する事項の「主要な事業内容」、「主要な営業所及び工場並びに店舗」
②新株予約権等に関する事項
③会計監査人に関する事項
④業務の適正を確保するための体制及び当該体制の運用状況
⑤連結株主資本等変動計算書
⑥連結計算書類の「連結注記表」
⑦株主資本等変動計算書
⑧計算書類の「個別注記表」
-7-
電子提供制度
2026/08/31 10:27:39 / 26335504̲株式会社物語コーポレーション̲招集通知̲電子提供措置用
招
集
ご
通
知
議決権行使のご案内
株主総会へのご出席による議決権行使
株主総会開催日時
議決権行使書用紙を会場受付にご提出ください。
2026年9月25日(金曜日)
午前10時(受付開始:午前9時15分)
※末尾の「株主総会会場ご案内図」をご参照ください。
郵送による議決権行使
本招集ご通知とあわせてお送りする議決権行使
書用紙に賛否をご記入いただき、ご返送くださ
い。
行使期限
2026年9月24日(木曜日)
午後6時到着分まで
議決権行使書用紙のご記入方法のご案内
議決権行使書
○○○○○○○
御中
株主総会日
議決権 の 数
XX 個
基準日現在のご所有株式数
XX 株
議
XX 個
決
権
の
数
株
主
総
会
参
考
書
類
事
業
報
告
××××年××月××日
ログイン用QRコード
見本
ログインID
XXXX-XXXX-XXXX-XXX
仮パスワード
XXXXX
○○○○○○○
※議決権行使書用紙はイメージです。
計
算
書
類
こちらに議案の賛否をご記入ください。
第1・2・4・5号議案
◦ 賛成の場合
◦ 反対する場合
「賛」の欄に〇印
「否」の欄に〇印
第3号議案
◦ 全員賛成の場合
◦ 全員反対する場合
◦
一部の候補者に
反対する場合
-8-
議決権行使のご案内
「賛」の欄に〇印
「否」の欄に〇印
「賛」の欄に〇印をし、反対する候補者の
番号をご記入ください。
監
査
報
告
2026/08/31 10:27:39 / 26335504̲株式会社物語コーポレーション̲招集通知̲電子提供措置用
インターネット等による議決権行使
行使期限
議決権行使サイトにアクセスし、画面の案内に
従って賛否をご入力ください。
2026年9月24日(木曜日)
QRコードを読み取る方法
「ログインID」
「仮パスワード」を入力する方法
(スマートフォン・タブレット等から)
❶�議決権行使書用紙に記載のQRコードを読み取っ
議決権行使書
○○○○○○○
御中
株主総会日
議決権 の 数
てください。
XX 個
議決権行使書
○○○○○○○
株主総会日
××××年××月××日
基準日現在のご所有株式数
議
決
権
の
御中
議決権 の1.
数
XX 個
XX 個
基準日現在のご所有株式数
XX 株
議
XX 個
決
権
❶議決権行使サイトへアクセス
https://evote.tr.mufg.jp/
XX 株
数
午後6時入力完了分まで
の
数
××××年××月××日
ログイン用QRコード
見本
ログイン用QRコード
見本
ログインID
ログインID
XXXX-XXXX-XXXX-XXX
仮パスワード
XXXXX
○○○○○○○
XXXX-XXXX-XXXX-XXX
仮パスワード
XXXXX
○○○○○○○
❷�ログイン
議決権行使サイトにおいて、議決権行使書用紙に記載された「ログ
インID」及び「仮パスワード」をご入力いただき、画面の案内に
※�「QRコード」は株式会社デンソーウェーブの登録商標です。
❷�以降は画面の案内に従って賛否をご入力ください。
インターネット等による議決権行使で
パソコンやスマートフォン操作方法などが
ご不明な場合は、右記にお問い合わせください。
従って議案の賛否をご入力ください。
❸�以降は画面の案内に従って賛否をご入力ください。
三菱UFJ信託銀行株式会社
証券代行部 ヘルプデスク
0120-173-027
(通話料無料/受付時間 9:00~21:00)
・機関投資家の皆様は、株式会社ICJの運営する機関投資家向け議決権電子行使プラットフォームをご利用いただくことが可能です。
書面(郵送)およびインターネット等の両方で議決権行使をされた場合は、インターネット等による議決権行使を有効な議決権行使としてお
取り扱いいたします。また、インターネット等により複数回、議決権行使をされた場合は、最後に行われたものを有効な議決権行使としてお
取り扱いいたします。
・議決権行使書面において、議案に賛否の表示がない場合は、賛成の意思表示をされるものとして取り扱わせていただきます。
-9-
議決権行使のご案内
2026/08/31 10:27:39 / 26335504̲株式会社物語コーポレーション̲招集通知̲電子提供措置用
招
集
ご
通
知
株主総会参考書類議案および参考事項
第1号議案
剰余金の処分の件
当社は、安定的な配当を継続することを基本とし、将来に向けた成長投資に利益を配分するととも
に、株主の皆様への利益還元重視の姿勢をより明確にするため、連結配当性向20.0%以上を目安に、
持続的な利益成長を通じた1株当たり配当金の安定的・持続的な増加を原則とする累進配当を目指し
ております。
以上の配当方針に基づき、当期の期末配当につきましては、次のとおり1株につき23円といたし
たいと存じます。
金23円
883,209,269円
株主に対する配当財産の割当に関する
事項及びその総額
当社普通株式1株につき
剰余金の配当が効力を生じる日
2026年9月28日(月曜日)
総額
なお、中間配当として、1株当たり20円をお支払いしておりますので、年間配当金は1株につき
金43円となり、通期において前期より7円の増配となります。
当期の業績に基づく連結配当性向は18.9%となり、目安としております20.0%以上を一時的に下回る
見込みとなっております。この要因と当社の配当決定の考え方につきまして、以下の通りであります。
当期におきましては、繰延税金資産の計上等により、会計上の当期純利益が一時的に押し上げられ
ております。したがって、当期の期末配当におきましては、この一時的な会計上の良化要因を除外し
た実質的な利益水準を基準とすることが、適切な判断であると考えました。この実質ベースにおける
配当性向は20.0%となり、当社の配当方針を満たしております。
当社は引き続き、持続的な成長投資と株主の皆様への利益還元を両立させ、中長期的な企業価値の
向上に努めてまいります。
<ご参考> 1株当たり配当金の推移(単位:円/%) ■■中間 ■■期末
43.0
32.0
2.2
10.0
2.5
12.1
12.1
16.9
3.6
13.2
4.5
12.3
5.8
16.2
8.8
25.2
9.1
24.0
10.0
20.2
13.3
20.1
15.0
15.8
23.0
21.6
20.0
125.3
18.4
計
算
書
類
36.0
26.6
3.5
事
業
報
告
配当性向
18期連続増配
2.7
株
主
総
会
参
考
書
類
26.5
21.0
20.5
20.2
22.0 20.0
18.9
第39期第40期第41期第42期第43期第44期第45期第46期第47期第48期第49期第50期第51期第52期第53期第54期第55期第56期第57期
(注)1.
2.
3.
4.
2010年12月1日付けで普通株式1株につき3株の分割を行っています。
2021年 3 月1日付けで普通株式1株につき2株の分割を行っています。
2023年 3 月1日付けで普通株式1株につき3株の分割を行っています。
上のグラフでは、当該株式分割に伴う影響を加味した遡及計算値を示しています。
剰余金処分議案
監
査
報
告
2026/08/31 10:27:39 / 26335504̲株式会社物語コーポレーション̲招集通知̲電子提供措置用
第2号議案
定款一部変更の件
1.提案の理由
事業領域の拡大および多様化に対応するため、当社定款第2条(目的)を変更するものです。
2.変更の内容
変更の内容は、次のとおりであります。
(下線は変更部分を示します。)
変更案
現行定款
(目的)
第2条当会社は次の事業を営むことを目的と
する。
(1)~(16)
(条文省略)
(目的)
第2条当会社は次の事業を営むことを目的と
する。
(1)~(16)
(現行どおり)
(新設)
(17) 旅行業法に基づく旅行業
(17) 前各号にかかる経営技術指導、コンサルテ
ィング及び受託
(18) 前各号にかかる経営技術指導、コンサルテ
ィング及び受託、並びに前各号に掲げる事業を
営む会社等に対する特許権、実用新案権、意匠
権、商標権、ノウハウ等の取得、維持、管理、
利用許諾及び譲渡の業務並びにこれらに附帯
し、又は関連する業務
(新設)
(19) 前各号に掲げる事業を営む会社等の事業に
関する金銭の貸付業務、資金調達業務、資金運
営業務及びこれらの代行業務
(18) 前各号に掲げる事業を営む国内外の会社そ
の他の法人等の株式または持分を保有すること
による、当該法人等の事業活動支配、管理また
は支援(当該法人等の経営管理及び事業運営に
関する業務の一部の受託を含む)
(20) 前各号に掲げる事業を営む国内外の会社そ
の他の法人等の株式または持分を保有すること
による、当該法人等の事業活動支配、管理また
は支援(当該法人等の経営管理及び事業運営に
関する業務の一部の受託を含む)
(19) 前各号に付帯する一切の業務
(21) 前各号に付帯する一切の業務
定款一部変更議案
2026/08/31 10:27:39 / 26335504̲株式会社物語コーポレーション̲招集通知̲電子提供措置用
第3号議案
招
集
ご
通
知
取締役7名選任の件
本株主総会終結の時をもって現任の取締役全員7名(うち社外取締役3名)が任期満了となりま
す。つきましては取締役7名(うち社外取締役3名)の選任をお願いいたしたいと存じます。
取締役候補者は次のとおりであります。
(ご参考)本議案が原案どおりに承認された場合の取締役会の体制
候補者
番号
1
2
3
4
5
6
7
氏
年
名
か とう ひさゆき
加藤央之
おか だ
齢
現在の当社における地位
(性別)
まさみち
取締役
在任年数
指名・報酬
委員会
40歳
再任
代表取締役社長
6年
○
48歳
再任
代表取締役専務執行役員
8年
○
(男性)
岡田雅道
(男性)
つ でら
52歳
再任
取締役常務執行役員
8年
-
51歳
再任
取締役上級執行役員
6年
-
再任
社外
独立
取締役
5年
○
つよし
津寺
毅
き むら こう じ
(男性)
木村公治
(男性)
やす だ
57歳
か
な
安田加奈
(女性)
くらしま
66歳
倉島
う
かおる
薫
(男性)
さ がわ くに こ
56歳
宇佐川邦子 (女性)
再任
社外
独立
取締役
3年
◎
再任
社外
独立
取締役
1年
〇
株
主
総
会
参
考
書
類
事
業
報
告
計
算
書
類
(注) 1. ◎印は委員長、〇印は委員を示します。
2. 取締役候補者の倉島薫氏は取締役に選任後、指名・報酬委員会の委員長に就任予定であります。
監
査
報
告
取締役7名選任議案
2026/08/31 10:27:39 / 26335504̲株式会社物語コーポレーション̲招集通知̲電子提供措置用
候補者番号
1 加藤央之
かとう
期待する分野
ひさゆき
1986年4月14日生(満40歳)
属性・委員会
企業経営・経営戦略 フランチャイズビジネス
マーケティング・
MD
人事・
人財開発
再
任
指
名
取締役会
19,505株
取締役在任年数
6年 ※本総会終結時
重要な兼職の状況
物語(上海)企業管理有限公司董事
サステナビリティ
出席率(2026年度)
100%(17回/17回)
所有する当社株式数
指名・報酬委員会
100%(5回/5回)
取締役候補者とした理由
当社の代表取締役社長として、グループ全体を牽引する強いリーダーシップを発揮しています。また、企業経営全般に関す
る豊富な知識と経験を有していることから、今後も当社グループのさらなる事業発展に大きく貢献していただけると判断
し、引き続き取締役候補者として選任をお願いするものです。
略歴、地位および担当
2009年 4 月
2019年 7 月
2020年 2 月
2020年 7 月
2020年 9 月
2021年 1 月
当社入社
お好み焼事業部事業部長
業態開発本部本部長兼開発企画デジタルマーケティング部部長
副社長執行役員
代表取締役社長
代表取締役社長経営理念推進・CSR担当
候補者番号
2 岡田雅道
おかだ
2025年 7 月
2026年 7 月
期待する分野
まさみち
1977年11月7日生(満48歳)
2023年 7 月
2023年 9 月
企業経営・経営戦略
フランチャイズビジネス
マーケティング・
MD
属性・委員会
海外事業
サステナビリティ
出席率(2026年度)
取締役会
100%(17回/17回)
代表取締役社長経営理念推進・サステナビリティ担当 マーケティング担当
代表取締役社長取締役会議長
経営理念推進・サステナビリティ担当 マーケティング担当
代表取締役社長取締役会議長
国内事業統括 マーケティング担当
代表取締役社長取締役会議長(現任)
指名・報酬委員会
100%(5回/5回)
再
任
指
名
所有する当社株式数
42,282株
取締役在任年数
8年 ※本総会終結時
重要な兼職の状況
物語(上海)企業管理有限公司董事長
PT. Agrapana Niaga Gemilang 取締役
物語香港有限公司取締役
物語台湾股份有限公司董事長
Storytellers USA, Inc. CEO
Storytellers(Thailand)Co., Ltd. 取締役
取締役候補者とした理由
当社の代表取締役専務執行役員として、海外事業を管掌しています。当社グループの業態開発、マーケティング、海外赴任
における豊富な経験と企業経営に関する知見を有していることから、今後も当社グループの事業発展に大きく貢献していた
だけると判断し、引き続き取締役候補者として選任をお願いするものです。
略歴、地位および担当
2001年11月
2011年 2 月
2013年 1 月
2016年 7 月
2016年 9 月
2018年 9 月
2019年 9 月
2020年 7 月
当社入社
専門店事業部事業部長
執行役員専門店事業部事業部長
執行役員物語(上海)企業管理有限公司総経理
上級執行役員
取締役専門店・新業態事業部事業部長
取締役常務専門店・新業態事業部事業部長
代表取締役専務執行役員
グローバルマーケティング・営業統括新業態開発担当
2021年 7 月
2023年 7 月
2024年 7 月
2025年 7 月
2026年 7 月
取締役7名選任議案
代表取締役専務執行役員
グローバルマーケティング・営業統括 マーケティング担当
代表取締役専務執行役員
海外事業担当営業担当専門店・新業態事業部事業部長
代表取締役専務執行役員海外事業担当営業担当海外事業本部本部長
代表取締役専務執行役員海外事業統括海外営業担当
代表取締役専務執行役員海外事業統括(現任)
2026/08/31 10:27:39 / 26335504̲株式会社物語コーポレーション̲招集通知̲電子提供措置用
候補者番号
3 津寺毅
つでら
つよし
期待する分野
企業経営・経営戦略
属性・委員会
IT・DX
再
任
19,166株
取締役在任年数
1974年8月1日生(満52歳)
財務・
ファイナンス
出席率(2026年度)
所有する当社株式数
内部統制・
ガバナンス
8年 ※本総会終結時
サステナビリティ
重要な兼職の状況
物語(上海)企業管理有限公司董事
PT. Agrapana Niaga Gemilang
コミサリス(監査役)
物語香港有限公司取締役
物語台湾股份有限公司董事
Storytellers(Thailand)Co., Ltd. 取締役
取締役会
100%(17回/17回)
取締役候補者とした理由
当社の取締役常務執行役員として、財務・成長戦略を管掌しております。当社グループの経営企画、財務、広報・IR、管理
本部における豊富な経験と企業経営に関する知見を有していることから、今後も当社グループの事業発展に大きく貢献して
いただけると判断し、引き続き取締役候補者として選任をお願いするものです。
略歴、地位および担当
1998年 5 月
2011年10月
2015年 7 月
2016年 9 月
2018年 9 月
当社入社
成長戦略室室長
執行役員成長戦略室室長
上級執行役員成長戦略室室長
取締役財務・成長戦略担当管理本部長兼成長戦略室室長
候補者番号
4 木村公治
きむら
こうじ
2020年 7 月
2021年 7 月
2025年 7 月
期待する分野
企業経営・
経営戦略
フランチャイズビジネス
取締役常務執行役員財務・成長戦略担当
管理本部本部長兼成長戦略室室長
取締役常務執行役員財務・成長戦略担当
管理本部本部長
取締役常務執行役員財務・成長戦略担当(現任)
属性・委員会
マーケティング・
MD
再
任
サステナビリティ
100%(17回/17回)
所有する当社株式数
46,655株
重要な兼職の状況
重要な兼職はありません。
取締役候補者とした理由
当社の取締役上級執行役員として、FC事業・店舗開発・立地開発、新事業開発を管掌しています。当社グループの営業、
FC事業における豊富な経験と企業経営に関する知見を有していることから、今後も当社グループの事業発展に大きく貢献
していただけると判断し、引き続き取締役候補者として選任をお願いするものです。
1999年 4 月
2011年 7 月
2013年 9 月
2014年 1 月
2015年 2 月
2015年 9 月
当社入社
執行役員開発本部本部長
取締役執行役員開発本部本部長
取締役執行役員物語(上海)企業管理有限公司総経理
取締役執行役員焼肉事業部事業部長
執行役員成長戦略室付
2016年 7 月
2017年 7 月
2018年 7 月
2020年 9 月
2023年 7 月
2025年 7 月
取締役7名選任議案
事
業
報
告
6年 ※本総会終結時
人事・人財開発
取締役会
略歴、地位および担当
株
主
総
会
参
考
書
類
取締役在任年数
1975年3月16日生(満51歳)
出席率(2026年度)
招
集
ご
通
知
執行役員社長室室長
執行役員営業企画部部長
上級執行役員営業担当
取締役上級執行役員 FC事業・営業担当
取締役上級執行役員 FC・店舗・立地開発担当新事業担当
取締役上級執行役員 FC事業推進・店舗・立地開発担当新事業担当(現任)
計
算
書
類
監
査
報
告
2026/08/31 10:27:39 / 26335504̲株式会社物語コーポレーション̲招集通知̲電子提供措置用
候補者番号
5 安田加奈
やすだ
かな
期待する分野
企業経営・
経営戦略
財務・
ファイナンス
属性・委員会
内部統制・
ガバナンス
1969年4月10日生(満57歳)
出席率(2026年度)
取締役会
100%(17回/17回)
サステナビリティ
再
任
指
名
社
外
独
立
指名・報酬委員会
100%(5回/5回)
所有する当社株式数
1,500株
取締役在任年数
5年 ※本総会終結時
重要な兼職の状況
安田会計事務所所長公認会計士・税理士
株式会社ゲオホールディングス 社外取締役
中央発條株式会社社外取締役
コンドーテック株式会社社外取締役(監査等委員)
社外取締役候補者とした理由および期待される役割の概要
会計・税務の専門家として豊富な経験と知見を有しており、それらを活かし、客観的かつ専門的な視点から当社グループの
ガバナンス強化や経営判断に貢献していただけると判断し、引き続き社外取締役候補者として選任をお願いするものです。
なお、同氏は過去に社外役員以外の方法で会社経営に関与した経験はありませんが、上記の理由により社外取締役としての
職務を適切に遂行できると判断しております。
略歴、地位および担当
1993年10月 センチュリー監査法人(現EY新日本有限責任監査法人)入所
1997年 4 月公認会計士登録
2000年 3 月安田会計事務所設立同所所長(現任)
2004年 3 月税理士登録
2009年 9 月 シンポ株式会社社外監査役
2010年 5 月 スギホールディングス株式会社社外監査役
候補者番号
6 倉島薫
くらしま
かおる
2016年 6 月
2019年 6 月
2019年 6 月
2020年 6 月
2021年 9 月
期待する分野
企業経営・
経営戦略
海外事業
属性・委員会
サステナビリティ
1960年5月5日生(満66歳)
出席率(2026年度)
取締役会
100%(17回/17回)
株式会社ゲオホールディングス 社外取締役(現任)
中央発條株式会社社外取締役(現任)
コンドーテック株式会社社外監査役
コンドーテック株式会社社外取締役(監査等委員)(現任)
当社社外取締役(現任)
指名・報酬委員会
100%(5回/5回)
再
任
指
名
社
外
独
立
所有する当社株式数
1,000株
取締役在任年数
3年 ※本総会終結時
重要な兼職の状況
株式会社JSP 社外取締役
株式会社キングジム 社外取締役
社外取締役候補者とした理由および期待される役割の概要
グローバルに展開する食品企業において、取締役専務執行役員などの要職を国内外で歴任され、豊富な企業経営に関する経
験を有しております。これらの経験を活かし、客観的かつ専門的な視点から当社グループの経営判断に大きく貢献していた
だけると判断し、引き続き社外取締役候補者として選任をお願いするものです。
略歴、地位および担当
1984年 4 月味の素株式会社入社
2015年 6 月同社執行役員
2016年 6 月同社常務執行役員
2019年 6 月同社専務執行役員同社食品事業本部長
2020年 6 月株式会社J-オイルミルズ社外取締役
2021年 4 月味の素株式会社 グローバルコーポレート本部長
コーポレートサービス本部長
同社
2021年 6 月
2022年 6 月
2023年 6 月
2023年 9 月
2024年 6 月
2025年 9 月
取締役7名選任議案
同社取締役
公益財団法人味の素ファンデーション 理事長
日本うま味調味料協会会長
当社社外取締役(現任)
株式会社JSP 社外取締役(現任)
株式会社キングジム 社外取締役(現任)
2026/08/31 10:27:39 / 26335504̲株式会社物語コーポレーション̲招集通知̲電子提供措置用
候補者番号
7 宇佐川邦子
うさがわ
くにこ
期待する分野
企業経営・
経営戦略
人事・
人財開発
属性・委員会
サステナビリティ
1970年3月11日生(満56歳)
出席率(2026年度)
取締役会
92%(12回/13回)
指名・報酬委員会
100%(5回/5回)
所有する当社株式数
再
任
ー
指
名
社
外
取締役在任年数
独
立
招
集
ご
通
知
1年 ※本総会終結時
重要な兼職の状況
株式会社インディードリクルートパートナーズ
渉外政策渉外室 リサーチ部 リサーチ企画室
兼 ジョブズリサーチセンター 上席主任研究員
兼株式会社インディード リサーチセンター
株式会社山口銀行社外取締役(監査等委員)
株式会社時空間・行動連鎖研究所客員研究員
全国中小企業団体中央会女性活躍
魅力発信研究会座長
厚生労働省「女性の活躍推進及び
両立支援に関する総合的情報提供事
業」検討委員会委員
株
主
総
会
参
考
書
類
社外取締役候補者とした理由および期待される役割の概要
長年にわたり、様々な業界で採用、人財育成・定着、活躍促進に尽力し、人事領域における深い知見と豊富な経験を有して
おります。これらの経験を活かし、客観的かつ専門的な視点から当社グループの経営判断に貢献していただけると判断し、
引き続き社外取締役候補者として選任をお願いするものです。なお、同氏は過去に社外役員以外の方法で会社経営に関与し
た経験はありませんが、上記の理由により社外取締役としての職務を適切に遂行できると判断しております。
略歴、地位および担当
1992年 4 月
2006年 4 月
2012年10月
2014年 4 月
2017年10月
2020年 6 月
2021年 4 月
株式会社リクルートフロムエー
(現株式会社リクルート) 入社
株式会社リクルート 転籍
株式会社リクルートキャリア 転籍
株式会社リクルートキャリア 経営統括室
兼株式会社リクルートホールディングス(現:株式会社リクルート)
HR研究機構労働政策部長
兼株式会社リクルートジョブズ
経営統括室広報・マーケティング部長
株式会社リクルートジョブズ
ジョブズリサーチセンター センター長
株式会社リクルートジョブズ ジョブズリサーチセンター センター長
兼株式会社リクルート 次世代事業開発室 シニアアセスメントサービス
株式会社山口銀行社外取締役(監査等委員)(現任)
株式会社リクルート Division統括本部 HR本部HR横断リサーチ推進部
ジョブズリサーチセンター センター長
兼次世代事業開発室 シニアアセスメントサービス
兼広報・渉外政策企画室調査室
兼広報・渉外政策企画室 コーポレートコミュニケーション室
2021年 5 月
2022年 6 月
2023年 7 月
2025年 4 月
2025年 6 月
2025年 9 月
株式会社時空間・行動連鎖研究所客員研究員(現任)
トランコム株式会社社外取締役
全国中小企業団体中央会
女性活躍魅力発信研究会座長 (現任)
株式会社インディードリクルートパートナーズ渉外
政策渉外室 リサーチ部 リサーチ企画室
兼 ジョブズリサーチセンター 上席主任研究員
兼株式会社インディード リサーチセンター(現任)
厚生労働省「女性の活躍推進及び両立支援に関す
る総合的情報提供事業」検討委員会委員(現任)
当社社外取締役(現任)
事
業
報
告
計
算
書
類
監
査
報
告
取締役7名選任議案
2026/08/31 10:27:39 / 26335504̲株式会社物語コーポレーション̲招集通知̲電子提供措置用
(注) 1. 各候補者と当社との間には特別の利害関係はありません。
2. 安田加奈氏、倉島薫氏、宇佐川邦子氏は、社外取締役候補者であります。
3. 安田加奈氏、倉島薫氏、宇佐川邦子氏は、現在、当社の社外取締役でありますが、各氏の社外取締役在任期間は、本株主総会
終結の時をもって安田加奈氏が5年、倉島薫氏が3年、宇佐川邦子氏が1年となります。
4. 当社と安田加奈氏、倉島薫氏、宇佐川邦子氏との間では、当社定款の規定により、会社法第423条第1項に定める責任につい
て、善意でかつ重大な過失がないときは、法令に定める額を負担の限度額とする契約を締結しております。なお、本議案が可
決され、安田加奈氏、倉島薫氏、宇佐川邦子氏が選任された場合は同契約を継続する予定です。
5. 当社は、安田加奈氏、倉島薫氏、宇佐川邦子氏を東京証券取引所の定めに基づく独立役員として指定し、同取引所に届け出て
おります。
安田加奈氏、倉島薫氏、宇佐川邦子氏が選任された場合、当社は引き続き独立役員とする予定です。なお、宇佐川邦子氏が勤
務する株式会社インディードリクルートパートナーズの親会社である株式会社リクルートホールディングスの子会社と当社は
採用支援サービスに関しての取引関係がありますが、当社の直近事業年度における取引額は少額であり、独立性に影響を与え
るものではありません。
6. 当社は、会社法第430条の3第1項に規定する役員等賠償責任保険契約を保険会社との間で締結しております。被保険者であ
る役員などがその地位に基づいて行った行為に起因して、保険期間中に被保険者に対して責任の追及に係る請求を受けること
によって生ずる損害に対して補填いたします。各候補者が選任され取締役に就任した場合は、当該保険契約の被保険者となり
ます。当社が現在保険会社と契約している役員等賠償責任保険契約の内容の概要につきましては42頁をご参照ください。な
お、当該保険契約は次回更新時においても同内容での更新を予定しております。
7. 宇佐川邦子氏は、2025年9月26日開催の第56期定時株主総会において新たに選任されております。
取締役7名選任議案
2026/08/31 10:27:39 / 26335504̲株式会社物語コーポレーション̲招集通知̲電子提供措置用
第4号議案
招
集
ご
通
知
監査役1名選任の件
本株主総会終結の時をもって現任の監査役4名(うち社外監査役4名)のうち、今村泰也氏が任期
満了となります。つきましては新任の榎本孝一氏の選任をお願いいたしたいと存じます。
なお、本議案の提案につきましては、予め監査役会の同意を得ております。
監査役候補者は次のとおりであります。
(ご参考)本議案が原案どおりに承認された場合の監査役会の体制
氏
新
任
在任中
在任中
在任中
年
名
齢
えのもと こういち
64歳
榎本孝一
(男性)
なかがわ あや こ
47歳
中川彩子
(女性)
やす だ
53歳
安田
しら い
現在の当社における地位
(性別)
めぐみ
恵
(女性)
としのり
67歳
白井俊徳
(男性)
新任
社外
独立
ー
監査役
在任年数
指名・報酬
委員会
ー
○
在任中
社外
独立
監査役
7年
ー
在任中
社外
独立
監査役
3年
ー
在任中
社外
独立
監査役
2年
ー
(注) ◎印は委員長、〇印は委員を示します。
株
主
総
会
参
考
書
類
事
業
報
告
計
算
書
類
監
査
報
告
監査役1名選任議案
2026/08/31 10:27:39 / 26335504̲株式会社物語コーポレーション̲招集通知̲電子提供措置用
えのもと
期待する分野
こういち
榎本孝一
企業経営・
経営戦略
人事・
人財開発
属性・委員会
内部統制・
ガバナンス
1961年12月18日生(満64歳)
出席率(2026年度)
取締役会
ー%(ー回/ー回)
新
任
社
外
独
立
所有する当社株式数
ー
監査役在任年数
ー ※本総会終結時
重要な兼職の状況
重要な兼職はありません。
監査役会
ー%(ー回/ー回)
社外監査役候補者とした理由
流通・生活産業分野で豊富な経営知見を培い、経営企画本部長や常務執行役員コーポレート担当役員等を歴任するなど、外
食・食品流通業の経営全般および管理業務に関する優れた知見と豊富な経験を有しております。これら豊富な実績や経験を
当社の監査体制やガバナンス強化に活かしていただきたく、社外監査役候補者としての選任をお願いするものであります。
略歴、地位および担当
1984年 4 月
2012年 4 月
2013年 4 月
2014年 4 月
2016年 4 月
2016年 6 月
三菱商事株式会社入社
三菱食品株式会社経営企画部長
同社経営企画本部長
同社執行役員経営企画本部長
同社常務執行役員 コーポレート担当役員(総務人事)
兼 コンプライアンス担当役員
兼経営企画本部長
同社取締役
兼常務執行役員 コーポレート担当役員(総務人事)
兼 コンプライアンス担当役員
兼経営企画本部長
2023年 4 月
2024年 4 月
同社取締役
兼常務執行役員 コーポレート担当役員(総務人
事・コンプライアンス)
同社取締役
兼常務執行役員 コーポレート担当役員(総務人
事・コンプライアンス)
兼 CHRO
兼 CHO (健康増進担当)
(注) 1. 榎本孝一氏と当社には特別の利害関係はありません。
2. 榎本孝一氏は社外監査役候補者であります。なお、当社は榎本孝一氏を東京証券取引所の定めに基づく独立役員として指定
し、同氏が選任された場合、同氏を同取引所へ届け出を行う予定です。
3. 本議案が可決され、榎本孝一氏が選任された場合、当社と同氏は、当社定款の規定により、会社法第423条第1項に定める責
任について、善意でかつ重大な過失がないときは、法令に定める額を負担の限度額とする契約を新たに締結する予定です。
4. 榎本孝一氏の任期は、選任後4年以内に終了する事業年度のうち最終のものに関する定時株主総会終結の時までとなります。
5. 当社は、会社法第430条の3第1項に規定する役員等賠償責任保険契約を保険会社との間で締結しております。被保険者であ
る役員などがその地位に基づいて行った行為に起因して、保険期間中に被保険者に対して責任の追及に係る請求を受けること
によって生ずる損害に対して補填いたします。榎本孝一氏が選任され監査役に就任した場合は、当該保険契約の被保険者とな
ります。当社が現在保険会社と契約している役員等賠償責任保険契約の内容の概要につきましては42頁をご参照ください。
監査役1名選任議案
2026/08/31 10:27:39 / 26335504̲株式会社物語コーポレーション̲招集通知̲電子提供措置用
取締役(社外取締役を除く。)に対する業
第5号議案績条件付譲渡制限付株式付与のための報酬
決定の件
当社の取締役の報酬限度額は、(ⅰ) 金銭報酬については、2013年9月25日開催の第44期定時株主
総会において年額300百万円(このうち社外取締役の報酬については2021年9月28日開催の第52期
定時株主総会において年額50百万円)以内、(ⅱ) 当社の取締役(社外取締役を除く。)に対する譲
渡制限付株式報酬(非金銭報酬)については、2020年9月24日開催の第51期定時株主総会におい
て、上記(ⅰ)の金銭報酬とは別枠で年額90百万円以内、同制度により発行又は処分される当社の普通
株式の総数は年15,000株以内、(ⅲ) 当社の取締役(社外取締役を除く。)に対するESGに関する
数値目標の達成度に連動した譲渡制限付株式報酬(非金銭報酬)については、2025年9月26日開催
の第56期定時株主総会において、上記(ⅰ)及び(ⅱ)の報酬枠とは別枠で年額15百万円以内、同制度に
より発行又は処分される当社の普通株式の総数は年5,000株以内とすることをご承認いただいており
ます。
今般、当社は、取締役の報酬制度の見直しの一環として、当社の定める業績目標を達成するインセ
ンティブを付与するとともに、株主の皆様との一層の価値共有を進めること、また、優秀な人財のリ
テンションを目的として、新たに、業績条件付の譲渡制限付株式報酬制度(以下「本制度」といいま
す。)を導入したく存じます。
本議案に基づき、当社の取締役(社外取締役を除く。以下「対象取締役」といいます。)に対して
譲渡制限付株式付与のために支給される報酬総額は、上記(ⅰ)乃至(ⅲ)の報酬枠とは別枠で、年額
1,000百万円以内とし、本制度により発行又は処分される当社の普通株式の総数は年160,000株以内
(ただし、本議案が承認可決された日以降、当社の普通株式の株式分割(当社の普通株式の無償割当
てを含みます。)又は株式併合が行われた場合その他譲渡制限付株式として発行又は処分される当社
の普通株式の総数の調整が必要な事由が生じた場合には、当該総数を合理的な範囲で調整します。)
といたします。なお、各対象取締役への具体的な支給時期及び配分については、指名・報酬委員会の
答申を経た上で、取締役会において協議し決定いたします。本制度により発行又は処分される当社の
普通株式の1株当たりの払込金額は、取締役会決議日の前営業日の東京証券取引所における当社の普
通株式の終値(同日に取引が成立していない場合は、それに先立つ直近取引日の終値)を基礎とし
て、対象取締役に特に有利とならない範囲において取締役会にて決定いたします。
当社における取締役の個人別の報酬等の内容についての決定に関する方針の概要は、事業報告
「4. 会社役員に関する事項(6)取締役の個人別の報酬等の決定に関する基本方針」に記載のとお
りでありますが、2026年8月21日開催の取締役会において、本議案を原案どおりご承認いただくこ
とを条件に、その内容を変更することを決議しており、変更後の当社における取締役の個人別の報酬
等の内容についての決定に関する方針の概要は、株主総会参考書類(本書22頁)に記載のとおりで
あります。本制度の導入目的は上記のとおりであり、本議案の内容は、当該変更後の同方針に沿って
取締役の個人別の報酬等の内容を定めるために必要かつ相当な内容となっていることから、相当な内
容であると判断しております。
なお、当社の現在の取締役は7名(うち社外取締役は3名)ですが、第3号議案が原案どおり承認
可決されますと、取締役は7名(うち対象取締役は4名)となります。
取締役(社外取締役を除く。)に対する業績条件付譲渡制限付株式付与のための報酬決定の件
招
集
ご
通
知
株
主
総
会
参
考
書
類
事
業
報
告
計
算
書
類
監
査
報
告
2026/08/31 10:27:39 / 26335504̲株式会社物語コーポレーション̲招集通知̲電子提供措置用
<業績条件付譲渡制限付株式報酬の概要>
対象取締役は、本制度に基づき当社より支給された金銭報酬債権の全部を現物出資財産として払い
込み、当社の普通株式の発行又は処分を受けるものとします。
また、本制度による当社の普通株式の発行又は処分に当たっては、当社と対象取締役との間で、概
要、以下の内容を含む譲渡制限付株式割当契約(以下「本割当契約」といいます。)を締結するもの
といたします。
(1) 対象取締役は、当社取締役会があらかじめ定めた期間(以下「譲渡制限期間」という。)、本割
当契約により割当てを受けた当社の普通株式(以下「本割当株式」という。)について、譲渡、
担保権の設定その他の処分をしてはならないこと(以下「譲渡制限」という。)。
(2) 対象取締役が、譲渡制限期間満了前に当社の取締役その他当社の取締役会があらかじめ定める地
位を退任した場合には、その退任について任期満了その他の正当な理由がある場合を除き、当社
が本割当株式を当然に無償で取得すること。
(3) 当社は、対象取締役が譲渡制限期間中、継続して、当社の取締役その他当社の取締役会があらか
じめ定める地位にあったこと、及び当社があらかじめ定める業績に関する数値目標を達成するこ
とを条件として、本割当株式の全部について、譲渡制限期間が満了した時点をもって譲渡制限を
解除すること。ただし、当該取締役が、上記(2)に定める任期満了その他正当な理由により、
譲渡制限期間が満了する前に上記(2)に定める地位を退任した場合には、譲渡制限を解除する
本割当株式の数及び譲渡制限を解除する時期を、必要に応じて合理的に調整する旨の規定を設け
ることができること。また、当社は、上記の定めに従い譲渡制限を解除された直後の時点におい
て、なお譲渡制限が解除されていない本割当株式を当然に無償で取得すること。
(4) 上記(1)の定めにかかわらず、当社は、譲渡制限期間中に当社が消滅会社となる合併契約、当
社が完全子会社となる株式交換契約又は株式移転計画その他の組織再編等に関する事項が当社の
株主総会(ただし、当該組織再編等に関して当社の株主総会による承認を要さない場合において
は、当社の取締役会)で承認された場合には、当社の取締役会決議により、譲渡制限期間の開始
の日から当該組織再編等の承認の日までの期間を踏まえて合理的に定める数の本割当株式につい
て、当該組織再編等の効力発生日に先立ち、譲渡制限を解除すること。また、当社は、上記に定
める場合、譲渡制限が解除された直後の時点において、なお譲渡制限が解除されていない本割当
株式を当然に無償で取得すること。
(5) 本割当契約に関するその他の事項は、当社の取締役会において定めること。
※当社は、本株主総会において本制度の導入が承認されることを条件として、2026年10月に本
制度に基づく譲渡制限付株式の付与を予定していますが、同付与においては、付与日から2030
年9月30日を譲渡制限期間とし、2028年6月期から2030年6月期までの事業年度における連結
売上高についての業績目標を達成した場合に譲渡制限が解除される仕組みを構築することを予定
しております。
本株主総会において本制度の導入が承認されることを条件として、当社の執行役員に対しても、本
制度におけるものと同様の譲渡制限付株式を付与する予定であります。
取締役(社外取締役を除く。)に対する業績条件付譲渡制限付株式付与のための報酬決定の件
2026/08/31 10:27:39 / 26335504̲株式会社物語コーポレーション̲招集通知̲電子提供措置用
ご参考
当社の新たな個人別の報酬等の決定に関する基本方針の概要
①取締役の個人別の報酬等の決定に関する基本方針
当社は2026年8月21日開催の取締役会において、本株主総会で第5号議案を原案どおりご承認い
ただくことを条件に、取締役の個人別の報酬等の内容にかかる決定方針を決議しております。取締役
の個人別の報酬等の決定に関する基本方針として、持続的な成長と中長期的な企業価値の向上を経営
上の最重要課題と位置づけており、取締役の報酬制度についても、当社の成長や企業価値の向上に資
するべきものであると考えており、以下を基本方針としております。
・経営理念を実践する優秀な人財を登用できる報酬とする
・持続的な企業価値向上を動機づける報酬体系とする
・報酬等の決定プロセスは透明性・客観性の高いものとする
上記の基本方針を踏まえ、取締役の個人別の報酬等は株主総会で決議された額の範囲内で決定いた
します。また、個人別の報酬等の内容につきましては、後述③の指名・報酬委員会で審議のうえ、取
締役会で協議し決定しております。取締役会は、当事業年度に係る取締役の個人別の報酬等につい
て、報酬等の決定方法及び決定された報酬等の内容が取締役会で決議された決定方針と整合している
ことを確認しており、当該決定方針に沿うものであると判断し取締役会で決議しております。
②取締役報酬制度の概要
当社の取締役(社外取締役を除く)の報酬は、「基本報酬」、「業績報酬」及び「株式報酬」で構
成されております。当社の取締役(社外取締役を除く)の個人別の報酬等における報酬等の種類別の
割合については、役位・職責、業績、各取締役の評価及び目標達成度等を総合的に勘案して決定して
おり、報酬構成比率は、概ね、基本報酬約57%、業績報酬約29%、株式報酬約14%を目安といたし
ます。また、当社の取締役のうち社外取締役の報酬等については、「基本報酬」のみで構成されてい
ます。
・基本報酬
「役位報酬」「加算報酬」及び「職責報酬」からなり、「役位報酬」は役位毎にその役割に応じた報
酬額とし、「加算報酬」は人財難易度などを考慮して個別に支給額を決定し、「職責報酬」は職責に
応じて支給額を決定しております。基本報酬は、各取締役の在任中に毎月金銭で支給しております。
・業績報酬
短期的なインセンティブとして業績報酬を支給しております。企業価値向上の観点から、前連結会計
年度の連結経常利益・純利益を評価基準としたうえで、総合的に評価して、報酬額を決定しておりま
す。業績報酬は、対象となる取締役に対し、上記のとおり算定された支給額を12等分した額を毎月
金銭で支給しております。
ご参考
当社の新たな個人別の報酬等の決定に関する基本方針の概要
招
集
ご
通
知
株
主
総
会
参
考
書
類
事
業
報
告
計
算
書
類
監
査
報
告
2026/08/31 10:27:39 / 26335504̲株式会社物語コーポレーション̲招集通知̲電子提供措置用
・株式報酬(譲渡制限付株式報酬)
中長期的なインセンティブとして各役位の職責や企業価値向上への貢献度を評価して、報酬額を決定
しております。役員退任時まで株式の譲渡制限を付す譲渡制限付株式(勤務条件型)のほか、ESG目
標の達成を譲渡制限の解除条件とする譲渡制限付株式(ESG条件加重型)及び中期の業績目標の達成
を譲渡制限の解除条件とする譲渡制限付株式(業績条件付譲渡制限付株式)をそれぞれ導入いたしま
す。譲渡制限付株式(勤務条件型)及び譲渡制限付株式(ESG条件加重型)は、対象となる取締役に
対し、毎年一定の時期に付与しており、譲渡制限付株式(業績条件付譲渡制限付株式)は、当社の中
長期の経営計画の策定時期を踏まえて一定の時期に付与いたします。
③指名・報酬委員会
取締役、執行役員に関する選解任、評価、報酬の客観性・透明性・公正性を確保し、コーポレート
ガバナンス体制の一層の強化を図るため、社外取締役・社外監査役を含む非業務執行取締役を主な構
成員とした任意の「指名・報酬委員会」を設置しております。構成員6名のうち4名が非業務執行取
締役・監査役で構成されており、そのうちの1名が「指名・報酬委員会」の委員長を務めておりま
す。当事業年度において「指名・報酬委員会」を5回開催し、報酬水準などを同業他社と比較検討
し、指名・報酬制度の課題などについて議論したうえで取締役会へ答申しております。
ご参考
当社の新たな個人別の報酬等の決定に関する基本方針の概要
2026/08/31 10:27:39 / 26335504̲株式会社物語コーポレーション̲招集通知̲電子提供措置用
ご参考
招
集
ご
通
知
当社のスキルマトリックス
第3号議案および第4号議案が承認された場合の役員体制
当社の取締役および監査役に特に期待する分野・有している専門的な分野であり、
各候補者の有するすべてのスキル・専門的知見を表すものではありません。
NO.
地位
氏名
性別属性
在任
年数
1
代表取締役加藤
央之
男性
指名
6年
●
●
2
代表取締役岡田
雅道
男性
指名
8年
●
●
●
●
●
取締役
津寺
毅
男性
8年
●
4
取締役
木村
公治
男性
6年
●
5
取締役
安田
加奈
女性
5年
●
6
取締役
倉島
薫
男性
3年
●
7
取締役
宇佐川
邦子女性
1年
●
●
8
監査役
榎本
孝一
男性
●
●
9
監査役
中川
彩子
女性
社外
独立
7年
10
監査役
安田
恵
女性
社外
独立
3年
11
監査役
白井
俊徳
男性
社外
独立
2年
指名
社外
独立
指名
社外
独立
指名
社外
独立
指名
社外
独立
●
●
3
●
●
●
●
●
●
●
●
●
●
●
事
業
報
告
●
●
●
●
株
主
総
会
参
考
書
類
●
●
●
計
算
書
類
●
企業経営・経営戦略
フランチャイズビジネス
海外事業
マーケティング・MD
IT・DX
財務・ファイナンス
内部統制・ガバナンス
サステナビリティ
当社のスキルマトリックス
●
●
ご参考
●
人事・人財開発
監
査
報
告
2026/08/31 10:27:39 / 26335504̲株式会社物語コーポレーション̲招集通知̲電子提供措置用
ご参考
当社のコーポレート・ガバナンス
2026年6月30日現在
株
顧問弁護士
主
総
会
指名・報酬委員会6名
(うち社外4名、うち女性2名)
選任・解任
選任・解任
相談・助言
諮問・答申
監査
監査役会4名
(うち社外4名、うち女性2名)
意思決定・監督機能
取締役会7名(うち社外3名、うち女性2名)
連携
監査
業務執行
選定・解職
経営会議
指示・報告
付議・報告
指示・報告
指示・報告
指示・報告
内部統制推進委員会
サステナビリティ委員会
内部統制の体制整備
会計監査人
報告
代表取締役社長
指示・報告
連携
連携
内部監査部
監査
ESGの体制整備
各部門及 び 子会社
顧問弁護士/指名・報酬委員会
代表取締役社長
ご参考
当社のスキルマトリックス
取締役
社外取締役
監査役
社外監査役
2026/08/31 10:27:39 / 26335504̲株式会社物語コーポレーション̲招集通知̲電子提供措置用
招
集
ご
通
知
① 取締役会
[ 役割 ]
取締役会は、経営戦略および重要事項の決定とすべての事業活動の監督に責任を持つ機関です。
[ 構成 ]
役割・責務を果たす観点から、取締役会の構成に関する考え方について、次のとおり定めておりま
す。
当社は、取締役会全体として知識・経験・能力のバランスや多様性などに関する考え方を考慮し、
任意の指名・報酬委員会の審議結果を踏まえ、取締役候補者の指名を行っております。社内取締役に
ついては、営業・会計・リスク管理など、能力のバランスを考慮しております。社外取締役について
は、経験・能力のバランスに加え、他社での経営経験および多様性も考慮しております。必要に応じ
て、取締役会全体としての知識・経験・能力のバランス、多様性および規模をより意識した体制を構
築しております。
現在、7名の取締役(うち独立社外取締役3名)により構成しております。本定時株主総会での承
認可決を前提として、7名の取締役(うち独立社外取締役3名)となる予定です。
[ 当期の運営状況 ]
第57期は計17回開催し、1回あたり平均3時間、経営の重要事項について慎重かつ多角的に審議い
たしました。具体的な審議内容としては、資金調達計画、国内外のグループ会社の設立、新工場の設
立、決算の状況、中期経営計画の進捗確認、リスクマネジメント、大規模投資案件の決定、およびサ
ステナビリティ委員会や内部統制推進委員会の進捗状況の確認などがあります。なお、上記のほか、
株
主
総
会
参
考
書
類
事
業
報
告
書面決議を1回実施しております。
② 監査役会
[ 役割 ]
監査役会は、法律・財務・会計や内部統制・ガバナンスなどで豊富な経験を有する者から構成され
ております。また、監査役は、株主の負託を受けた独立の機関として、取締役会その他重要な会議に
出席して発言を行うほか、積極的に事業拠点の視察を行うなど、能動的に権限を行使するとともに、
計
算
書
類
客観的な立場から適切に監査を行っております。
[ 構成 ]
現在、4名の監査役(うち独立社外監査役4名)により構成しております。
ご参考
当社のスキルマトリックス
監
査
報
告
2026/08/31 10:27:39 / 26335504̲株式会社物語コーポレーション̲招集通知̲電子提供措置用
[ 当期の運営状況 ]
57期は17回開催し、1回当たり平均1時間30分、監査報告書の作成、監査役監査方針、監査計画
および監査業務の分担などについて審議いたしました。
③ 指名・報酬委員会
[ 役割 ]
指名・報酬委員会は、取締役会の任意の諮問機関として、代表取締役および役付執行役員などの経
営幹部の選解任と取締役・監査役および執行役員候補の指名、ならびに、経営陣幹部・取締役・監査
役および執行役員の報酬などについての審議を経て取締役会へ答申などを行い、取締役会の意思決定
における客観性と透明性をより一層高め、取締役会の監督機能の独立性の強化を図っております。
[ 構成 ]
現在、指名・報酬委員会は、委員6名で構成されており、その過半数は独立社外取締役および独立
社外監査役で構成しています。また、委員長は、その独立社外取締役である委員の中から、指名・報
酬委員会の決議によって選定することとしております。
[ 当期の運営状況 ]
57期は5回開催し、1回当たり平均1時間、指名・報酬委員会の委員長の選任、役員報酬水準の
確認、取締役候補予定者・監査役候補予定者の選定およびスキルマトリックスに係る審議、執行役員
候補者の確認、取締役の報酬などに係る審議をいたしました。
ご参考
当社のスキルマトリックス
2026/08/31 10:27:39 / 26335504̲株式会社物語コーポレーション̲招集通知̲電子提供措置用
ご参考
当社の取締役会実効性評価
当社は、取締役会の実効性評価を年次で実施しております。すべての取締役・監査役からアンケー
トによる取締役会の実効性に関する自己評価を得たうえで、その結果を分析・評価しています。評価
結果については取締役会へ報告し、議論することによりPDCAサイクルを回し、取締役会の実効性の
維持・向上に努めております。
主な評価項目は以下のとおりです。
ガバナンス体制・仕組み
取締役会の役割・責務
取締役会の構成
取締役会の運営
取締役会における審議の活性化
経営の監督・経営陣との関係
全社的なガバナンス体制、権限委譲・グループ統制、内部監査部門との
連携、意思決定プロセスなど
大きな方向性の議論、将来への影響の議論、環境変化への対応、経営計
画などの審議・監督、役員の研鑽、情報共有など
構成に対する認識、規模
年間スケジュール、開催頻度、開催時間、招集時期、資料の提供時期、
議題の範囲、重要議題の対応、資料の量・質など
議事進行、個別の審議時間、発言・指摘、議論・意見交換、風土・雰囲
気など
指名・報酬委員会の役割、取締役の選解任・後継者計画、報酬制度、社
外役員の活用、経営陣による適切なリスクテイクの後押しなど
リスク把握
健全な企業風土の醸成、リスクの認識、リスク管理体制など
ステークホルダーとの関係
資本コストや株主を意識した経営の監督、株主との建設的な対話、サス
テナビリティ課題への取り組みの監督など
監査役・監査役会の実効性
監査役・監査役会の機能発揮
招
集
ご
通
知
株
主
総
会
参
考
書
類
事
業
報
告
当事業年度の取締役会実効性評価について
当事業年度の取締役会の実効性評価については、外部の第三者機関の助言を参考に、ガバナンス体
制・仕組み、取締役会の役割・責務、取締役会の構成、取締役会の運営、取締役会における審議の活
性化、経営の監督・経営陣との関係、リスク把握、ステークホルダーとの関係、監査役・監査役会の
実効性を評価し、実効性は確保されている旨を確認しております。各取締役・監査役からは、役員の
研鑽・内部監査部門との連携・常勤役員と社外役員のコミュニケーション等については更なる充実が
必要との指摘がなされました。また、引き続き、大きな方向性の議論・海外子会社を含むグループ統
制の在り方についてはより丁寧に対応する必要があるとの意見も寄せられました。
当社は、引き続き、あらゆるステークホルダーからの信頼獲得および持続的な企業価値の向上に向
け、取締役会の実効性向上に取り組んでまいります。