|
ZOZO, Inc. operates a single e-commerce segment focused on fashion retail and related services. The company manages the ZOZOTOWN online marketplace, which includes buy-sell, consignment, and used fashion sales, alongside the WEAR fashion media platform. Its business activities extend to the Lyst fashion shopping platform, where it earns performance-based fees, and a B2B division that provides system development, logistics, and marketing support to apparel manufacturers. The company also generates revenue through advertising on its platforms and offers the ZOZOSUIT body-measurement service in the United States. Key subsidiaries include ZOZO NEXT, ZOZO Apparel USA, Inc., ZOZO NEW ZEALAND LIMITED, Nantong Zhuoteng Information Technology Co., Ltd., LYST LTD, and ZOZO U.K. LIMITED. The group serves customers in Japan, the United States, New Zealand, and the United Kingdom, partnering with brands for consignment sales and with LINE Yahoo for distribution via Yahoo! Shopping and Yahoo! Auctions. Summarised from the annual report, fiscal year ended Mar 2026 |
Industry Internet Retail | Homepage corp.zozo.com |
| Sector Consumer Cyclical | IR page corp.zozo.com | |
|
Tags
fashion e-commerce, consignment sales, used fashion, fashion media, b2b logistics, advertising, body measurement technology, ZOZOTOWN, WEAR, LYST, ZOZO NEXT, ZOZO Apparel USA Inc., ZOZO NEW ZEALAND LIMITED, Nantong Zhuoteng Information Technology Co. Ltd., LYST LTD, ZOZO U.K. LIMITED, ZOZOSUIT, ZOZOMO, ZOZO USED, Yahoo! Shopping, Yahoo! Auctions
|
Press page — |
Metrics
| Valuation | |
|---|---|
| Market cap | ¥ 971.423B |
| Market cap (USD) | $ 6.071B |
| P/E | 19.74 |
| PEG | 2.98 |
| P/BV | 10.55 |
| P/S | 4.16 |
| P/OCF | 17.11 |
| P/FCF | 19.75 |
| Dividend yield | 3.6% |
| Turnover / mcap | — |
| Returns | |
|---|---|
| ROE | 46.6% |
| ROI | 37.8% |
| ROIC | 38.3% |
| Profit margin | 21.0% |
| Growth | |
|---|---|
| Revenue growing | Yes |
| Profits growing | Yes |
| Revenue up 3y | Yes |
| Revenue up 5y | Yes |
| Earnings growth 3y (net profit CAGR) | 6.6% |
| Quality | |
|---|---|
| Profitable | Yes |
| Margin expanding | No |
| Buying back stock | Yes |
| Diluting (TTM) | No |
| Debt/Equity | — |
| Podcast bulls (TTM) | Sign up |
| Podcast bears (TTM) | Sign up |
| Podcast sentiment (TTM) | Sign up |
| Podcast sentiment % (TTM) | Sign up |
| News sentiment (TTM) | 0 |
| Quality score | 38.9% |
| Insiders | |
|---|---|
| Buys, 1w | Sign up |
| Buys, 1m | Sign up |
| Buys, 1y | Sign up |
| Sells, 1w | Sign up |
| Sells, 1m | Sign up |
| Sells, 1y | Sign up |
Sign up to see this company's insider trades
| Figure | FY 2026 | FY 2025 | FY 2024 | FY 2023 | FY 2022 | FY 2021 | FY 2020 | FY 2019 | FY 2018 | FY 2017 | FY 2016 | FY 2015 | FY 2014 | FY 2013 |
|---|---|---|---|---|---|---|---|---|---|---|---|---|---|---|
| Revenue | 228.373B | 213.131B | 197.016B | 183.423B | 166.199B | 147.402B | 125.517B | 118.405B | 98.432B | 76.393B | 54.422B | 41.182B | 38.58B | 35.05B |
| Net profit | 47.926B | 45.346B | 44.341B | 39.526B | 34.492B | 30.932B | 18.804B | 15.985B | 20.156B | 17.035B | 11.988B | 8.999B | 7.797B | 5.36B |
| Free cash flow | 45.482B | 53.829B | 33.226B | 27.401B | 38.559B | 41.566B | 19.619B | 11.173B | 15.318B | 17.187B | 10.854B | — | — | — |
| Figure | FY 2026 | FY 2025 | FY 2024 | FY 2023 | FY 2022 | FY 2021 | FY 2020 | FY 2019 | FY 2018 | FY 2017 | FY 2016 | FY 2015 | FY 2014 | FY 2013 |
|---|---|---|---|---|---|---|---|---|---|---|---|---|---|---|
| Share price | 1.105K | 1.435K | 3.808K | 2.987K | 3.285K | 3.27K | 1.454K | 2.087K | 2.842K | 2.465K | 1.513K | 1.056K | 880.92 | 388.64 |
| Price performance 12m | -0.23 | -0.62 | 0.27 | -0.09 | 0 | 1.25 | -0.3 | -0.27 | 0.15 | 0.63 | 0.43 | 0.2 | 1.27 | — |
Filed figures
Lines the statements and their notes report beside the headline figures, read from the filings' XBRL as filed (no restatement applied), with figures computed from one filing's own lines. Cash-flow lines carry their cash direction: an outflow is negative. Each period links to its filing; a figure's period, report date and tag are in its tooltip.
| Figure | Mar 2017 | Mar 2018 | Mar 2019 | Mar 2020 | Mar 2021 | Mar 2022 | Mar 2023 | Mar 2024 | Mar 2025 | Mar 2026 |
|---|---|---|---|---|---|---|---|---|---|---|
| Balance sheet detail | ||||||||||
| Trade receivables (JPY) | 20.9B | 25.4B | 27.4B | 31.5B | 32.8B | 30.6B | 43B | 45.8B | 49.5B | 53.3B |
| ↳ YoY growth | +86.7% | +21.7% | +8.0% | +15.1% | +3.9% | -6.6% | +40.5% | +6.5% | +8.0% | +7.9% |
| ↳ 5y CAGR | +24.0% | +8.0% | +11.1% | +10.8% | +9.4% | +10.2% | ||||
| Borrowings, current (JPY) | — | — | 22B | 22B | 20B | 20.2B | 20.4B | 20B | 20B | 20B |
| Cash and deposits (JPY) | 22.1B | 24.6B | 21.6B | 33.6B | 61.6B | 65.5B | 69.1B | 64.7B | 91.5B | 69.4B |
| Intangible assets (JPY) | 1.08B | 3.22B | 3.11B | 2.97B | 2.92B | 2.62B | 2.38B | 2.61B | 3.44B | 28.6B |
| Net debt (borrowings + leases - cash) (JPY) | — | — | 440M | -11.6B | -41.6B | -45.3B | -48.7B | -44.7B | -71.5B | -49.4B |
| Cash flow detail | ||||||||||
| Operating cash flow (JPY) | 18.3B | 19.9B | 14.8B | 24.8B | 44.8B | 39.9B | 36.7B | 42.6B | 60.1B | 52.5B |
| Purchases of property, plant and equipment (JPY) | -888M | -4.51B | -3.03B | -4.98B | -3.22B | -1.22B | -8.96B | -8B | -4.8B | -4.82B |
| Purchases of intangible assets (JPY) | -219M | -50M | -603M | -194M | -128M | -114M | -313M | -1.37B | -1.49B | -2.23B |
| Change in receivables (cash effect) (JPY) | -10.1B | -4.47B | -2.02B | -4.14B | -1.22B | 2.17B | -12.3B | -2.99B | -3.66B | -1.54B |
| Change in inventories (cash effect) (JPY) | -228M | -1.21B | -4.37B | 4.08B | -38M | -215M | -1B | -1.2B | 1.17B | -883M |
| Change in payables (cash effect) (JPY) | -39M | 0.00 | 1.67B | -1.63B | 75M | 226M | 44M | 32M | -70M | 53M |
| Dividends paid (cash effect) (JPY) | -4.98B | -8.72B | -9.57B | -6.71B | -10.1B | -14.5B | -18B | -27B | -32.1B | -32.8B |
| Share buybacks (cash effect) (JPY) | 0.00 | — | -24.4B | — | 0.00 | -32B | 0.00 | -10B | 0.00 | -10B |
| Interest paid (cash effect) (JPY) | -4M | -9M | -80M | -95M | -66M | -74M | -78M | -78M | -129M | -258M |
| Income taxes paid (cash effect) (JPY) | -6.58B | -9.7B | -11.3B | -7.73B | -6.99B | -16.6B | -14.2B | -17.1B | -16.1B | -21.7B |
| Share-based compensation (JPY) | — | — | 110M | -109M | 47M | 86M | 114M | 260M | 288M | -29M |
| Operating cash flow before change in receivables (JPY) | 28.4B | 24.4B | 16.8B | 28.9B | 46B | 37.7B | 49B | 45.6B | 63.8B | 54.1B |
| Free cash flow (OCF - PPE - intangibles) (JPY) | 17.2B | 15.3B | 11.2B | 19.6B | 41.4B | 38.6B | 27.4B | 33.2B | 53.8B | 45.5B |
| Income detail | ||||||||||
| Research and development expense (JPY) | — | — | — | — | 211M | 1.18B | 843M | 637M | 1.04B | 1.89B |
| ↳ 5y CAGR | +55.1% | |||||||||
| Total comprehensive income (JPY) | 16.9B | 20.2B | 16.1B | 18.7B | 30.8B | 34.6B | 39.4B | 44.8B | 45.8B | 51B |
| Comprehensive income to owners (JPY) | 16.9B | 20.1B | 16.1B | 18.7B | 30.8B | 34.5B | 39.5B | 44.7B | 45.8B | 51B |
| Provision for credit losses (JPY) | — | — | — | 204M | 33M | 25M | 3M | — | — | — |
| Credit cost ratio (credit losses / average receivables) (%) | — | — | — | 0.7% | 0.1% | 0.1% | 0.0% | — | — | — |
| Reported | Jun 28, 2017 | Jun 27, 2018 | Jun 26, 2019 | Jun 12, 2020 | Jun 14, 2022 | Jun 14, 2022 | Jun 14, 2023 | Jun 14, 2024 | Jun 13, 2025 | Jun 8, 2026 |
Sign up to see institutional holdings
Sign UpPodcast Mentions
Sign up to see podcast mentions and sentiment
Sign UpTimely disclosures published on TDnet, newest first, titles as filed in Japanese. The link opens the disclosure on TDnet. Filings with EDINET (periodic reports, extraordinary reports, offerings, holding and buy-back reports), newest first, titles as filed in Japanese. The link opens the filing on EDINET. Press releases from the company's own website, newest first.


メニューを開く
サイト内検索

-
企業情報
-
ニュース
-
IR
-
統合報告
-
サステナビリティ
-
採用
-
BLOG
企業情報
ニュース
IR
統合報告
サステナビリティ
採用
BLOG
サイト内検索
JP
- JP
- EN
FOLLOW US


IR
自己株式の取得状況に関するお知らせ
2026年11月4日
NEW
IR情報
自己株式の取得状況に関するお知らせ
本日、下記の適時開示をいたしました。
詳細は添付資料をご参照ください。
このページをシェアする


企業情報
企業情報
ニュース
ニュース
IR
IR
統合報告
統合報告
サステナビリティ
サステナビリティ
採用
採用
BLOG
BLOG
FOLLOW US


© ZOZO, Inc. ALL RIGHTS RESERVED.
1
このウェブサイトではお客様の利便性向上・閲覧の追跡等のため、クッキーを使用しております。
詳細はクッキーポリシー
をご覧ください。
同意する
1

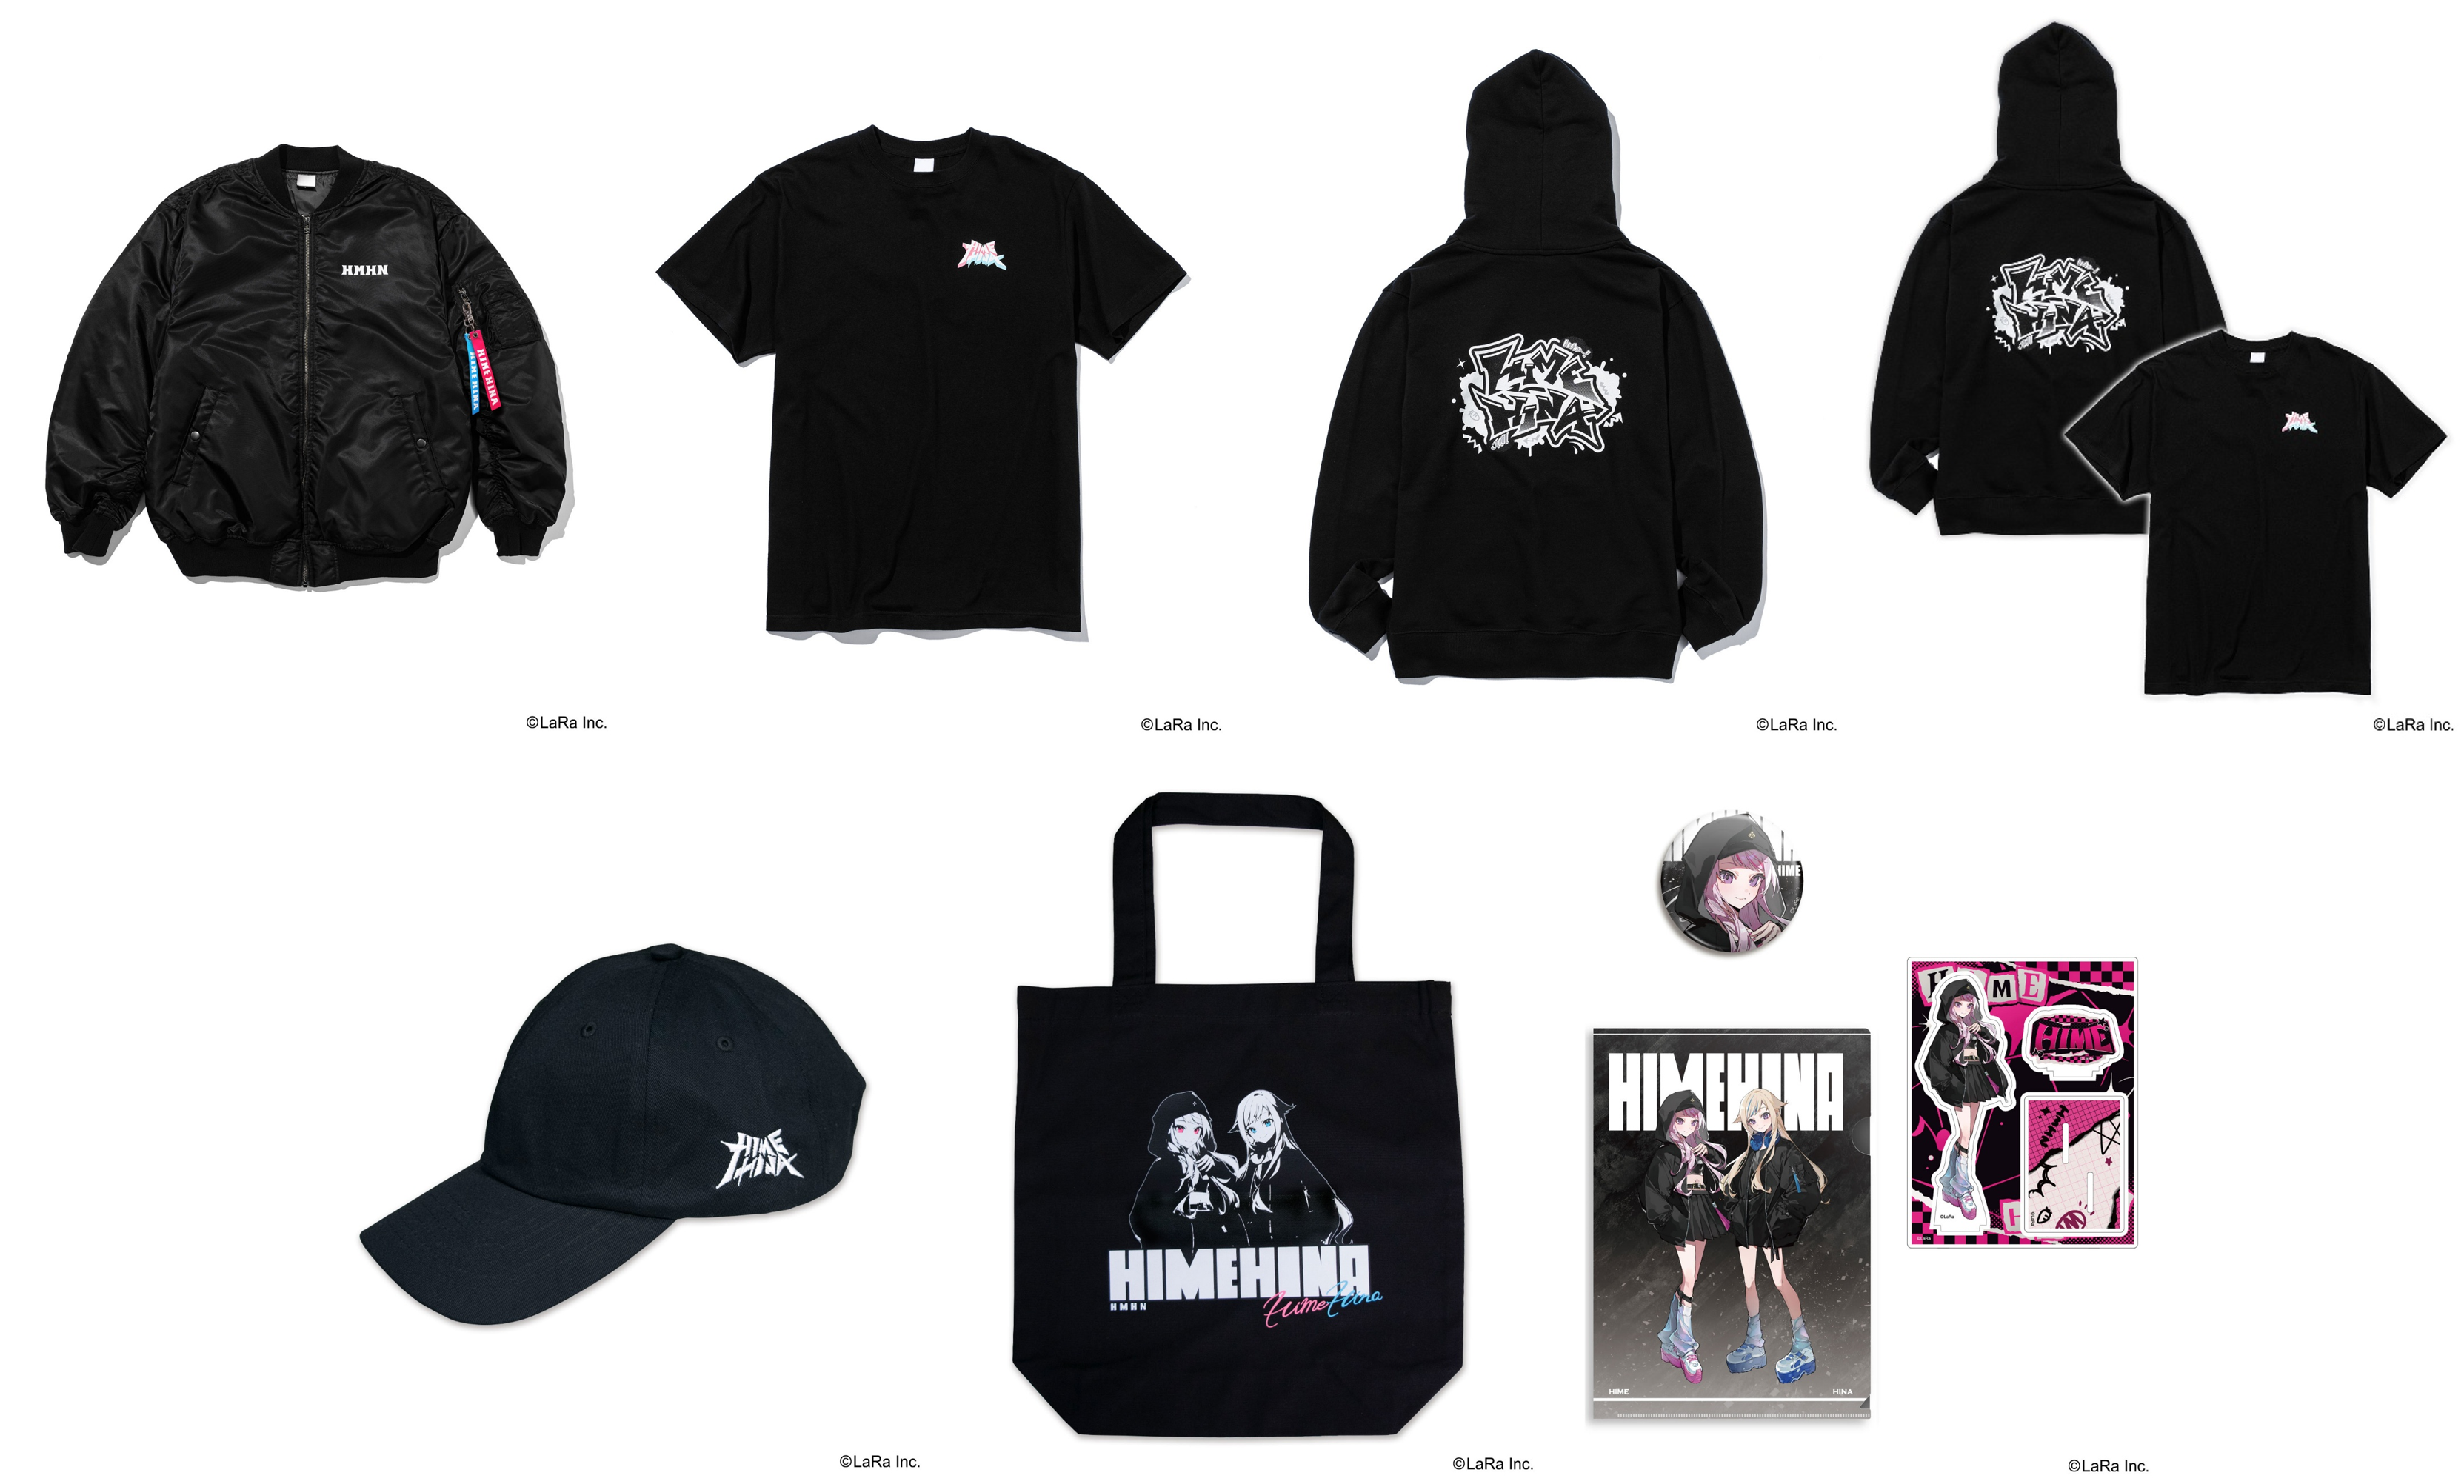







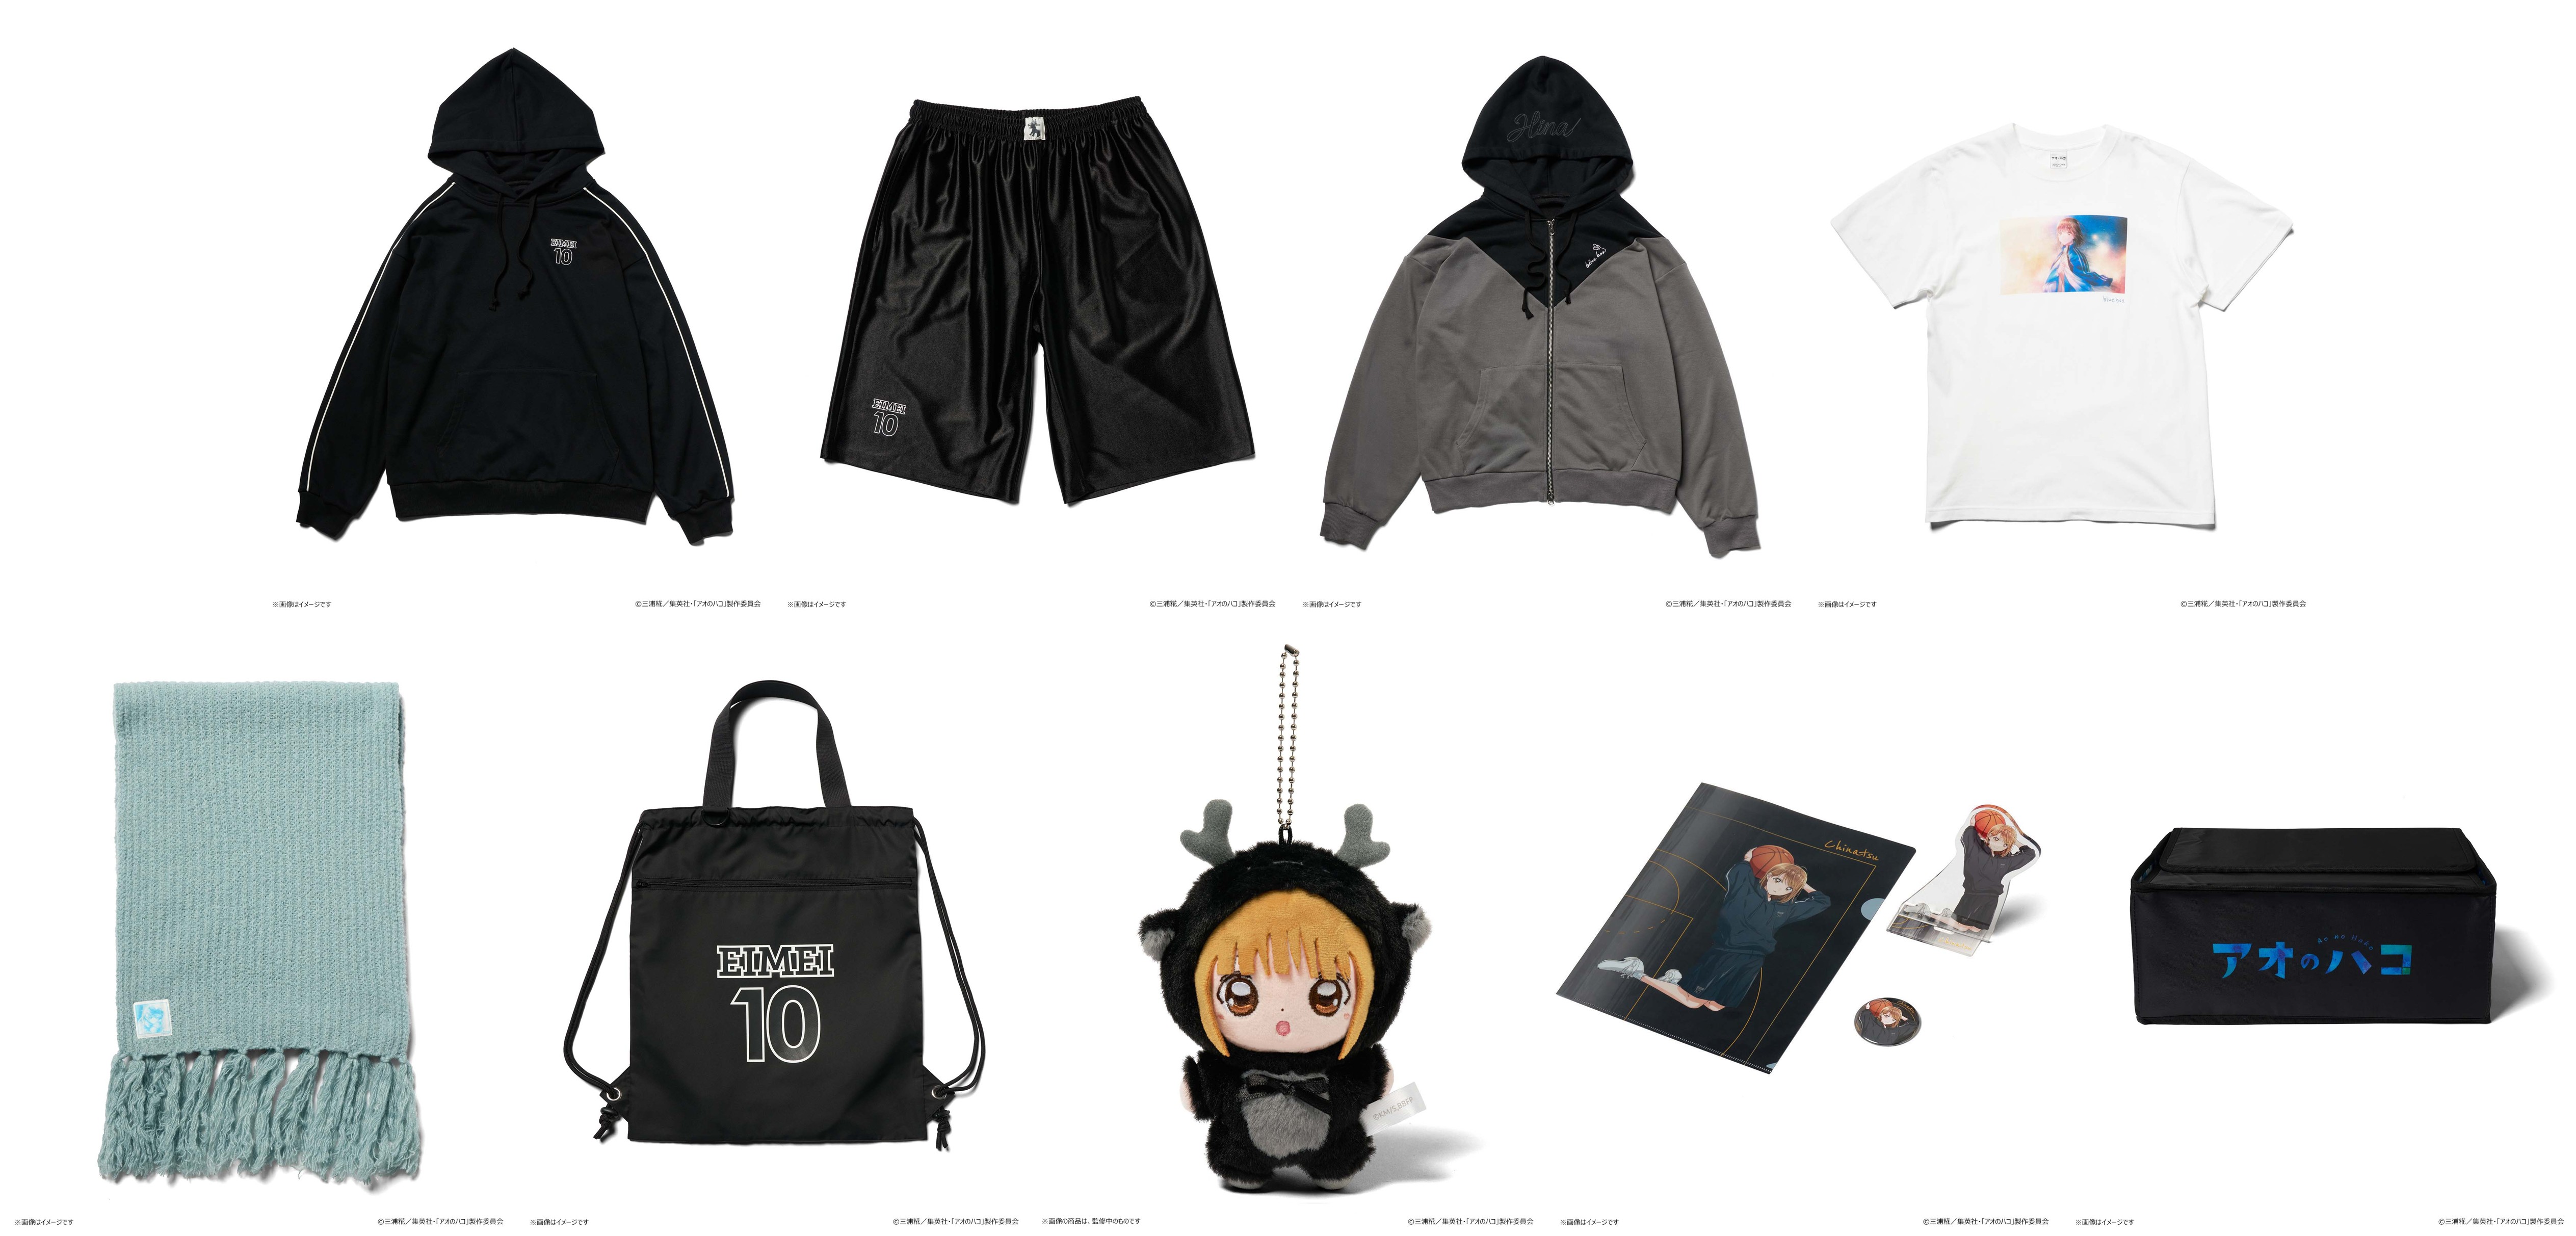

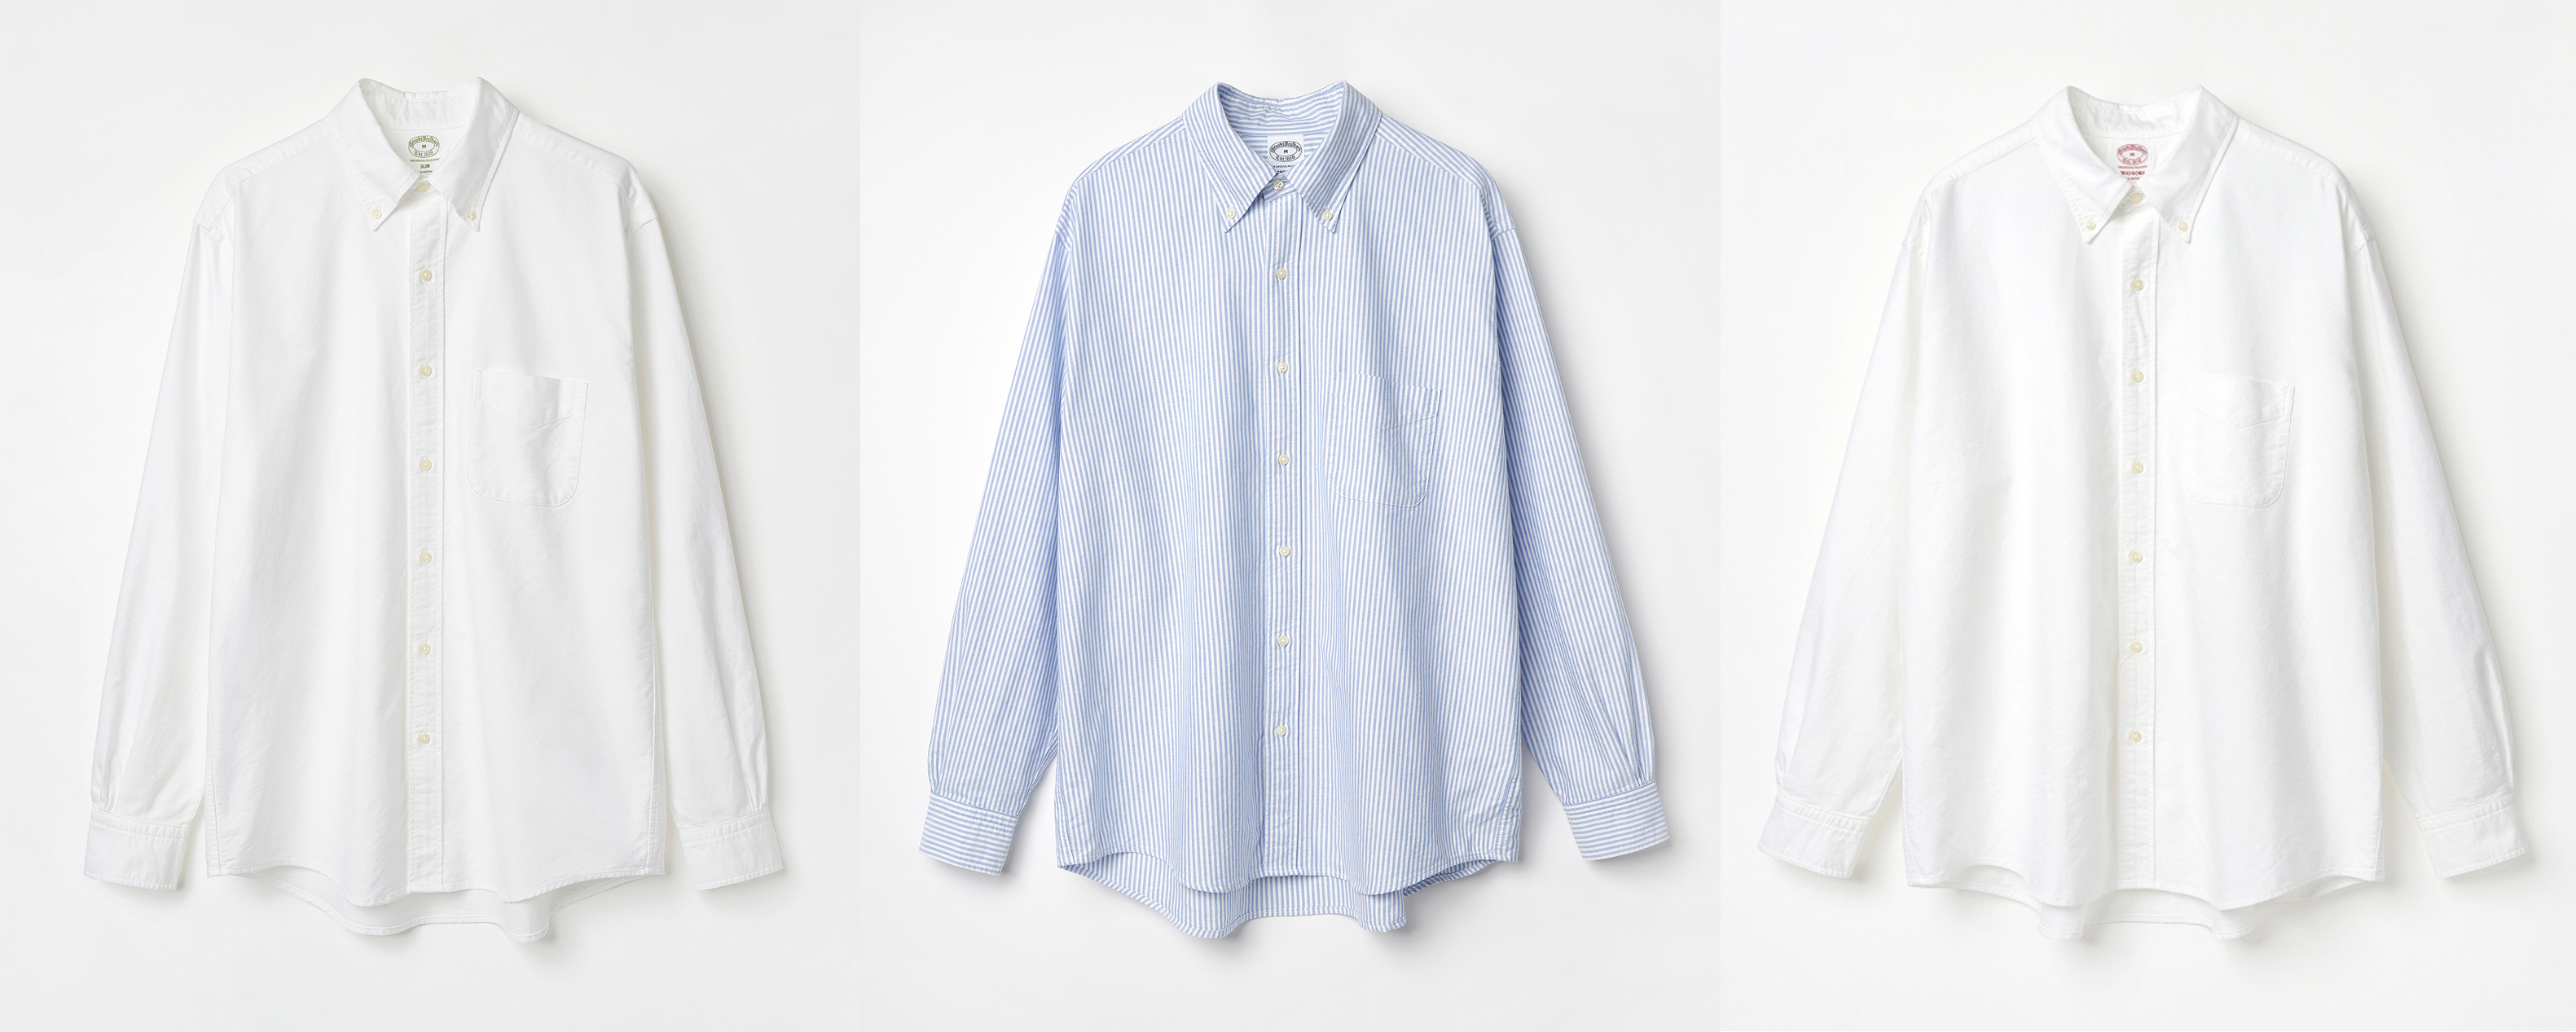

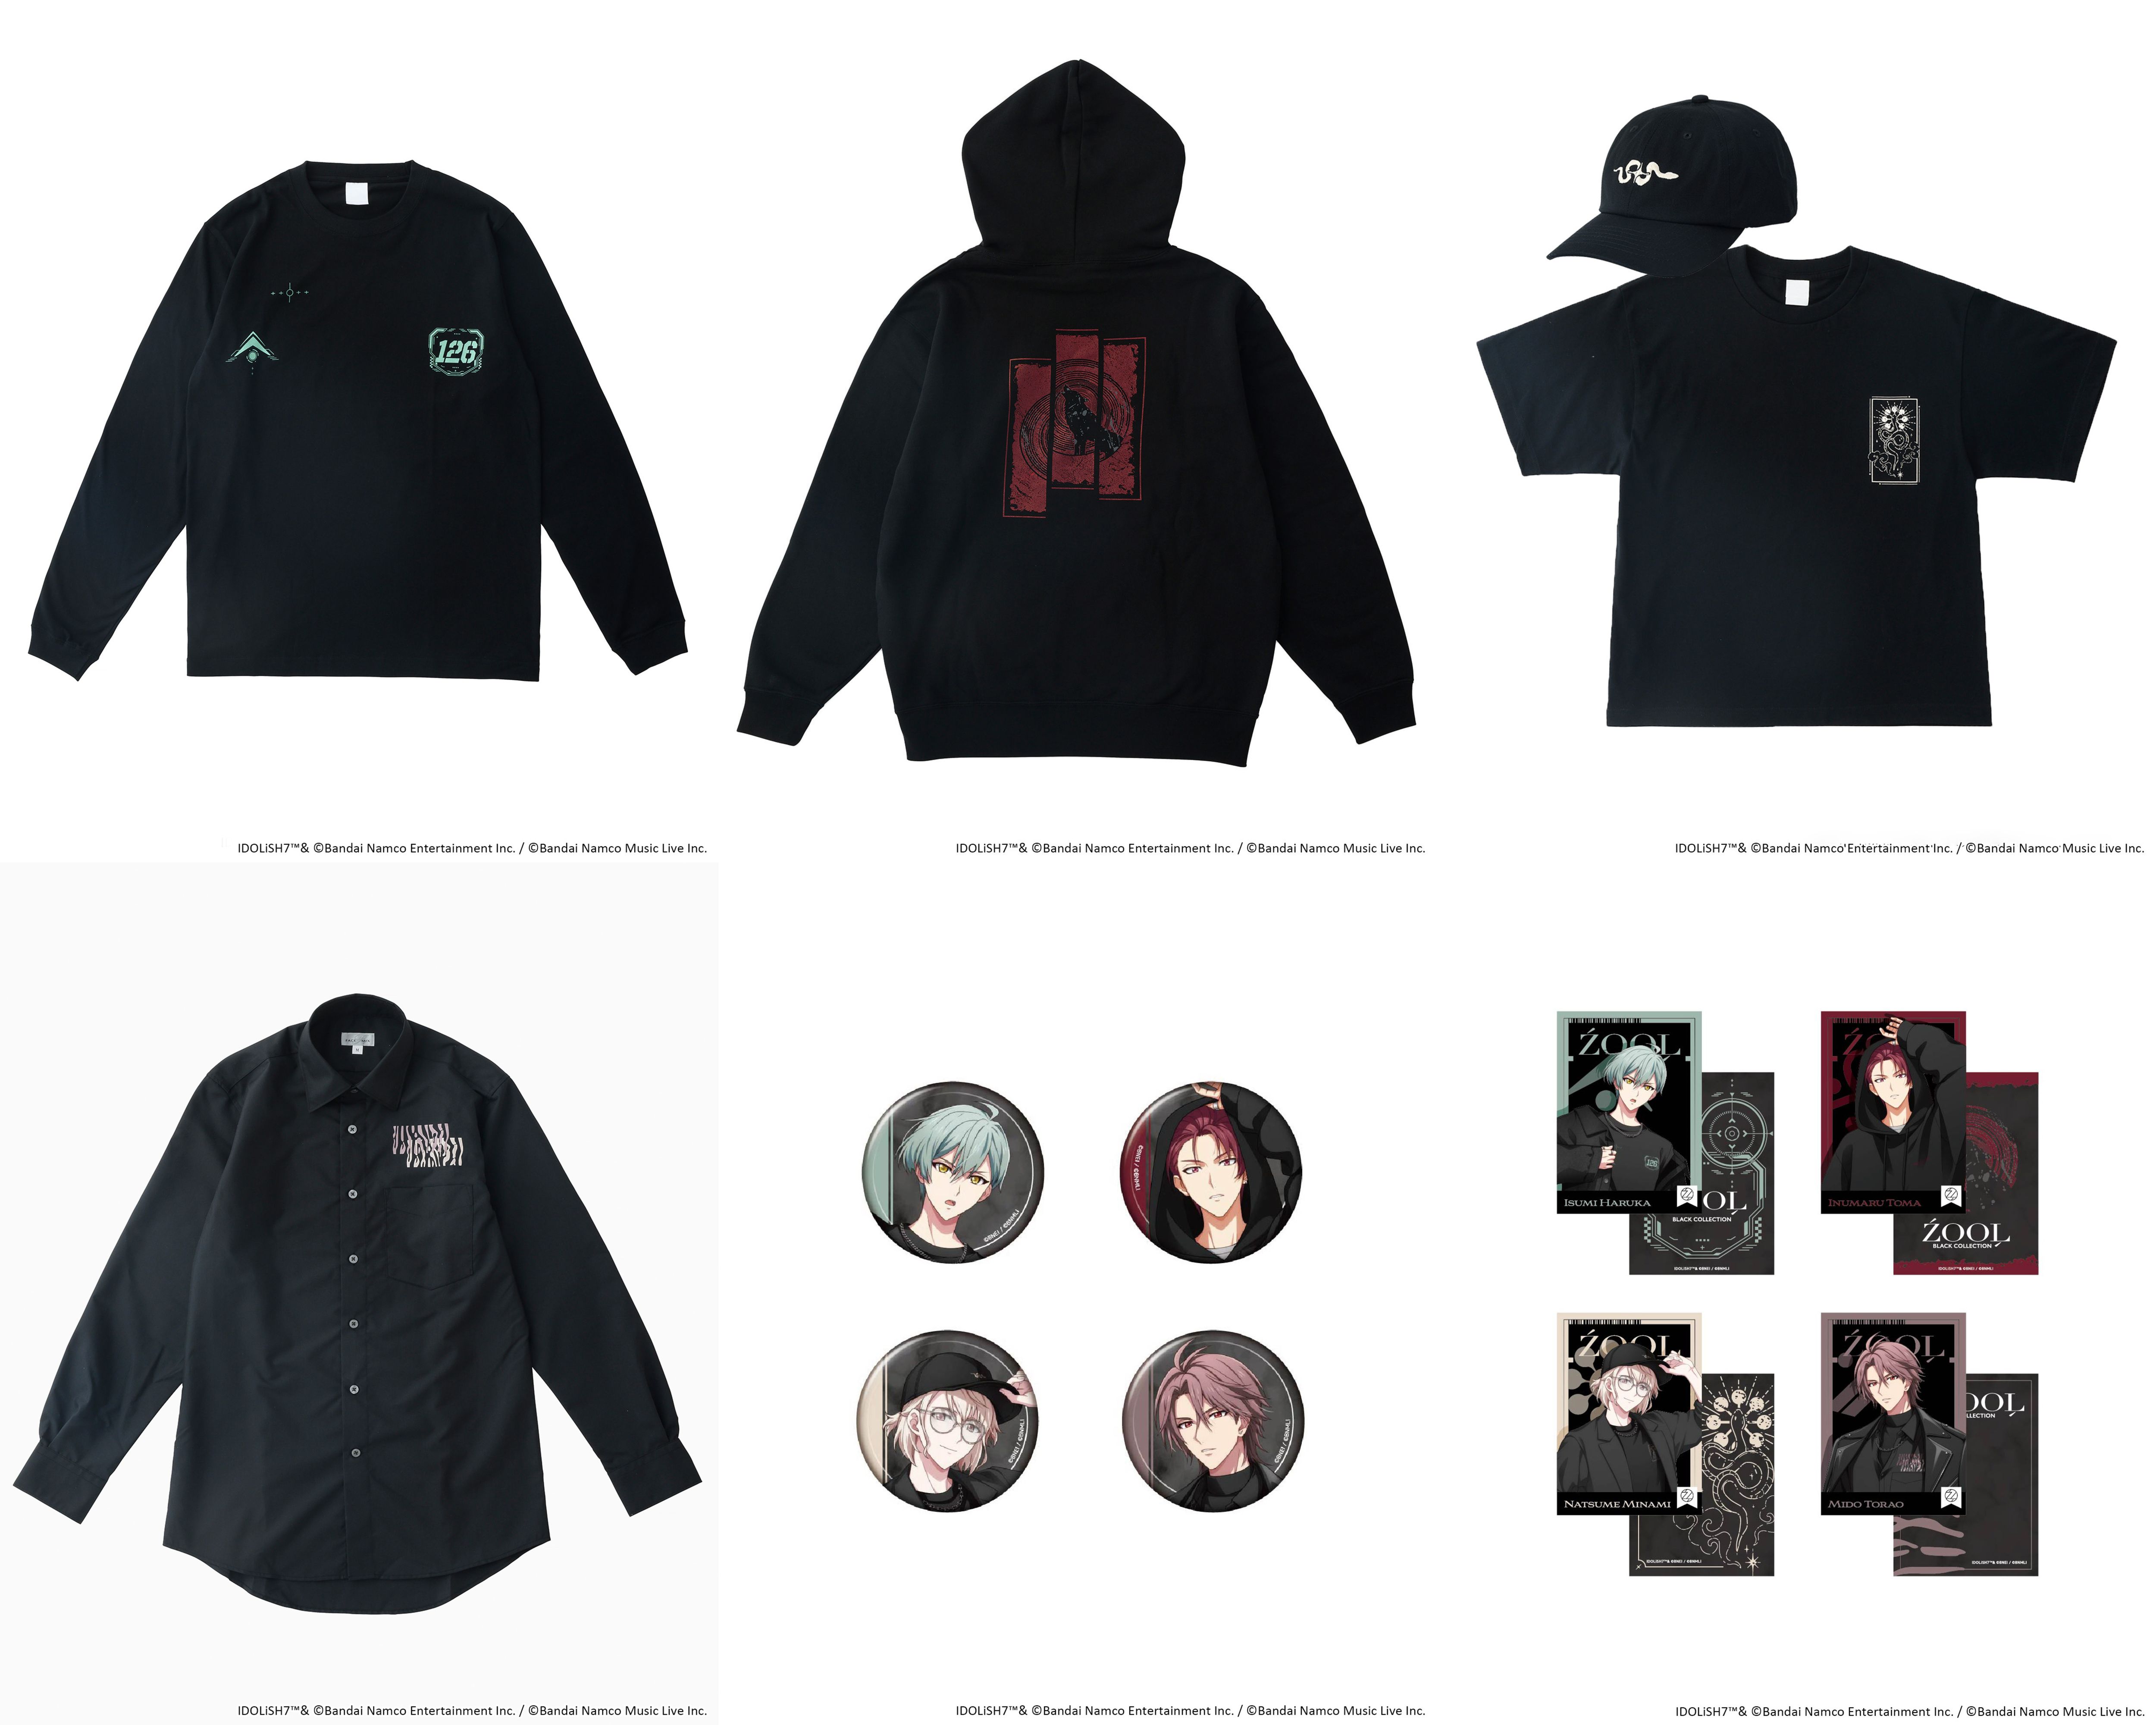

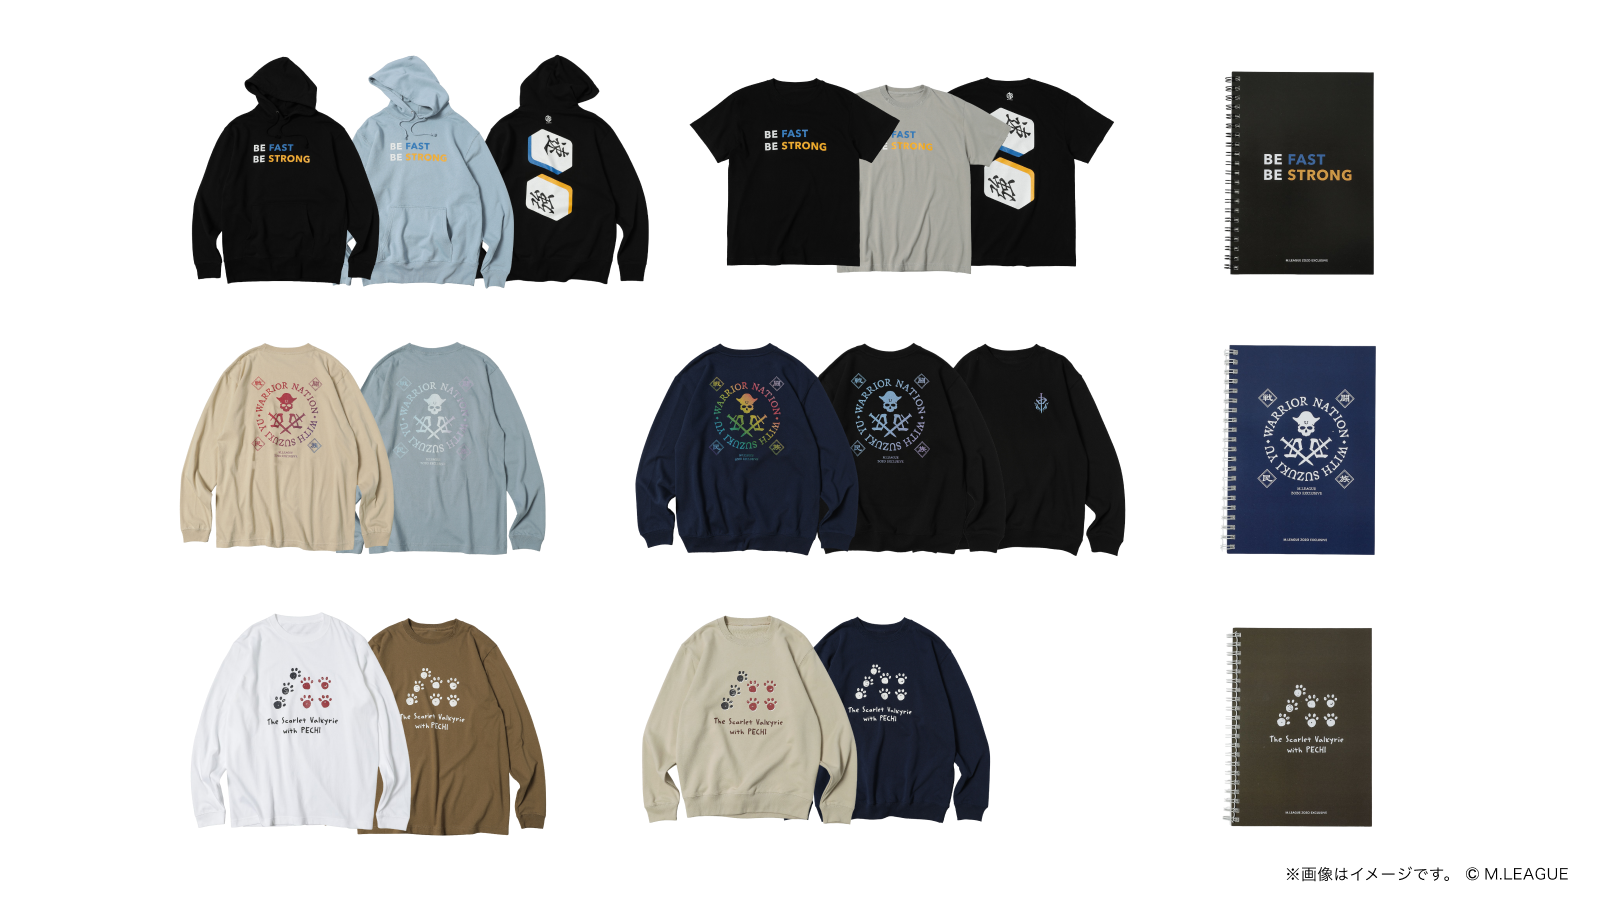
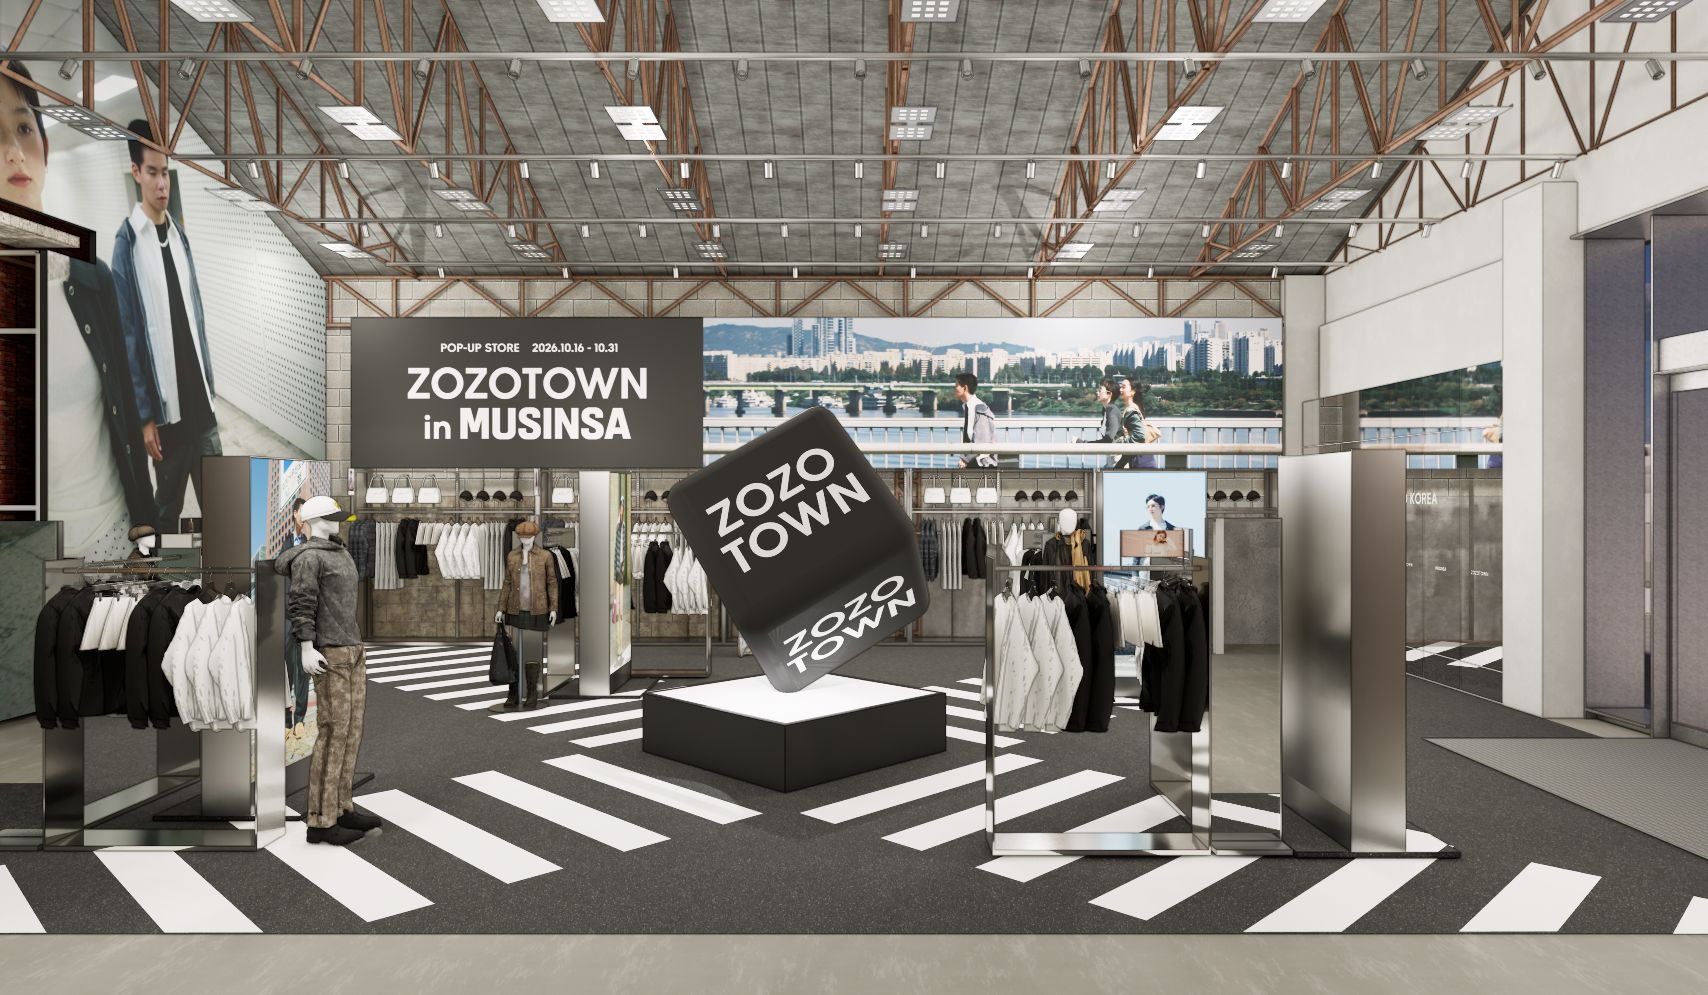
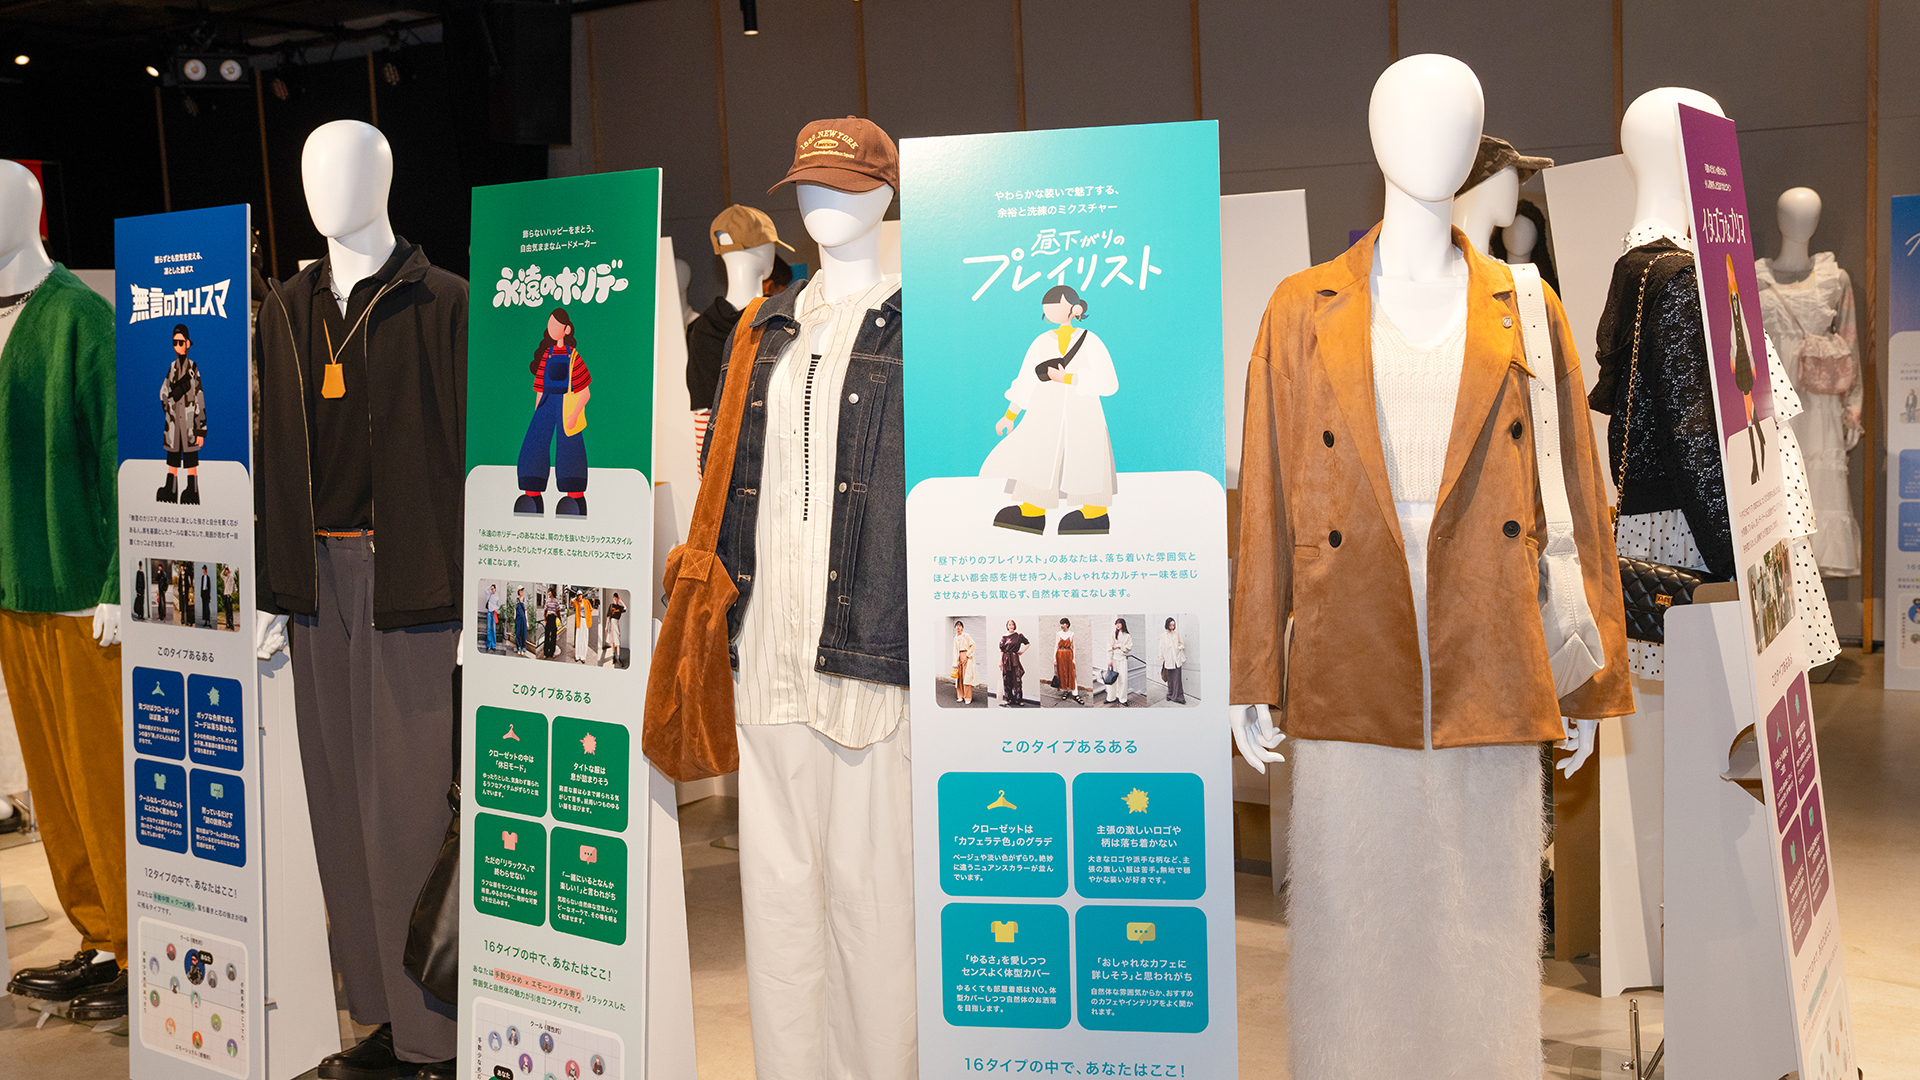
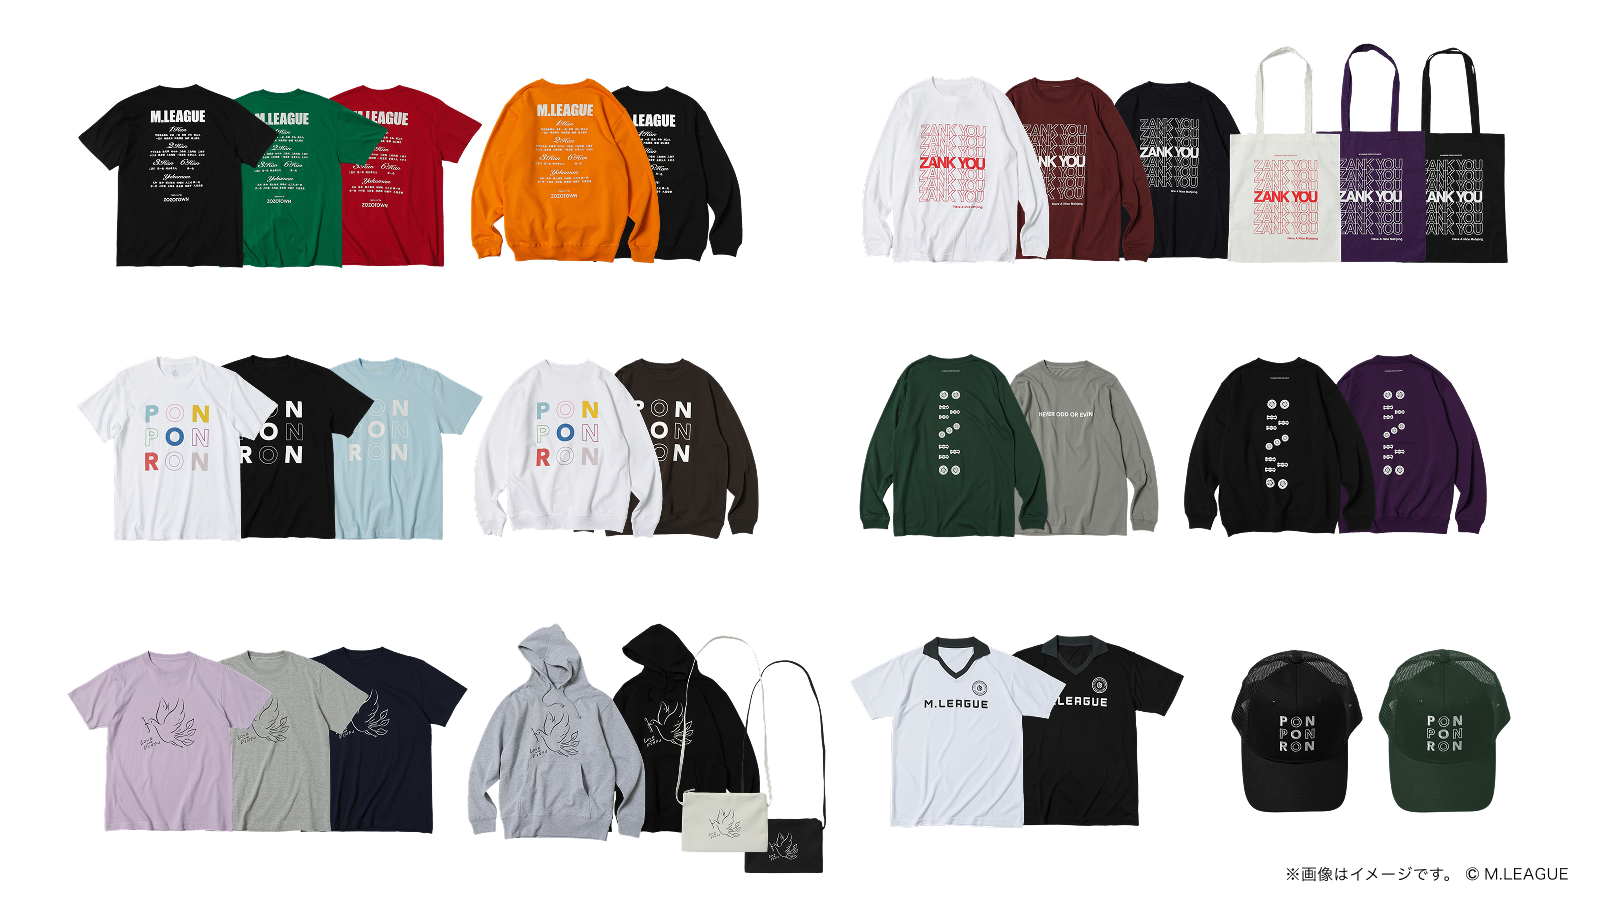 (左上から)






Prompts
Click prompts to add them under the company line, click again to take one out, then copy the result into your AI chat. Shared by Asian Century Stocks and Uncovered Thai Stocks. Thank you.
ETFs Holding ZOZO, Inc.
Exchange-traded funds whose newest published daily portfolio holds one of the company's listings, largest weight first.
| ETF | Weight in ETF | Shares | Market value | As of |
|---|---|---|---|---|
| RFDI | 0.19% | 43,300 | $ 311.064K | Jul 31, 2026 |
| DIHP | 0.06% | 521,000 | $ 3.773M | Nov 12, 2026 |
| DFSI | 0.03% | 47,700 | $ 345.445K | Nov 12, 2026 |
| DFIC | 0.02% | 471,600 | $ 3.415M | Nov 12, 2026 |
| AVIV | 0.02% | 68,300 | $ 514.038K | Nov 16, 2026 |
| JSTC | 0.02% | 9,330 | $ 70.395K | Nov 17, 2026 |
| DXIV | 0.02% | 5,700 | $ 41.28K | Nov 12, 2026 |
| DFAI | 0.01% | 374,800 | $ 2.714M | Nov 12, 2026 |
| AVDE | 0.01% | 202,600 | $ 1.525M | Nov 16, 2026 |
| AVSD | 0.01% | 2,700 | $ 20.321K | Nov 16, 2026 |
| DFAX | 0.01% | 154,300 | $ 1.117M | Nov 12, 2026 |