|
Gunze Limited is a diversified Japanese conglomerate operating across four main business segments: functional solutions, medical, apparel, and life creation. In functional solutions, the company manufactures and sells plastic films, engineering plastics, and machinery for printing and food processing, with overseas operations through subsidiaries such as Gunze Plastics & Engineering Corporation of America. The medical segment involves the production and distribution of medical materials, supported by Gunze Medical and Gunze Medical Devices (Shenzhen) Co., Ltd. The apparel segment includes the manufacture and sale of underwear, legwear, outerwear, and textile materials like sewing threads, with distribution handled by Gunze Logistics and wholesale by Tryon. The life creation segment encompasses real estate development, greenery sales, sports club management, and solar power generation, managed by subsidiaries including Gunze Development, Gunze Green, and Gunze Sports. The group serves domestic and international markets, with specific overseas manufacturing and sales entities in the United States, China, and Indonesia. Summarised from the annual report, fiscal year ended Mar 2026 |
Industry Conglomerates | Homepage gunze.co.jp |
| Sector Industrials | IR page gunze.co.jp/ir | |
|
Tags
plastic films, engineering plastics, medical materials, underwear, legwear, textile materials, real estate development, sports clubs, solar power, printing machinery, Gunze Plastics & Engineering Corporation of America, Gunze Packaging Systems, Fukushima Plastics, Gunze Medical, Gunze Medical Devices (Shenzhen) Co. Ltd., Tryon, Beijing Aimer Gunze Apparel Co. Ltd., Chuo Textile Materials, PT.Gunze Indonesia, Gunze Development, Gunze Green, Gunze Sports, Tohoku Gunze, Gunze Logistics, STATAWAY, SmaShee
|
Press page gunze.co.jp/ir/news |
Metrics
| Valuation | |
|---|---|
| Market cap | ¥ 126.822B |
| Market cap (USD) | $ 792.646M |
| P/E | 23.10 |
| PEG | — |
| P/BV | 1.13 |
| P/S | 0.98 |
| P/OCF | 7.06 |
| P/FCF | 11.72 |
| Dividend yield | 5.4% |
| Turnover / mcap | — |
| Returns | |
|---|---|
| ROE | 0.43% |
| ROI | 0.42% |
| ROIC | 2.1% |
| Profit margin | 0.39% |
| Growth | |
|---|---|
| Revenue growing | No |
| Profits growing | No |
| Revenue up 3y | No |
| Revenue up 5y | No |
| Earnings growth 3y (net profit CAGR) | -51.6% |
| Quality | |
|---|---|
| Profitable | Yes |
| Margin expanding | No |
| Buying back stock | No |
| Diluting (TTM) | No |
| Debt/Equity | — |
| Podcast bulls (TTM) | Sign up |
| Podcast bears (TTM) | Sign up |
| Podcast sentiment (TTM) | Sign up |
| Podcast sentiment % (TTM) | Sign up |
| News sentiment (TTM) | 2 |
| Quality score | -38.9% |
| Insiders | |
|---|---|
| Buys, 1w | Sign up |
| Buys, 1m | Sign up |
| Buys, 1y | Sign up |
| Sells, 1w | Sign up |
| Sells, 1m | Sign up |
| Sells, 1y | Sign up |
Sign up to see this company's insider trades
| Figure | FY 2026 | FY 2025 | FY 2024 | FY 2023 | FY 2022 | FY 2021 | FY 2020 | FY 2019 | FY 2018 | FY 2017 | FY 2016 | FY 2015 | FY 2014 | FY 2013 |
|---|---|---|---|---|---|---|---|---|---|---|---|---|---|---|
| Revenue | 130.918B | 137.117B | 132.885B | 136.03B | 124.314B | 123.649B | 140.311B | 140.706B | 140.521B | 136.579B | 138.324B | 141.172B | 142.425B | 132.373B |
| Net profit | 509M | 6.279B | 5.109B | 4.501B | 2.939B | 2.147B | 4.387B | 4.087B | 3.486B | 3.102B | -1.201B | 3.215B | 2.508B | -1.161B |
| Free cash flow | 5.122B | 1.376B | 3.243B | -8.432B | 4.414B | 3.799B | 4.089B | 5.6B | 3.674B | 4.809B | 5.085B | — | — | — |
| Figure | FY 2026 | FY 2025 | FY 2024 | FY 2023 | FY 2022 | FY 2021 | FY 2020 | FY 2019 | FY 2018 | FY 2017 | FY 2016 | FY 2015 | FY 2014 | FY 2013 |
|---|---|---|---|---|---|---|---|---|---|---|---|---|---|---|
| Share price | 3.699K | 2.633K | 5.509K | 4.492K | 3.746K | 4.157K | 3.63K | 4.468K | 6.034K | 454.79 | 3.205K | 3.205K | 273.93 | — |
| Price performance 12m | 0.4 | -0.52 | 0.23 | 0.2 | -0.1 | 0.15 | -0.19 | -0.26 | 12.27 | -0.86 | 0 | 10.7 | — | — |
Filed figures
Lines the statements and their notes report beside the headline figures, read from the filings' XBRL as filed (no restatement applied), with figures computed from one filing's own lines. Cash-flow lines carry their cash direction: an outflow is negative. Each period links to its filing; a figure's period, report date and tag are in its tooltip.
| Figure | Mar 2017 | Mar 2018 | Mar 2019 | Mar 2020 | Mar 2021 | Mar 2022 | Mar 2023 | Mar 2024 | Mar 2025 | Mar 2026 |
|---|---|---|---|---|---|---|---|---|---|---|
| Balance sheet detail | ||||||||||
| Trade receivables (JPY) | 27.8B | 30.3B | 30.4B | 28.1B | 27.7B | 26.6B | 27.1B | 27.6B | 25B | 22.6B |
| ↳ YoY growth | -3.9% | +8.9% | +0.3% | -7.5% | -1.4% | -3.9% | +1.9% | +1.7% | -9.3% | -9.8% |
| ↳ 5y CAGR | -0.9% | -0.9% | -2.2% | -1.9% | -2.3% | -4.0% | ||||
| Borrowings, current (JPY) | 19.1B | 17.6B | 14.7B | 12.7B | 12.7B | 7.42B | 6.52B | 714M | 3.19B | 8.59B |
| Borrowings, non-current (JPY) | 8.56B | 9.91B | 11B | 12B | 4.58B | 2.32B | 8.64B | 8.23B | 5.67B | 5.26B |
| Cash and deposits (JPY) | 9.67B | 9.48B | 8.1B | 9.27B | 9.72B | 14.5B | 11.5B | 10.8B | 10.5B | 9.94B |
| Intangible assets (JPY) | 1.92B | 1.82B | 2.14B | 1.77B | 1.61B | 1.34B | 1.45B | 1.93B | 1.79B | 1.39B |
| Net debt (borrowings + leases - cash) (JPY) | 18B | 18B | 17.6B | 15.4B | 7.58B | -4.73B | 3.61B | -1.87B | -1.69B | 3.91B |
| Cash flow detail | ||||||||||
| Operating cash flow (JPY) | 13.8B | 9.01B | 11.5B | 13.7B | 8.6B | 9.16B | 1.79B | 10.4B | 11.6B | 17.3B |
| Purchases of property, plant and equipment (JPY) | -9.02B | -5.33B | -5.89B | -9.6B | -4.8B | -4.74B | -10.2B | -7.17B | -10.2B | -12.1B |
| Change in receivables (cash effect) (JPY) | 1.12B | -2.43B | -450M | 3.39B | 206M | 1.7B | 124M | -135M | 3.04B | 2.47B |
| Change in inventories (cash effect) (JPY) | 283M | 259M | -1.25B | -683M | 1.72B | -2B | -4.23B | 494M | 322M | 5.36B |
| Change in payables (cash effect) (JPY) | 547M | 40M | -163M | 400M | -2.25B | 639M | 572M | -2.16B | -164M | -926M |
| Dividends paid (cash effect) (JPY) | -1.58B | -1.4B | -1.65B | -1.99B | -2.04B | -2.03B | -2.41B | -2.5B | -2.54B | -6.31B |
| Share buybacks (cash effect) (JPY) | -3M | -2.1B | -1.33B | -1.49B | -391M | -1.92B | -1B | -2.01B | -2.38B | -5.01B |
| Interest paid (cash effect) (JPY) | -196M | -194M | -232M | -232M | -110M | -149M | -230M | -244M | -85M | -79M |
| Income taxes paid (cash effect) (JPY) | -601M | -1.73B | -614M | -2.17B | -1.31B | -1.04B | -2.88B | 661M | -1.98B | -715M |
| Operating cash flow before change in receivables (JPY) | 12.7B | 11.4B | 11.9B | 10.3B | 8.39B | 7.46B | 1.67B | 10.5B | 8.53B | 14.8B |
| Free cash flow (OCF - PPE - intangibles) (JPY) | 4.81B | 3.67B | 5.6B | 4.09B | 3.8B | 4.41B | -8.43B | 3.24B | 1.38B | 5.12B |
| Income detail | ||||||||||
| Research and development expense (JPY) | 3.07B | 3B | 2.82B | 2.95B | 2.75B | 2.58B | 2.5B | 2.47B | 2.45B | 2.58B |
| ↳ 5y CAGR | -2.6% | -3.5% | -3.6% | -2.6% | -3.7% | -1.3% | ||||
| Total comprehensive income (JPY) | 3.19B | 6.63B | 1.57B | 1.74B | 8.33B | 3.33B | 6.32B | 7.4B | 5.46B | 4.34B |
| Comprehensive income to owners (JPY) | 4.78B | 6.49B | 1.44B | 1.62B | 8.23B | 3.15B | 6.2B | 7.32B | 5.29B | 4.21B |
| Segments | ||||||||||
| Medical Reportable Segments Member · Segment revenue (JPY) | — | — | — | — | — | — | 11B | 11.7B | 12.9B | 13.2B |
| ↳ YoY growth | +6.8% | +10.7% | +1.9% | |||||||
| Medical Reportable Segments Member · Segment operating income (JPY) | — | — | — | — | — | — | 2.08B | 1.99B | 2.43B | 1.47B |
| Reported | Jun 26, 2017 | Jun 27, 2018 | Jun 26, 2019 | Jun 26, 2020 | Jun 28, 2021 | Jun 27, 2022 | Jun 26, 2024 | Jun 26, 2024 | Jun 24, 2025 | Jun 24, 2026 |
Sign up to see institutional holdings
Sign UpPodcast Mentions
Sign up to see podcast mentions and sentiment
Sign UpTimely disclosures published on TDnet, newest first, titles as filed in Japanese. The link opens the disclosure on TDnet. Filings with EDINET (periodic reports, extraordinary reports, offerings, holding and buy-back reports), newest first, titles as filed in Japanese. The link opens the filing on EDINET. Press releases from the company's own website, newest first.
グンゼ株式会社(本社:大阪市北区、社長:岡 高広)と花王株式会社のサニタリー事業部(以下、花王)が共同開発した男性用軽失禁ブランド『SmaShee(スマシー)』が、『日経トレンディ』2026年12月号(2026年11月4日発売)の「2027年ヒット予測ベスト30」において15位に選出されるとともに、「アパレル部門大賞」を受賞いたしました。 本製品は、アパレル(下着)と日用品(吸水ケア)という異業種である両社の知見を持ち寄り、軽度の尿モレに悩みながらも、「専用品を使うのは抵抗がある」と対策を諦めていた男性たちのリアルな心理に向き合い、共同開発いたしました。今回の選出をさらなる原動力とし、今後もお客さまの豊かな暮らしに貢献する製品づくりに邁進してまいります。
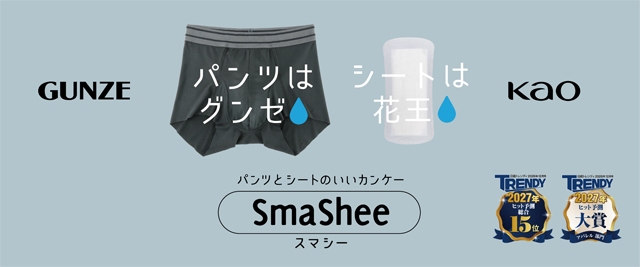
「日経トレンディ」の「2027年ヒット予測ベスト30」は、2026年から2027年にかけて登場する商品・サービス・施設などを対象に、今後のトレンドをランキング形式で紹介する毎年恒例の企画です。売上規模への期待に加え、これまでにない画期的な技術や着眼点、消費者の生活スタイルを変える可能性などが総合的に評価され選出されます。
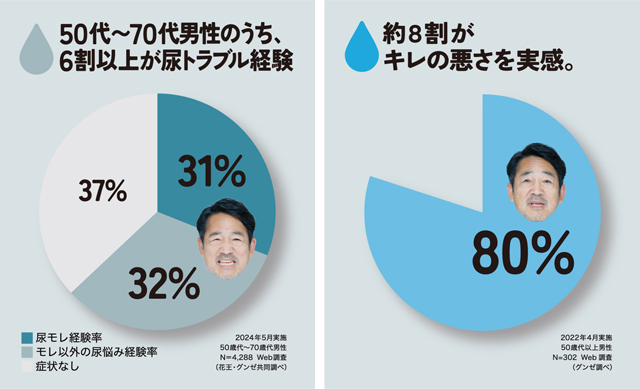
【市場調査から見えた男性特有の葛藤と未充足ニーズ】 排尿後の尿切れの悪さや微量な尿モレといったトラブルは、加齢に伴い多くの男性が直面する日常的な課題です。グンゼと花王が実施した共同調査(50歳~70代男性 n=4,288)では、50代~70代男性の6割以上が尿トラブルを経験していることが分かっています。 このように『コンプレックス市場』には非常に大きな潜在ニーズが存在するにもかかわらず、当事者の多くは既存の対策商品(吸水パッドや介護用下着)を使用せず、「下着にティッシュをあてる」などの自己流対策で我慢を重ねている実態が浮かび上がりました。 調査を深めると、既存商品に対してはシート着脱や持ち運びといった「物理的なハードル」に加え、専用品特有の見た目がもたらす心理的抵抗や「家族や周囲にバレたくない」といった「精神的なハードル」が極めて高いことが明らかになりました。その結果、多くの当事者が適切な対策に踏み切れず、日常の行動制限や諦めを強いられています。 この「誰にも相談できない葛藤」を和らげ、日常のスタイルを変えずにスマートにケアできる新たな解決策を提供するため、アパレル分野で快適な着心地を追求する「グンゼ」の独自技術と、高い吸水・消臭技術を持つ「花王」の技術を掛け合わせ、共同ブランド『SmaShee(スマシー)』の開発に至りました。
【『SmaShee』の製品特長】 新発売の『SmaShee ボクサーパンツ』は、花王『SmaShee吸水シート(吸収量20cc)』を内側の専用ポケットに入れる新発想「シートインポケット」構造を採用しました。フロント部分は安心の3層構造で、肌側のメッシュ(1層目)が水分を素早くシートへ通してサラサラ感を維持。さらに、吸水シートを挟んだ外側(2層目)には、水分を吸水しつつもズボンへのシミ出しを軽減する加工を施し、漏れ対策をサポート。外側(3層目)は身生地と同素材で通常の下着と同じ外観に仕上げました。 専用ポケットは着脱が簡単で、動いてもズレにくい設計です。3mmの薄型シートは着用時ゴワつかず、周囲に気づかれることなくスマートで快適な尿ジミ対策を実現します。
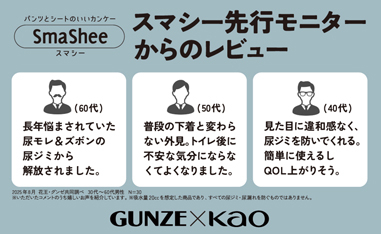
【発売前の先行試用モニター調査でお寄せいただいたお声】 開発段階で実施した先行モニター調査において、実際の生活シーンでご使用いただいたモニターの皆さまより、以下のような温かいご意見を頂戴しております。※いただいたコメントのうち嬉しいお声を紹介しています。
■開発プロジェクトリーダー コメント グンゼ株式会社 アパレルカンパニー MD戦略部 部長 武安 秀俊 「当事者が対策をためらう最大の要因は、深い葛藤や『高齢者の問題』という固定観念による心理的ハードルにありました。私たちは単に『尿モレを対策する』という機能的価値にとどまらず、『悩みを気にせず自分らしくいられる』という自己肯定感を取り戻すための情緒的価値までも提供したいと考えています。マイナスをゼロにするだけでなく、プラスの楽しさや自信を持っていただけるよう、これからの男性アンダーウェア市場における新たなスタンダードを目指して真摯に取り組んでまいります。」
花王株式会社 ハイジーン・リビングケア事業部門 サニタリー事業部 ブランドマネージャー 北村 充 「男性にとってサニタリー用品の使用は馴染みのない領域だからこそ、見た目も着心地もいつものパンツのままお使いいただける『シート in パンツ』を追求いたしました。これからの高齢化社会においてシニア市場は確実に拡大していきます。尿モレをスマートにケアするという新習慣を定着させることで、ケアは"恥ずかしい"ものではなく、アクティブに生きるための"自己投資"なのだとマインドを転換していただけるよう、今後も継続的な価値提案に努めてまいります。」
【商品概要】
| | |
| | 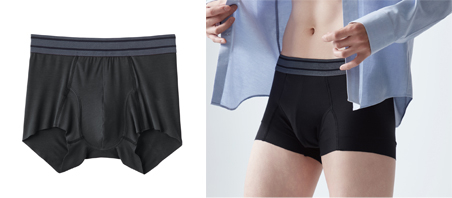 |
| 品名 | SmaShee ボクサーパンツ |
| 品番 | NK0080A |
| 希望小 売価格 | \2,860(税込) |
| サイズ | M/L/LL |
| カラー | ブラック、レッド、ネービーブルー |
| URL | https://x.gd/jF3gf |
| 発売地域 | Amazon限定発売 |
【商品特長】 《3つのこだわり設計》 ・専用ポケット構造:シートがズレにくい独自設計で、アクティブな動きにも対応。 ・3層構造:パンツのフロント部は3層構造でサラサラをキープ、外側へのシミ出しも防ぐ。 ・カットオフ®仕様:縫い目のごわつきを排除したカットオフ®生地により、着用感を極限まで高め、ズボンにもひびきにくい。
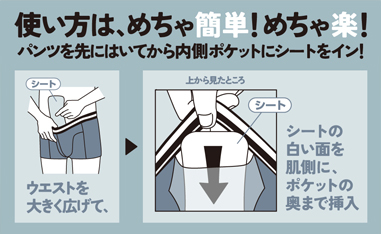
《使用方法》 SmaSheeボクサーパンツを先にはいてから、内側のシートインポケットにSmaShee専用シートをイン。シートの白い面を肌側に、ポケットの奥まで挿入。 ※専用シート使用後は、汚れた部分を内側にして丸め、衛生的に処理してください。 ※専用シート使用後、パンツに入れたまま洗濯しないようご注意ください。
《SmaSheeストアページ》 https://x.gd/jF3gf
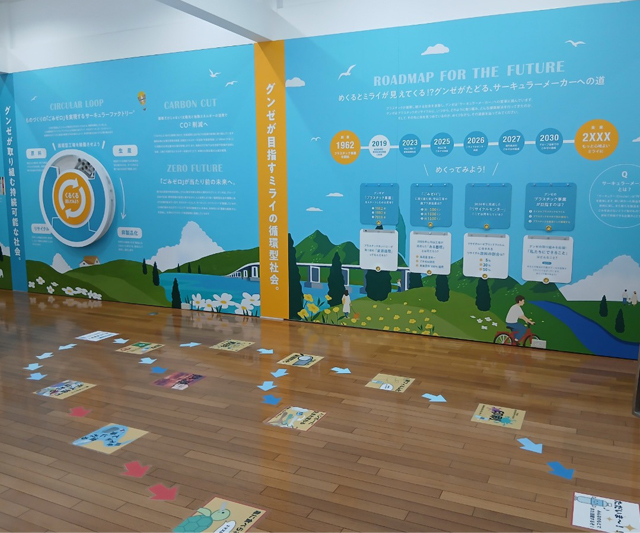 リニューアルした資源循環ロードマップとフロアーガイド
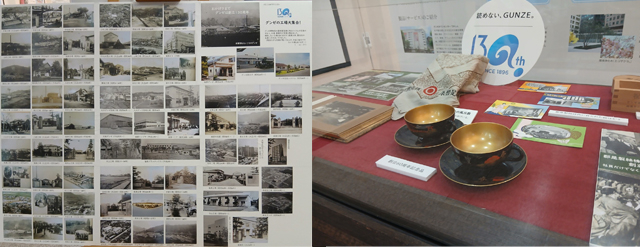 (写真左)全国の工場大集合
(写真右)周年記念行事写真および記念品
Prompts
Click prompts to add them under the company line, click again to take one out, then copy the result into your AI chat. Shared by Asian Century Stocks and Uncovered Thai Stocks. Thank you.
ETFs Holding Gunze Limited
Exchange-traded funds whose newest published daily portfolio holds one of the company's listings, largest weight first.
| ETF | Weight in ETF | Shares | Market value | As of |
|---|---|---|---|---|
| DISV | 0.05% | 90,300 | $ 2.451M | Nov 12, 2026 |
| DFIS | 0.04% | 93,600 | $ 2.54M | Nov 12, 2026 |
| AVDS | 0.03% | 4,600 | $ 126.108K | Nov 16, 2026 |
| DXIV | 0.02% | 1,800 | $ 48.856K | Nov 12, 2026 |
| AVSD | 0.02% | 2,100 | $ 57.571K | Nov 16, 2026 |
| AVDE | 0.01% | 40,700 | $ 1.116M | Nov 16, 2026 |
| DFIC | 0.01% | 41,200 | $ 1.118M | Nov 12, 2026 |
| DFAX | 0.01% | 32,000 | $ 868.543K | Nov 12, 2026 |
| DFAI | 0.00% | 22,400 | $ 607.98K | Nov 12, 2026 |