SRE Holdings Corporation FY2026 Q1 Financial Results Copyright 2026 SRE Holdings Corporation Securities Code: 2980 Copyright 2026 SRE Holdings Corporation FY2026 Q1 Financial Results Summary Financial Results (Same period last year) 4,240 → Net sales…
SRE Holdings Corporation
FY2026 Q1 Financial Results
Copyright 2026 SRE Holdings Corporation
Securities Code: 2980
Copyright 2026 SRE Holdings Corporation
FY2026 Q1 Financial Results Summary
Financial Results
(Same
period last
year)
4,240 →
Net sales
JPY 8,488
million
(+4,248)
Attributable to owners of parent
(Same
Profit
period last
year)
▲19 →
JPY 1,113
million
(+1,132)
(Same
period last
year)
92 →
Operating profit
JPY 1,812 (+1,720)
million
Dividend per share
JPY 20.0
Initial
plan
(Same
period last
year)
281 →
EBITDA
JPY 1,996
million
(+1,715)
ROE
Approx. 12%
Key Points
► Net
s a l e s : Net sales grew in both AI&LS and L&P, up +JPY 4.24 billion (+100.2%) YoY
► Operating profit : In addition to L&P property sales, growth in existing products and progress in AX lifted profit by
+JPY 1.72 billion YoY
► E B I T D A : In line with the expansion in operating profit, secured growth of +JPY 1.71 billion YoY
attributable to : Reversing the loss in the same period last year, returned to profit with a +JPY 1.13 billion
► Profit
owners of parent
increase
► D i v i d e n d p e r s h a r e : Maintained the initial plan of JPY 20.0 and continued the shareholder return policy
O
E : Through capital-efficiency-focused management, progressing steadily toward the initial plan of
► R
approximately 12%
Copyright 2026 SRE Holdings Corporation
2
Contents
1
Explanation of Segment Changes
P.4
2
FY2026 Q1 Financial Results
P.7
3
FY2026 Financial Forecast
P.15
REF
Overview of Our Businesses
P.26
Copyright 2026 SRE Holdings Corporation
Section
1
Explanation of Segment Changes
— A reorganization that unifies Real and Tech to strengthen the AI business —
Copyright 2026 SRE Holdings Corporation
1
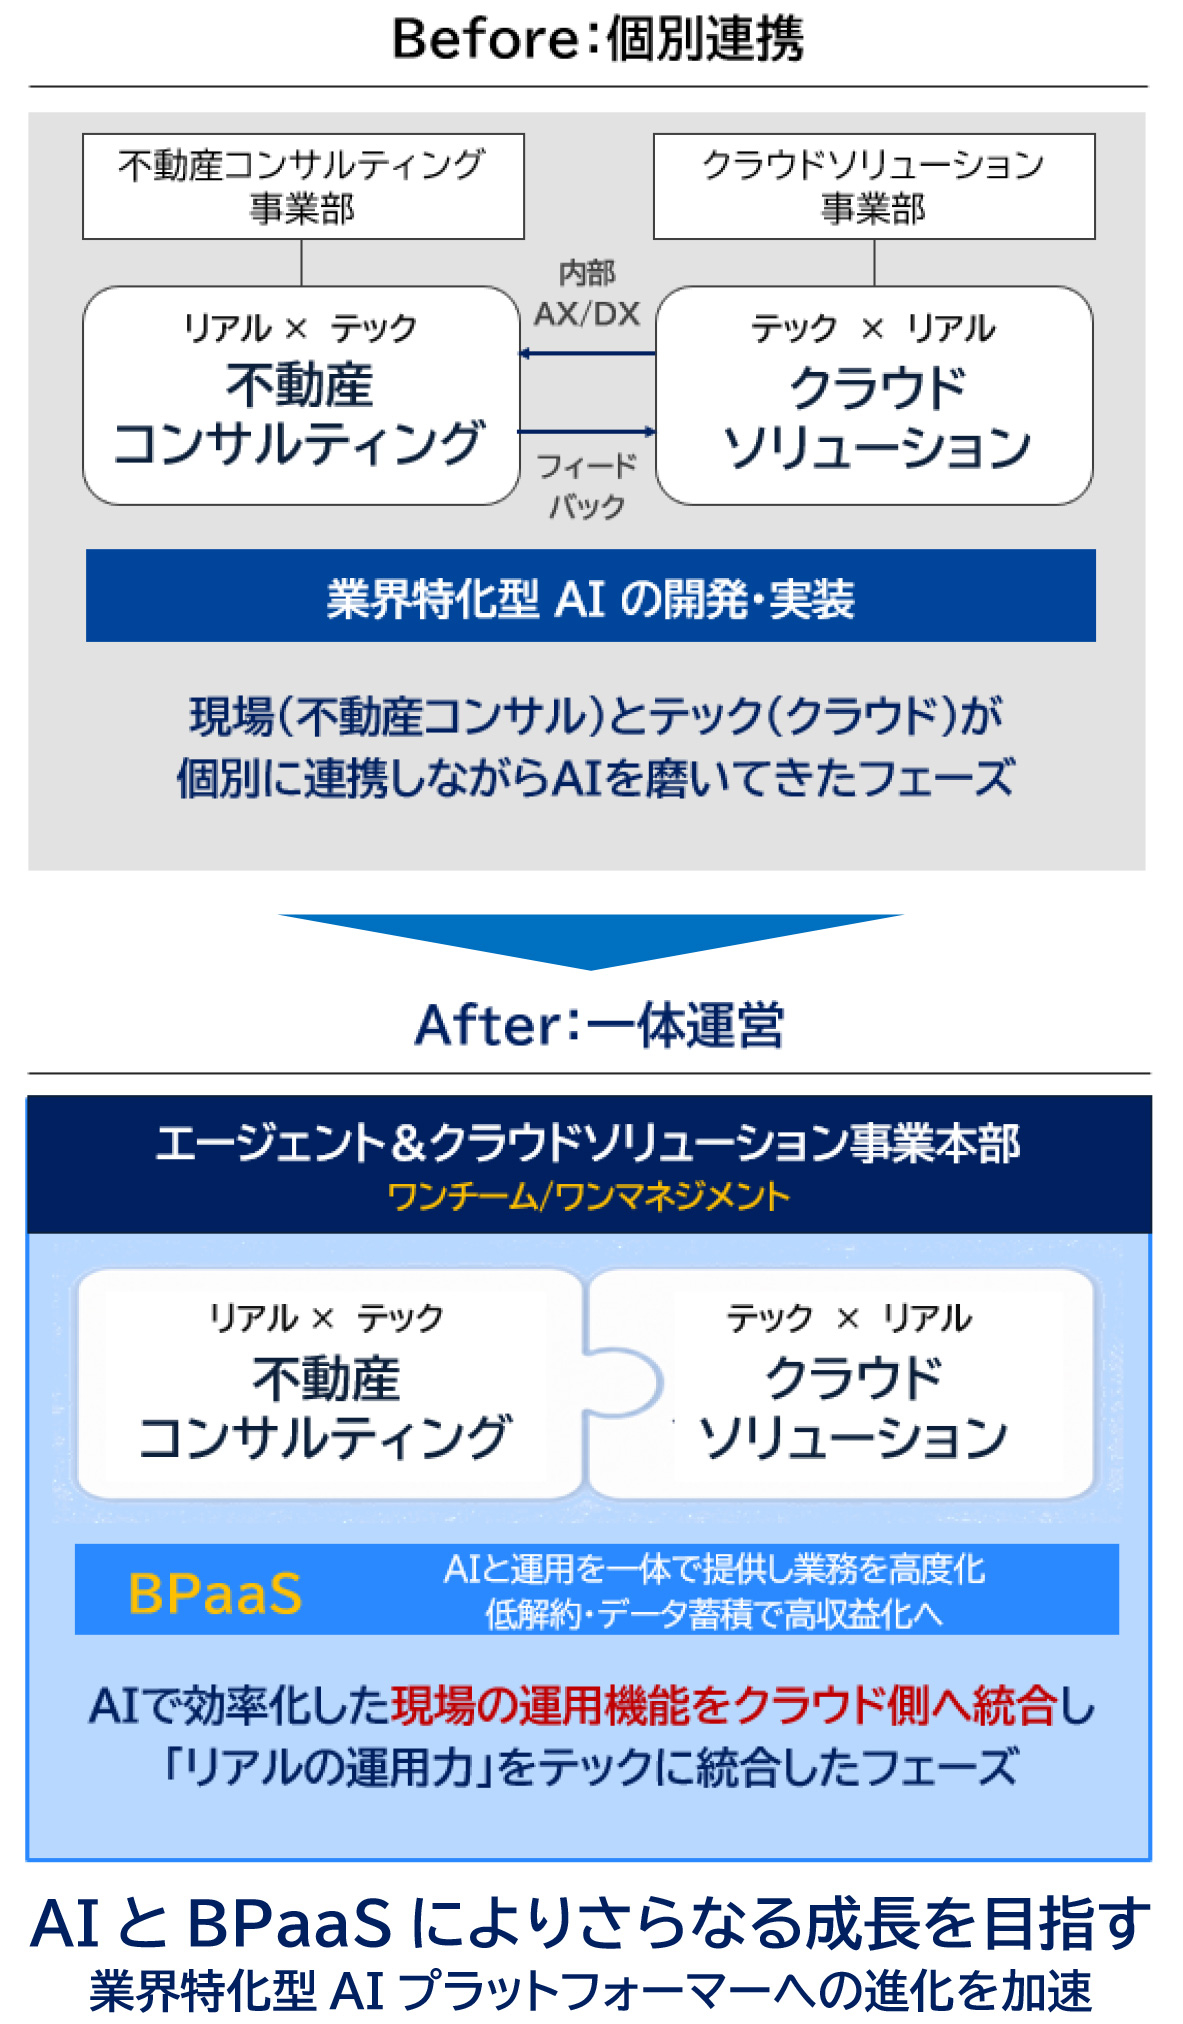
Organizational Changes to Drive BPaaS
Explanation of Segment Changes
The real estate consulting business and cloud solutions business were integrated, and the reportable segments
were also changed (same content as the press release announced on July 23, 2026 https://sre-group.co.jp/news/).
After: Integrated
operations
Before: Individual
coordination
Real Estate Consulting
Division
Real
Tech
Real estate
Consulting
Agent & Cloud Solutions Division
Cloud Solutions
Division
Internal
AX/DX
Feed
back
Tech
Real
One Team/One Management
2026.4.1
Integration
Real
Tech
Real estate
Consulting
Cloud
Solutions
Tech
Real
Cloud
Solutions
Delivering AI and operations as one to advance business processes
Development and implementation of industry-specific AI
BPaaS Toward higher profitability through low churn and data accumulation
The field (real estate consulting) and tech (cloud)
A phase of refining AI through individual coordination
Consolidating AI-streamlined field operations onto the cloud side
A phase integrating 'real-world operational capability' into tech
Accelerating our evolution into an industry-specific AI platformer aiming for
further growth, powered by both AI and BPaaS.
- The organizational changes took effect on April 1, 2026; the change in reportable segments applies from FY2026 Q1.
Copyright 2026 SRE Holdings Corporation
5
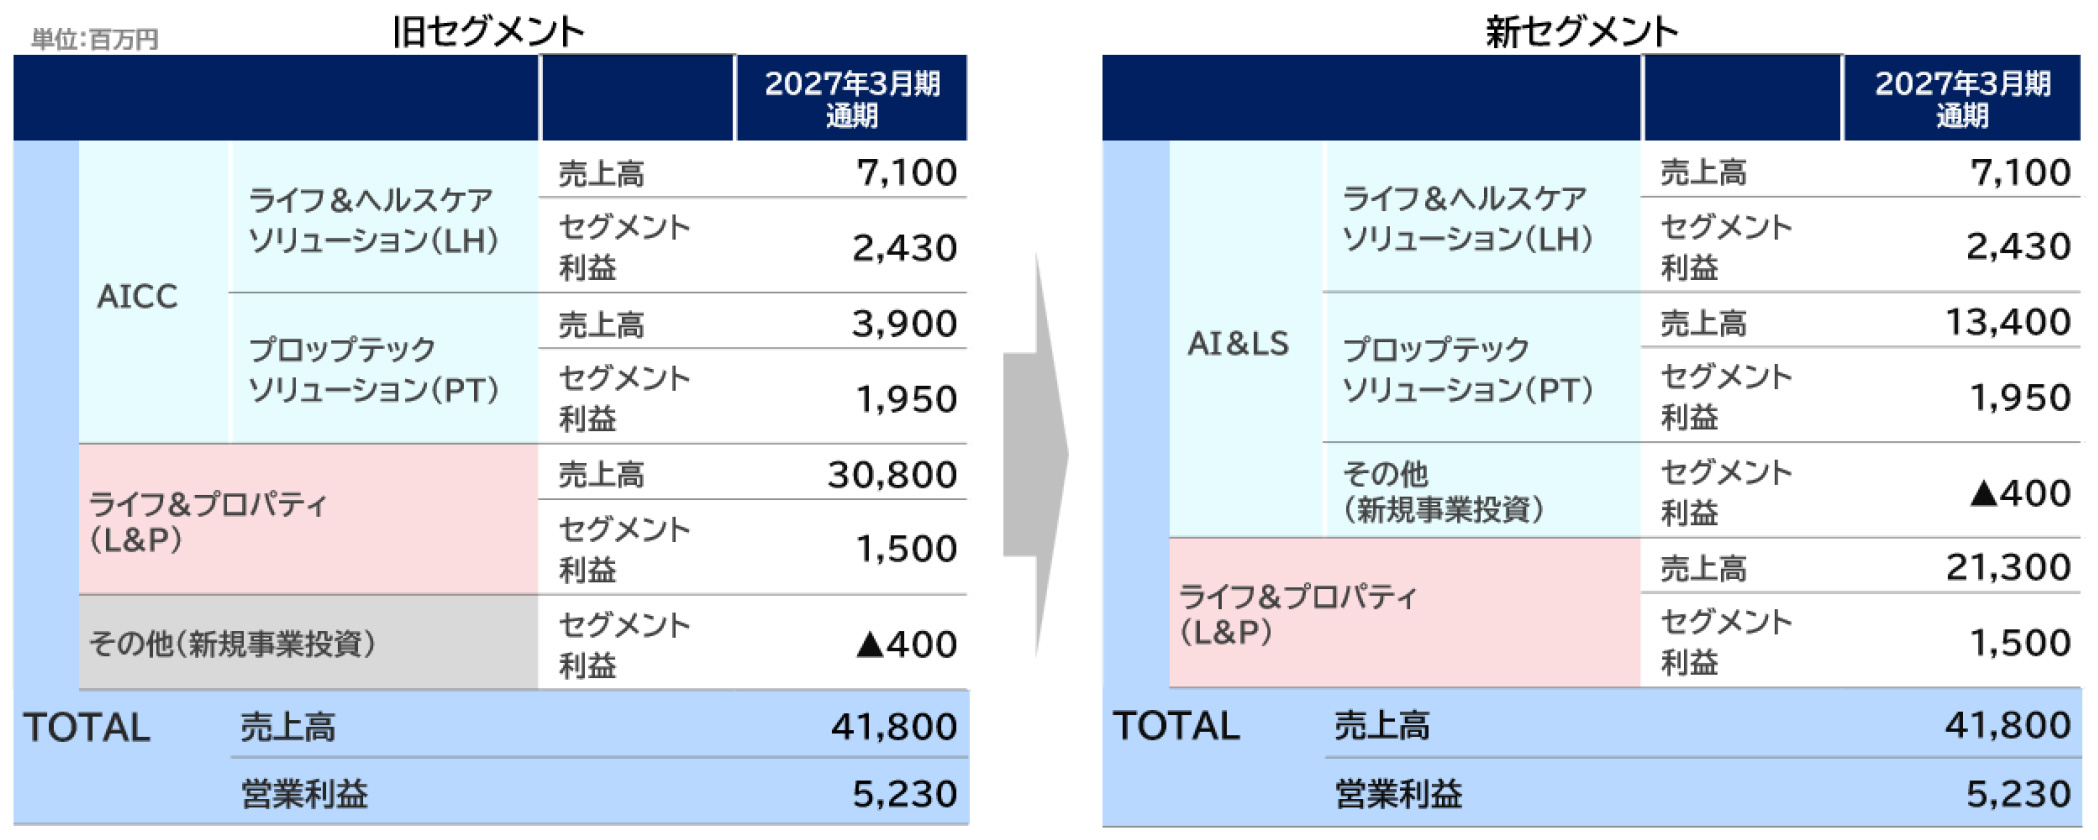
Full-year forecast before and after the segment change
Through strategic execution driven by the integration, AI&LS becomes an even greater growth driver for the
Company.
1
Explanation of Segment Changes
(JPY million)
Former segments
New segments
FY2026
Full year
Life &
Healthcare
Solutions (LH)
AICC
PropTech
Solutions (PT)
Life & Property Solutions
(L&P)
Other (New business
investment)
TOTAL
Net sales
FY2026
Full year
7,100
Segment
Profit
2,430
Net sales
3,900
Life &
Healthcare
Solutions (LH)
AI&LS
Segment
Profit
1,950
Net sales
30,800
PropTech
Solutions (PT)
Segment
Profit
1,500
Other
(New business
investment)
Segment
Profit
▲400
Life & Property Solutions
(L&P)
Net sales
41,800
Operating
profit
5,230
TOTAL
- Consolidated eliminations are not shown (▲250).
- AICC has been renamed AI&LS to reflect its expanded business scope.
- Former Other (New Business Investments) has been integrated into AI&LS.
- Reclassification affects net sales only for PT and L&P, with immaterial impact on profit (see P.17).
Net sales
7,100
Segment
Profit
2,430
Net sales
13,400
Segment
Profit
1,950
Segment
Profit
▲400
Net sales
21,300
Segment
Profit
1,500
Net sales
41,800
Operating profit
5,230
Copyright 2026 SRE Holdings Corporation
6
Section
2
FY2026 Q1 Results
(presented under the new segments)
Copyright 2026 SRE Holdings Corporation
2
Results Summary
FY2026 Q1 Financial Results
Progress in the existing PT and LH businesses and L&P's earnings contribution drove a
sharp profit increase and a return to profit, while AX builds a foundation for mid- to longterm growth.
(JPY million)
• Top line: The existing businesses of PT and LH (AI Home
Valuation, existing healthcare services, etc.) all progressed
steadily, and together with L&P property sales,
companywide net sales rose +100.2% YoY.
• Revenue and costs: In addition to higher sales in existing
businesses, progress in companywide AX helped efficiently
curb personnel and other costs versus the initial plan,
improving profitability. Operating profit rose sharply from
JPY 92 million a year earlier to JPY 1,812 million.
• Qualitative points: Companywide AX improved productivity,
advancing the shift to an earnings structure that can grow
while curbing headcount increases (see P.12, 13, 14). In
addition, by leveling out the timing of property sales, the
second-half weighting is expected to improve.
• We will continue to build a circular ecosystem linking L&P
and AI&LS (see P.20) through data obtained from
development real estate and AI implementation, aiming for
further growth.
FY2025
Q1
FY2026
Q1
YoY
% change
4,240
8,488
+100.2%
Operating profit
92
1,812
+1,869.6%
EBITDA
281
1,996
+610.3%
Ordinary profit
31
1,681
+5,322.6%
Profit
10
1,131
+11,210.0%
▲19
1,113
Net sales
Profit attributable
to owners of
parent
Copyright 2026 SRE Holdings Corporation
8
2
Segment Performance Overview
FY2026 Q1 Financial Results
In addition to higher sales and profit from L&P property sales, both AI&LS businesses
achieved net sales growth of over 40% and a sharp increase in profit.
(JPY million)
Life & Healthcare Solutions (LH)
FY2025
Q1
• New customer acquisition in the
healthcare domain and productivity gains
from AI implementation drove growth
across the overall business, lifting net
sales +40.4% and segment profit
+34.2%.
PropTech Solutions (PT)
• Flagship products such as AI Home
Valuation CLOUD performed solidly,
lifting net sales +42.4% and segment
profit +125.7%. Through the
organizational integration, we will refine
BPaaS around data that others cannot
obtain, driving further growth.
1,487
+40.4%
278
373
+34.2%
1,556
2,215
+42.4%
144
325
+125.7%
Net
sales
1,855
4,978
+168.3%
Segment
Profit
▲279
1,174
Net sales
4,240
8,488
+100.2%
Operating
profit
92
1,812
+1,869.6%
AI&LS
PropTech
Solutions (PT)
Life & Property Solutions
(L&P)
TOTAL
YoY
%
change
1,059
Life &
Healthcare
Solutions (LH)
Life & Property Solutions (L&P)
• Progress in property sales and
productivity gains from AI implementation
delivered a substantial return to profit.
• Progressing steadily toward achieving the
full-year budget.
Net
sales
FY2026
Q1
Segment
Profit
Net
sales
Segment
Profit
- Both net sales and profit are figures before elimination of intra-group and inter-segment transactions.
- Other within AI&LS is not shown.
- The total (TOTAL) is stated after consolidated eliminations.
- Inter-segment elimination differences are not shown (the difference of 192 in net sales and 60 in operating profit is due
to consolidated eliminations).
Copyright 2026 SRE Holdings Corporation
9
2
AI&LS Segment KPI Trends
FY2026 Q1 Financial Results
Contracts grew steadily in both LH and PT, steadily broadening the base for BPaaS expansion.
Life & Healthcare Solutions (LH)
Contracts progressed steadily, and ARPU
rose +24% YoY.
ARPU (JPY
thousand/month)
127
Contracts (LH)
155
133
• Contracts: New business development in the existing
healthcare business progressed steadily, up +54 QoQ.
• ARPU: Although ARPU declined slightly quarter on
quarter due to the mix of newly acquired deals, further
deal acquisition is in sight from Q2 onward, keeping us
on track against the full-year outlook.
2,426
2,221
2,249
2,289
1Q
2Q
3Q
• Contracts: In addition to the impact of the segment
change, steady progress in contracts for AI Home
Valuation and others drove an increase of 257 QoQ.
4Q
FY25
PropTech Solutions (PT)
Contracts grew significantly, led by AI
Home Valuation.
162
ARPU (JPY
thousand/month)
53
158
2,480
1Q
FY26
Contracts (PT)
58
62
62
4,950
5,279
4,795
5,100
1Q
2Q
3Q
4Q
72
5,536
• ARPU: With the addition of the real estate consulting
business accompanying the segment change, ARPU rose.
• The impact of the segment change is +100–200
contracts and approximately +JPY 10 thousand in ARPU.
FY25
- FY2026 reflects the impact of the segment change.
- For recurring income, the number of contracts at period-end is shown; for
transactional income, the total number of contracts during the period is shown.
1Q
FY26
Copyright 2026 SRE Holdings Corporation
10
2
FY2026 Q1 Financial Results
Category
Outlook against this year's guideline (GL)
Overall
LH
Operating
profit
AI&LS
PT
L&P
(Reference) Detailed Explanation of FY2026 Q1 Results
YoY
Against a full-year GL of JPY 5,230 million (+25.1% YoY), progress reached 34.6%,
tracking well. AI&LS combined progress was 16.1%, while L&P was front-loaded at
78.3% as property sales came earlier in the first half. High-margin growth in AI&LS,
productivity gains from AX (AI implementation), and stable earnings in L&P
advanced simultaneously, sharply improving Q1 profitability from last year's low level.
JPY 1,812 million (JPY 92 million a year earlier,
+1,869.6% / +JPY 1,720 million). All three
segments improved together, establishing a sharp
profit increase and a profitable trend.
[Healthcare growth engine] Against a full-year GL of JPY 2,430 million (+72.2%
YoY), progress reached 15.3%. Higher contracts and a rise in ARPU (+24.4% YoY)
grew both sales and profit. New deal acquisition is also in sight, and we continue to
aim to achieve the GL.
JPY 373 million (JPY 278 million a year earlier,
+34.2%). Higher contracts and a rising share of
high-ARPU contracts lifted profit.
[High-margin real estate tech SaaS + business integration] Against a full-year GL of
JPY 1,950 million (+123.6% YoY), progress reached 16.7%. Growth in contracts for
the flagship AI Home Valuation CLOUD led the way. The integration effects—BPaaS
transformation and AX-driven efficiency—are planned to contribute in earnest in the
second half.
[Stable base for dividend funding] Against a full-year GL of JPY 1,500 million
(▲24.6% YoY), progress reached 78.3%. Sales of high-quality properties sourced
through proprietary channels came earlier in the first half, generating stable
earnings. The planned profit decline reflects the reaction to last year's upside from
a specific property, among other factors.
JPY 325 million (JPY 144 million a year earlier,
+125.7%). Higher contracts and price revisions for
AI Home Valuation CLOUD were joined by earnings
contributions from the integrated real estate
consulting business.
JPY 1,174 million (▲JPY 279 million a year earlier;
return to profit / +JPY 1,453 million). Progress was
also made in leveling out the timing of property
sales, a previous challenge.
LH
Against a full-year GL (at year-end) of 2,996 contracts, Q1-end stood at 2,480.
Steady organic accumulation not reliant on large deals (+54 QoQ), with new deal
acquisition in sight from Q2 onward, makes the full-year outlook well within reach.
+11.7% (2,221 → 2,480 contracts YoY). Led by new
business development in existing healthcare.
PT
Against a full-year GL (at year-end) of 5,671 contracts (+392 vs. prior year-end),
Q1-end stood at 5,536 (+257 QoQ, of which +100–200 from the segment change).
Excluding the segment change, progress remains solid.
+15.5% (4,795 → 5,536 contracts YoY). Led by AI
Home Valuation CLOUD. Includes +100–200 from
the segment change.
LH
Against a full-year GL of JPY 185 thousand/month (Q4 average at year-end), Q1 was
JPY 158 thousand/month (including MEDIX). Although ARPU declined slightly
quarter on quarter due to the mix of acquired deals, new deal acquisition is in sight
from Q2 onward, making the full-year outlook well within reach.
+24.4% (JPY 127 → 158 thousand/month YoY).
A rising share of high-ARPU contracts.
PT
Q1 actual of JPY 72 thousand/month (of which approximately JPY 10 thousand from
the segment change/reclassification; JPY 62 thousand/month on a like-for-like
basis). Although the full-year GL of JPY 71 thousand/month has already been
achieved, the segment-change effect is significant, so we aim for further
improvement.
+35.8% (JPY 53 → 72 thousand/month YoY). In
addition to the effect of the previous fiscal year's
price increase, approximately JPY 10 thousand is
from the reclassification.
Number of
contracts
ARPU
Copyright 2026 SRE Holdings Corporation
11
2
Growth Strategy: Promoting AX
FY2026 Q1 Financial Results
Implementing generative AI companywide and promoting AX under CEO leadership,
delivering results across three areas: top-line growth, BPaaS development, and cost efficiency.
Companywide AI implementation and CEO
commitment
Completed companywide AI
implementation
⚫ Adopted seven types* of
generative AI tools
⚫ Completed building a structure to
promote AX (AI implementation)
across the entire company
Committed to promoting AX under CEO
leadership
⚫ The CEO drives it hands-on each
organizational head also takes the
lead in promoting AX
⚫ Headquarters directs each
business unit on the expected
impact of AI tools, driving
productivity gains through
frontline AI adoption.
① Top-line growth:
Validated results of AX-driven top-line growth
⚫ Since our founding business, we have used technology to develop
products and services within our own real-world operations, and
we have likewise conducted various validations of AX.
⚫ As a result, we achieved an approximately 20% increase in the top
line during the validation period (assuming other parameters held
constant).
② BPaaS:
Internal AX also enabled BPaaS service development
⚫ Based on real estate–specific training data, we achieved results in
developing highly efficient AI agents and automating operations.
⚫ We aim to roll this out as one of the service offerings in our future
BPaaS lineup.
③ Boosting the bottom line through cost efficiency:
reflected in the medium-term business plan
⚫ Productivity gains in middle-office, back-office, and development
operations are being reflected in the medium-term plan.
⚫ In the division where the effect was greatest, we expect to cut
hiring and personnel costs by 20% versus the previous plan.
- Adopted Claude, ChatGPT, Gemini, Genspark, Notion, NotebookLM, and Copilot.
Copyright 2026 SRE Holdings Corporation
12
2
Growth Strategy: Validation Progress of AI Agents
(AI Sales Productivity Platform)
FY2026 Q1 Financial Results
Validation of the real estate AI agent confirmed +20% sales and +30% operating profit;
expanding into BPaaS.
Real Estate AI Agent
Validation Result ①
Directly linked to improved
frontline productivity
AI agent
Sales funnel
1
Inquiries
Learning tacit knowledge and internal
materials to standardize pre-meeting
issue framing and talk-track design
2
Learning from deal evaluations
Automatically generating evaluations
and improvement instructions from
recordings based on proprietary criteria
Brokerage
Closing
Approx.
1.2×
The visit-to-brokerage rate
improved approximately 1.2×,
ultimately increasing the number of
contracts.
Validation Result ②
3
Sales
+20%
Visits
Standardizing sales activities
Results
Personnel costs
▲10%
Operating profit
+30%
Talent development portal
Centrally managing logs and analyzing
the correlation between usage and
sales performance (productivity)
Through higher productivity per
employee Curbing additional hiring
Frontline productivity improved,
increasing both sales and
operating profit.
'Real-world know-how' → 'convert to AI and implement internally (productivity gains)’
→ 'external sales' is our winning formula.
- Inquiries = customer inquiries; Visits = appraisals and meetings; Brokerage = brokerage agreements.
Copyright 2026 SRE Holdings Corporation
- Visit-to-brokerage rate = Brokerage ÷ Visits.
- '~1.2×' vs. Apr. 2026.
- Results are compared with the initial plan. Impact on current-period results is minimal, as reflected in the full-year forecast.
13
2
Growth Strategy: Updating Real Estate Business Workflows
with Generative AI
FY2026 Q1 Financial Results
Fundamentally improving middle-office operations through AX/DX, curbing personnel and
hiring costs via productivity gains and operational efficiency.
AX/DX Initiative Examples
Case 1: Transformation into an AI-collaborative organization
Instructions and
review
AI Deputy
General Manager
General
Manager
Introduced an AI Deputy General Manager and AI agents as partners to
the General Manager. AI takes over the work of four people—such as
creating materials, drafting manuals, and checking documents—building
a workflow in which a single General Manager can handle the work of
five.
Effect
5× productivity
AI agent
Case 2: Automated drafting and revision of contracts
An AI agent trained on past contract know-how automates the drafting
of contracts for each property and the revision of counterparties' drafts,
halving the related work. It is planned to be incorporated as one of the
BPaaS services offered.
Sales contract
AI agent
Contract
Effect
Past contracts
- Labor-reduction rates and case counts are internally measured and have not been verified by a third party
(based on cases shared during the ~2-month trial period).
- Results are based on the required middle-office headcount in the target department.
50% operational
efficiency gain
Copyright 2026 SRE Holdings Corporation
14
Section
3
FY2026 Financial Forecast
(Reprinted from the financial results materials announced on May 13, 2026
with partial changes to the new segment presentation)
Copyright 2026 SRE Holdings Corporation
3
Summary of Financial Forecast
FY2026 Financial Forecast
Despite executing 0.4 billion yen in strategic reinvestment, we expect to achieve record
highs across all profit levels, driven by growth in our core business.
(JPY million)
• Net sales- Strong growth driven by
industry-specific AI in AI&LS,
combined with stable growth in L&P, is
expected to deliver solid top-line
growth of +27.2% YoY.
• Operating profit- Even after strategic
reinvestment for next-generation AI
operations, operating profit is forecast
to exceed 5.2 billion yen, marking the
establishment of a sustainable
high-profit phase- Underlying
operating profit growth was +38%,
excluding strategic investments and
buffers
• Profit attributable to owners of parent
/ Dividend
- Excluding prior-year one-off restructuring losses,
FY2026
(Forecast)
YoY
32,858
41,800
+27.2%
Operating profit
4,180
5,230
+25.1%
EBITDA
4,964
6,150
+23.9%
Ordinary profit
3,841
4,500
+17.2%
Profit attributable
to owners of parent
1,840
2,830
+53.8%
FY2025
Net sales
net profit is expected to reach 2.83 billion yen in
Dividend
FY2026, supported by strong underlying earnings.
20.0 yen per share
(forecast)
Copyright 2026 SRE Holdings Corporation
16
3
Performance Guidance by New Segment
FY2026 Financial Forecast
Growth in AI&LS's existing businesses and accelerated AI utilization are
expected to drive +25% growth in companywide operating profit.
(JPY million)
Life & Healthcare Solutions (LH)
FY2025
Full year
• New customer acquisition in the existing healthcare
business and productivity gains from AI
implementation are expected to drive growth across
the overall business, lifting net sales +37.3% and
profit +72.2%.
Life &
Healthcare
Solutions (LH)
PropTech Solutions (PT)
• In addition to solid performance of flagship products
such as AI Home Valuation CLOUD, AX promotion
driven by the business integration and associated
productivity gains are expected to lift net sales
+56.3% and profit +123.6%—a substantial increase,
as with LH.
Life & Property Solutions (L&P)
• The outlook is for a profit decline, reflecting the
reaction to last year's profit upside from a specific
property, among other factors. Inventory levels are
being controlled to a similar level at Q1-end as at the
previous fiscal year-end.
AI&LS
PropTech
Solutions (PT)
Life & Property
Solutions (L&P)
TOTAL
FY2026
Full year
YoY
%
change
Net
sales
5,173
7,100 +37.3%
Segment
Profit
1,411
2,430 +72.2%
Net
sales
8,572
13,400 +56.3%
Segment
Profit
Net
sales
Segment
Profit
872
1,950
+123.6%
20,100
21,300
+6.0%
1,988
1,500 ▲24.6%
Net sales
32,858
41,800 +27.2%
Operating
profit
4,180
5,230
+25.1%
- The FY2026 forecast for the AI & Life Solutions segment does not include figures from future M&A in net sales/segment profit Copyright 2026 SRE Holdings Corporation
- Before elimination of intra-group and inter-segment transactions. Note that the performance breakdown is unaudited.
- Other (New Business Investment) within AI&LS is not shown.
- The total amount is stated after consolidated eliminations.
- FY2025 figures are reference values restated under the new segment classification
17
3
KPI Guidance for AICC Segment
FY2026 Financial Forecast
Rising ARPU and an expanding customer base increase the certainty of recurring
revenue growth.
Life & Healthcare Solutions (LH)
Life & Healthcare Solutions (LH)
Sustained ARPU Growth Through Value-Added Services
ARPU*1
(Q4 basis)
162,000
+23,000
• Average pricing rises step by step, driven by an increase in
large-scale contracts with client organizations
Steady Expansion of the Customer Base
Contracts*2,3
• Expanded service delivery and a growing track record
support steady client growth.
(as of yearend)
2,996
2,426
+570
FY2025
Prop Tech Solutions (PT)
Higher unit pricing driven by BPaaS offerings
• Deeper integration of real-world operations and technology
following organizational restructuring is driving higher
service value and pricing.
Customer Base Expansion Accompanied by Market Share
Gains
• We expect a disciplined increase of 392 client companies,
prioritizing cost efficiency amid rapid generative AI adoption.
185,000
FY2026
Prop Tech Solutions (PT)
ARPU *1
(Q4 basis)
62,000
+9,000
71,000
+392
5,671
Contracts*2,3
(as of yearend)
5,279
FY2025
*1 No-fee contracts during the initial campaign period are excluded from the number of contracts at the end of the month.
*2 ARPU is calculated by dividing the average monthly recurring revenue of Q4 (January–March) by the average number of
contracts during the same quarter.
*3 The KPIs for LH include figures that incorporate Medix
FY2026
Copyright 2026 SRE Holdings Corporation
18
3
FY2026 Financial Forecast
Development
Projects
(Reference) Expected Sale Timing of Key Development Projects
FY26
1H
FY27
2H
1H
FY28
2H
1H
2H
Umeda Project
Meidaimae Project
Takaido Project
Fuchu Project
Maizuru Project
Fukuzumi Project
Komagome
Project
Haruyoshi Project
Nagoya Station
Project
Kameido Project
Shibuya Honmachi
Project
- As these are current projections, the schedule is subject to change.
Copyright 2026 SRE Holdings Corporation
19
3
Growth Strategy: A Platform Company Circulating Value Centered
on Industry-Specific AI
FY2026 Financial Forecast
A defensible ecosystem in which proprietary primary data from real-world operations
continuously enhances AI, driving a highly profitable BPaaS business
Proprietary data build-up /
algorithm improvement
Life & Property Solutions
(L&P)
External
sales
Primary
data
Real Estate
Development
Development
Revenue-generating
real-world business and AI
validation field
Collaboration
Sony Group
Alliance
Data
acquisition
AI
Development
IndustryAI
specific
Enhancement
Field
AI Implementation
Planning
and
Proposal
Sony Life Insurance
AI & Life Solutions
(AI&LS)
Life & Healthcare
(LH)
PropTech
(PT)
High-margin BPaaS &
consulting sales
Data
Accumulation
Sony Group
Data
feedback loop
Joint
development
and solution
delivery
Sony Music Entertainment
Copyright 2026 SRE Holdings Corporation
20
3
Growth Strategy: Efficient Property Development
through Strategic Alliances
FY2026 Financial Forecast
Differentiated property value through Sony Group alliances and in-house networks
SRE Holdings
1
Information Sharing
with Life Planners
Sony Life Insurance
◆ Life Planners: Over 2,000
◆ Subscribers: Over 4 Million
3
Industry-Specific
AI Technology
Proprietary Network
for Real Estate
Development and
Brokerage
◆ Disposition to Real Estate
Funds
Operational Data
Analysis &
4
Optimization
Identification and
2
Development of
High-Quality Properties
Efficient Customer Matching
via Alliance Network
Asset-Light
Senior
Residences
Sourcing,
Development
and Operations
Collaboration with Sony Life Insurance is limited to information provision and customer referrals in compliance
with applicable laws and regulations.
Sony Life Insurance is not the principal in real estate development.
5
◆ Stable Earnings from
Management Fees
Disposition to
Funds for Recurring
Revenue
Copyright 2026 SRE Holdings Corporation
21
3
Growth Strategy: Medium-term Profitability
FY2026 Financial Forecast
Driving mid- to long-term profitability through next-generation AI operations.
Operating Profit Outlook
(JPY billions)
5.78
1
2
3
1
Risk Buffer
(JPY 0.15 billion)
4
5
• Investment in tech talent capable of combining advanced AI models to
fundamentally reengineer legacy industry processes (BPR).
5.23
2
4.18
Growth Rate
38%
Top Talent Acquisition (JPY 0.12 billion)
Acquisition of CTO and FDE* Talent
Healthcare/AI&LS (JPY 0.1 billion)
Building AI-Enabled Operations
• BPaaS team achieves non-linear scale and high margins using advanced
AI agents, without reliance on hospital systems.
Strategic Reinvestment
(JPY 0.4 billion)
3
From building systems to
leveraging AI effectively
Real Estate Brokerage / L&P (JPY 0.1 billion)
BPaaS Transformation of Real Estate Operations
• Building a BPaaS service for end-to-end implementation and operation
of real estate–specific AI.
4
Physical AI Initiatives (JPY 0.08 billion)
Next-Generation Real-World Data Platform
• Advancing real-world AI validation beyond software to build a first-party
data foundation for the next-generation platform.
5
If investments are delayed or risks do not materialize,
operating profit may see short-term upside.
Geopolitical Risk Impact (Buffer) (JPY 0.15 billion)
• Potential delays to L&P development projects due to material
procurement disruptions from a Strait of Hormuz closure.
- FDE(Forward Deployed Engineer): Engineer responsible for on-site implementation, ensuring AI and
systems are fully deployable in customer operations.
Copyright 2026 SRE Holdings Corporation
22
3
FY2026 Financial Forecast
Growth Strategy: BPaaS Architecture and Our Strengths
A fully integrated “real-world operations × AI” model that goes beyond simple
IT services, enabling a highly defensible BPaaS offering
BPaaS Architecture (Industry Structure)
Layer 1
Provided in-house
BPaaS Operations
(Technology-enabled business operations outsourcing)
Healthcare BPO and real estate processes executed using AI +
human resources.
Layer 2
SRE’s Strengths
In-house development
Our Domain
AI Cloud (Industry-Specific Tools)
Real-world
operations
Accumulating know-how and
expertise through in-house
operations
Utilized internally and offered externally for real estate AI valuation
and healthcare operations management tools.
Layer 3
Shared Platform
AI Agents / Automation Engine
Embed AI into each step of operations to automate workflows.
Layer 4
AI Infrastructure
Industry-Specific AI (Core: AI tuning)
Fine-tuning Gemini, ChatGPT, and Claude using proprietary data for
internal use.
Layer 5
Cloud Infrastructure
AI / Technology
In-house development of AI tools,
for internal use and external
commercialization
External sourcing
Utilizing AWS, Azure, GCP, and other cloud platforms, with no direct
investment by the Company, focusing solely on cost management.
As ARR is a SaaS metric limited to Layer 2 (AI Cloud), it does not adequately capture the
performance of our BPaaS architecture, which encompasses BPO and AI agents. We will
discontinue its disclosure from this fiscal year and transition to a KPI framework that more
accurately represents our business model.
Copyright 2026 SRE Holdings Corporation
23
3
FY2026 Financial Forecast
Growth Strategy : M&A, PMI / Value up
Our M&A strategy is characterized by a unique growth engine: post-acquisition, we transplant
our proprietary revenue model to transform acquired businesses into highly profitable
operations
M&A target areas
- Target: Beyond core domains with proven AI ×
real-world operations, expanding into adjacent
and new domains
• Precisely selecting target industries based on deep
operational insight and primary data
- Winning Formula: Phased rollout of our proven
Core domains
(proven expertise)
Adjacent / new domains
(mid-term entry)
Real Estate
HR Tech
Healthcare
Security
Lifecare
Robotics
IT
Other
revenue model
• Improving revenue during PMI by implementing
our operating model and technology
PMI Process for Transferring the Revenue Model
- Value Creation: Value creation at acquired
companies via revenue model transfer
• Bringing acquired companies’ revenue to our level
through BPaaS deployment
M&A
Execution
Deployment
Operational
of
Process
Management
Redesign
Talent
Implementing
our model
Revenue Structure
Improvement
Copyright 2026 SRE Holdings Corporation
24
3
FY2026 Financial Forecast
Strengthening Group’s Profitability in Mid-Term
Medium-Term Profit Growth Outlook
Accelerating growth through a BPaaS shift
• Expanding core businesses and creating new value
through a BPaaS shift aligned with AI advancement.
New Business Areas (Robotics / HR Tech, etc.)
Profit growth through BPaaS / AI Operations
AI&LS LH
Strategic
Investment
JPY 0.4 billion
AI&LS PT
L&P
Strategic investment in AI is essential
for future survival and growth
• Timely investment in talent, infrastructure, and new
business areas is the key priority to secure
competitiveness in the BPaaS era and drive mid- to
long-term growth.
Expanding corporate value through core growth
and new initiatives
• Expanding new business areas while driving growth in
L&P and AI&LS to achieve sustainable profit growth
and enhance corporate value.
FY21
FY22
FY23
FY24
FY25
FY26
FY27
FY28
Results
Results
Results
Results
Results
Guidance
Image
Mid-term
view
Copyright 2026 SRE Holdings Corporation
25
Section
REF
Overview of Our Businesses
•
(Reprinted from the financial results materials announced on May 13, 2026
• with partial changes to the new segment presentation)
Copyright 2026 SRE Holdings Corporation
REF
History of SRE Holdings from its Founding
Overview of Our Businesses
History
An industry-focused LifeTech company
that integrates real-world businesses,
delivering an end-to-end AI × Operational
Step
01
Support (BPO & Consulting) model in the
real estate, healthcare, and finance
domains by leveraging the Sony Group’s
Step
02
Real Estate business utilizing technology(=Real Estate tech company)
April 2014
October 2015
Sony Real Estate established
Real Estate valuation engine utilizing AI developed
Start of sales of AI SaaS solutions to external customers following
improvement of UI/UX in internal "real business" operations
October 2018
SRE AI Partners established, starting partnerships
with financial institutions
June 2019
Name changed to SRE Holdings
December 2019 Listed on TSE Mothers market
expertise.
Expansion of AI SaaS incorporating "real business"
Outline
Step
Established/
IPO
Established: April 2014
IPO: December 2019
Major
Shareholders
Sony Group Corporation(23%)
Client Base
Staff
03
Expansion of our business domain into the healthcare sector to
become a Life Tech Company
Exceeding 6,000 Companies
Step
(Real Estate, Healthcare, and Finance)
04
533
December 2020 Listing switched to TSE 1st section
June 2021
Selected for the DX Grand Prix 2021 / DX Stocks 2021
April 2022
Listing switched to TSE Prime
October 2023
April 2024
April 2025
From 2026
Began offering DX solutions for medical and welfarefacilities
Acquired MEDIX Co., Ltd., to expand healthcare solutions
Strengthening industry-specific AI and accelerating M&A into
new business areas (e.g., Life Care)
Scaling across the full life stage by vertically integrating
industry-specific AI and BPaaS
- Number of officers and employees includes seconded and contract/temporary staff (as of Mar 31, 2026).
Copyright 2026 SRE Holdings Corporation
27
REF
Overview of Our Businesses
Turning social challenges into growth opportunities
Addressing labor and healthcare challenges
through Real × Technology
Population Distribution
by Age Group (10,000 persons)
Amid population decline and aging,
labor shortages and healthcare /
inheritance needs continue to expand.
100-
Male
Female
90
DX and
Growing healthy
operational
longevity needs
support for
/ Healthcare
healthcare and
system strain
nursing care
Growing elderly
population80
(healthcare
& inheritance)
Leveraging Real × Technology expertise
Social Challenges
70
built in real estate, we extend into
healthcare and finance to turn social
60
challenges into growth opportunities.
sharp decline in
50population
working-age
(labor shortages)
Inheritance,
Asset liquidity
succession,
and succession
and retirement
support
funding
through
concerns
technology
40
Labor
shortages
across a wide
range of
industries
30
20
AI × Real
Our Solutions
(Value
Proposition)
Efficiency and
automation
through AI &
BPaaS
10
to Solve Social Challenges
0
1000
500
0
0
500
- Calculated by our company based on the population pyramid data from the National Institute of
Population and Social Security Research
1000
Copyright 2026 SRE Holdings Corporation
28
REF
Overview of SREHD's Businesses
Overview of Our Businesses
A Life Tech Company Combining Real-World Operations and Technology Across Real Estate
and Healthcare
Business Overview
Solutions
AI&
Life
Solution
s
(AI&LS)
Life &
Healthcare
Solutions
(LH)
PropTech
Solutions
(PT)
Life & Property
Solutions
Solutions
(L&P)
• BPaaS for medical and
welfare facilities
• Provision of business support
systems
• Real estate business support
cloud
(AI Home Valuation CLOUD, MK
CLOUD, Rent Valuation CLOUD, etc.)
Main Target
• Medical/Welfare: ~100k
• Treatment Clinics
(Osteopathy/acupuncture,
etc.): ~ 150k
• Financial Institutions: ~
1,080*1
• Real Estate Brokers: ~130k*2
• (toC): Home buyers/sellers
• Brokerage utilizing technology
• Development of healthcare
facilities, etc.
• Development aimed at expanding
fund AUM
• Development of AI Solutions for
Operational Improvement
Revenue Model
Recurring income
(Recurring contract)
Transactional income
(Consulting fee)
Recurring income
(Fund management
fees)
• (toB): Institutions / Funds /
Operating Companies
Source: *1 Prepared by the Company based on the Financial Services Agency's 'List of
Licensed/Authorized/Registered Operators (Deposit-Taking Financial Institutions).'
*2 Ministry of Land, Infrastructure, Transport and Tourism, 'FY2024 Survey Results on the Enforcement
Status of the Building Lots and Buildings Transaction Business Act.'
Transactional income
(Sales of
development
properties)
Copyright 2026 SRE Holdings Corporation
29
REF
AI&LS BPaaS Model
Overview of Our Businesses
SRE’s BPaaS drives customer growth and stable recurring revenue by reducing on-site burden.
① Structural Challenge
Implementation image
Due to chronic labor shortages and a lack of
specialized expertise, many facilities find it difficult
to independently introduce and operate AI solutions.
Before
customer
After
customer
Data
② SRE’s Support
Our SRE team takes responsibility for these functions,
driving operational support and productivity
improvements
SRE
③ Customer Impact
Staff can focus on their core operations, while
back-office functions are operated under our
Support
leadership through a BPO × SaaS model
AI
④ SRE Advantage
Higher operational dependency results in lower churn
AI-driven cost optimization improves margins
Facing labor shortages
and insufficient IT
utilization
SRE-led execution of back-office
support and AI implementation
Copyright 2026 SRE Holdings Corporation
30
REF
AI&LS Product Track Record
Overview of Our Businesses
Advanced AI powered by primary data delivers dramatic time savings and eliminates
key-person dependency. Adoption is expanding among financial institutions.
Before
After
Selecting and assessing similar
case by professionals
Leveraging vast primary data accumulated
through real-world operations, our AI
AI automation enables coverage
by junior and back-office staff.
Task
Overview
performs real estate valuations with high
accuracy in a fraction of the time.
By standardizing previously
More time for sales → higher revenue.
person-dependent valuation work, we
180
achieve both step-change operational
efficiency and improved accuracy.
Task
Time*1
rapidly—primarily among enterprise clients,
from real estate companies to major
min
Fewer valuation errors, fewer complaints
With a low implementation hurdle and
strong ROI, adoption is accelerating
5
Appraisal
Error
Rate*2
9~10%
5.6%
financial institutions (banks and insurers).
*1 Actual values measured in our operations
*2 The appraisal error rate is the median deviation between the valuation results by our agents or by AI
Home Valuation CLOUD and the actual transaction price for condominiums in the 23 wards of Tokyo (as
of December 2024).
Copyright 2026 SRE Holdings Corporation
31
REF
Average monthly churn rate
Overview of Our Businesses
Although we raised prices on real estate AI products last fiscal year, the rise in the churn
rate was limited.
New acquisitions are also progressing steadily, contributing to higher AI&LS sales.
Average monthly churn rate over the last 12 months
Implementing substantial price increases in phases
0.7%
0.6%
2023
Jun
2023
Sep
⚫
Our
competitive
advantages
⚫
0.5%
2023
Dec
0.4%
0.4%
2024
Mar
2024
Jun
0.3%
0.3%
2024
Sep
2024
Dec
0.4%
0.4%
0.4%
0.4%
2025
Mar
2025
Jun
2025
Sep
2025
Dec
0.5%
2026
Mar
0.6%
2026
Jun
Continuously enhancing added value through our unique data ecosystem
Leveraging the knowledge and data accumulated through technology
implementation and systemization of operations held within the Group to develop
solutions
- The average over the past 12 months of the monthly churn rate for real estate–related clouds,
calculated as the number of cancellations in the given month divided by the cumulative number of
contracts at the end of the previous month.
Copyright 2026 SRE Holdings Corporation
32
REF
Financial Track Record (FY2018–FY2026 (Forecast))
Overview of Our Businesses
2
Net sales (consolidated)
Operating profit (consolidated)
(¥100 million)
41.8
(¥100 million)
52.3
32.9
41.8
26.7
24.2
31.0
18.5
22.1
13.6
16.8
13.9
10.5
7.3
2.9
FY2018
7.4
3.9
FY2019
4.2
FY2020
FY2021
FY2022
FY2023
FY2024
FY2025
FY2026
(Guidance)
FY2018
FY2019
FY2020
FY2021
FY2022
FY2023
FY2024
FY2025
FY2026
(Guidance)
Copyright 2026 SRE Holdings Corporation
33
REF
Shareholder Information
Overview of Our Businesses
No.
Treasury
stock
0.8%
Individuals,
others
25.9%
Foreign
entities
14.6%
Financial
institutions
27.9%
Other
domestic
entities
24.7%
Securities
companies
6.0%
Shareholder
Number of
Shares
(thousand
shares)
Shareholding
Ratio (%)
1
Sony Group Corporation
3,748.6
23.06
2
Custody Bank of Japan, Ltd.
(Trust Account)
2,681.7
16.50
3
The Master Trust Bank of
Japan, Ltd. (Trust Account)
1,387.9
8.54
4
Individual Shareholder
384.5
2.36
5
Kazuo Nishiyama
353.8
2.17
6
JAPAN SECURITIES FINANCE
CO., LTD.
225.2
1.38
7
NORTHERN TRUST CO. (AVFC)
RE FIDELITY FUNDS
209.9
1.29
8
NOMURA INTERNATIONAL PLC
A/C JAPAN FLOW
196.3
1.20
9
MSIP CLIENT SECURITIES
181.3
1.11
10
Mitsubishi UFJ eSmart
Securities Co., Ltd.
181.2
1.11
- Based on the shareholder register as of March 2026; the figures are disclosed in the FY2026 Annual
Securities Report.
Copyright 2026 SRE Holdings Corporation
34
Disclaimer
The materials and information provided in this presentation
include so-called 'forward-looking statements.'
These are based on current expectations, forecasts, and
assumptions involving risks, and contain uncertainties that
could cause actual results to differ materially from these
statements.
Such risks and uncertainties include general domestic and
international economic conditions, such as general industry
and market conditions, interest rates, and currency
exchange fluctuations.
Even in the event of new information or future events, the
Company assumes no obligation to update or revise the
'forward-looking statements' contained in this presentation.
Copyright 2026 SRE Holdings Corporation
35