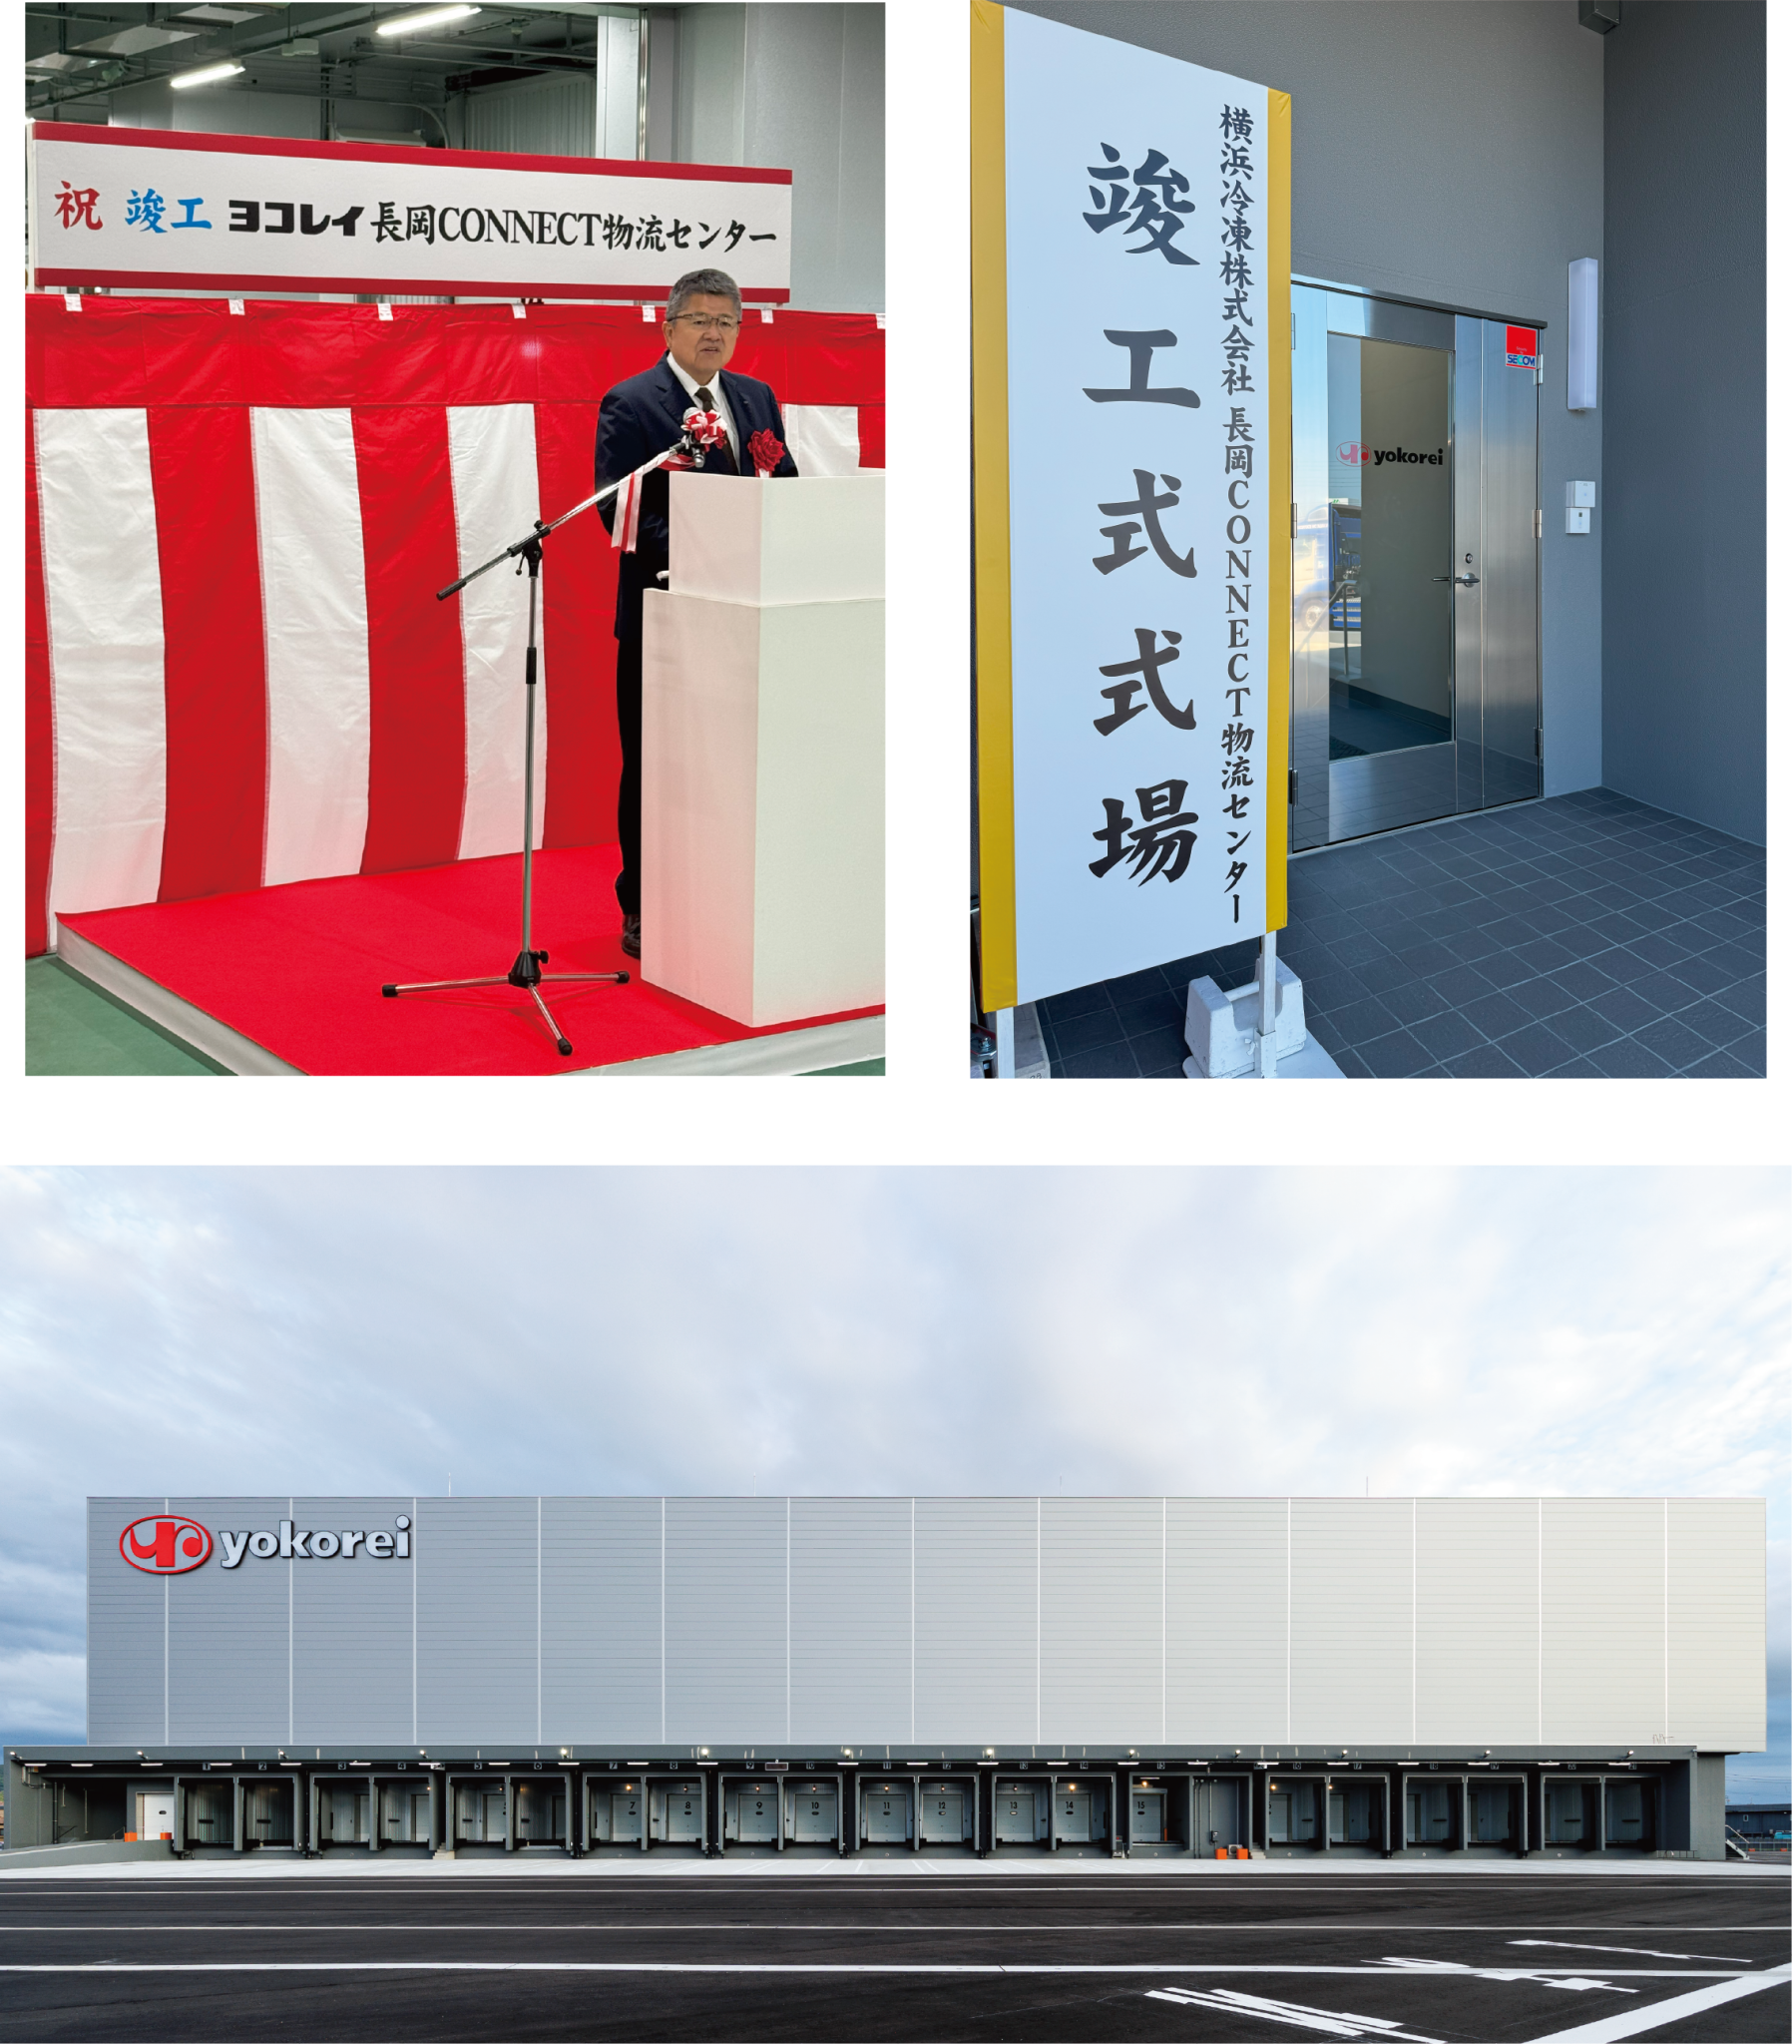
Consolidated Financial Results for the Nine Months Ended June 30, 2026 (Under Japanese GAAP) August 14, 2026 Company name YOKOREI Co.,Ltd Securities code 2874 Representative (Title) President and Representative Director Inquiries (Title) Director,…
Consolidated Financial Results for the Nine Months Ended June 30, 2026
(Under Japanese GAAP)
August 14, 2026
Company name YOKOREI Co.,Ltd
Securities code 2874
Representative (Title) President and Representative Director
Inquiries
(Title) Director, Public Relations and InvestorRelations
Dividend payable date (as planned) -
Supplemental material of results:None
Convening briefing of results :None
Stock exchange listings: Tokyo Prime
URL https://www.yokorei.co.jp
(Name) Kenji Furuse
(Name) Hiroshi Okada Tel 045-210-0011
(Yen amounts are rounded down to millions, unless otherwise noted.)
- Consolidated financial results for the nine months ended June 30, 2026 (from October 1, 2025 to June 30, 2026)
(1) Consolidated operating results (cumulative)
(Percentages indicate year-on-year changes.)
Profit attributable to
Net sales
Operating profit
Ordinary profit
owners of parent
Millions
Millions
Millions
Millions
Nine months ended
%
%
%
%
of yen
of yen
of yen
of yen
June 30, 2026
97,880
2.7
6,161
66.1
6,201
89.2
2,789
21.9
June 30, 2025
95,266
4.5
3,709
(8.3)
3,278
13.1
2,289
37.4
Note:Comprehensive income
For the nine months ended June 30, 2026 5,827Millions of yen(127.4%)
For the nine months ended June 30, 2025 2,562 Millions of yen((64.7)%)
Basic earnings per share Diluted earnings per share
Nine months ended
June 30, 2026
June 30, 2025
Yen
47.21
38.82
Yen
-
-
(2) Consolidated financial position
Total assets
Net assets
Capital adequacy ratio
As of
Millions of yen
Millions of yen
%
June 30, 2026
220,086
86,943
38.6
September 30, 2025
209,034
82,417
38.6
Reference:Owner's equity As of June 30, 2026
85,005 Millions of yen
As of September 30, 2025 80,718 Millions of yen
Net assets per share
Yen
1,437.15
1,368.24
- Cash dividends
First quarter
Second quarter
Yen
Yen
Annual dividend
Third quarter
Yen
Fiscal year ended
12.00
-
-
September 30, 2025
Fiscal year ending
13.00
-
-
September 30, 2026
Fiscal year ending
September 30, 2026
(Forecast)
Note:Revisions to the forecast of cash dividends most recently announced:None
-1-
Year end
Yen
Annual
Yen
12.00
24.00
14.00
27.00
- Consolidated financial forecast for the fiscal year ending September 30, 2026
(from October 1, 2025 to September 30, 2026)
(Percentages indicate year-on-year changes.)
Profit attributable Basic earnings
Net sales
Operating profit Ordinary profit
to owners of
per share
parent
Millions
Fiscal year ending
% Millions
% Millions
% Millions
%
Yen
of yen
of yen
of yen
of yen
September 30, 2026 125,000 (0.4)
7,000
65.2
6,400
74.9
6,300 218.4
106.62
Note:Revisions to the earnings forecasts most recently announced:Yes
- Notes
(1) Significant changes in the scope of consolidation during the period:None
Newly included: - companies (Company name) 、Excluded: - companies (Company name)
(2) Adoption of accounting treatment specific to the preparation of quarterly consolidated financial statements:
None
(3) Changes in accounting policies, changes in accounting estimates, and restatement
(i) Changes in accounting policies due to revisions to accounting standards and other regulations :None
(ii) Changes in accounting policies due to other reasons :None
(iii) Changes in accounting estimates :None
(iv) Restatement :None
(4) Number of issued shares (common shares)
① Number of issued and outstanding
As of June 30,
shares at the period end (including
2026
treasury stock)
As of June 30,
② Number of treasury stock at the
period end
2026
Nine months
③ Average number of shares
ended June 30,
(quarterly period-YTD)
2026
59,222,784
Shares
As of
September30,2025
59,266,684
shares
74,050
shares
As of
September 30, 2025
272,414
shares
59,087,128
shares
Nine months ended
June 30, 2025
58,957,685
shares
- Review of the Japanese-language originals of the attached consolidated quarterly financial statements by certified
public accountants or an audit firm:None
- Proper use of earnings forecasts, and other special matters
The forward-looking statements in this document are based on information currently available to the
Company and certain assumptions that the Company considers reasonable, and are not intended to be a
promise by the Company that they will be achieved. Actual results may differ significantly due to various
factors, including economic conditions surrounding the Yokorei Group, business environment, competition
with other companies, natural disasters, and interest rates. Regarding the use of earnings forecasts and the
assumptions underlying such forecasts, please refer to “Explanation regarding consolidated earnings forecasts
and other forward-looking information” of the attached materials.
-2-
- Overview of Consolidated Operating Performance
(1) Overview of Consolidated Operating Performance for the Nine Months Ended June 30, 2026
In the first nine months of the fiscal year ending September 30, 2026 (October 1, 2025 – June 30, 2026), Japan’s
economy maintained a moderate recovery trend, supported by improvements in the employment and income
environments. Meanwhile, the business environment for the food industry remained challenging due to soaring
raw material prices and growing consumer thriftiness amid price hikes.
In this environment, we have implemented various measures based on the new medium-term management
plan (Phase II), “The Power to Connect,” which has entered its final year. Our basic operating policies are to
“solve domestic and overseas issues through the high-quality logistics we have developed over the years and
provide smart cold services to customers” in the Refrigerated Warehousing Business, and to “deliver seasonal
appeal and deliciousness to customers by leveraging our network with domestic and overseas producers and our
expertise in product selection” in the Food Sales Business.
As a result, the Yokorei Group recorded consolidated net sales of ¥97,880 million, up 2.7% year on year, in
the first nine months of the fiscal year. Operating profit totaled ¥6,161 million, up 66.1% year on year, and
ordinary profit was ¥6,201 million, up 89.2% year on year. Profit attributable to owners of parent totaled ¥2,789
million, up 21.9% year on year.
Refrigerated Warehousing Business
The Refrigerated Warehousing Business posted higher sales and profit in the first nine months of the fiscal year,
continuing the trend from the first half, due mainly to increased handling volumes against a backdrop of strong
demand for refrigerated warehousing.
Although the business faced downward pressure on profits due to increases in depreciation expenses and
personnel costs—driven by logistics centers that commenced operations in the last two fiscal years—both
incoming and outgoing cargo volumes and inventory volumes for the entire business all exceeded those of the
previous fiscal year. This growth was driven mainly by an increase in handling volumes of frozen foods and
livestock products (chicken). In addition, progress in rate revisions also contributed to higher sales and profit.
At Thai Yokorei Co., Ltd., a consolidated subsidiary, handling volumes of fruit juice, in addition to its mainstay
livestock and dairy products, continued to expand from the first half of the fiscal year. Although incoming and
outgoing cargo volumes decreased slightly, storage fee income increased due to a higher occupancy rate, while
progress in rate revisions, as in Japan, also contributed to higher sales and profit.
As a result, overall segment sales came to ¥30,686 million, up 10.3% year on year, and operating profit was
¥6,928 million, up 18.6% year on year, marking record-high operating profit for the Refrigerated Warehousing
Business segment for the first nine months.
Food Sales Business
During the first nine months of the fiscal year, we continued our shift to a business structure focused on profit
margins by reviewing low-margin transactions and working to improve inventory turnover. Consequently,
although net sales were slightly below the same period of the previous fiscal year, the profit margin improved
significantly, resulting in lower sales but higher profit.
In marine products, mackerel catches in coastal waters off Kyushu remained strong, and freezing and
production at sorting spots progressed smoothly. Furthermore, firm demand for exports and processing materials
made a significant contribution to profit, resulting in lower sales but higher profit for marine products overall.
In livestock products, we continued to shift toward domestically produced pork, while in chicken, we focused
on expanding sales channels for by-products, thereby securing profit. Sales and sales volume of beef increased
as a result of proactive sales initiatives, while livestock products as a whole recorded lower sales but higher
profit.
Agricultural products as a whole recorded higher sales and profit as a result of setting appropriate selling
prices and strengthening sales efforts for mainstay potato products, despite the impact of poor harvests.
As a result, overall segment sales came to ¥67,170 million, down 0.4% year on year, and operating profit was
¥2,318 million, up 168.0% year on year, marking record-high operating profit for the Food Sales Business
segment for the first nine months.
-3-
(2) Overview of Financial Position for the Nine Months Ended June 30, 2026
Assets, Liabilities, and Net Assets
Total assets as of June 30, 2026, amounted to ¥220,086 million, an increase of ¥11,052 million from the previous
fiscal year-end (September 30, 2025). This was mainly due to increases of ¥9,158 million in property, plant and
equipment and ¥1,203 million in investment securities.
Total liabilities increased ¥6,526 million from the previous fiscal year-end to ¥133,143 million. This was
mainly due to increases of ¥3,621 million in other (accounts payable – facilities), ¥1,080 million in notes and
accounts payable – trade, and ¥958 million in income taxes payable.
Total net assets amounted to ¥86,943 million, an increase of ¥4,525 million from the previous fiscal year-end.
Cash Flows
Cash and cash equivalents (hereinafter, “cash”) at the end of the period amounted to ¥2,946 million, a decrease
of ¥321 million compared with the previous fiscal year-end (September 30, 2025). The main factors affecting
cash flows during the first nine months of the fiscal year are summarized as follows.
(Cash flows from operating activities)
Net cash provided by operating activities amounted to ¥12,242 million, compared with ¥3,647 million provided
in the same period of the previous fiscal year. The main factors included income before income taxes of ¥4,157
million, depreciation and amortization of ¥6,562 million, and impairment losses of ¥2,200 million.
(Cash flows from investing activities)
Net cash used in investing activities amounted to ¥10,439 million, compared with ¥10,091 million used in the
same period of the previous fiscal year. Cash outflows were mainly attributable to ¥12,736 million for the
purchase of property, plant and equipment.
(Cash flows from financing activities)
Net cash used in financing activities amounted to ¥2,188 million, compared with ¥6,929 million provided in the
same period of the previous fiscal year. The main factors were dividends paid of ¥1,477 million and a net
decrease in borrowings from financial institutions of ¥625 million.
(3) Consolidated Earnings Forecast
The Company has revised the consolidated earnings forecast for the fiscal year ending September 30, 2026 that
was announced in the “Announcement Regarding Differences Between the Second Quarter Earnings Forecast
and Actual Results for the Fiscal Year Ending September 2026, Revision to Full-Year Earnings Forecast, and
Revision to Dividend Forecasts for Interim and Year-End Dividends from Retained Earnings” dated May 15,
2026. For details, please refer to the “Announcement Regarding Revision to Full-Year Earnings Forecast for the
Fiscal Year Ending September 2026,” which was released on August 14, 2026.
-4-
- Consolidated Financial Statements
(1) Consolidated Balance Sheets
Assets
Current assets
Cash and deposits
Notes and accounts receivable – trade
Merchandise
Advance payments
Short-term loans receivable
Other
Allowance for doubtful accounts
Total current assets
Noncurrent assets
Property, plant and equipment
Buildings and structures, net
Machinery, equipment and vehicles, net
Land
Leased assets, net
Construction in progress
Other, net
Total property, plant and equipment
Intangible fixed assets
Investments and other assets
Investment securities
Long-term loans receivable
Long-term accounts receivable – other
Deferred tax assets
Retirement benefit asset
Other
Allowance for doubtful accounts
Total investments and other assets
Total non-current assets
Total assets
-5-
As of
September 30, 2025
Amount
(Millions of yen)
As of
June 30, 2026
Amount
3,659
13,318
14,461
381
1,031
1,416
(13)
34,253
3,373
14,217
14,453
496
675
1,511
(2)
34,726
75,103
12,261
31,251
388
3,565
989
123,559
3,174
70,699
12,051
31,651
353
17,016
945
132,718
3,163
43,256
4,296
6,609
2
434
987
(7,540)
48,046
174,780
209,034
44,460
4,614
7,185
2
463
896
(8,146)
49,478
185,360
220,086
Liabilities
Current liabilities
Notes and accounts payable – trade
Short-term loans payable
Current portion of long-term loans payable
Current portion of bonds payable
Lease obligations
Income taxes payable
Accrued employees’ bonuses
Accrued bonuses for directors and corporate auditors
Other
Total current liabilities
Noncurrent liabilities
Bonds
Long-term loans payable
Lease obligations
Deferred tax liabilities
Provision for Executive Compensation BIP Trust
Provision for loss on guarantees
Net defined benefit liability
Asset retirement obligations
Other
Total non-current liabilities
Total liabilities
Net assets
Shareholders’ equity
Common stock
Capital surplus
Retained earnings
Treasury stock
Total shareholders’ equity
Accumulated other comprehensive income
Unrealized gain on available-for-sale securities
Deferred gain (loss) on derivatives under hedge accounting
Foreign currency translation adjustments
Remeasurements of defined benefit plans
Total accumulated other comprehensive income
Non-controlling interests
Total net assets
Total liabilities and net assets
-6-
As of
September 30, 2025
Amount
(Millions of yen)
As of
June 30, 2026
Amount
4,882
13,591
5,541
10,000
106
256
724
47
4,664
39,814
5,963
13,269
5,481
10,000
102
1,214
227
36
9,351
45,647
10,000
68,897
315
999
95
4,466
164
623
1,239
86,801
126,616
10,000
68,971
279
1,384
4,871
138
634
1,215
87,495
133,143
14,303
14,427
41,917
(227)
70,420
14,303
14,442
43,228
(64)
71,909
8,597
13
891
794
10,297
1,699
82,417
209,034
10,756
49
1,540
749
13,095
1,937
86,943
220,086
(2) Consolidated Statements of Income and Comprehensive Income
(Consolidated Statements of Income)
Nine months ended
June 30, 2025
Amount
Net sales
Cost of sales
Gross profit
Selling, general and administrative expenses
Operating profit
Other income
Interest income
Dividend income
Insurance dividends
Foreign exchange gains
Reversal of allowance for doubtful accounts
Other
Total other income
Other expenses
Interest expense
Loss on valuation of derivatives
Foreign exchange losses
Other
Total other expenses
Ordinary income
Extraordinary income
Gain on sale of investment securities
Gain on receipt of contingent consideration
Total extraordinary income
Extraordinary losses
Impairment losses
Total extraordinary losses
Income before income taxes
Income taxes – current
Income taxes – deferred
Total income taxes
Profit
Profit attributable to non-controlling interests
Profit attributable to owners of the parent
-7-
(Millions of yen)
Nine months ended
June 30, 2026
95,266
84,474
10,792
7,083
3,709
Amount
97,880
84,754
13,125
6,964
6,161
328
308
29
20
375
1,061
336
258
31
546
9
405
1,587
642
130
595
123
1,492
3,278
730
360
456
1,547
6,201
350
283
633
156
156
3,911
1,359
235
1,594
2,317
28
2,289
*1 2,200
2,200
4,157
1,884
(599)
1,285
2,871
82
2,789
Consolidated Statements of Comprehensive Income
Profit
Other comprehensive income
Unrealized gain on available-for-sale securities
Deferred gain (loss) on derivatives under hedge accounting
Foreign currency translation adjustments
Remeasurements of defined benefit plans
Total other comprehensive income
Comprehensive income
Breakdown:
Comprehensive income attributable to owners of the parent
Comprehensive income attributable to non-controlling
interests
-8-
Nine months ended
June 30, 2025
Amount
2,317
(Millions of yen)
Nine months ended
June 30, 2026
Amount
2,871
229
215
(213)
13
244
2,562
2,158
35
805
(44)
2,955
5,827
2,520
5,587
41
239
(3) Consolidated Statements of Cash Flows
Cash flows from operating activities
Income before income taxes
Depreciation and amortization
Impairment losses
Increase (decrease) in accrued employees’ bonuses
Increase (decrease) in accrued bonuses for directors and
corporate auditors
Increase (decrease) in allowance for doubtful accounts
Increase (decrease) in provision for loss on guarantees
Increase (decrease) in net defined benefit liability
Increase (decrease) in provision for retirement benefits for
directors and corporate auditors
Interest and dividend income
Commission income
Interest expense
Loss (gain) on valuation of derivatives
Gain on receipt of contingent consideration
Loss (gain) on sale and retirement of non-current assets
Decrease (increase) in accounts receivable – trade
Loss (gain) on sales of investment securities
Decrease (increase) in inventories
Decrease (increase) in advance payments
Increase (decrease) in accounts payable – trade
Increase (decrease) in accrued expenses
Other
Subtotal
Interest and dividends received
Commission income received
Interest paid
Income taxes paid
Income taxes refund
Cash flows from operating activities
Cash flows from investing activities
Payments into time deposits
Proceeds from withdrawal of time deposits
Purchase of property, plant and equipment
Proceeds from sales of property, plant and equipment
Payments for retirement of property, plant and equipment
Purchase of intangible fixed assets
Purchase of investment securities
Proceeds from sales of investment securities
Proceeds from redemption of investment securities
Purchase of shares of unconsolidated subsidiaries
Proceeds from settlement of contingent consideration
Payments of loans receivable
Collection of loans receivable
Net decrease (increase) in investment and lending
Other
Cash flows from investing activities
Cash flows from financing activities
Net increase (decrease) in short-term loans payable
Proceeds from long-term loans payable
Repayments of long-term loans payable
Purchase of treasury stock
Dividends paid to shareholders
Redemption of bonds
Other
Cash flows from financing activities
Effect of exchange rate changes on cash and cash equivalents
Net increase (decrease) in cash and cash equivalents
Cash and cash equivalents, beginning of period
Net increase (decrease) in cash and cash equivalents resulting
from change in scope of consolidation
Cash and cash equivalents, end of period
-9-
Nine months ended
June 30, 2025
(Millions of yen)
Nine months ended
June 30, 2026
Amount
Amount
3,911
5,991
(440)
4,157
6,562
2,200
(496)
35
(10)
62
62
32
594
405
(66)
(250)
(636)
(0)
642
130
(283)
42
(2,139)
(350)
1,297
272
(589)
328
(256)
8,113
653
0
(471)
(4,649)
3,647
(595)
730
360
136
(860)
(156)
50
(115)
1,080
(146)
(197)
13,382
526
(643)
(1,243)
220
12,242
286
(10,952)
2
(17)
(209)
(704)
648
670
283
(192)
92
22
(21)
(10,091)
(416)
416
(12,736)
4
(112)
(97)
(2,415)
4,667
200
(312)
(180)
543
(11)
10
(10,439)
3,680
18,800
(4,041)
(0)
(1,421)
(10,000)
(89)
6,929
(53)
431
3,161
(604)
4,000
(4,020)
(0)
(1,477)
(85)
(2,188)
64
(321)
3,268
206
3,799
2,946
(4) Notes to the Consolidated Financial Statements
(Notes on the Going Concern Assumption)
Not applicable.
(Notes on Significant Changes in Shareholders’ Equity)
Not applicable.
(Notes on Consolidated Statements of Income)
*1. Impairment losses
Nine months ended June 30, 2026, (October 1, 2025 – June 30, 2026)
The asset groups for which impairment losses were recognized are as follows.
Location
2-40-1 Kawaguchicho,
Kesennuma-shi, Miyagi
Use
Type
Refrigerated warehousing
business
Buildings and structures
Machinery, equipment and
vehicles
Land
Other
Impairment losses
(Millions of yen)
2,200
The Group principally groups business assets by business site, while idle assets are grouped individually.
Due to a decline in profitability for the above asset groups during the first nine months of the fiscal year,
their carrying amounts were written down to their recoverable amounts, with the resulting decrease of
¥2,200 million recorded as an impairment loss.
The breakdown consists of ¥1,877 million for buildings and structures, ¥284 million for machinery,
equipment and vehicles, ¥34 million for land, and ¥3 million for other assets.
The recoverable amount is based on value in use, which is calculated using a new business plan.
Value in use is calculated based on future cash flows discounted at a rate of 5.91%.
(Notes on Segment Information)
Business segment information
I. Nine months ended June 30, 2025 (October 1, 2024 – June 30, 2025)
1 Net sales and profit/loss by reportable segment
(Millions of yen)
Reportable segment
Refrigerated
Warehousing
Business
Net sales
Sales to outside customers
Intersegment sales or transfers
Total
Segment profit
Notes:
27,809
1,836
29,646
5,840
Food Sales
Business
Other
67,433
67,433
865
Total
23
42
66
27
95,266
1,879
97,146
6,732
Adjustments
*1
Amounts
reported on
consolidated
statements of
income
*2
(1,879)
(1,879)
(3,023)
95,266
95,266
3,709
- The adjustment amount (-¥3,023 million) to segment profit is for company-wide expenses that are not allocated to
each reportable segment. Company-wide expenses are mainly general and administrative expenses that do not
belong to any reportable segment.
- Segment profit was adjusted based on operating income reported on the consolidated statements of income for the
corresponding period.
II. Nine months ended June 30, 2026 (October 1, 2025 – June 30, 2026)
1 Net sales and profit/loss by reportable segment
(Millions of yen)
Reportable segment
Refrigerated
Warehousing
Business
Net sales
Sales to outside customers
Intersegment sales or transfers
Total
Segment profit
Notes:
30,686
1,586
32,272
6,928
Food Sales
Business
67,170
67,170
2,318
Other
Total
23
53
76
36
97,880
1,639
99,519
9,282
Adjustments
*1
Amounts
reported on
consolidated
statements of
income
*2
(1,639)
(1,639)
(3,121)
97,880
97,880
6,161
- The adjustment amount (-¥3,121 million) to segment profit is for company-wide expenses that are not allocated to
each reportable segment. Company-wide expenses are mainly general and administrative expenses that do not
belong to any reportable segment.
- Segment profit was adjusted based on operating income reported on the consolidated statements of income for the
corresponding period.
(Significant Subsequent Events)
I. Establishment of trusts for non-current assets, transfer of trust beneficiary interests, and conclusion of
lease agreements
- Timing, purpose, and details of agreements
At a meeting of the Board of Directors held on July 23, 2026, the Company resolved to establish a
trust for the non-current assets owned by the Company, transfer the trust beneficiary interests, and
conclude lease agreements. Subsequently, on July 31 of the same year, the Company concluded the
trust agreements and lease agreements for the target assets specified in items (i) to (iii) of “3.” below.
Through the Transaction, the Company will improve asset efficiency and financial flexibility and
establish a framework that enables it to flexibly allocate funds to growth investments in response to
changes in the business environment.
- Names of the transferee of the trust beneficiary interests and the lease counterparties
(Name)
Godo Kaisha Octopus
(Location)
1-2-3 Kita-Aoyama, Minato-ku, Tokyo
(Title and name of representative) Representative Member: Octopus Ippan Shadan Hojin
Executive Officer: Hideki Nagasaka
- Names and other details of the applicable assets
Asset name and location
Asset overview
(i)
Tokyo Haneda Logistics Center
1-2-9 Keihinjima, Ota-ku, Tokyo
Land: 10,900.92 m2
(ii)
Kazo Logistics Center
3205-1 Koguki, Kazo-shi, Saitama
Land: 10,029.89 m2
Building: 18,464.08 m2
(iii)
Tsukuba Logistics Center
8-1 Midorinohigashi, Tsukuba-shi, Ibaraki
Land: 15,513.55 m2
Building: 20,694.80 m2
Current status
Building: 15,840.60 m2
Company logistics
facilities
Nagaoka CONNECT Logistics Center
Land: 21,290.64 m2
4-558-7 Inaho, Nagaoka-shi, Niigata
Building: 21,869.13 m2
Notes: 1. The Company established trusts with the subject assets as trust property and transferred the trust
beneficiary interests under those trusts.
2. Since the building area of the Nagaoka CONNECT Logistics Center is currently being calculated in
connection with property registration, the figures provided are tentative estimates based on current
plans and may differ from the actual measurements.
3. The trust agreement and lease agreement for the Nagaoka CONNECT Logistics Center are scheduled
to be concluded on October 1, 2026. In addition, the building is currently undergoing registration
procedures as of August 14, 2026. Since the execution of the trust agreement, the transfer of trust
beneficiary interests, and the commencement of the lease will take place after the completion of
registration and necessary transfer procedures, the conclusion dates may be subject to change depending
on the progress of such procedures.
(iv)
- Other important transactions
Although certain transactions related to the property are accounted for as financing transactions, this
does not preclude a true sale between the seller and the buyer.
II. Properties for which the transfer of trust beneficiary interests has been completed
- Timing of transfer completion, etc.
Regarding the agreements described in I. above, the transfer of trust beneficiary interests for the
three target assets—Tokyo Haneda Logistics Center, Kazo Logistics Center, and Tsukuba Logistics
Center—was completed on July 31, 2026.
The funds raised will be used for investments aimed at the Company’s sustainable business growth
going forward, including capital expenditures to appropriately address the continuing growth in
demand for refrigerated warehousing. Through these investments, we aim to simultaneously
strengthen our earnings base and improve capital efficiency, with the goal of further enhancing our
corporate value.
- Other important matters
Associated with this transaction, a gain on sale of non-current assets amounting to ¥6,004 million
will be recorded as extraordinary income in the fiscal year ending September 2026.